Article

Quality Control in Dental Cone-Beam Computed Tomography

1
School of Mechanical Engineering and Automation, Northeastern University, Shenyang 110819, China
2
Shenyang Metrology Testing Institution, Shenyang 110179, China
3
School of Medical Devices, Shenyang Pharmaceutical University, Shenyang 110016, China
*
Author to whom correspondence should be addressed.
Appl. Sci. 2021, 11(17), 8162; https://doi.org/10.3390/app11178162
Submission received: 4 August 2021 / Revised: 1 September 2021 / Accepted: 1 September 2021 / Published: 2 September 2021
(This article belongs to the Section Robotics and Automation)

Abstract

:
Poor medical equipment may lead to misdiagnosis and missed diagnosis by doctors, leading to medical accidents. Given the differences in imaging methods, the performance determination method for conventional computed tomography (CT) does not apply to dental cone-beam computed tomography (CBCT). Therefore, a detection method that is more suitable for the characteristics of dental CBCT and more convenient for on-site operation in hospitals needs to be urgently developed. Hence, this study aimed to design a robust and convenient detection method to control the quality of dental CBCT, grasp the safety information of the equipment in a timely and effective manner, discover and evaluate equipment risks, and take reasonable and necessary countermeasures, thereby, reducing the risk of medical malpractice. This study adopted dose-area product to measure dose parameters and used objective quantitative evaluation methods instead of subjective evaluation methods for spatial resolution, contrast-to-noise ratio index, and uniformity. The dental CBCT of 10 dental hospitals and clinics were tested, and the findings revealed that the testing methods used had good accuracy and applicability.

1. Introduction

Dental cone-beam computed tomography (CBCT) has been widely used in dental pulp diseases, periodontal diseases, pre-implant examination, temporomandibular joint structure examination, and orthodontic two-dimensional (2D) and three-dimensional (3D) measurement because of its high spatial resolution, low radiation dose, relatively small metal artifact interference, and simple equipment operation. Moreover, it has completely replaced the application of traditional medical computed tomography (CT) in these aspects and has become one of the important standard examinations and diagnostic means in stomatology. CBCT promotes the transition of dental diagnosis from 2D images to 3D images and truly expands the role of imaging from diagnosis to the image guidance of surgery. Many studies have shown that dental CBCT is significantly better than periapical radiography in terms of the accuracy, reliability, and sensitivity of dental pulpal and periapical diseases, periodontitis, external root resorption, root fracture, and other diseases in auxiliary diagnosis [1,2,3,4,5,6,7]. For example, Hassan et al. showed that the sensitivity and specificity of vertical root fractures diagnosed by periapical radiography were 37% and 95%, respectively, while the sensitivity and specificity diagnosed by CBCT were 79.4% and 92.5%, respectively [8]. Estrela et al. showed that the accuracy of CBCT for apical lesions was higher than that of periapical radiography [9]. Misch et al. showed that all periodontal bone defects and furcation involvement could be diagnosed by CBCT, and the missed diagnosis rate of periapical radiography for vertical bone defects and furcation involvement was as high as 31% and 42%, respectively [10]. While meeting basic clinical needs, dental CBCT also involves the use of a large number of application software packages: not only free software packages provided by CBCT manufacturers, such as Invivo, NNT, Sidexis XG, and so forth, but also many third-party commercial software packages, such as EasyGuide, Implant 3D, SimPlant, Med 3D, NobelClinician, and so forth. These software packages are especially used for implantation, orthodontics, oral surgery, and dental restoration, and can help surgeons realize a series of operations such as pre-surgical analysis and planning, orthognathic simulation, pre-implant surgery design and implant guide production, projection measurement analysis, and so forth. While improving the accuracy and success rate of the operation, they also reduce the additional damage to the patient’s soft and hard tissues.
The number of medical accidents caused by poor medical equipment are increasing with each passing year [11]. The effective improvement in medical safety and reduction in casualties and economic losses caused by medical accidents due to poor medical equipment are important tasks and the mission of metrology researchers worldwide. Dental CBCT images are mainly used to analyze and evaluate patients’ pathological process and, at the same time, estimate their subsequent disease development process, and then provide a reliable and scientific reference for clinical medical staff. If the CBCT image quality is inadequate, doctors are not provided with clear and effective 3D information about the tooth and maxillofacial structure, which may result in missed diagnosis or misdiagnosis. If the radiation dose of CBCT exceeds the standard requirement, the patient may be exposed to an excessive radiation dose. Therefore, a detection method more suitable for dental CBCT needs to be urgently developed.
The projection data of conventional CT are usually one-dimensional, and the reconstructed images are two-dimensional. A 3D image is reconstructed by stacking multiple 2D slices. Dental CBCT uses a flat-plate detector, which generates 2D projection data. The 3D image is directly reconstructed from the 2D images. Dental CBCT uses divergent X-rays to increase the utilization efficiency of X-rays dramatically. Complete, original 2D data can be acquired for 3D reconstruction simply with a 360-degree rotation. Another advantage of dental CBCT lies in its high isotropic spatial resolution [12,13]. CBCT has the advantages of a larger field of view (FOV), a low radiation dose, and a high spatial resolution. However, it also has the disadvantage of a relatively low contrast resolution, which means that it cannot display soft tissue structure similar to spiral CT, thereby limiting the further clinical application of dental CBCT. The important factors affecting low contrast resolution are noise and the signal-to-noise ratio. The important condition for reducing noise and improving the signal-to-noise ratio is to increase the efficiency of the detector and the X-ray dose. During dental CBCT imaging, a relatively large volume projection (head) is scanned by less radiation dose, especially when using a large FOV. The flat-panel detector receives a large amount of radiation scatter. Consequently, the noise in the dental CBCT image is greater than that of the spiral CT; that is, the signal-to-noise ratio is low. Therefore, the acceptable noise level in CBCT dedicated to dentistry devices is normally higher than that in conventional CT or other CBCT applications. The traditional CT image detection phantom (catphon600) and the pencil ionization chamber for dosimetry are no longer suitable for dental CBCT due to the difference in factors such as FOV, spatial resolution, and low contrast resolution. Therefore, a detection method more appropriate for the characteristics of oral CBCT and more convenient for on-site operation in hospitals should be urgently developed.
Relying on the ionization chamber and phantom to detect CBCT is considered to be an effective method and has been widely used in related fields [14,15,16,17,18]. Deutsches Institut für Normung proposed a CBCT acceptance test method [19]. Although it has made significant progress, the acceptance test method is too complicated for on-site detection, but it does have room for improvement. This study aimed to design a robust detection method to control the quality of dental CBCT currently in use in hospitals and to discover and evaluate equipment risks.
The organization of this manuscript is as follows: Section 2 introduces the parameters and methodology, including experimental setup, data collection, and calculation algorithms. The results and discussions of the experiment are presented in Section 3 and Section 4, respectively, which also contain a comparison of the performance of the proposed method with some similar published studies. Finally, the conclusions of the research are summarized in Section 5.

2. Parameters and Methods

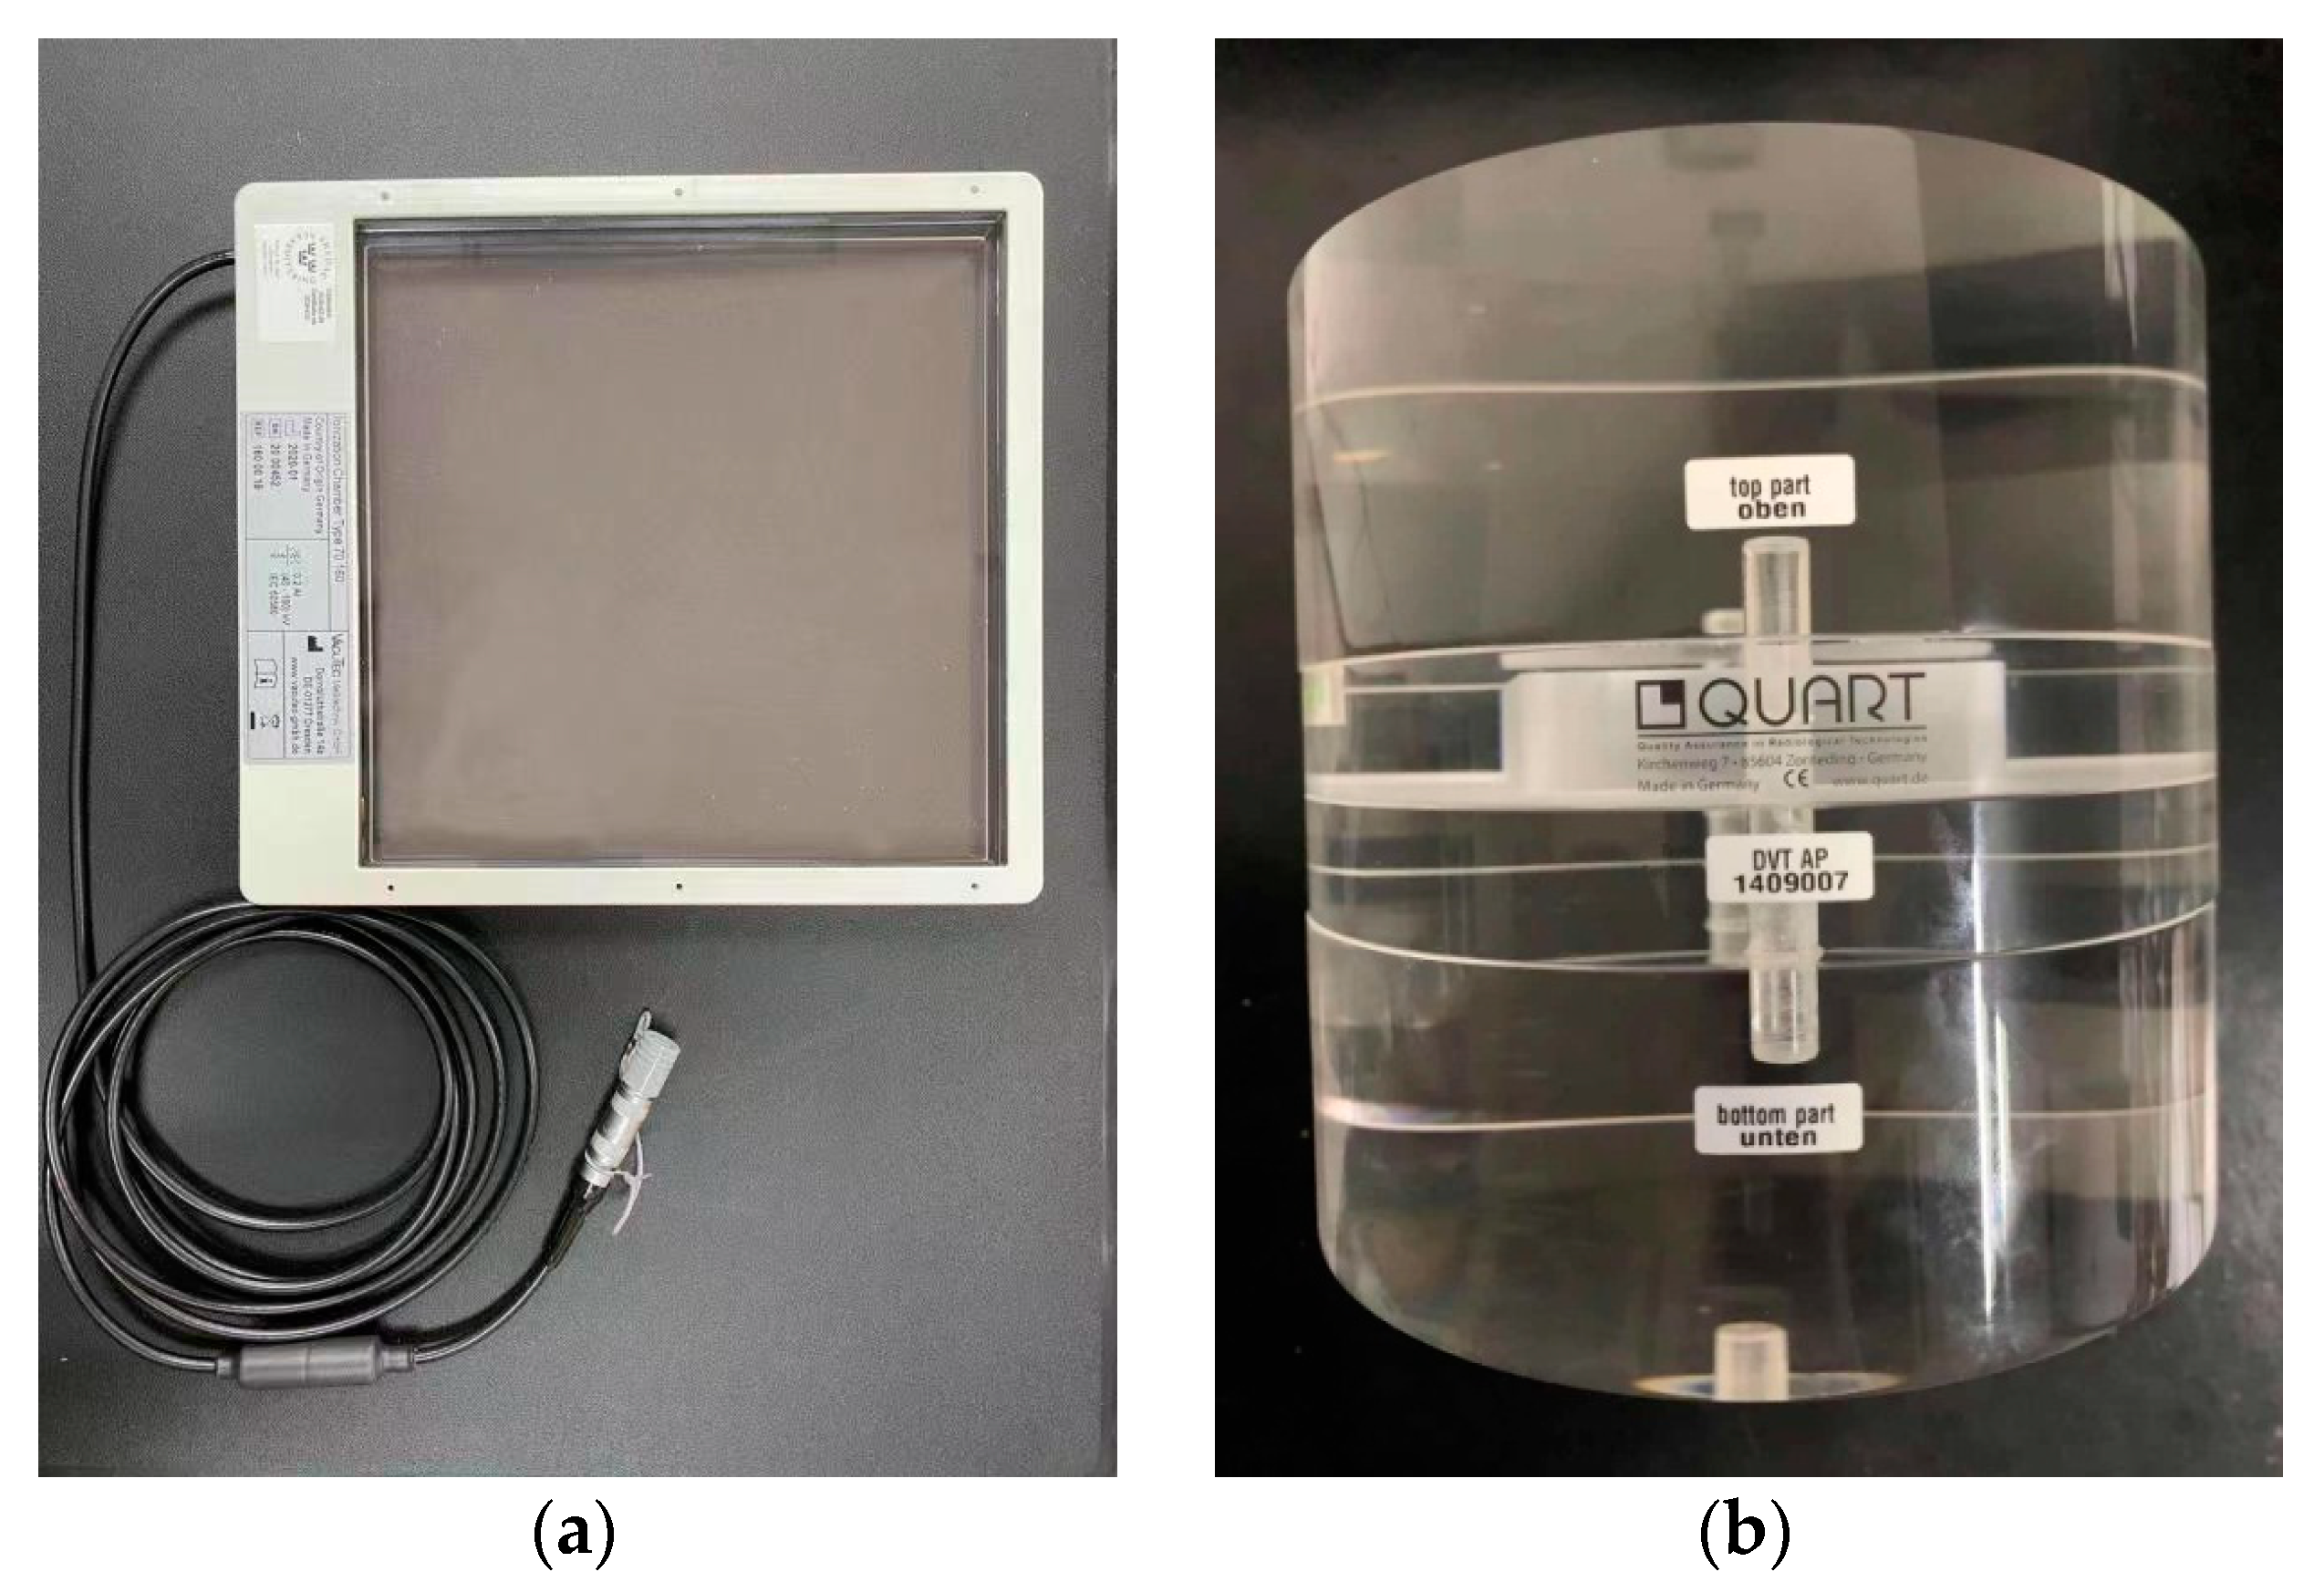
2.1. Experimental Setup

Several key parameters were chosen for performance evaluation of CBCT, namely, dose-area product (DAP) or kerma area product (KAP) [20], spatial resolution, contrast-to-noise ratio index (CNRI), and uniformity index [19,21]. KAP was measured using a KAP meter DOSEGUARD100 manufactured by VacuTec (Figure 1a). The image quality was defined by three parameters using the QUART DVT_AP phantom (Figure 1b), namely, spatial resolution, CNRI, and uniformity index. The details of the analysis and processing of the Digital Imaging and Communications in Medicine (DICOM) images were also described. The experiment was conducted by the same group of experimenters in 10 stomatological hospitals using qualified imaging machines.

2.2. KAP

A KAP meter can accommodate all collimation settings, and KAP measurement is insensitive to the variation of nominal collimation (visual field size) [22]. This is an important reason for the restricted use of computed tomography dose index (CTDI) for measurement. Additionally, when off-axis exposure and rotation of the X-ray tube are involved during imaging, the KAP measurement can still maintain good robustness.
The KAP meter DOSEGUARD100 was attached to the exit window of the CBCT unit in the center of the ionization chamber [21]. The scan was performed under routine conditions for adults. The scan region was kept free of any substances interfering with the beam. D K A P was calculated using Formula (1), and the results were corrected for temperature, atmospheric pressure, and calibration factor [23].
D K A P = M × N k × K T P
where D K A P is the dose-area product, mGy·cm2; M is the measurement displayed on the KAP meter, mGy·cm2; N k is the scale factor of the KAP meter; K T P is the value corrected for the temperature and atmospheric pressure of the ionization chamber type sensor, expressed as
K T P = ( 273.15 + t 293.15 ) × ( 101.3 p )
where t is the indoor temperature upon detection, °C; and p is the atmospheric pressure upon detection, kPa.
The D K A P thus obtained was normalized to the FOV 16 cm2 (i.e., the FOV 4 cm × 4 cm), expressed as
D = D K A P × 16 A
where D is the normalized KAP, mGy·cm2; and A is the area of the FOV, cm2.

2.3. Spatial Resolution

The spatial resolution was defined by the 10% point of the modulation transfer function (MTF) [24,25]. An advantage of MTF is that the detailed information at all spatial frequencies can be acquired, thus avoiding the influence of subjective factors, such as naked-eye observation. Additionally, more information can usually be obtained by this method than otherwise [26].
The DVT_AP phantom was placed at the center of the FOV, and scanning was performed under routine conditions for adults. The scan region was made free of any substances interfering with the beam. The region of interest (ROI) was delineated on the reconstructed axial slices for the phantom, as shown in Figure 2.
The four sides of this ROI should be parallel with the pixel rows (columns), and only the polyvinyl chloride (PVC) and the air were included. The edge of transition between the PVC and the air should be parallel with the upper and lower sides of the ROI. Then the phantom was repositioned, and the images were acquired repeatedly to optimize the parallelism of the edge. The width of the upper and lower sides of the ROI corresponded to the width of 5 mm in the phantom (the tolerance was one pixel). Each segment of the vertical side in PVC and the air should be at least 3 mm.
The spatial resolution was defined by the 10% point of MTF, as calculated using the following steps:
(1)
Data acquisition
The mean pixel values of all rows parallel with the edge and included in ROI were calculated ( M 1 , M 2 , M 3 , , M n ).
(2)
Finding the differential
The first-order differential was calculated by subtracting the mean pixel values in adjacent rows ( D 1 , D 2 , D 3 , , D n 1 ), as shown in Formula (4).
D m = M m + 1 M m
where D m is the first-order differential of the mean pixel value of the rows, and M m and M m + 1 are the mean pixel values of the m th and the ( m + 1 )th rows, respectively.
(3)
Setting the limits
The maximum value D k was chosen from D 1 , D 2 , D 3 , , and D n 1 . Starting from D k , the symmetric adjacent data band was redefined as D k l , D k l + 1 , , D k , , D k + l 1 , and D k + l .
(4)
Fourier transform
If the number of data D k l , D k l + 1 , , D k , , D k + l 1 , and D k + l obtained by step 3 was not the power of 2, then zero padding was performed. Next, discrete Fourier transform was applied to the sequence of values, with normalization of the Fourier coefficient to its maximum to obtain F 0 ¯ , F 1 ¯ , …, F m ¯ .
Similarly, discrete Fourier transform was applied to the arithmetically symmetric sequence | D k l + D k + l | / 2 , | D k l + 1 + D k + l 1 | / 2 , , | D k | , , | D k l + 1 + D k + l 1 | / 2 , and | D k l + D k + l | / 2 , with normalization to its maximum to obtain F ˜ 0 , F ˜ 1 , …, F ˜ m .
(5)
Averaging
The average F p = ( F ¯ + F ˜ p ) / 2 was allocated to its corresponding spatial frequency v p = p × v n / m , where p [ 0 , 1 , , m ] , and v n is the Nyquist frequency.
(6)
Plotting
( F p ; v p ) was plotted with v p on the x-axis and F p on the y-axis, and connected with a straight line. The 10% MTF point was found to define the spatial resolution.

2.4. Contrast-to-Noise Ratio Index (CNRI)

In medical imaging, the contrast-to-noise ratio (CNR) is defined as the absolute contrast divided by the background noise. The CNR can be used to differentiate between the signal values and the background values when the two are highly similar. The conventional method to evaluate the CNR is to detect weak signals from the noises. Different observers or even the same observer at different locations may give different evaluations for the same images. A quantitative evaluation method needs to be adopted to eliminate the subjective differences between the observers [27]. The variation in the mean pixel values in different rows was measured using the CNRI in this study.
The CNRI was calculated using the method recommended in the German standard DIN 6868-161 [19], as given by the following formula
C N I = | P m max P m min | 1 2 ( S m max 2 + S m min 2 )
where C N I is the CNRI; P m max is the mean pixel value of the m max th row; P m min is the mean pixel value of the m min th row; S m max is the standard deviation of the pixel value of the m max th row; S m min is the standard deviation of the pixel value of the m min th row.
A rectangular ROI was delineated on the axial view, as shown in Figure 2. The delineated ROI is shown in Figure 3. The four sides of this ROI should be parallel with the pixel rows (columns), and only the PVC and polymethyl methacrylate (PMMA) of the phantom were included. The edge of transition between the PVC and PMMA should be parallel with the upper and lower sides of the ROI. Then the phantom was repositioned, and the images were acquired repeatedly to optimize the parallelism of the edge. The width of the upper and lower sides of the ROI corresponded to the width of 10 mm in the phantom (the tolerance was one pixel). Each segment of the vertical side in PVC and PMMA should be at least 3 mm.
CNI was calculated using the following steps:
From the selected ROI, the mean pixel values of each row ( P 1 , P 2 , P 3 , , P n ) and the standard deviations ( S 1 , S 2 , S 3 , , S n ) were read. The moving average was used to calculate the first-order differential P 5 , P 6 , , P n 4 , expressed as
P m = 1 5 ( P m + 4 + P m + 3 + P m + 2 + P m + 1 + P m ) 1 4 ( P m 4 + P m 3 + P m 2 + P m 1 )
The second-order differential was calculated using Formula (7) for P m to obtain P 6 , P 7 , , P n 6 .
P m = P m + 1 P m
The rows m max and m min , where the extreme points P m max and P m min for P m were located, were substituted into Formula (5) to calculate CNI.

2.5. Uniformity Index

The uniformity index [28] is a measure of the imaging ability of the CBCT machine for homogeneous materials. The associated mean pixel value is independent of the pixel location. None of the geometric features over the cross-sections of the detected object should be distorted on the medical images. Thus, a need for imaging uniformity is raised for homogeneous materials.
A phantom filled with equivalent tissues and measuring 16 cm in diameter was placed at the center of FOV. The phantom was then scanned under routine conditions for adults. The scan region was made free of any substances interfering with the beam. Five ROIs were selected from the scanned image. One of them was located at the center, while the remaining four were located at an equal distance from the center. The area of each ROI was about 2%–3% of the scanned image, as illustrated in Figure 4. The uniformity index was calculated using the method recommended in DIN 6868-161 [19], as shown in Formula (8).
H = | P m max P m min | M a x { | H z H M | , | H o H M | , | H l H M | , | H r H M | , | H u H M | }
where P m max is the maximum mean pixel value calculated using Formula (5); P m min is the minimum mean pixel value calculated using Formula (5); H z is the mean pixel value at the center; H o is the mean pixel value in the upper region; H l is the mean pixel value in the left region; H r is the mean pixel value in the right region; H u is the mean pixel value in the lower region; H M is the average of H z , H o , H l , H r , and H u .

3. Results

Unlike conventional CT, CBCT emits an open conical radiation beam to scan the object [29,30]. The KAP meterwas chosen to evaluate the CBCT performance. The determination results of KAP are shown in Table 1. The experimental results of the image metric parameters are presented in Table 2. Objective quantitative methods were applied to evaluate CBCT images instead of subjective evaluation methods. The purpose was to achieve higher standardization and precision.
The KAP, spatial resolution, CNRI, and uniformity index calculated by our method should satisfy the following requirements (not up to the action level) when used as performance metrics of CBCT:
(1)
The KAP normalized to the FOV 16 cm2 (the FOV was 4 cm × 4 cm) should not be larger than 250 mGy·cm2.
(2)
The spatial resolution defined by the 10% point of MTF should not be lower than 1 Lp/mm.
(3)
CNRI should be less than 20%.
(4)
The uniformity index should be larger than five.
The action level refers to the limit specified in the quality control of dental CBCT; if the indicator exceeds the limit, corrective action must be taken. The experimental data showed that the image quality control methods proposed in this study were applicable to all CBCT units. The dosimetry proposed in this study was applicable to most units, except for the unit with automatic exposure control, because the new method did not use attenuation phantom. This equipment with automatic exposure control is rarely used in hospitals at present.

4. Discussions

The traditional method of evaluating image quality is based on human observation. Besides the reasons mentioned in the Introduction section for the traditional methods being unsuitable for dental CBCT, another drawback is that they are highly subjective. Different observers, and even the same observer on different occasions, can give different results when they are presented with the same signals. Additionally, the results can be biased and difficult to reproduce.
In this study, objective measures of quantitative image quality evaluation were used for image quality control of dental CBCT, such as CNR and MTF. These objective measures are reproducible, they are not dependent on the observer, and they can be conveniently assessed using computer software. Therefore, we used these measures to replace the evaluation and measurements based on contrast-detail objects and bar patterns, which have been in use for quality control for more than 20 years [31,32,33].
The traditional dosimetry leads to three kinds of problems: (1) the formalisms use phantoms that are too small to properly represent radiation scatter from the large X-ray fields commonly used in CBCT applications. (2) The positioning of the phantom can be problematic, in particular for dental CBCT [23]. (3) The pencil ionization chamber is not long enough, and the efficiency is low due to the large FOV. The KAP meter we used did not have these problems. It was directly attached to the z-ray outlet, covering almost all collimations.
These new methods were carefully examined and discussed at the annual meeting of the China Ionizing Radiation Metrology Technical Committee and passed the review of experts. This study also had certain shortcomings. We did not find enough unqualified dental CBCT equipment to conduct a control experiment. We aim to complete this task in the next step to verify the feasibility of these methods further.

5. Conclusions

This study analyzed the background of dental CBCT detection and proposed solutions to existing problems. The applicability of these methods was proved by evaluating qualified imaging machines in 10 dental hospitals and clinics in different regions of China. The determination results on all equipment satisfied the requirements, except for the KAP parameter that was not applicable to the NewTom VG equipped with automatic exposure control.
The experimental results indicated that the proposed method accorded with the application situation of dental CBCT and satisfied the need for measurement traceability. The research findings provided technical supports for relevant determination efforts. Moreover, a national verification regulation of dental CBCT was formulated based on the proposed methods, which has been approved by the authorities. The release of this verification regulation can promote the innovation and development of dental CBCT detection methods in China. We will further verify the reliability of this method and whether it can be applied to different CBCT applications (radiotherapy, interventional radiology, and guided surgery).

Author Contributions

J.-F.H. conceived the methodology and developed the algorithm. X.-Z.C. designed and performed the experiment. J.-F.H. and X.-Z.C. analyzed the data and wrote the manuscript. H.W. finished editing and proofreading. All authors have read and agreed to the published version of the manuscript.

Funding

This research was funded by the Innovative team project of colleges and universities in Liaoning Province (LT2014006) and Shenyang Pharmaceutical University Young and middle-aged teachers’ career development support plan (ZQN2019019).

Conflicts of Interest

The authors declare no conflict of interest. The founding sponsors had no role in the design of the study; in the collection, analyzes, or interpretation of data; in the writing of the manuscript, and in the decision to publish the results.

References

  1. Abella, F.; Patel, S.; Durán-Sindreu, F.; Mercade, M.; Bueno, R.; Roig, M. An evaluation of the periapical status of teeth with necrotic pulps using periapical radiography and cone-beam computed tomography. Int. Endod. J. 2013, 47, 387–396. [Google Scholar] [CrossRef]
  2. Giudice, R.L.; Nicita, F.; Puleio, F.; Alibrandi, A.; Pantaleo, G. Accuracy of Periapical Radiography and CBCT in Endodontic Evaluation. Int. J. Dent. 2018, 2, 1–7. [Google Scholar] [CrossRef] [PubMed] [Green Version]
  3. Bornstein, M.M.; Lauber, R.; Sendi, P.; Von Arx, T. Comparison of Periapical Radiography and Limited Cone-Beam Computed Tomography in Mandibular Molars for Analysis of Anatomical Landmarks before Apical Surgery. J. Endod. 2011, 37, 151–157. [Google Scholar] [CrossRef]
  4. De Paula-Silva, F.W.G.; Wu, M.K.; Leonardo, M.R.; da Silva, L.A.B.; Wesselink, P.R. Accuracy of periapical radiography and cone-beam computed tomography scans in diagnosing apical periodontitis using histopathological findings as a gold standard. J. Endod. 2009, 35, 1009–1012. [Google Scholar] [CrossRef] [PubMed]
  5. Balasundaram, A.; Shah, P.; Hoen, M.M.; Wheater, M.A.; Bringas, J.S.; Gartner, A.; Geist, J.R. Comparison of Cone-Beam Computed Tomography and Periapical Radiography in Predicting Treatment Decision for Periapical Lesions: A Clinical Study. Int. J. Dent. 2012, 2012, 920815. [Google Scholar] [CrossRef] [PubMed] [Green Version]
  6. Moura, M.S.; Guedes, O.A.; De Alencar, A.H.G.; Azevedo, B.C.; Estrela, C. Influence of Length of Root Canal Obturation on Apical Periodontitis Detected by Periapical Radiography and Cone Beam Computed Tomography. J. Endod. 2009, 35, 805–809. [Google Scholar] [CrossRef] [PubMed]
  7. Naitoh, M.; Yamada, S.; Noguchi, T.; Ariji, E.; Nagao, J.; Mori, K.; Kitasaka, T.; Suenaga, Y. Three-dimensional display with quantitative analysis in alveolar bone resorption using cone-beam computerized tomography for dental use: A preliminary study. Int. J. Periodontics Restor. Dent. 2006, 26, 607–612. [Google Scholar]
  8. Hassan, B.; Metska, M.E.; Ozok, A.R.; van der Stelt, P.; Wesselink, P.R. Detection of Vertical Root Fractures in Endodontically Treated Teeth by a Cone Beam Computed Tomography Scan. J. Endod. 2009, 35, 719–722. [Google Scholar] [CrossRef] [PubMed]
  9. Estrela, C.; Bueno, M.R.; Leles, C.R.; Azevedo, B.; Azevedo, J.R. Accuracy of Cone Beam Computed Tomography and Panoramic and Periapical Radiography for Detection of Apical Periodontitis. J. Endod. 2008, 34, 273–279. [Google Scholar] [CrossRef]
  10. Misch, K.A.; Yi, E.S.; Sarment, D.P. Accuracy of Cone Beam Computed Tomography for Periodontal Defect Measurements. J. Periodontol. 2006, 77, 1261–1266. [Google Scholar] [CrossRef]
  11. Amoore, J. Quality improvement report: Learning from adverse incidents involving medical devices. BMJ 2002, 325, 272–275. [Google Scholar] [CrossRef]
  12. Mozzo, P.; Procacci, C.; Tacconi, A.; Martini, P.T.; Andreis, I.A.B. A new volumetric CT machine for dental imaging based on the cone-beam technique: Preliminary results. Eur. Radiol. 1998, 8, 1558–1564. [Google Scholar] [CrossRef] [PubMed]
  13. Arai, Y.; Tammisalo, E.; Iwai, K.; Hashimoto, K.; Shinoda, K. Development of a compact computed tomographic apparatus for dental use. Dentomaxillofac. Radiol. 1999, 28, 245–248. [Google Scholar] [CrossRef]
  14. Pauwels, R.; Stamatakis, H.; Manousaridis, G.; Walker, A.; Michielsen, K.; Bosmans, H.; Bogaerts, R.; Jacobs, R.; Horner, K.; Tsiklakis, K.; et al. Development and applicability of a quality control phantom for dental cone-beam CT. J. Appl. Clin. Med. Phys. 2011, 12, 3478. [Google Scholar] [CrossRef] [PubMed]
  15. Pauwels, R. CBCT Quality Assurance. In Maxillofacial Cone Beam Computed Tomography; Springer: Berlin/Heidelberg, Germany, 2017; pp. 213–226. [Google Scholar]
  16. SEDENTEXCT. Radiation Protection: Cone Beam CT for Dental and Maxillofacial Radiology, Evidence Based Guidelines 2011 (v2.0 Final). 2011. Available online: http://www.sedentexct.eu/files/guidelines_final.pdf (accessed on 31 August 2021).
  17. Du, L.Y.; Umoh, J.; Nikolov, H.N.; Pollmann, S.I.; Lee, T.-Y.; Holdsworth, D.W. A quality assurance phantom for the performance evaluation of volumetric micro-CT systems. Phys. Med. Biol. 2007, 52, 7087–7108. [Google Scholar] [CrossRef]
  18. Daly, M.J.; Siewerdsen, J.H.; Moseley, D.J.; Jaffray, D.A.; Irish, J.C. Intraoperative cone-beam CT for guidance of head and neck surgery: Assessment of dose and image quality using a C-arm prototype. Med. Phys. 2006, 33, 3767–3780. [Google Scholar] [CrossRef]
  19. Deutsches Institut für Normung (DIN). Sicherung der Bildqualität in Röntgendiagnostischen Betrieben—Teil 161: Abnahmeprüfung nach RöV an Zahnmedizinischen Röntgeneinrichtungen zur Digitalen Volumentomographie; Rep. No. 6868-161; DIN: Berlin, Germany, 2013. [Google Scholar]
  20. Gala, H.D.L.H.; Torresin, A.; Dasu, A.; Rampado, O.; Delis, H.; Girón, I.H.; Theodorakou, C.; Andersson, J.; Holroyd, J.; Nilsson, M.; et al. Quality control in cone-beam computed tomography (CBCT) EFOMP-ESTRO-IAEA protocol (summary report). Phys. Med. 2017, 39, 67–72. [Google Scholar] [CrossRef] [PubMed] [Green Version]
  21. International Electrotechnical Commission (IEC). Evaluation and Routine Testing in Medical Imaging Departments—Part 3–5: Acceptance Tests—Imaging Performance of Computed Tomography X-Ray Equipment; IEC Report No. 61223-3-5; IEC: Geneva, Switzerland, 2004. [Google Scholar]
  22. Larsson, J.P.; Persliden, J.; Sandborg, M.; Carlsson, G.A. Transmission ionization chambers for measurements of air collision kerma integrated over beam area. Factors limiting the accuracy of calibration. Phys. Med. Biol. 1996, 41, 2381–2398. [Google Scholar] [CrossRef] [PubMed]
  23. International Atomic Energy Agency. Dosimetry in Diagnostic Radiology: An International Code of Practice; Technical Reports Series No. 457; IAEA: Vienna, Austria, 2007. [Google Scholar]
  24. Judy, P.F. The line spread function and modulation transfer function of a computed tomographic scanner. Med. Phys. 1976, 3, 233–236. [Google Scholar] [CrossRef]
  25. Maidment Andrew, D.A.; Albert, M. Conditioning data for calculation of the modulation transfer function. Med. Phys. 2003, 30, 2. [Google Scholar] [CrossRef] [PubMed]
  26. Rossmann, K. Point spread-function, line spread-function, and modulation transfer function. Tools for the study of imaging systems. Radiology 1969, 93, 257–272. [Google Scholar] [CrossRef] [PubMed]
  27. Thilander-Klang, A.; Ledenius, K.; Hansson, J.; Sund, P.; Båth, M. Evaluation of subjective assessment of the low-contrast visibility in constancy control of computed tomography. Radiat. Prot. Dosim. 2010, 139, 449–454. [Google Scholar] [CrossRef] [PubMed]
  28. Steiding, C.; Kolditz, D.; Kalender, W.A. A quality assurance framework for the fully automated and objective evaluation of image quality in cone-beam computed tomography. Med. Phys. 2014, 41, 031901. [Google Scholar] [CrossRef] [PubMed]
  29. Dixon, R.; Anderson, J.; Bakalyar, D.; Boedeker, K.; Boone, J.; Cody, D.; Fahrig, R.; Jaffray, D.; Kyprianou, I.; McCollough, C.; et al. Comprehensive Methodology for the Evaluation of Radiation Dose in X-Ray Computed Tomography. In Comprehensive Methodology for the Evaluation of Radiation Dose in X-ray Computed Tomography; American Association of Physicists in Medicine (AAPM): Alexandria, VA, USA, 2010. [Google Scholar]
  30. International Atomic Energy Agency (IAEA). Status of Computed Tomography Dosimetry for Wide Cone Beam Scanners; Rep. No. 5; IAEA: Vienna, Austria, 2011. [Google Scholar]
  31. Droege, R.T.; Morin, R.L. A practical method to measure the MTF of CT scanners. Med. Phys. 1982, 9, 758–760. [Google Scholar] [CrossRef] [PubMed]
  32. Lin, P.-J.P.; Beck, T.J.; Borras, C.; Cohen, G.; Jucius, R.A.; Kriz, R.J.; Nickoloff, E.L.; Rothenberg, L.N.; Strauss, K.J.; Villafana, T. AAPM Task Group Report No 39: Specification and Acceptance Testing of Computed Tomography Scanners; American Association of Physicists in Medicine: New York, NY, USA, 1993. [Google Scholar]
  33. Chiarot, C.B.; Siewerdsen, J.H.; Haycocks, T.; Moseley, D.J.; Jaffray, D.A. An innovative phantom for quantitative and qualitative investigation of advanced x-ray imaging technologies. Phys. Med. Biol. 2005, 50, N287–N297. [Google Scholar] [CrossRef] [PubMed]
Figure 1. (a) VacuTec KAP meter and (b) QUART DVT_AP phantom.
Applsci 11 08162 g001
Figure 2. An example of locating and delineating the ROI for determining the modulation transfer behavior.
Applsci 11 08162 g002
Figure 3. An example of locating and delineating the ROI for the CNRI.
Applsci 11 08162 g003
Figure 4. Delineation of the region of interest.
Applsci 11 08162 g004
Table 1. Determination results of KAP.
No.SiteManufacturerModelSettingsMeasurements/mGy·cm2
kVmAs
1Shenyang Shenhe Dental ClinicKavoKavo3Dexam12030.8954.9
2Stomatological Hospital, Jilin UniversityCarestreamCS93009056.5105.3
3Heilongjiang Oral Disease Prevention and Treatment InstituteKavoKavo3Dexam12037.0777.4
4Shanghai Xinhua HospitalKavoKavo3Dexam12030.8965.5
5Shanghai Huashan HospitalKavoKavo3Dexam11030.578.9
6Beijing Jinsong Dental ClinicSironaGalileos852139.6
7Nanjing Stomatological HospitalKavoKavo3Dexam12036.0775.3
8Jiangsu Provincial Stomatological HospitalKavoKavo3Dexam12036.1275.5
9Shenyang Stomatological HospitalKavoKavo3Dexam12030.7654.6
10China Medical University School&Hospital of StomatologyNewtomNewTom VGAutomaticExposure Control/Not applicable
Action levelKAP larger than 250 mGy·cm2
Table 2. Experimental results of the image metric parameters.
No.SiteManufacturerModelSpatial Resolution/(Lp/mm)Uniformity IndexCNI
/(%)
1Shenyang Shenhe Dental ClinicKavoKavo3Dexam1.52236.718
2China Medical University School&Hospital of StomatologyNewtomNewTom VG1.21365.432
3Stomatological Hospital, Jilin UniversityCarestreamCS93001.49257.015
4Heilongjiang Oral Disease Prevention and Treatment InstituteKavoKavo3Dexam1.62246.892
5Shanghai Xinhua HospitalKavoKavo3Dexam1.57266.810
6Shanghai Huashan HospitalKavoKavo3Dexam1.61236.975
7Beijing Jinsong Dental ClinicSironaGalileos1.34195.331
8Nanjing Stomatological HospitalKavoKavo3Dexam1.53217.112
9Jiangsu Provincial Stomatological HospitalKavoKavo3Dexam1.56236.962
10Shenyang Stomatological HospitalKavoKavo3Dexam1.52276.773
Action level<1≤5≥20
Publisher’s Note: MDPI stays neutral with regard to jurisdictional claims in published maps and institutional affiliations.

