
Calculation of the Population of Construction Scaffoldings Using Neural Networks


Abstract
:Featured Application
Abstract
1. Introduction
- Safety during work when erecting, maintaining, repairing or demolishing buildings and other structures;
- Easy access to elements and parts of construction objects located in hard-to-reach places—e.g., at heights;
- Support for the elements of a structure being erected during their construction; and
- Adequate vertical communication (e.g., temporary staircases) and horizontal communication (e.g., temporary footbridges).
- Results of empirical research, which involved the counting of the number of scaffoldings in the selected representative areas; and
- Statistical data on socio-economic indicators in the analyzed regions.
2. Materials and Methods
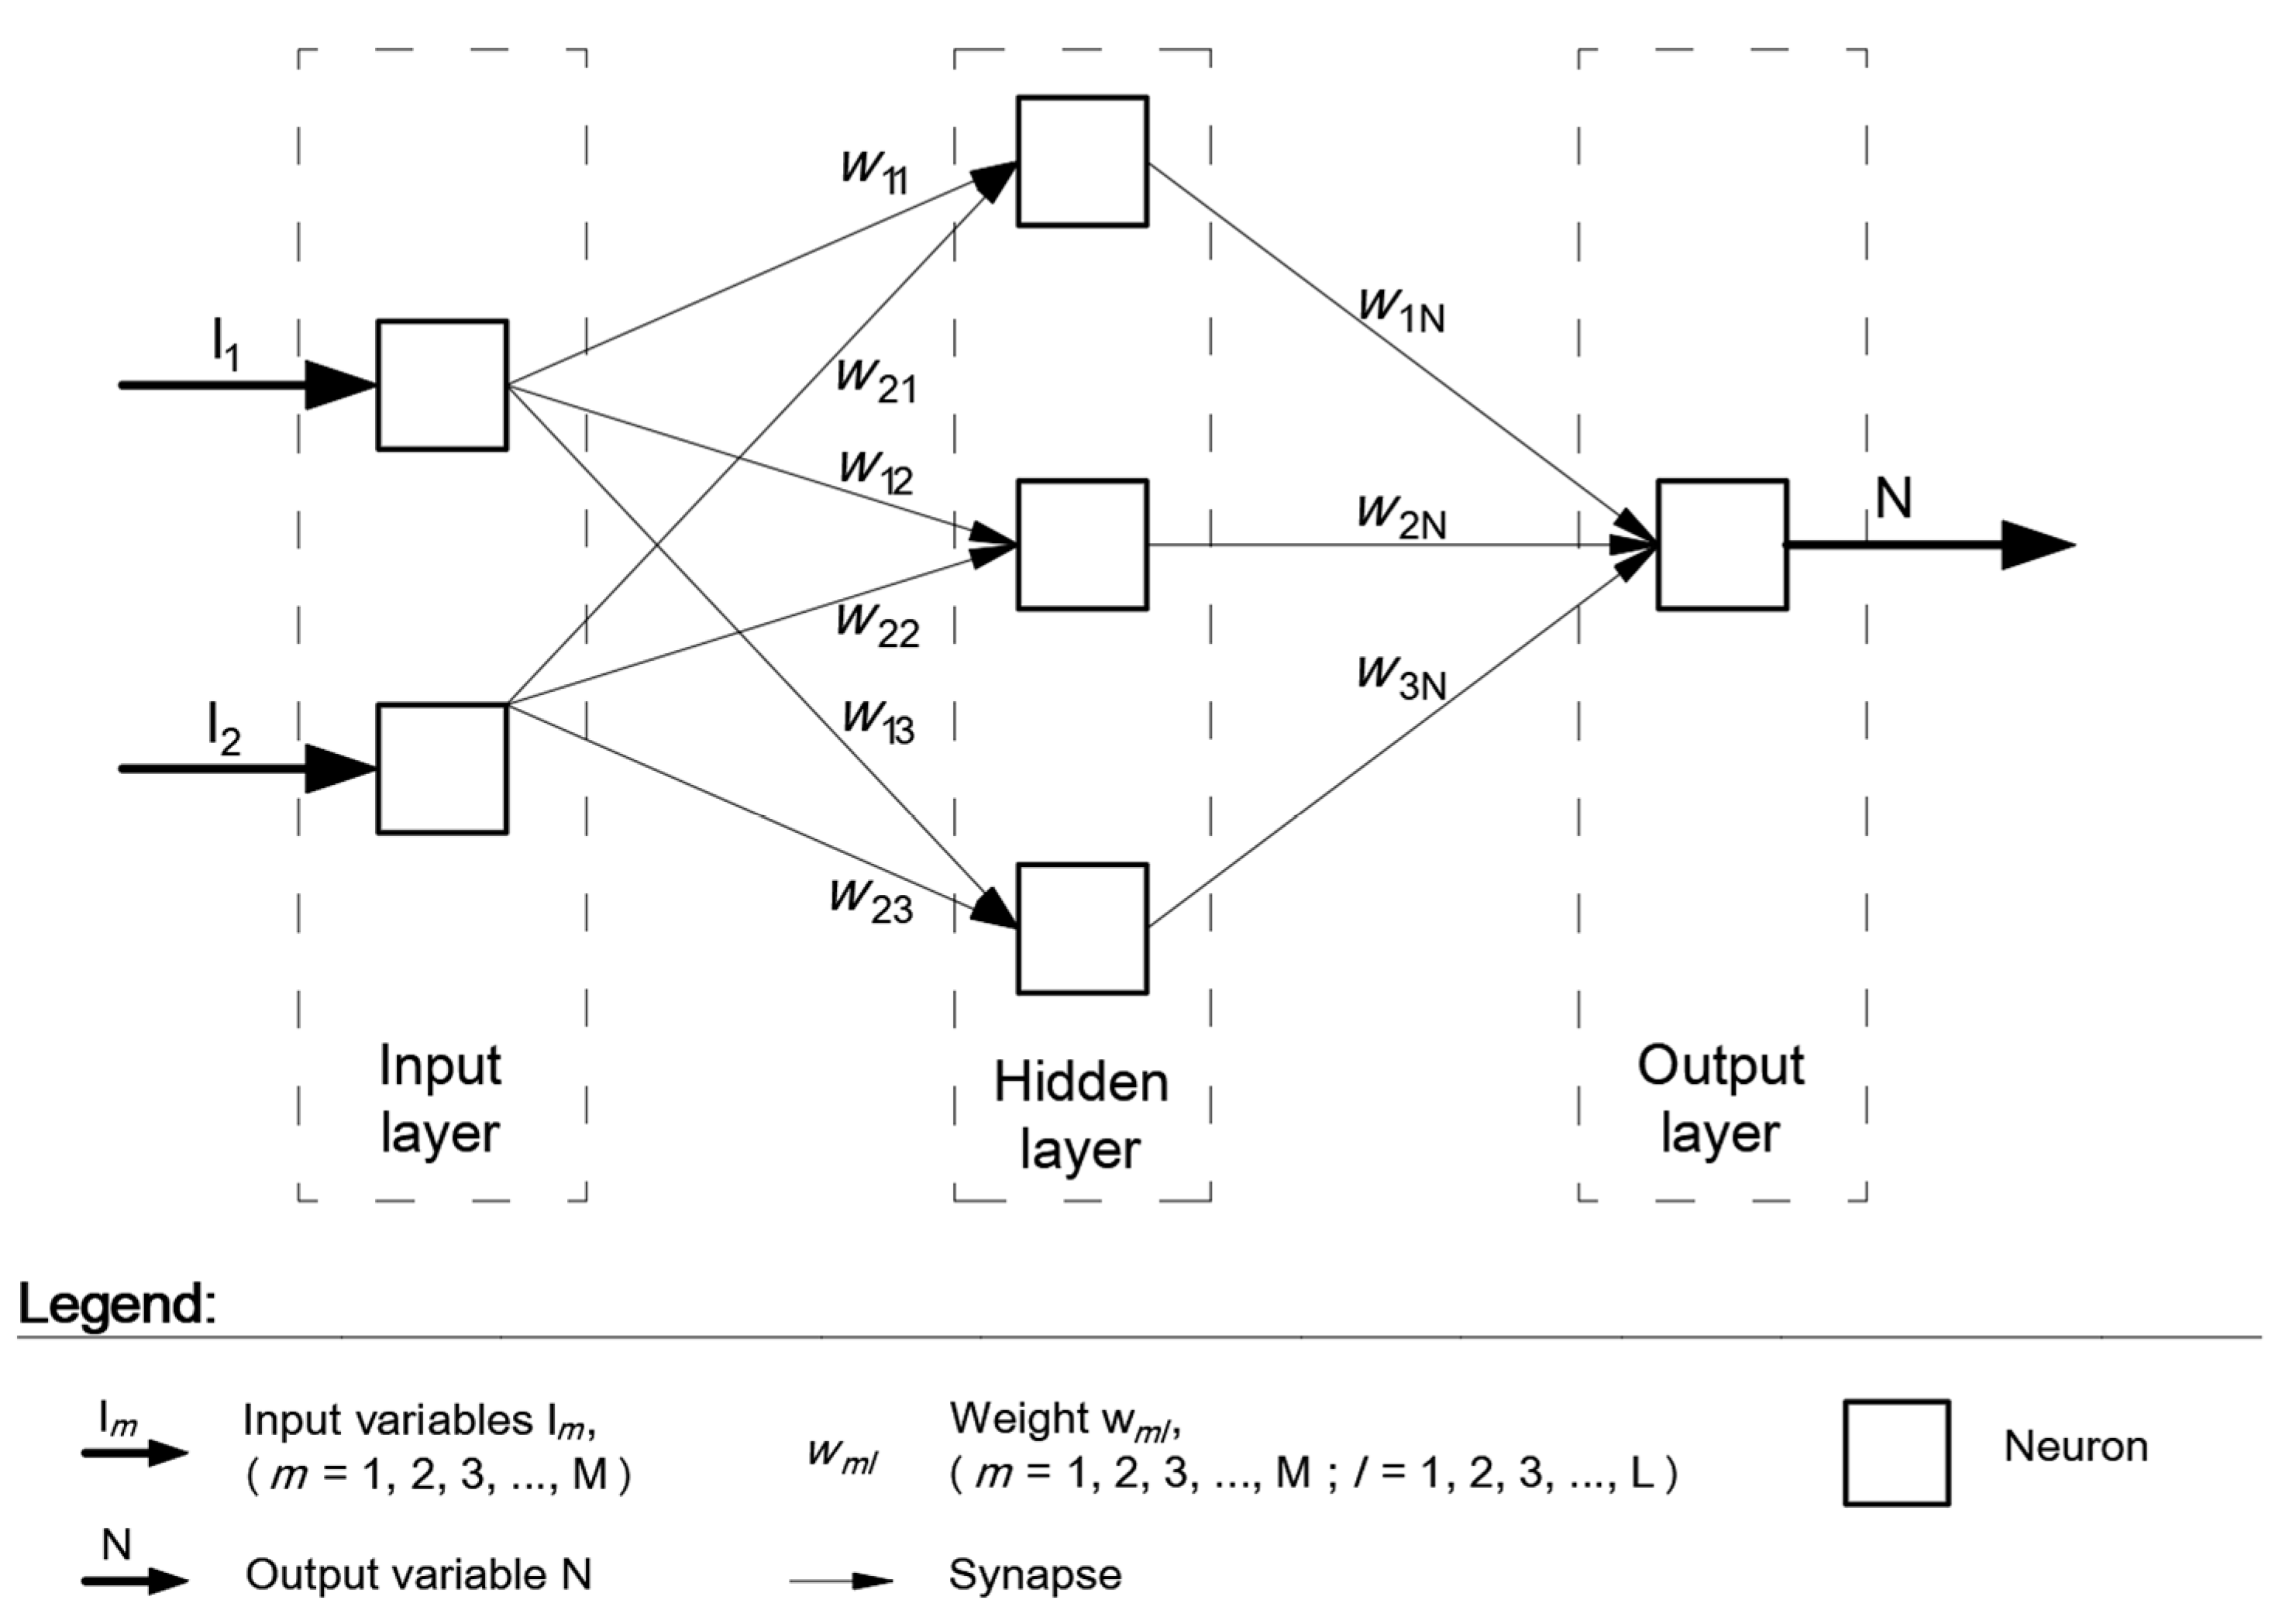
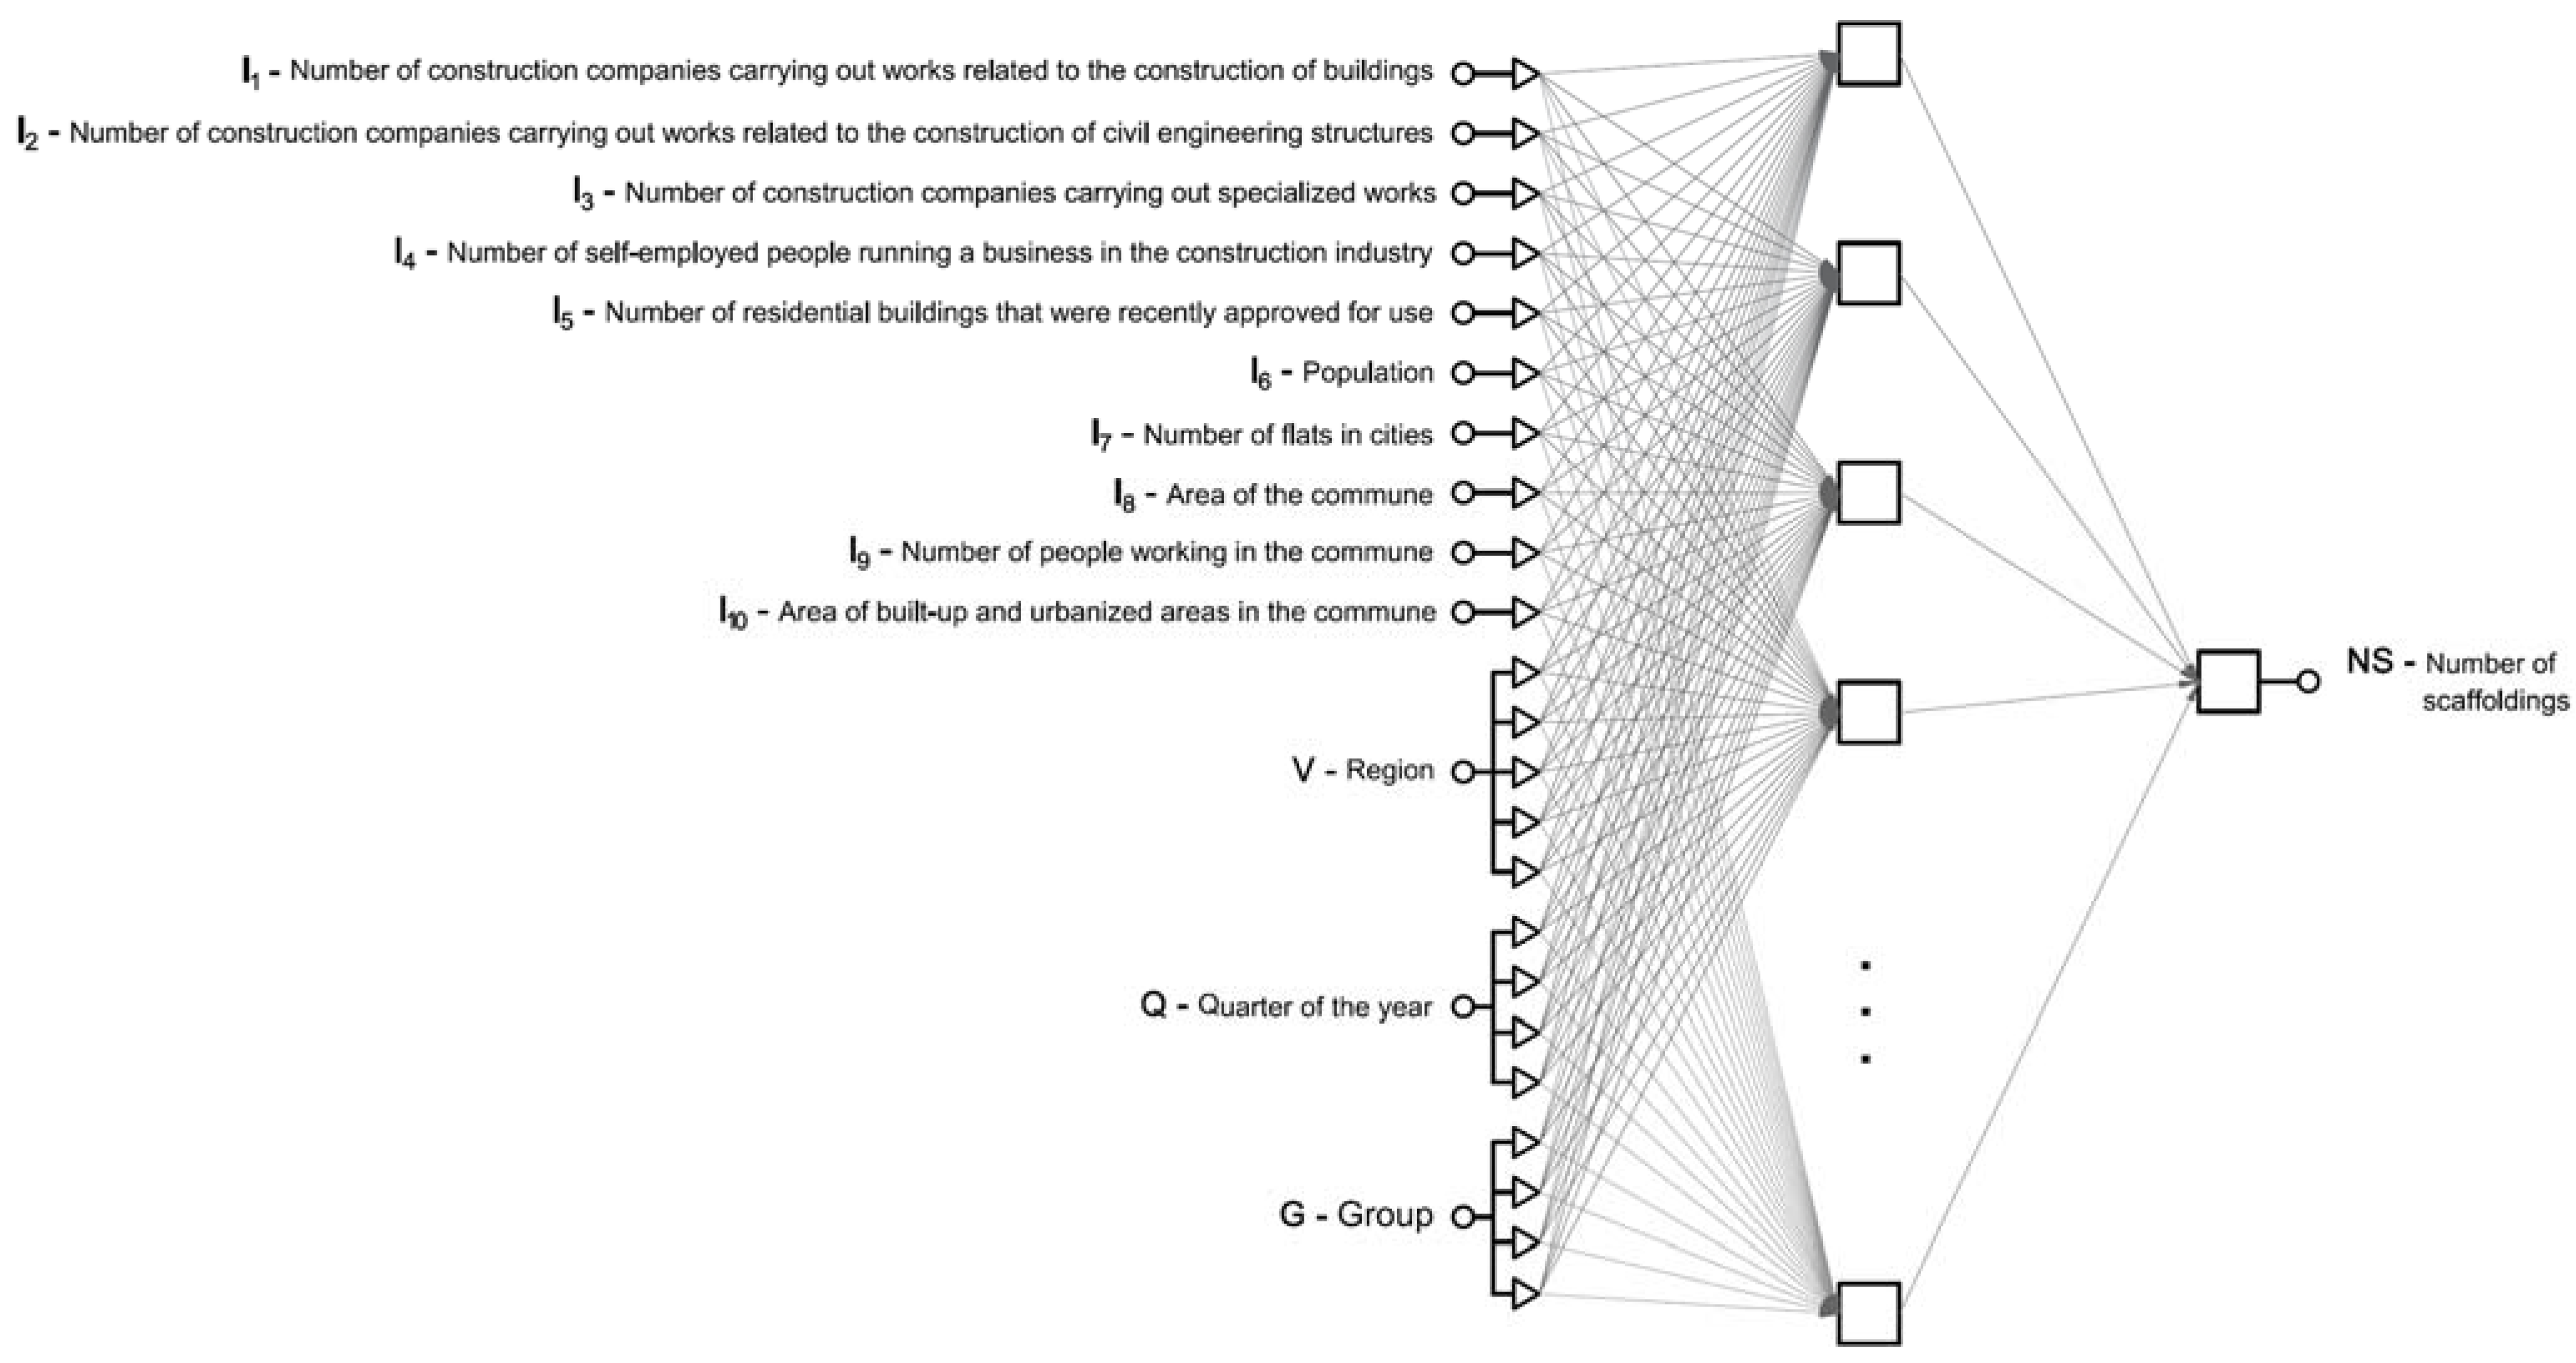
2.1. Neural Networks—Multilayer Perceptron (MLP)
- Input layer—responsible for the introduction of the values of variables to the network ();
- Hidden layer—responsible for the processing of information; and
- Output layer—responsible for determining the output value of network (result).
- Training set—usually contains 70% of all the observations that are used to properly develop a neural network model, i.e., “active” learning of the network [27];
- Test set—usually contains 15% of all the observations that are used to verify the developed network model;
- Validation set—most often contains 15% of all the observations and is used to detect the risk of network overlearning, i.e., excessive adaptation of the network to the training set.
2.2. The Scope of Research
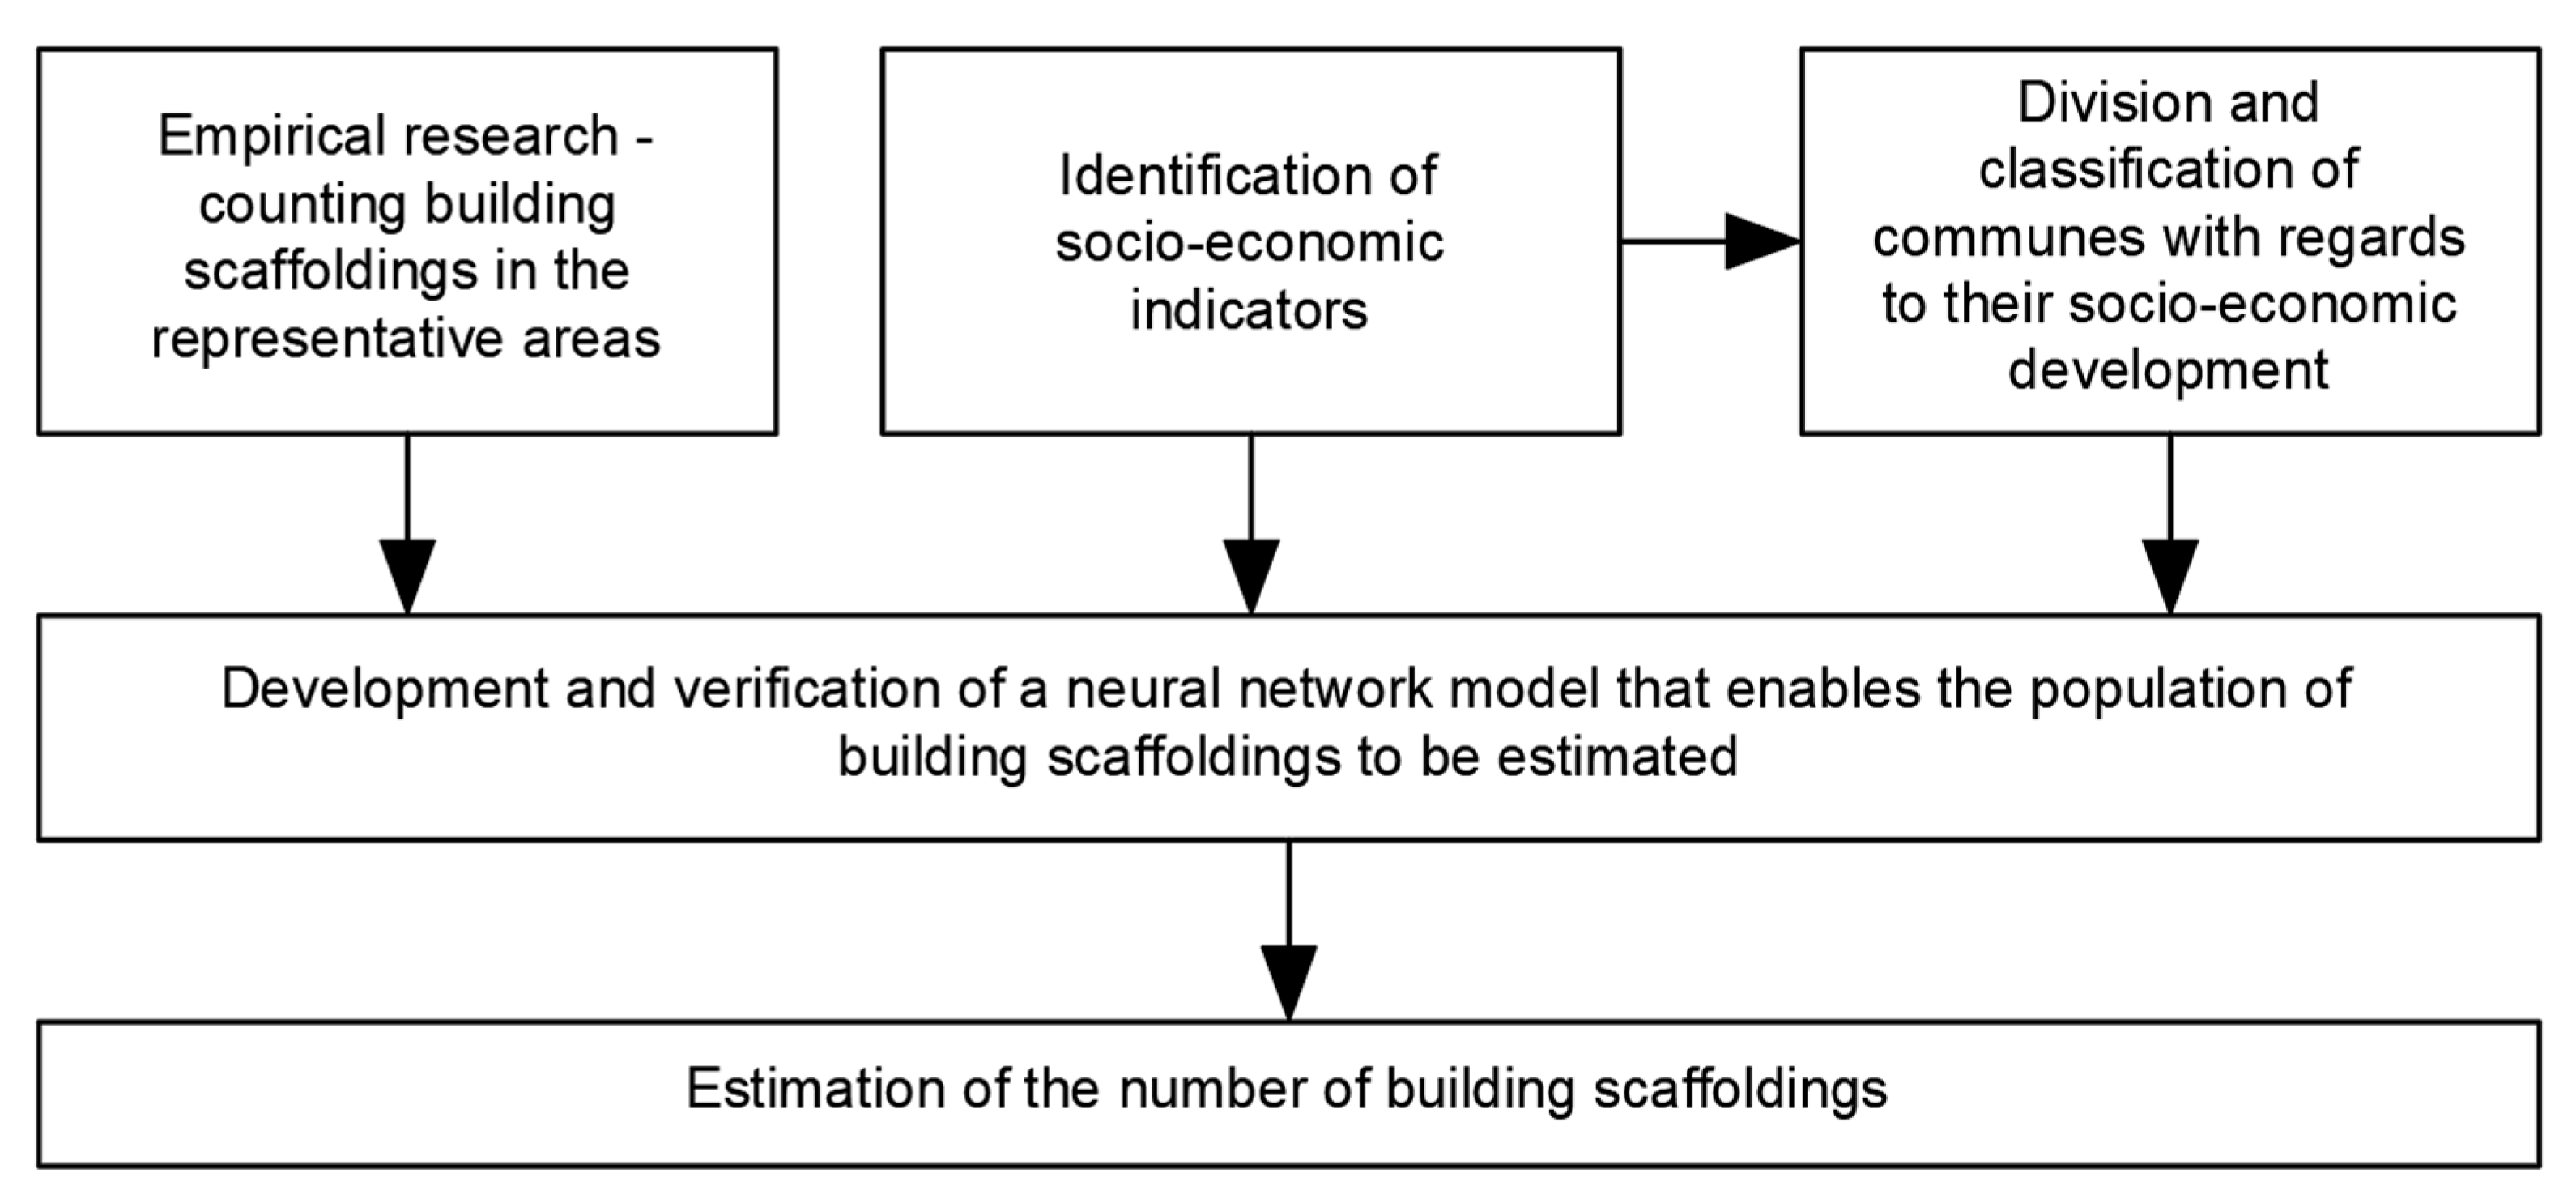
2.3. Research Methodology
- Empirical determination of the number of building scaffoldings in use in representative areas of regions ;
- Identification of socio-economic indicators ;
- Classification of the analyzed communes with regards to their socio-economic development; and
- Development of a neural network model.
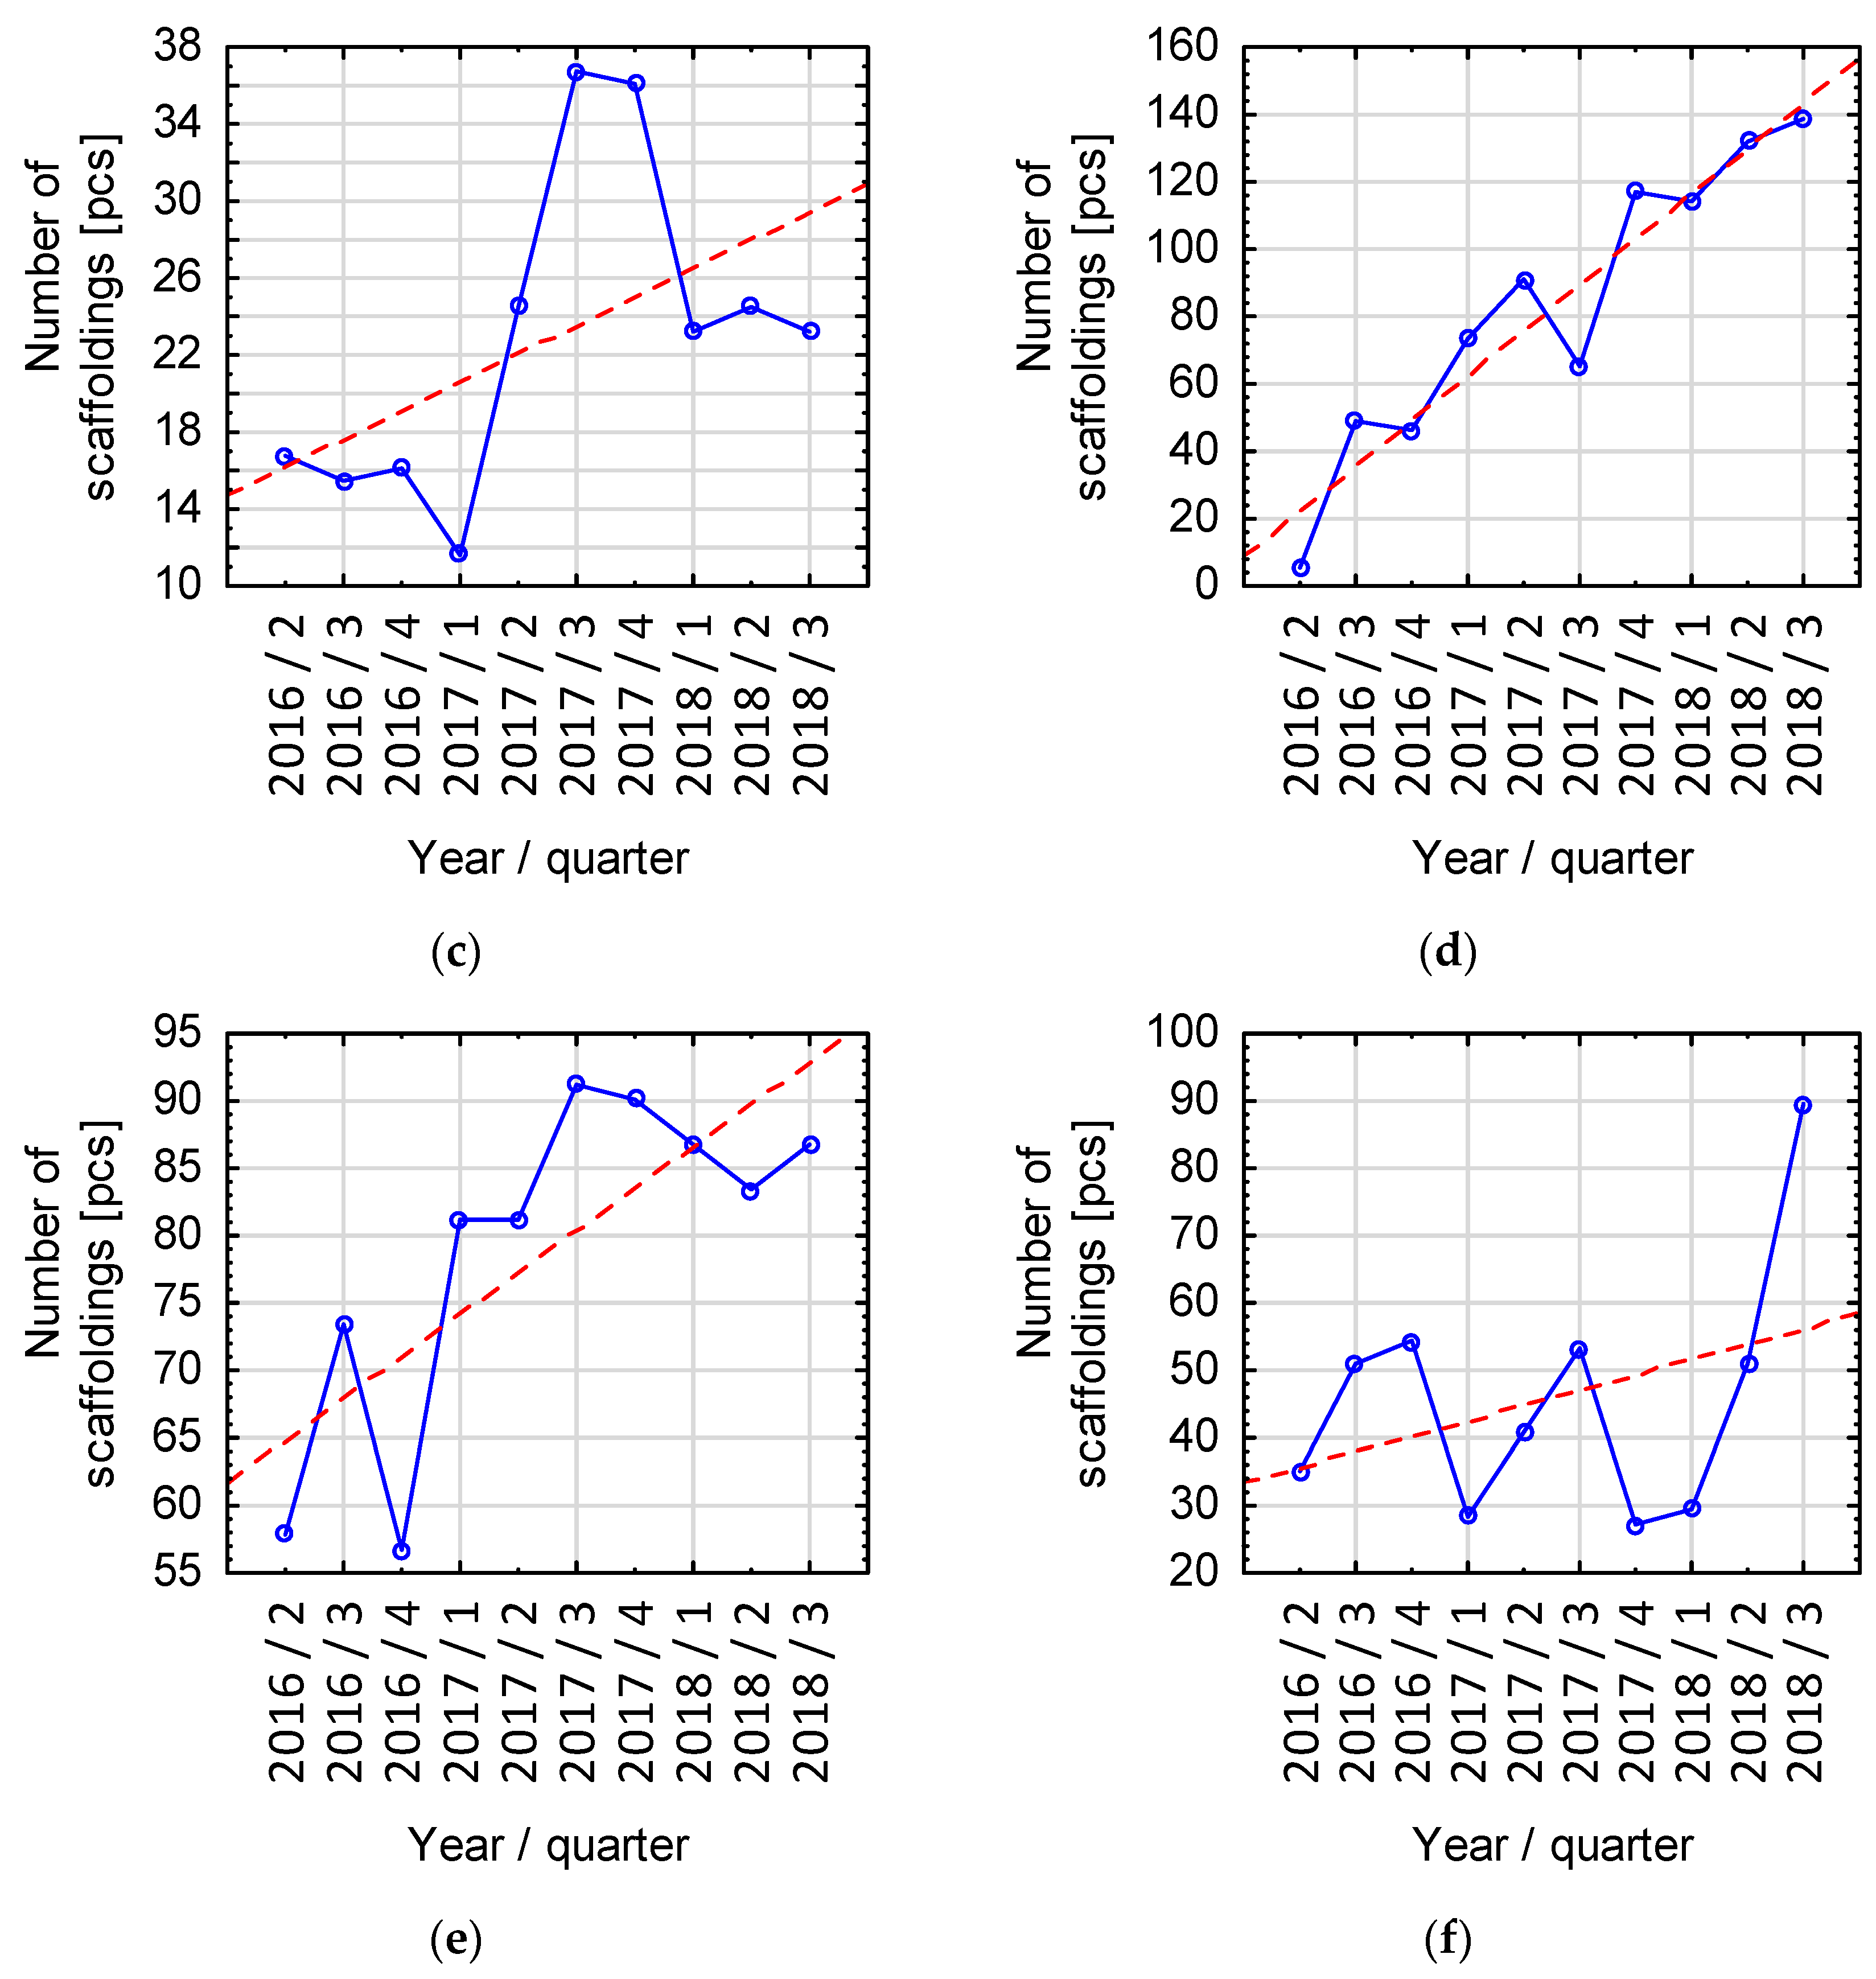
2.3.1. Empirical Determination of the Number of Scaffoldings in Use
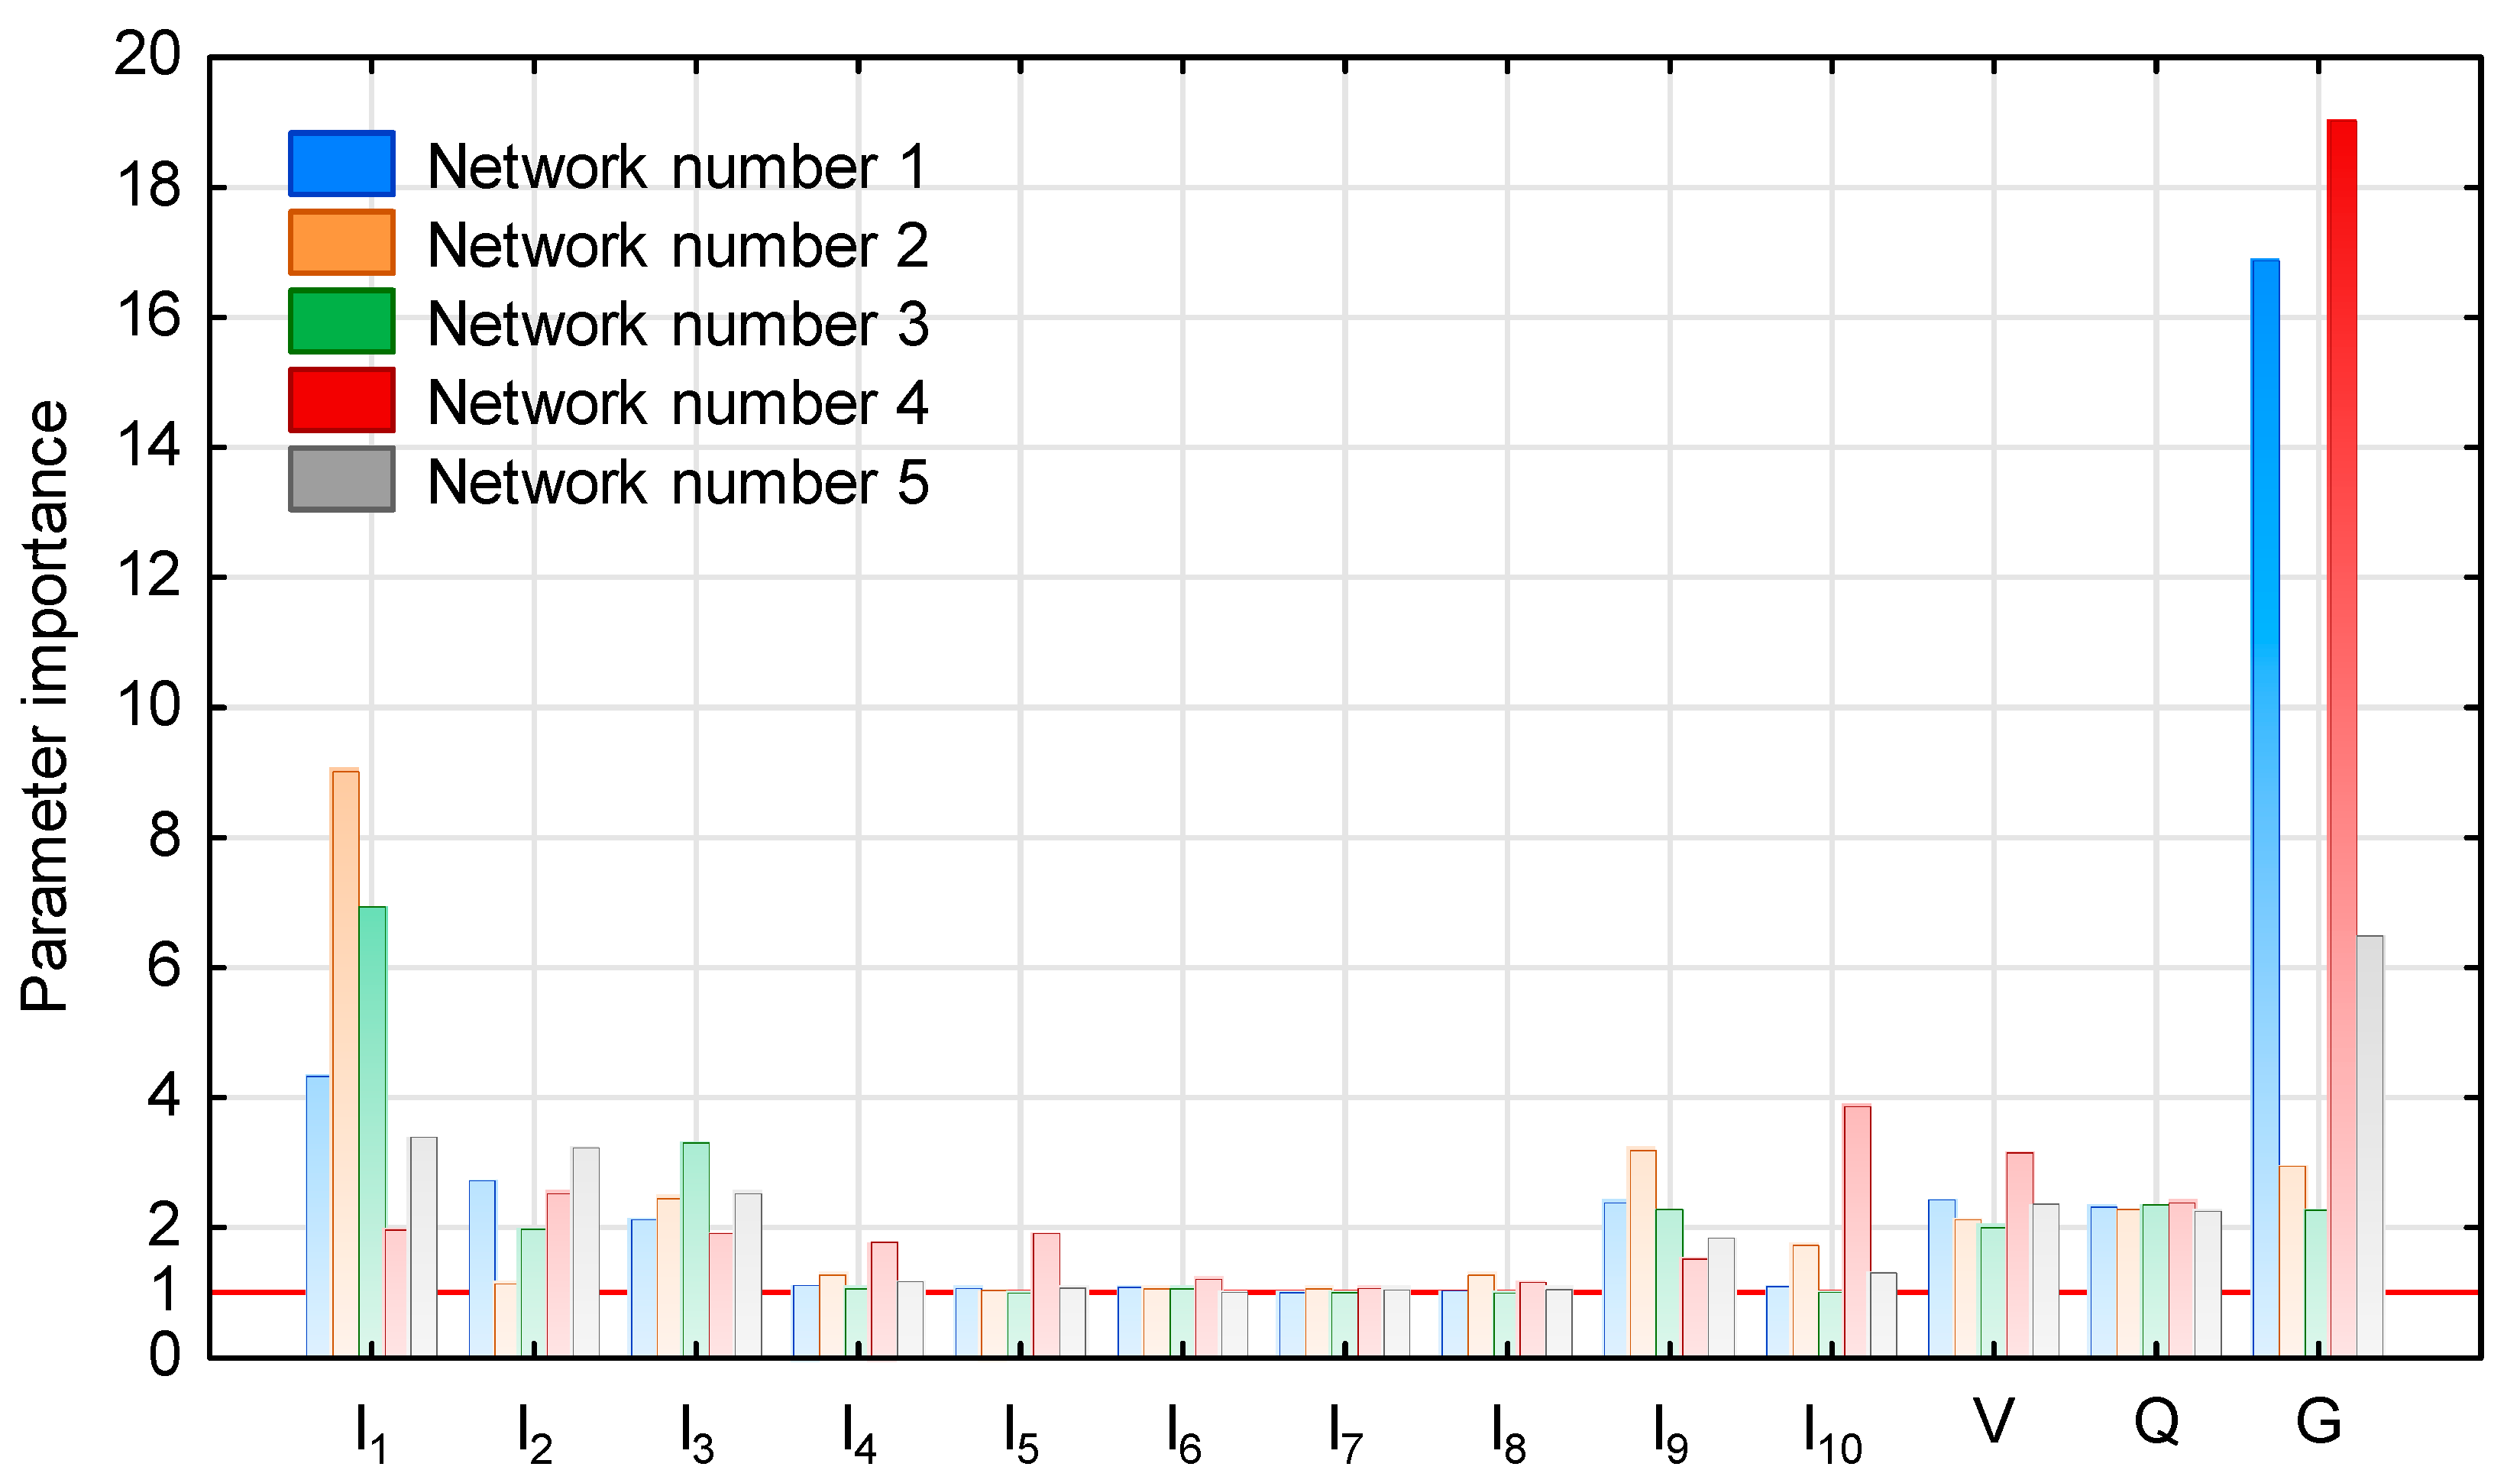
2.3.2. Identification of Socio-Economic Indicators
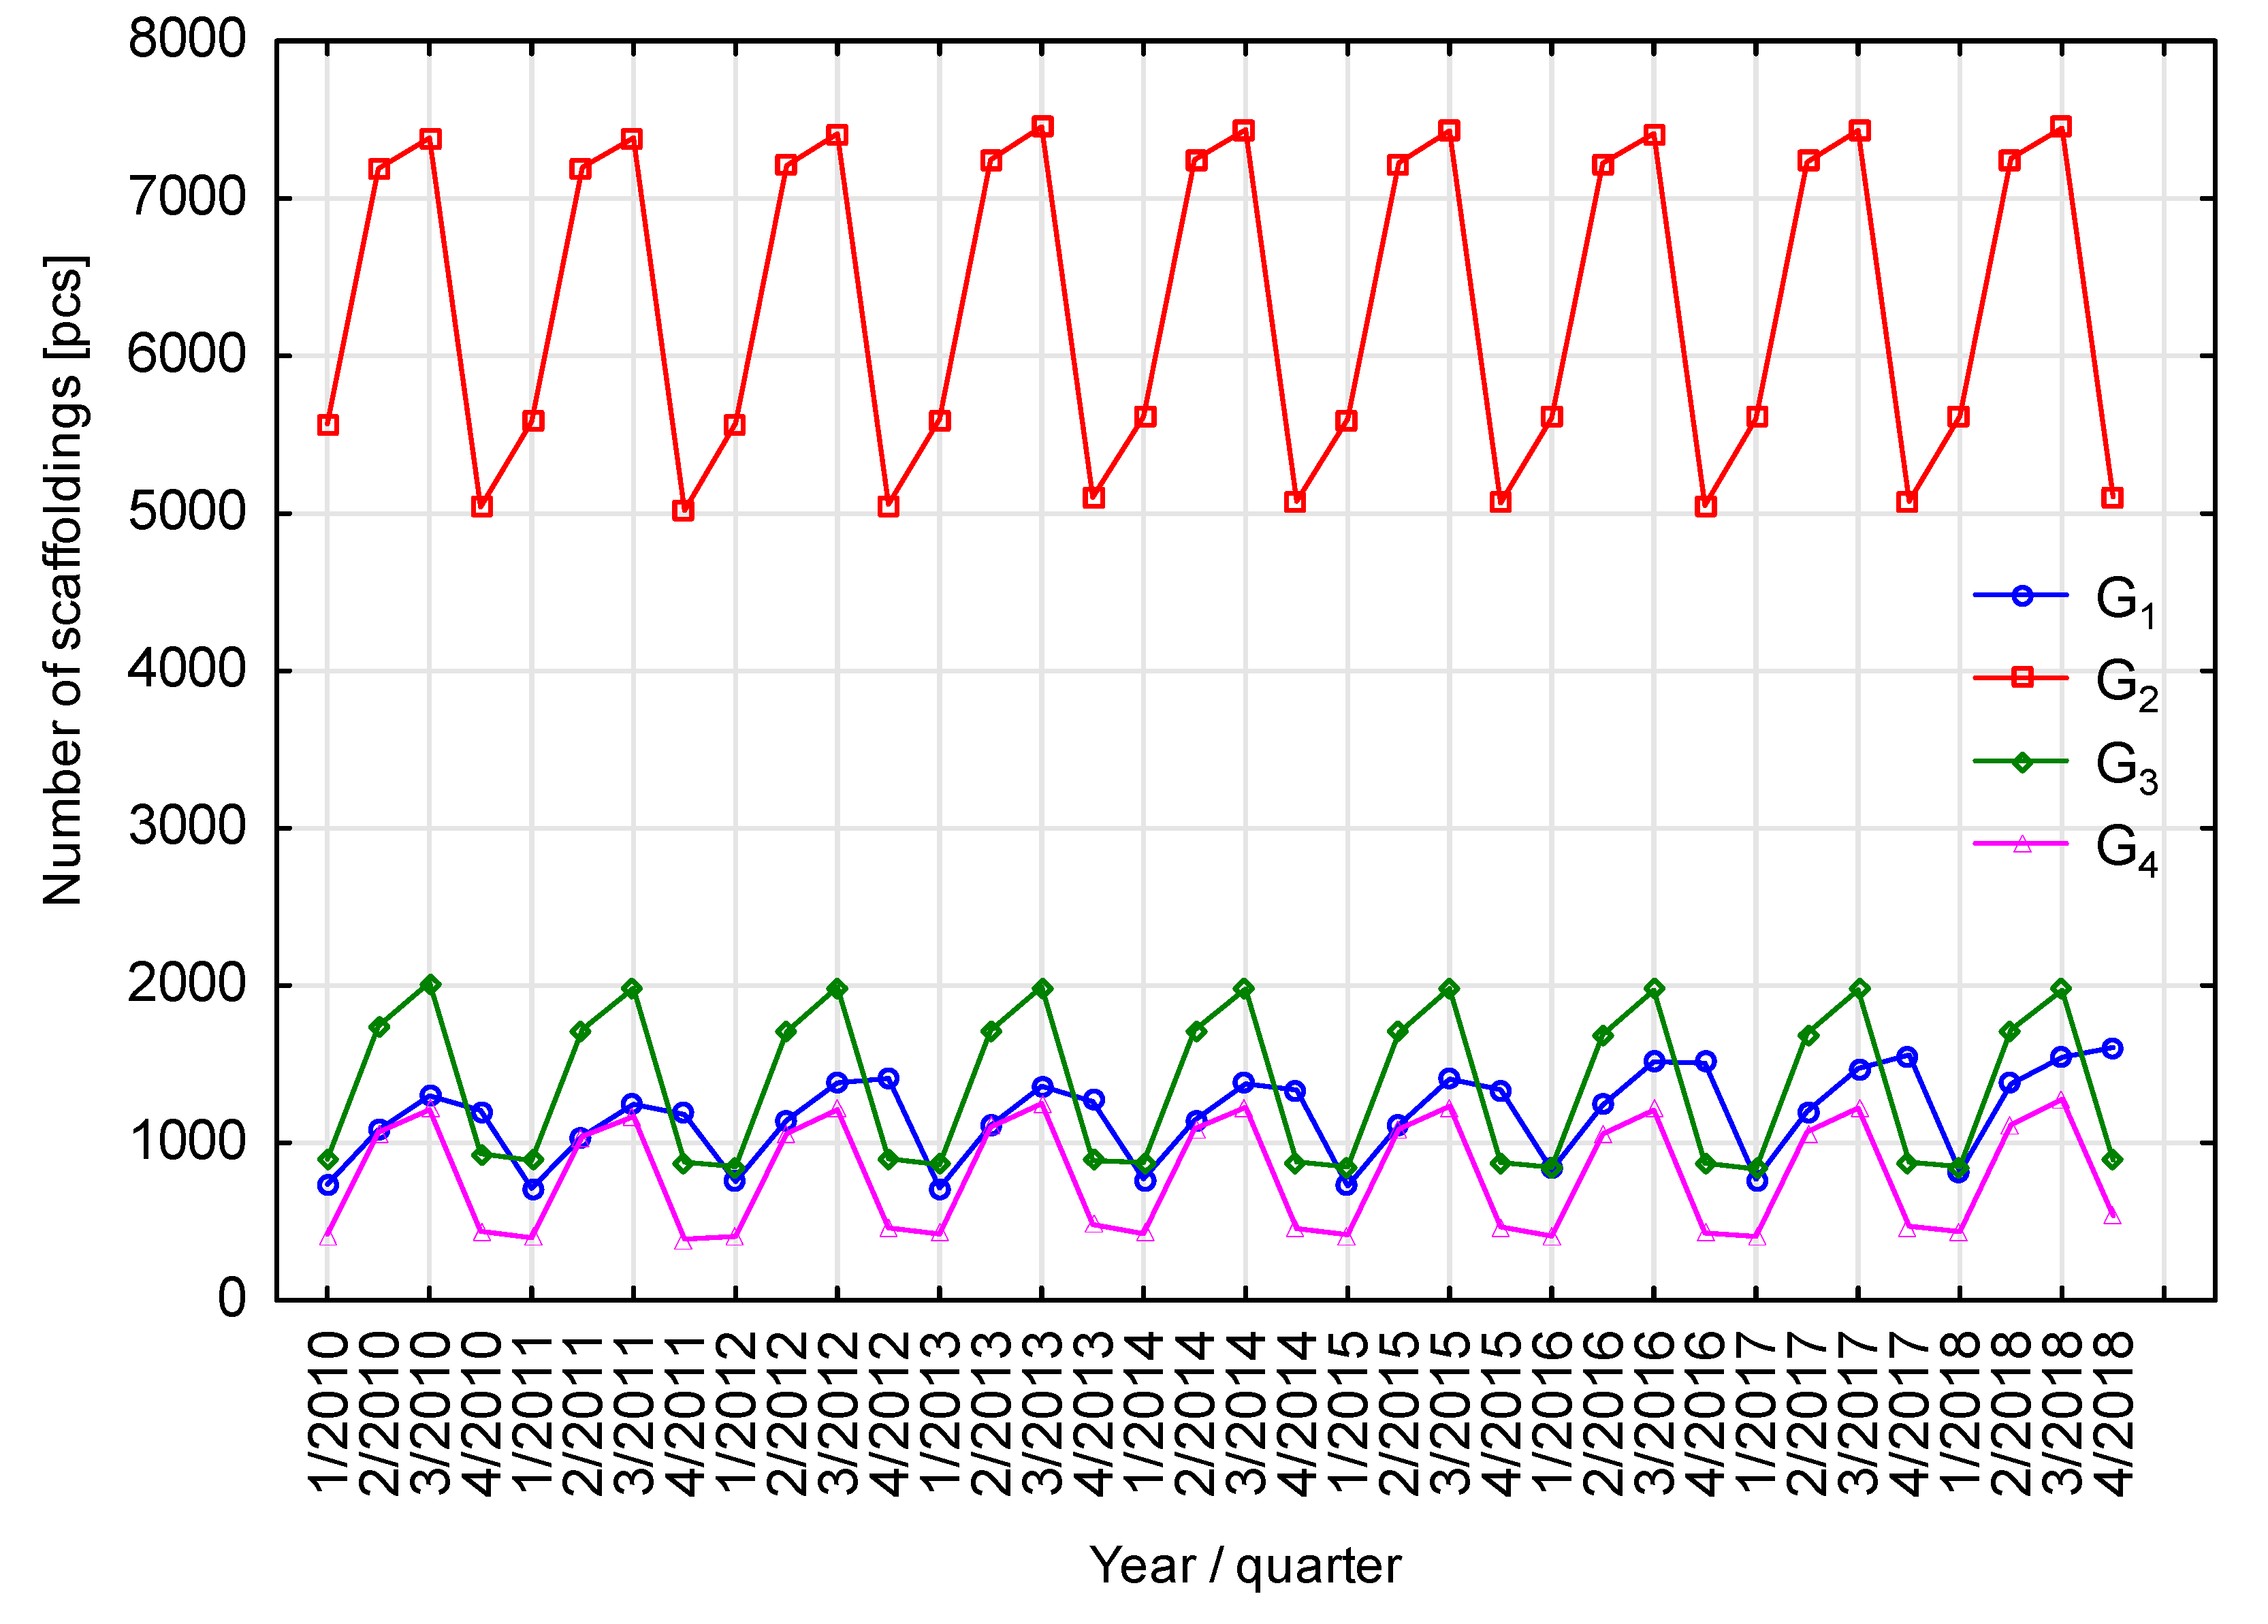
2.3.3. Classification of Communes with Regards to Socio-Economic Development
2.3.4. Neural Models for Predicting the Number of Used Scaffoldings
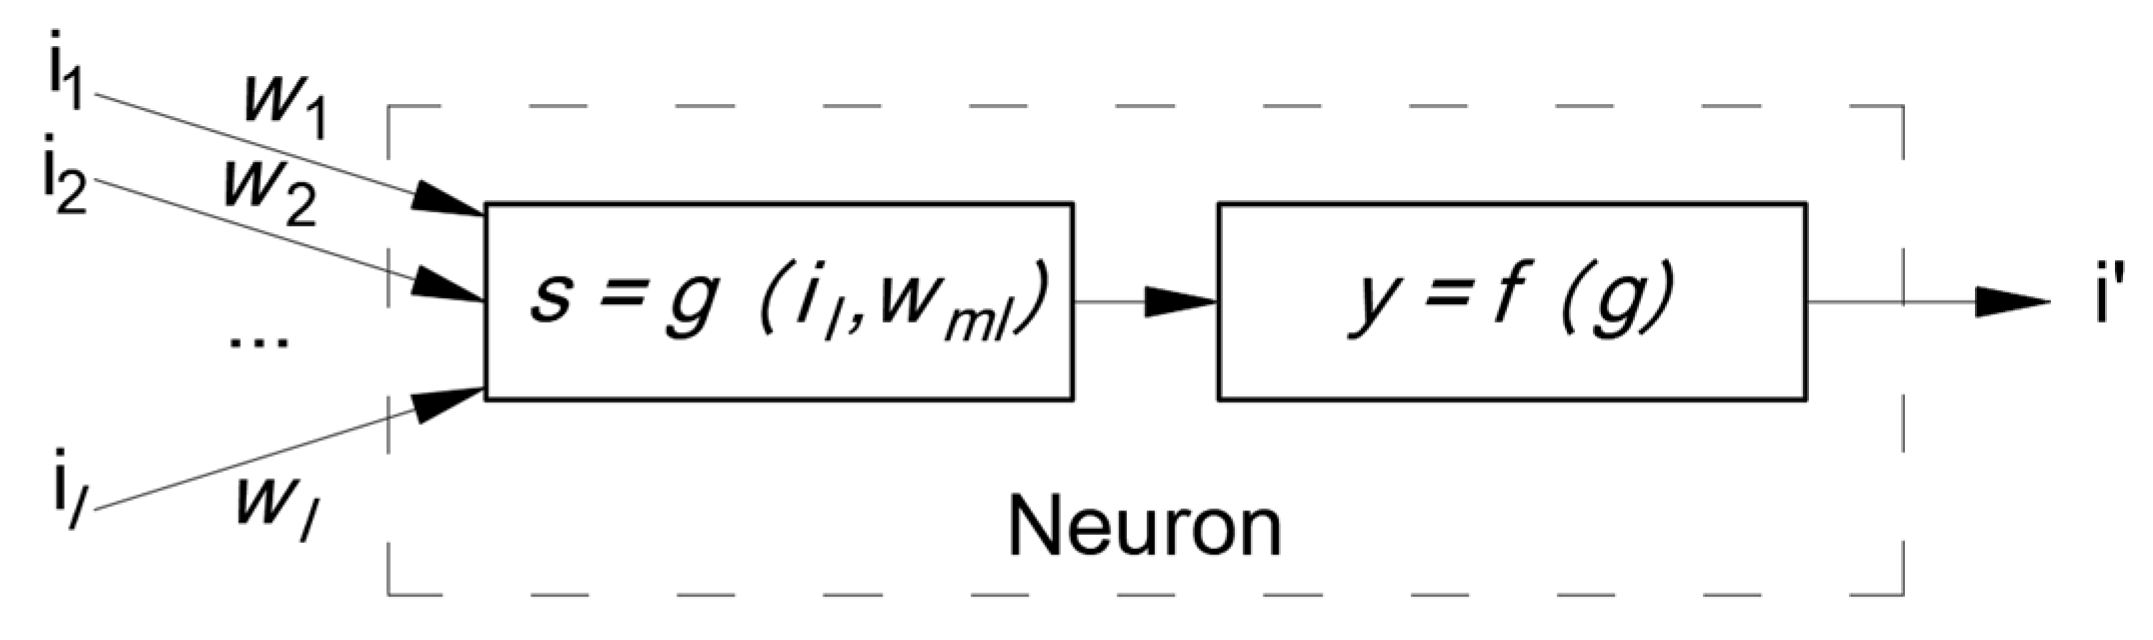
- A linear aggregation function in all the neurons of the hidden layer;
- A linear aggregation function in all the neurons of the output layers;
- A sigmoid activation function in all the neurons of the hidden layer; and
- A linear activation function in all the neurons of the output layer.
3. Results
3.1. Neural Model for Predicting the Number of Used Scaffoldings
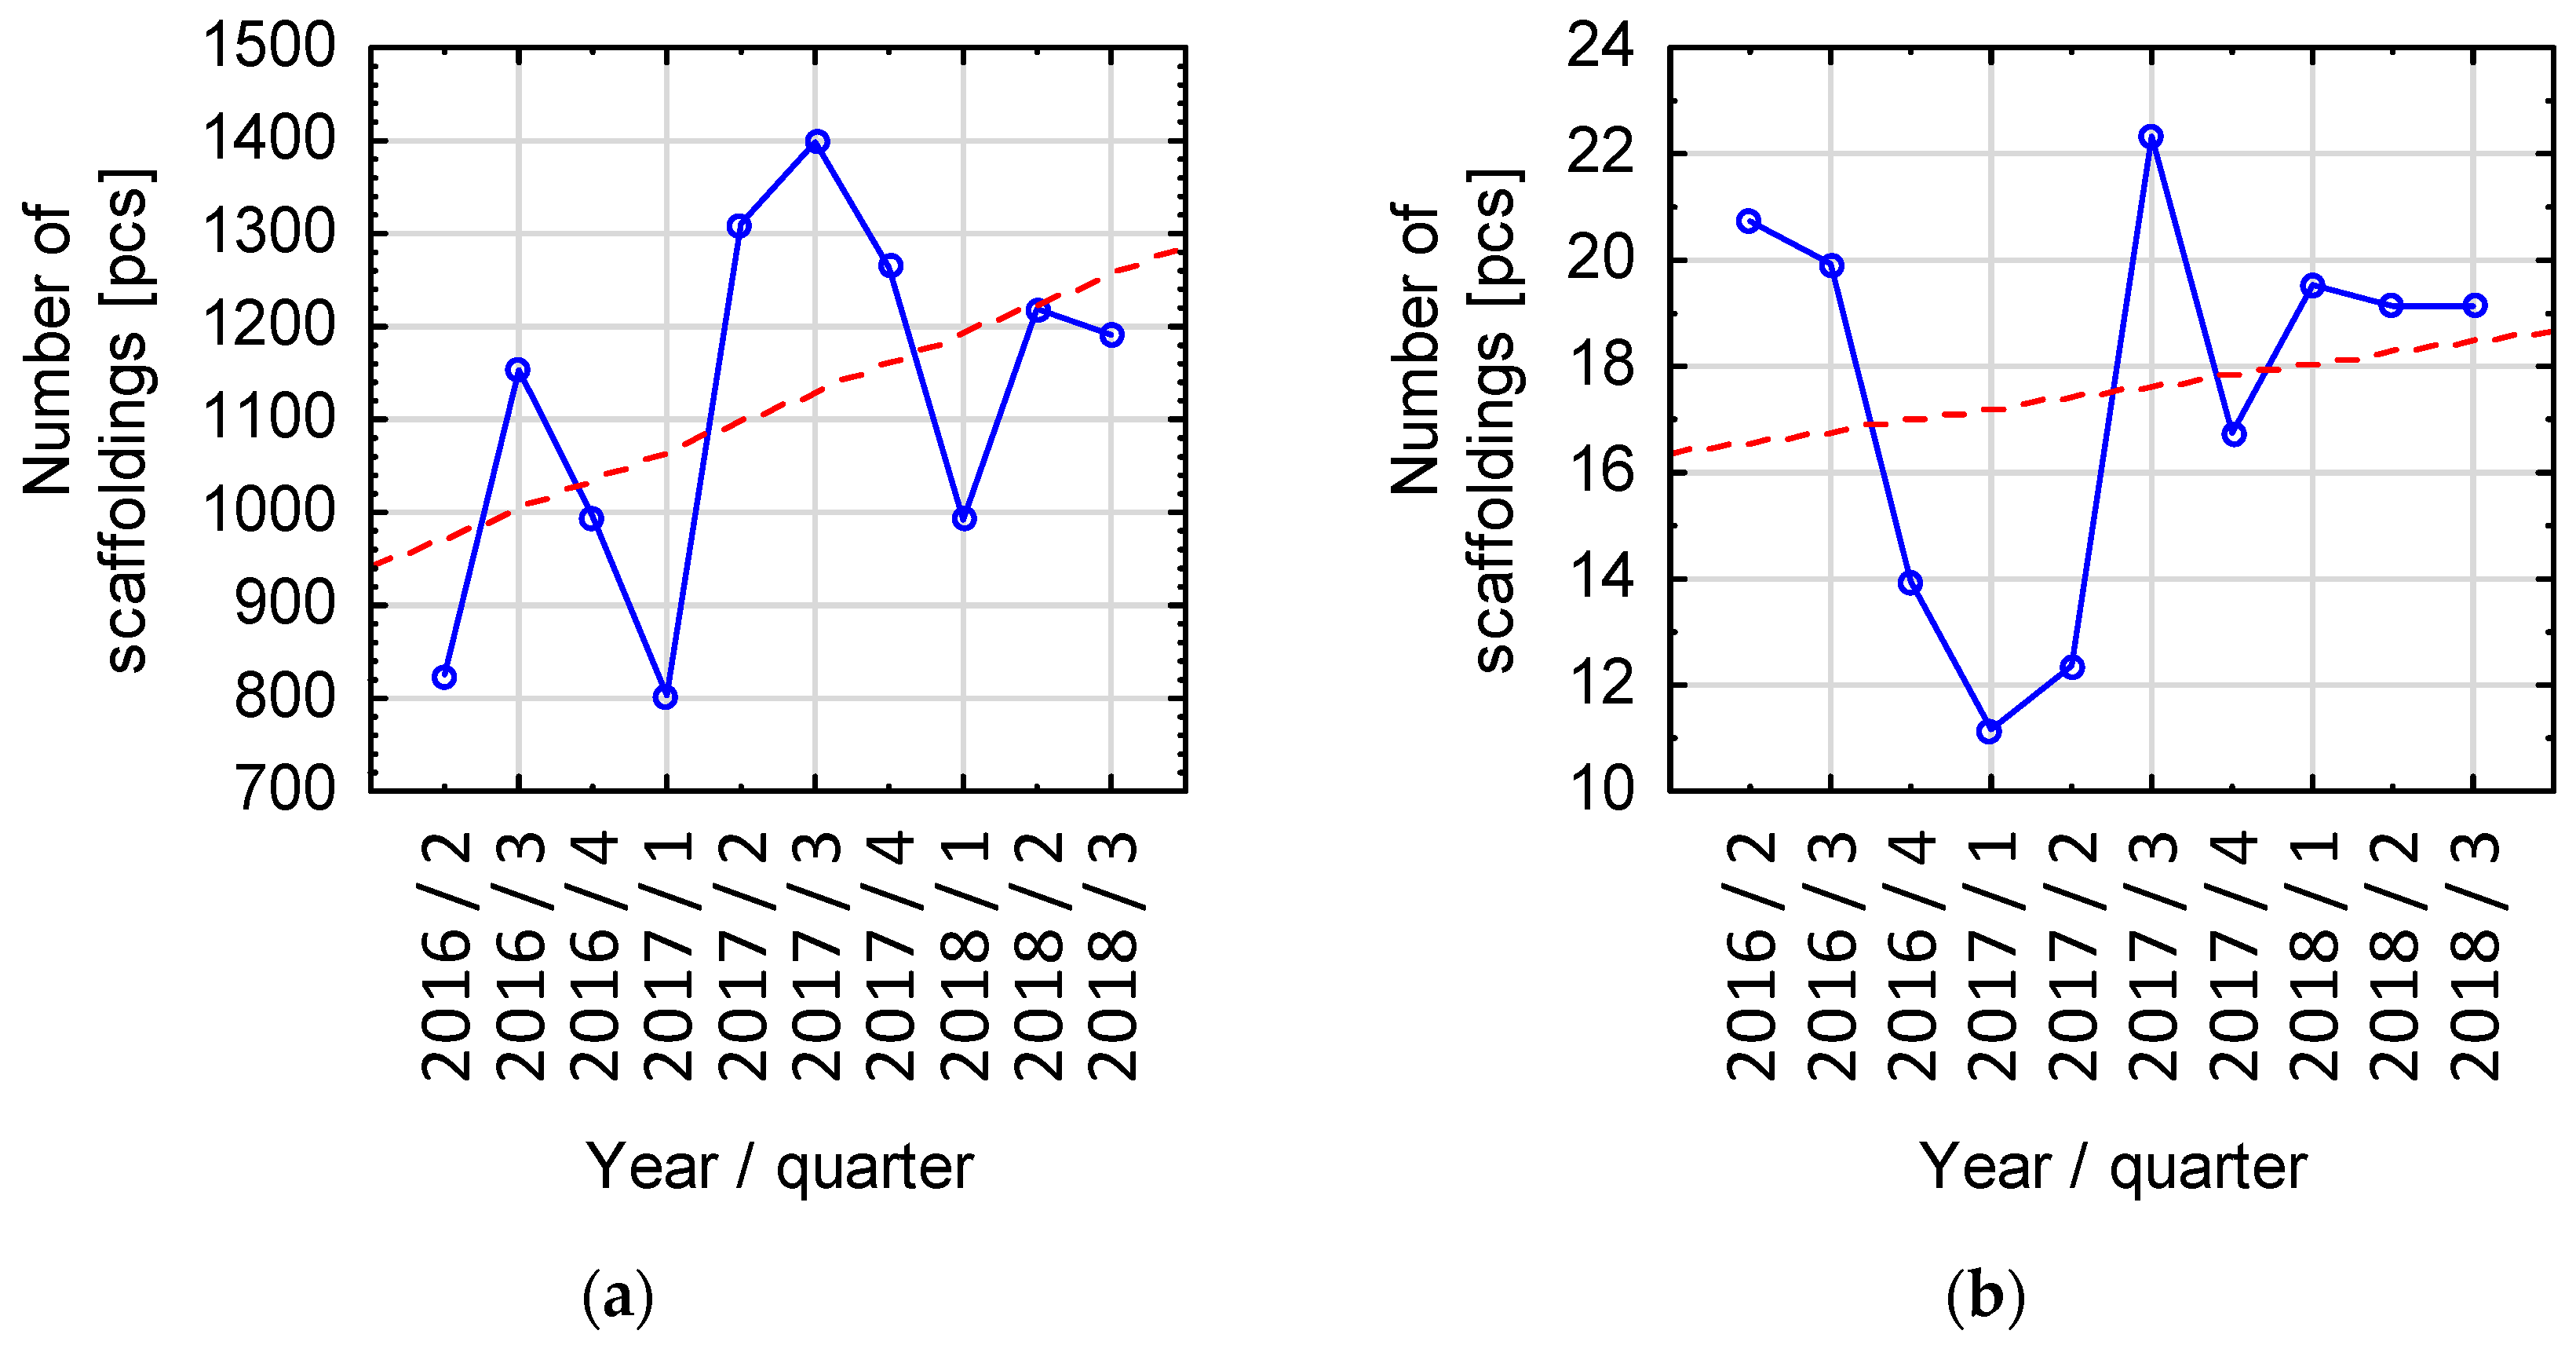
3.2. Estimating the Number of Used Scaffoldings
4. Discussion of the Results
5. Conclusions
- Empirical determination of the number of used scaffoldings in the selected representative areas of the studied regions;
- Identification and analysis of data concerning the socio-economic indicators that characterize the analyzed regions;
- Classification of the analyzed communes with regards to socio-economic development; and
- Development of a neural model.
Funding
Institutional Review Board Statement
Informed Consent Statement
Data Availability Statement
Acknowledgments
Conflicts of Interest
References
- Kmiecik, P.; Gnot, D.; Jurkiewicz, R.; Nowicka-Słowik, E.; Brajza, M. Working and Protective Scaffolding; The Publishing House of PWN: Warsaw, Poland, 2018; ISBN 978-83-01-19771-1. [Google Scholar]
- Hoła, A.; Sawicki, M.; Szóstak, M. Methodology of Classifying the Causes of Occupational Accidents Involving Construction Scaffolding Using Pareto-Lorenz Analysis. Appl. Sci. 2018, 8, 48. [Google Scholar] [CrossRef] [Green Version]
- Szóstak, M.; Hoła, B.; Bogusławski, P. Identification of accident scenarios involving scaffolding. Autom. Constr. 2021, 126, 103690. [Google Scholar] [CrossRef]
- Regulation of the Minister of Labour and Social Policy from September 26, 1997 on general provisions concerning occupational health and safety. J. Laws 2003, 169, 1650.
- Regulation of the Minister of Infrastructure from June 23, 2003 concerning information on safety and health protection and the safety and health protection plan. J. Laws 2003, 120, 1126.
- StatSoft Electronic Statistics Manual PL. Available online: https://www.statsoft.pl/textbook/stathome.html (accessed on 1 July 2021).
- Tadeusiewicz, R. Neural Networks; Akademicka Oficyna Wydawnicza: Warsaw, Poland, 1993; ISBN 83-85769-03-X. [Google Scholar]
- Neira, P.; Bennun, L.; Pradena, M.; Gomez, J. Prediction of concrete compressive strength through artificial neural network. Gradjevinar 2020, 72, 585–592. [Google Scholar]
- Madani, H.; Kooshafar, M.; Emadi, M. Compressive Strength Prediction of Nanosilica-Incorporated Cement Mixtures Using Adaptive Neuro-Fuzzy Inference System and Artificial Neural Network Models. Pract. Period. Struct. Des. Constr. 2020, 25. [Google Scholar] [CrossRef]
- Silva, F.A.N.; Delgado, J.M.P.Q.; Cavalcanti, R.S.; Azevedo, A.C.; Guimarães, A.S.; Lima, A.G.B. Use of nondestructive testing of ultrasound and artificial neural networks to estimate compressive strength of concrete. Buildings 2021, 11, 44. [Google Scholar] [CrossRef]
- Flood, I. Neural Networks in Civil Engineering: A Review. In Civil and Structural Engineering Computing: 2001; Topping, B.H.V., Ed.; Saxe-Coburg Publications: Stirlingshire, UK, 2001; Chapter 8; pp. 185–209. [Google Scholar] [CrossRef]
- Czarnecki, S.; Shariq, M.; Nikoo, M.; Sadowski, Ł. An intelligent model for the prediction of the compressive strength of cementitious composites with ground granulated blast furnace slag based on ultrasonic pulse velocity measurements. Meas. J. Int. Meas. Confed. 2021, 172. [Google Scholar]
- Jalal, M.; Arabali, P.; Grasley, Z.; Bullard, J.W. Application of adaptive neuro-fuzzy inference system for strength prediction of rubberized concrete containing silica fume and zeolite. Proc. Inst. Mech. Eng. Part L J. Mater. Des. Appl. 2020, 234, 438–451. [Google Scholar] [CrossRef]
- Gorzelańczyk, T.; Schabowicz, K. Effect of freeze-thaw cycling on the failure of fibre-cement boards, assessed using acoustic emission method and artificial neural network. Materials 2019, 12, 2181. [Google Scholar] [CrossRef] [Green Version]
- Yousefi, V.; Yakhchali, S.H.; Khanzadi, M.; Mehrabanfar, E.; Šaparauskas, J. Proposing a neural network model to predict time and cost claims in construction projects. J. Civ. Eng. Manag. 2016, 22, 967–978. [Google Scholar] [CrossRef]
- Gerek, I.H.; Erdis, E.; Mistikoglu, G.; Usmen, M. Modelling masonry crew productivity using two artificial neural network techniques. J. Civ. Eng. Manag. 2015, 21, 231–238. [Google Scholar] [CrossRef] [Green Version]
- Juszczyk, M. Analysis of labour efficiency supported by the ensembles of neural networks on the example of steel reinforcement works. Arch. Civ. Eng. 2020, 66, 97–111. [Google Scholar]
- Golnaraghi, S.; Zangenehmadar, Z.; Moselhi, O.; Alkass, S.; Vosoughi, A.R. Application of Artificial Neural Network(s) in Predicting Formwork Labour Productivity. Adv. Civ. Eng. 2019, 2019, 1–11. [Google Scholar] [CrossRef] [Green Version]
- Leśniak, A.; Juszczyk, M.; Piskorz, G. Delays factors of a completion construction project aggregation with the use of cluster analysis. Mater. Bud. 2018, 10, 62–65. [Google Scholar]
- Wilmot, C.G.; Mei, B. Neural Network Modeling of Highway Construction Costs. J. Constr. Eng. Manag. 2005, 131. [Google Scholar] [CrossRef]
- Leśniak, A.; Juszczyk, M. Prediction of site overhead costs with the use of artificial neural network based model. Arch. Civ. Mech. Eng. 2018, 18, 973–982. [Google Scholar] [CrossRef]
- Schabowicz, K.; Hoła, B. Application of artificial neural networks in predicting earthmoving machinery effectiveness ratios. Arch. Civ. Mech. Eng. 2008, 8, 73–84. [Google Scholar] [CrossRef]
- Patel, D.A.; Jha, K.N. Evaluation of construction projects based on the safe work behavior of co-employees through a neural network model. Saf. Sci. 2016, 89, 240–248. [Google Scholar] [CrossRef]
- Patel, D.A.; Jha, K.N. Neural Network Model for the Prediction of Safe Work Behavior in Construction Projects. J. Constr. Eng. Manag. 2015, 141, 04014066. [Google Scholar] [CrossRef]
- Nguyen, L.D.; Tran, D.Q.; Chandrawinata, M.P. Predicting Safety Risk of Working at Heights Using Bayesian Networks. J. Constr. Eng. Manag. 2016, 142, 04016041. [Google Scholar] [CrossRef]
- Xu, N.; Ma, L.; Liu, Q.; Wang, L.; Deng, Y. An improved text mining approach to extract safety risk factors from construction accident reports. Saf. Sci. 2021, 138, 1–21. [Google Scholar] [CrossRef]
- Tadeusiewicz, R.; Migut, G. Neural Networks-Training Materials; StatSoft Polska: Krakow, Poland, 2019. [Google Scholar]
- Shahin, M.A.; Maier, H.R.; Jaksa, M.B. Data Division for Developing Neural Networks Applied to Geotechnical Engineering. J. Comput. Civ. Eng. 2004, 18. [Google Scholar] [CrossRef]
- Regulation of the Minister of Infrastructure from February 6, 2003 concerning occupational health and safety during construction works. J. Laws 2003, 47, 401.
- Central Statistical Office (GUS)-Local Data Bank. Available online: http://www.stat.gov.pl/bdlen/app/strona.html?p_name=indeks (accessed on 1 July 2021).
- Hoła, B.; Nowobilski, T. Classification of Economic Regions with Regards to Selected Factors Characterizing the Construction Industry. Sustainability 2018, 10. [Google Scholar] [CrossRef] [Green Version]
- Hoła, B.; Nowobilski, T. Analysis of the influence of socio-economic factors on occupational safety in the construction industry. Sustainability 2019, 11, 4469. [Google Scholar] [CrossRef] [Green Version]
- Nowobilski, T.; Hola, B. The Qualitative and Quantitative Structure of the Causes of Occupational Accidents on Construction Scaffolding. Arch. Civ. Eng. 2019, LXV, 121–131. [Google Scholar] [CrossRef]
- Central Statistical Office. Statistical Yearbook of Voivodships from 2007–2019; Central Statistical Office: Warsaw, Poland, 2020. [Google Scholar]
- Wierzchoń, S.; Kłopotek, M. Cluster Analysis Algorithms; Wydawnictwo WNT: Warsaw, Poland, 2015; ISBN 978-83-7926-261-8. [Google Scholar]
- Stanisz, A. An Accessible Course in Statistics Using STATISTICA PL and Examples from Medicine, Volume 3: Linear and Nonlinear Models; StatSoft Polska: Krakow, Poland, 2007; ISBN 978-83-88724-19-0. [Google Scholar]
- Ward, J.H.J. Hierarchical Grouping to Optimize an Objective Function. J. Am. Stat. Assoc. 1963, 58, 236–244. [Google Scholar] [CrossRef]
- Grabiński, T. Taxonometric Methods; University of Economics in Krakow: Krakow, Poland, 1992. [Google Scholar]
- Juszczyk, M.; Zima, K.; Lelek, W. Forecasting of sports fields construction costs aided by ensembles of neural networks. J. Civ. Eng. Manag. 2019, 25, 715–729. [Google Scholar] [CrossRef] [Green Version]


| m | |
|---|---|
| Number of construction companies carrying out work related to the construction of buildings [pcs.] | |
| Number of construction companies carrying out work related to the construction of civil engineering structures [pcs.] | |
| Number of construction companies carrying out specialized work [pcs.] | |
| Number of self-employed people running a business in the construction industry [pcs.] | |
| Number of residential buildings that were recently approved for use [pcs.] | |
| Population [number of people] | |
| Number of flats in cities [pcs.] | |
| Area of the commune [km2] | |
| Number of people working in the commune [number of people] | |
| Area of built-up and urbanized areas in the commune [km2] |
| 0.97 | 0.89 | 0.97 | 0.97 | 0.87 | 0.96 | 0.96 | 0.82 | 0.97 | 0.94 |
| Network Number | Number of Neurons in the Hidden Layer | Quality of Network * | RMSE | ||||
|---|---|---|---|---|---|---|---|
| Learning | Testing | Validation | Learning | Testing | Validation | ||
| 1 | 13 | 0.989 | 0.986 | 0.990 | 65.7 | 22.1 | 68.3 |
| 2 | 14 | 0.989 | 0.986 | 0.989 | 65.5 | 22.5 | 74.5 |
| 3 | 16 | 0.989 | 0.985 | 0.990 | 65.7 | 23.7 | 69.9 |
| 4 | 17 | 0.990 | 0.987 | 0.990 | 63.8 | 21.9 | 70.6 |
| 5 | 19 | 0.989 | 0.987 | 0.990 | 65.8 | 22.2 | 70.1 |
| Network Number | Graph of the Network’s Learning | Graph of the Quality of Matching the Network’s Output Values and Empirical Values |
|---|---|---|
| 1 |  |  |
| 2 |  | 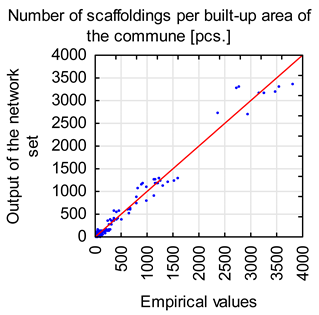 |
| 3 |  |  |
| 4 | 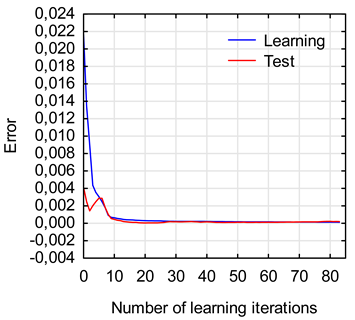 | 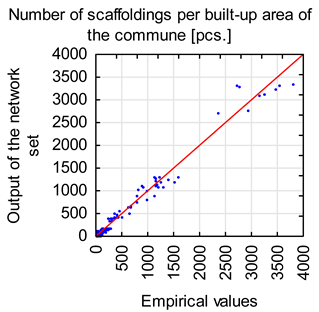 |
| 5 | 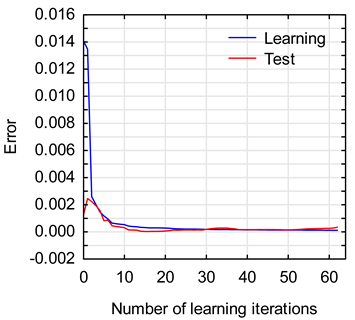 |  |
Publisher’s Note: MDPI stays neutral with regard to jurisdictional claims in published maps and institutional affiliations. |
© 2021 by the author. Licensee MDPI, Basel, Switzerland. This article is an open access article distributed under the terms and conditions of the Creative Commons Attribution (CC BY) license (https://creativecommons.org/licenses/by/4.0/).
Share and Cite
Nowobilski, T. Calculation of the Population of Construction Scaffoldings Using Neural Networks. Appl. Sci. 2021, 11, 8211. https://doi.org/10.3390/app11178211
Nowobilski T. Calculation of the Population of Construction Scaffoldings Using Neural Networks. Applied Sciences. 2021; 11(17):8211. https://doi.org/10.3390/app11178211
Chicago/Turabian StyleNowobilski, Tomasz. 2021. "Calculation of the Population of Construction Scaffoldings Using Neural Networks" Applied Sciences 11, no. 17: 8211. https://doi.org/10.3390/app11178211
APA StyleNowobilski, T. (2021). Calculation of the Population of Construction Scaffoldings Using Neural Networks. Applied Sciences, 11(17), 8211. https://doi.org/10.3390/app11178211