Article

Maximum Possible Cooling Rate in Ultrafast Chip Nanocalorimetry: Fundamental Limitations Due to Thermal Resistance at the Membrane/Gas Interface

by
Alexander A. Minakov
1 and
Christoph Schick
2,3,*
1
Prokhorov General Physics Institute of the Russian Academy of Sciences, Vavilov Str. 38, 119991 Moscow, Russia
2
Centre CALOR, Institute of Physics and Competence, University of Rostock, 18051 Rostock, Germany
3
Alexander Butlerov Institute of Chemistry, Kazan Federal University, Kremlyovskaya Str. 18, 420008 Kazan, Russia
*
Author to whom correspondence should be addressed.
Appl. Sci. 2021, 11(17), 8224; https://doi.org/10.3390/app11178224
Submission received: 29 July 2021 / Revised: 20 August 2021 / Accepted: 1 September 2021 / Published: 4 September 2021
(This article belongs to the Special Issue Recent Advance and Applications in Chip Calorimetry)

Abstract

:
Ultrafast chip nanocalorimetry opens up remarkable possibilities in materials science by allowing samples to be cooled and heated at extremely high rates. Due to heat transfer limitations, controlled ultrafast cooling and heating can only be achieved for tiny samples in calorimeters with a micron-thick membrane. Even if ultrafast heating can be controlled under quasi-adiabatic conditions, ultrafast controlled cooling can be performed if the calorimetric cell is located in a heat-conducting gas. It was found that the maximum possible cooling rate increases as 1 / r 0 with decreasing radius r 0 of the hot zone of the membrane. The possibility of increasing the maximum cooling rate with decreasing r 0 was successfully implemented in many experiments. In this regard, it is interesting to answer the question: what is the maximum possible cooling rate in such experiments if r 0 tends to zero? Indeed, on submicron scales, the mean free path of gas molecules l m f p becomes comparable to r 0 , and the temperature jump that exists at the membrane/gas interface becomes significant. Considering the limitation associated with thermal resistance at the membrane/gas interface and considering the transfer of heat through the membrane, we show that the controlled cooling rate can reach billions of K/s, up to 1010 K/s.

Graphical Abstract

1. Introduction

Ultrafast membrane-based nanocalorimetry opens up exciting opportunities for materials science [1,2,3,4,5,6,7,8,9,10,11,12,13,14,15]. This calorimetry makes it possible to measure the size-dependent properties of nanosized samples [1,5,9] and films as thin as about 0.1 nm [2,3], as well as measure the melting and synthesis characteristics of a single-layer lamella [7,8], and directly measure the desorption of polymer chains [12]. The ultrafast calorimetry method is described in detail in [10]. A review of microchip-based nanocalorimeters is presented in [11]. It is very important that ultrafast calorimetry allows nano- and microsamples to be heated or quenched at extremely high, controlled rates, creating non-equilibrium states under well-defined conditions, and to study the kinetics of phase transitions on a sub-millisecond time scale. A review of such experiments is presented in [14]. For example, crystallization and recrystallization kinetics [15,16,17,18,19,20], as well as interfacial thermal conductance [21,22], can be measured in ultrafast membrane nanocalorimeters during rapid melting and crystallization. It was shown that calorimetric measurements with controlled cooling and heating rates up to 108 K/s are possible using membrane sensors; in the experiment, an uncontrolled cooling rate of about 108 K/s was achieved [23]. However, the fundamental limitations on controlled cooling rates need to be investigated. Indeed, even if ultrafast heating can be controlled in a nanocalorimeter under quasi-adiabatic conditions, ultrafast cooling can only be performed under non-adiabatic conditions [23,24,25,26]. In fact, the central hot zone of the membrane is used as a calorimetric cell. The heat transfer between the hot zone and the environment determines the maximum cooling rate achievable in an experiment. It was found that uniform ultrafast controlled cooling can be accomplished for nanogram samples if the measuring calorimetric cell is placed in heat-conducting nitrogen gas or helium gas [23,24,25,26]. For several sensors of different size and geometry, it was shown that the maximum possible controlled cooling rate is proportional to the ratio λ / r 0 , where λ is the thermal conductivity of the surrounding gas and r 0 is the radius of the central hot zone of the membrane [23,24,25,26]. The possibility of increasing the maximum cooling rate with decreasing r 0 has been successfully used in many experiments [10,11,12,13,14,15,16,17,18,19,20,21,22,23,24,25,26]. The goal of this article is to answer the question: what is the maximum possible cooling rate in such experiments if r 0 tends to zero? Indeed, on submicron scales, the mean free path of gas molecules l m f p becomes comparable to r 0 . In fact, there is a jump in temperature Δ T C at the membrane/gas contact. The temperature jump Δ T C increases with the increase of the temperature gradient in the gas near the membrane hot zone; this temperature gradient is about ( T T t ) / r 0 , where T is the temperature of the hot zone, T t is the temperature of the thermostat. Thus, for r 0 on a submicron scale, a comprehensive analysis of the thermal processes occurring in the calorimetric sensor located in a heat-conducting gas is required.
In the first part of the paper, we consider the thermal resistance at the membrane/gas interface and obtain the fundamental limitation on the maximum possible cooling rate in a membrane-based calorimeter with the calorimetric cell located in a heat-conducting gas. In the second part of the paper, the effect of the heat transfer from the central hot zone of the membrane to the periphery of the membrane is considered. Finally, it is shown that the controlled cooling rate in membrane calorimeters can reach up to ten billion K/s in helium gas.

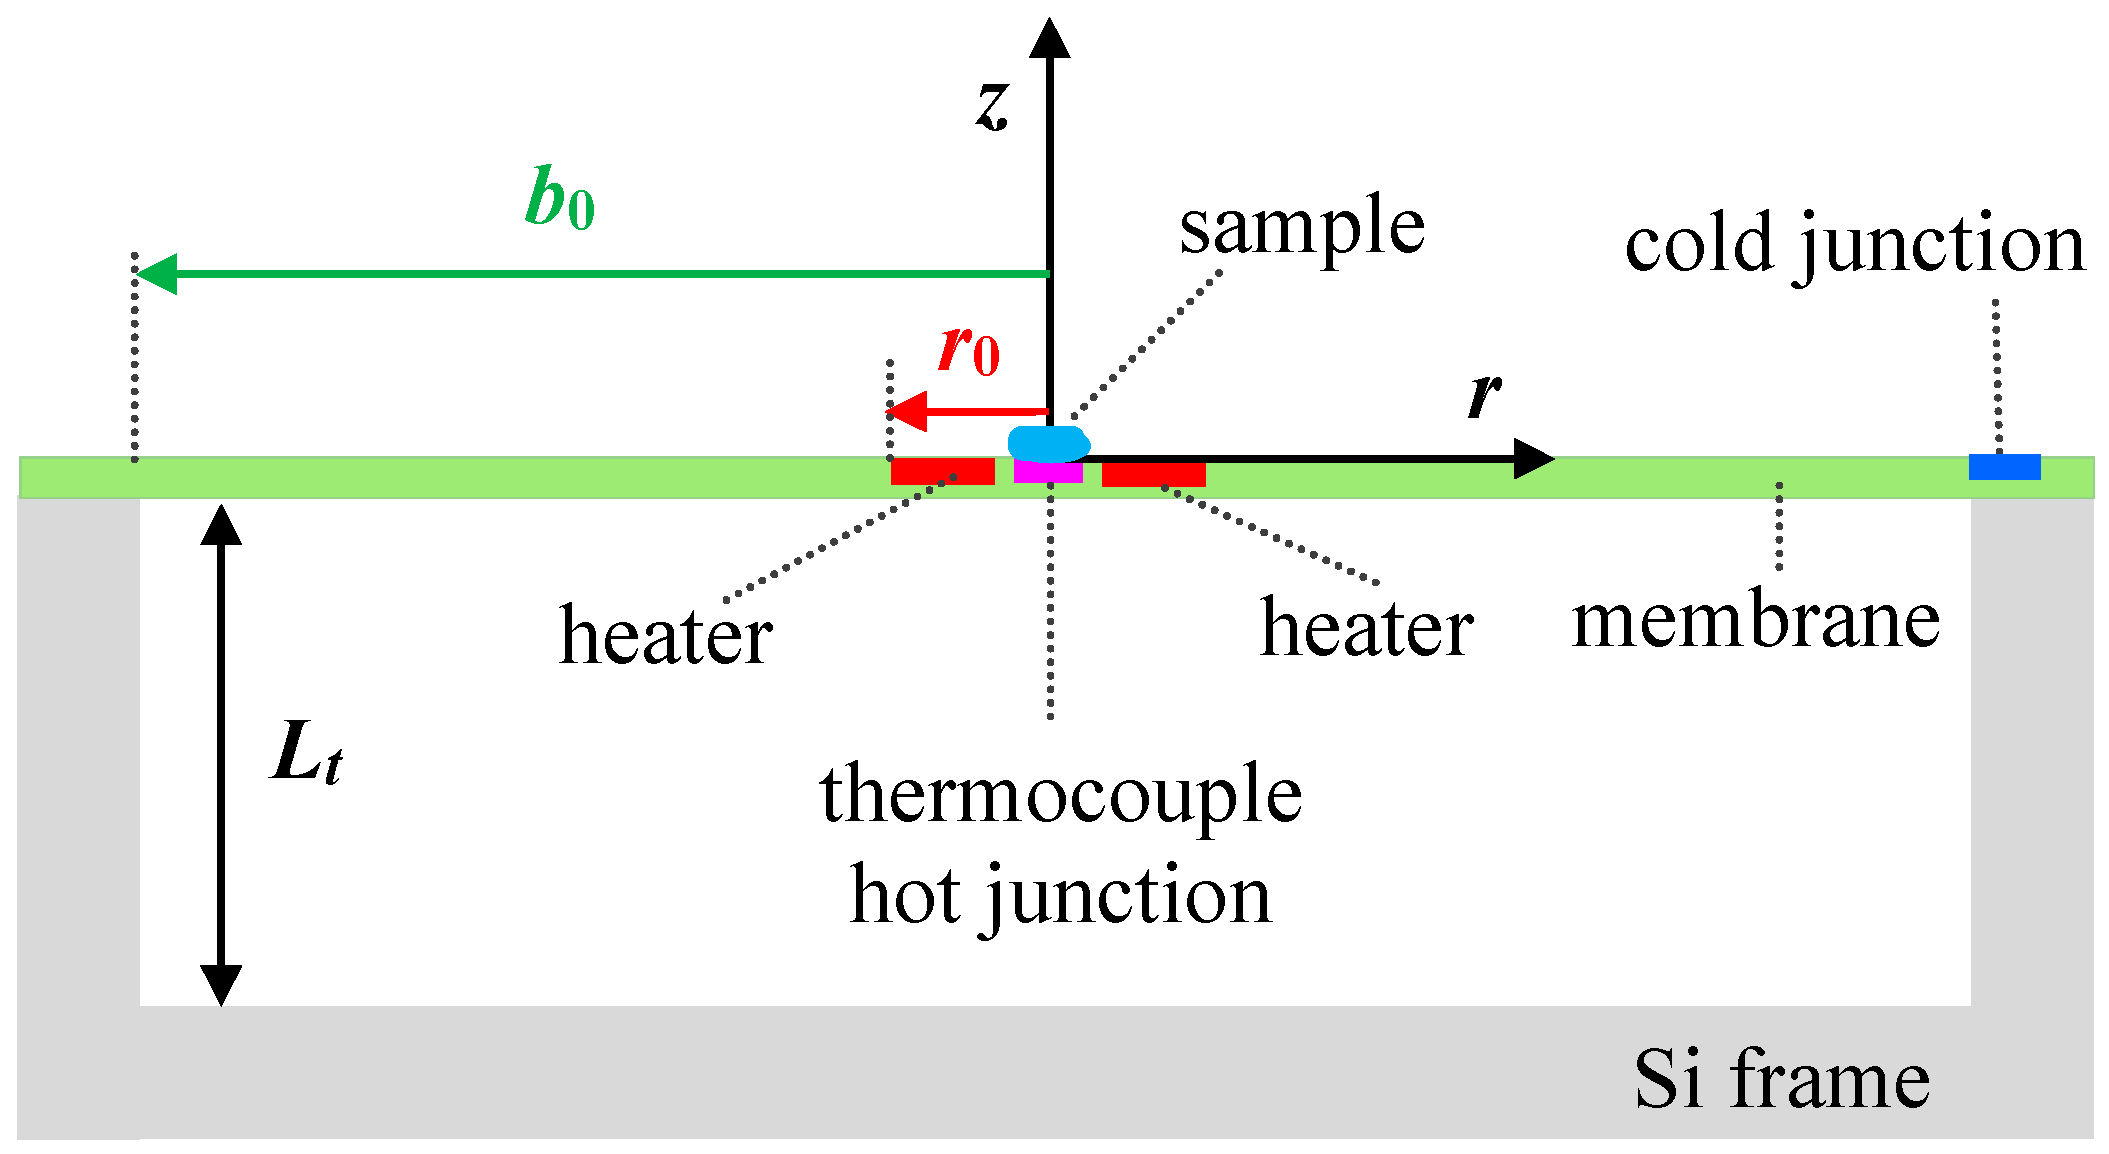
2. Membrane-Based Ultrafast Nanocalorimeter

The considered membrane-based calorimeter consists of an amorphous silicon nitride membrane with a thin-film resistive heater and a thermocouple located in the center of the membrane, see Figure 1. The central hot zone of the membrane is used as the calorimetric cell. The sample to be measured is placed in the center of this zone, next to the measuring hot junction of the thermocouple, see Figure 1. The thermocouple, heater, and electrical leaders are formed by p- and n-type polysilicon tracks with suitable thermoelectric properties and resistivity. For the protection and electrical insulation, the measuring circuit is covered with a submicron amorphous silicon nitride layer so that the total membrane thickness d m is about 1 µm. The membrane is attached to a silicon frame at a distance of b 0 = 350 µm from the center of the membrane. The frame is mounted on a standard TO-5 housing. The calorimetric cell is located in a thermostat with controlled temperature T t and gas pressure p .
The heat generated by the heater in the hot zone of the membrane is transferred to the surrounding gas and membrane. Consider the transfer of heat to the gas. Let α denote the coefficient of heat transfer from the membrane surface to the surrounding gas. This coefficient, measured in W/m2K, describes the heat loss from the central hot zone of the membrane to the gas. The heat losses are mainly associated with the thermal conductivity λ of the surrounding gas [23,24,25,26]. This heat loss is proportional to λ ( T T t ) L , where L is the characteristic length of the problem. Since r 0 is small with respect to the distance L t from the hot zone to the thermostat, the heat loss is proportional to λ ( T T t ) r 0 . In fact, the hot zone can be considered as a spherical (point) heat source embedded in the gas. Consequently, α = λ / r 0 with good accuracy for a radius r 0 of tens of microns or less [23,24,25,26]. The convective and radiative contributions to the heat losses are negligible for such a small r 0 , see Appendix A. Thus, the cooling rate R of the hot zone of the membrane depends on the heat transfer parameter α = λ / r 0 at L t r 0 l m f p .
Typically, nitrogen gas or helium gas is used to cool the membrane [10,11,12,13,14,15,16,17,18,19,20,21,22,23,24,25,26]. In differential scanning calorimetry, the calorimetric cell loaded with the sample and the reference unloaded cell are maintained at the same temperature T ( t ) in the central hot zone; this temperature is controlled at the desired scanning rate R ( t ) . The difference in input power required to match the temperature of the loaded cell to the temperature of the reference cell is equal to the power P S ( t ) absorbed or released from the sample being measured [27]. This study aims to estimate the maximum possible controlled cooling rate R m a x for membrane calorimeters. Thus, we estimate R m a x for an unloaded cell, considering the limiting case when the heat capacity of the sample is negligible.

3. Interfacial Thermal Resistance at the Membrane/Gas Interface

Let us consider the change in the gas temperature near the hot zone of the membrane at distances comparable to l m f p . Note that for distances of the order of l m f p , it is necessary to clarify the concept of the gas temperature. Temperature is commonly defined as the average local energy of gas molecules, assuming that the distribution function is the same as for large volumes [28]. Consider the temperature jump Δ T C at the membrane/gas contact. This jump in temperature means that there is a contact thermal resistance at the interface between the gas and the calorimeter membrane. In this case, the so-called temperature jump distance δ can be introduced [29,30]. In fact, the effect of the temperature jump increases the length of the heat transfer path through the gas by an amount of δ , which is of the order of l m f p . Usually, the boundary condition that takes into account the temperature jump at the membrane/gas interface is represented by Equation (1) [29,30]:
T K T m = δ T z ,
where T m is the temperature of the membrane, and T K is the gas temperature extrapolated to the membrane, as if the temperature gradient in the gas T z was not distorted due to the temperature jump at the interface. The temperature jump distance δ depends on the following gas parameters: mean free path l m f p , heat capacity ratio γ , kinematic viscosity ν , and thermal diffusivity D = λ / ρ c p , where ρ and c p are the density and specific heat capacity at constant pressure, respectively. The temperature jump distance δ can be represented by Equation (2) [29,30]:
δ = ( 2 σ σ ) ( 2 γ 1 + γ ) ( λ ν ρ c p ) l m f p ,
where σ is the thermal accommodation coefficient in the boundary condition, see Equation (3).
T r = σ T m + T i ( 1 σ ) ,
where T i and T r are the temperatures of the incident and reflected gas molecules; T m is the membrane temperature [29,30]. In fact, σ denotes the fraction of molecules that are diffusely reflected from the membrane at the temperature T m . The remaining fraction of molecules is reflected specularly, which means that their velocity components, perpendicular to the membrane surface, only change sign. Thus, it follows from Equation (3) that σ can be represented as:
σ = ( T r T i ) / ( T m T i ) .
Equation (4) reveals the physical meaning of the thermal accommodation coefficient σ . The parameter σ depends on the gas molecules and the solid surface with which the gas molecules interact. This parameter becomes close to 1 for a blackened surface [30]. σ is relatively small for light gas molecules. For example, for helium gas and bright platinum σ is about 0.5, and 0.9 for blackened platinum [30]. However, for CO2 gas, σ is about 1 for various solids [30].
Let us consider the thermal contact conductance G C at the membrane/gas interface. By definition, the thermal contact conductance G C is equal to the ratio q C / Δ T C , where q C is the heat flux through the interface [30]. q C is equal to the product of λ and the temperature gradient in the gas near the interface. Δ T C is equal to the product of δ and the temperature gradient in the gas near the interface. Thus, the thermal contact conductance G C is:
G C = λ / δ .
Kennard calculated the energy flux G m a x ( T T t ) from a unit area of a solid in a gas at a constant pressure p , which is the maximum possible heat flux at the solid/gas interface [29,31].
G m a x = ( f + 1 ) k B σ ( 2 σ ) p 2 π m k B T ,
where m and f are the mass and number of degrees of freedom of the gas molecule, respectively. k B = 1.38 · 10−23 J/K is Boltzmann constant [30]. In fact, G m a x is equal to the thermal contact conductance G C =   λ / δ . Indeed, from Equations (2), (5) and (6) we obtain the equality G C = G m a x taking into account the equation for the mean free pass l m f p = ν π m / 2 k B T [32].
Thus, R m a x for an unloaded cell can be estimated as
R m a x = 2 G m a x ( T T t ) ρ m c m d m ,
where d m = 1 μm is the membrane thickness and ρ m c m = 2.3 · 106 J/m3K is the volumetric heat capacity of the membrane at the density ρ m = 3.2 g/cm3 and the specific heat capacity c m = 0.71 J/gK [33]. Suppose T T t = 500 K, σ = 1 for a blackened membrane surface, and r m i n = δ . Then the rate R m a x can be estimated for several gases, see Table 1. A similar Table 2 is represented for σ corresponding to a bright surface. Data on λ , ν , and l m f p for gases are available in [33] and are collected in Table 1, Table 2 and Table 3. The temperature jump distance δ is calculated using Equation (2). The results of measurements of the thermal accommodation parameter of various gasses on several material are summarized in [30]. A significant scatter of these results shows that uncontrolled defects of the material surface also affect the parameter σ [30]. Since our goal is not to accurately calculate the cooling rate, but to estimate the maximum possible rate, we use the available data for bright and blackened surfaces. In fact, σ depends not so much on the material but significantly on the quality of the surface, therefore in Table 2 we use the data available for some bright solid surfaces and several gases [30].
Figure 2 shows the dependence of the rate R on r 0 for different gases, obtained by Equation (8).
R = 2 λ ( T T t ) / r 0 ρ m c m d m .
R increases as 1 / r 0 up to the maximum possible rate corresponding to the maximum possible heat flux G m a x ( T T t ) , see Equation (6). For the estimation of R m a x , the thermal parameters of the gas and membrane are considered independent of temperature. In fact, the heat capacity of the membrane changes insignificantly at temperatures above 300 K [33]. The increase in gas thermal conductivity λ with increasing temperature [33] is compensated by an increase of the temperature jump distance δ . Thus, we get approximately the same R m a x (with an accuracy of about 30%) for thermal parameters corresponding to 600 K; these parameters are available in [33]. The uncertainty in σ (which depends on the surface quality) is more significant. Thus, we obtain an estimate of the maximum possible interfacial thermal conductance ( G m a x ) and the minimum radius ( r m i n δ ) of the hot zone of the membrane.
In fact, it makes no sense to reduce the radius r 0 to less than 1 μm, at least for the most heat-conducting hydrogen and helium gases, see Table 2 and Figure 2b. Thus, a cooling rate 108 K/s is possible at r 0 of about 1 μm. However, the maximum possible cooling rate R m a x is even higher due to the additional heat transfer from the hot zone of the membrane to the periphery of the membrane. Thus, it is necessary to consider the problem of heat transfer for the entire membrane-gas system. Next, we estimate the rate R m a x for helium gas as one of the most suitable and heat-conducting gases at r 0 = 1 μm and different thermal conductivity λ m of the membrane.

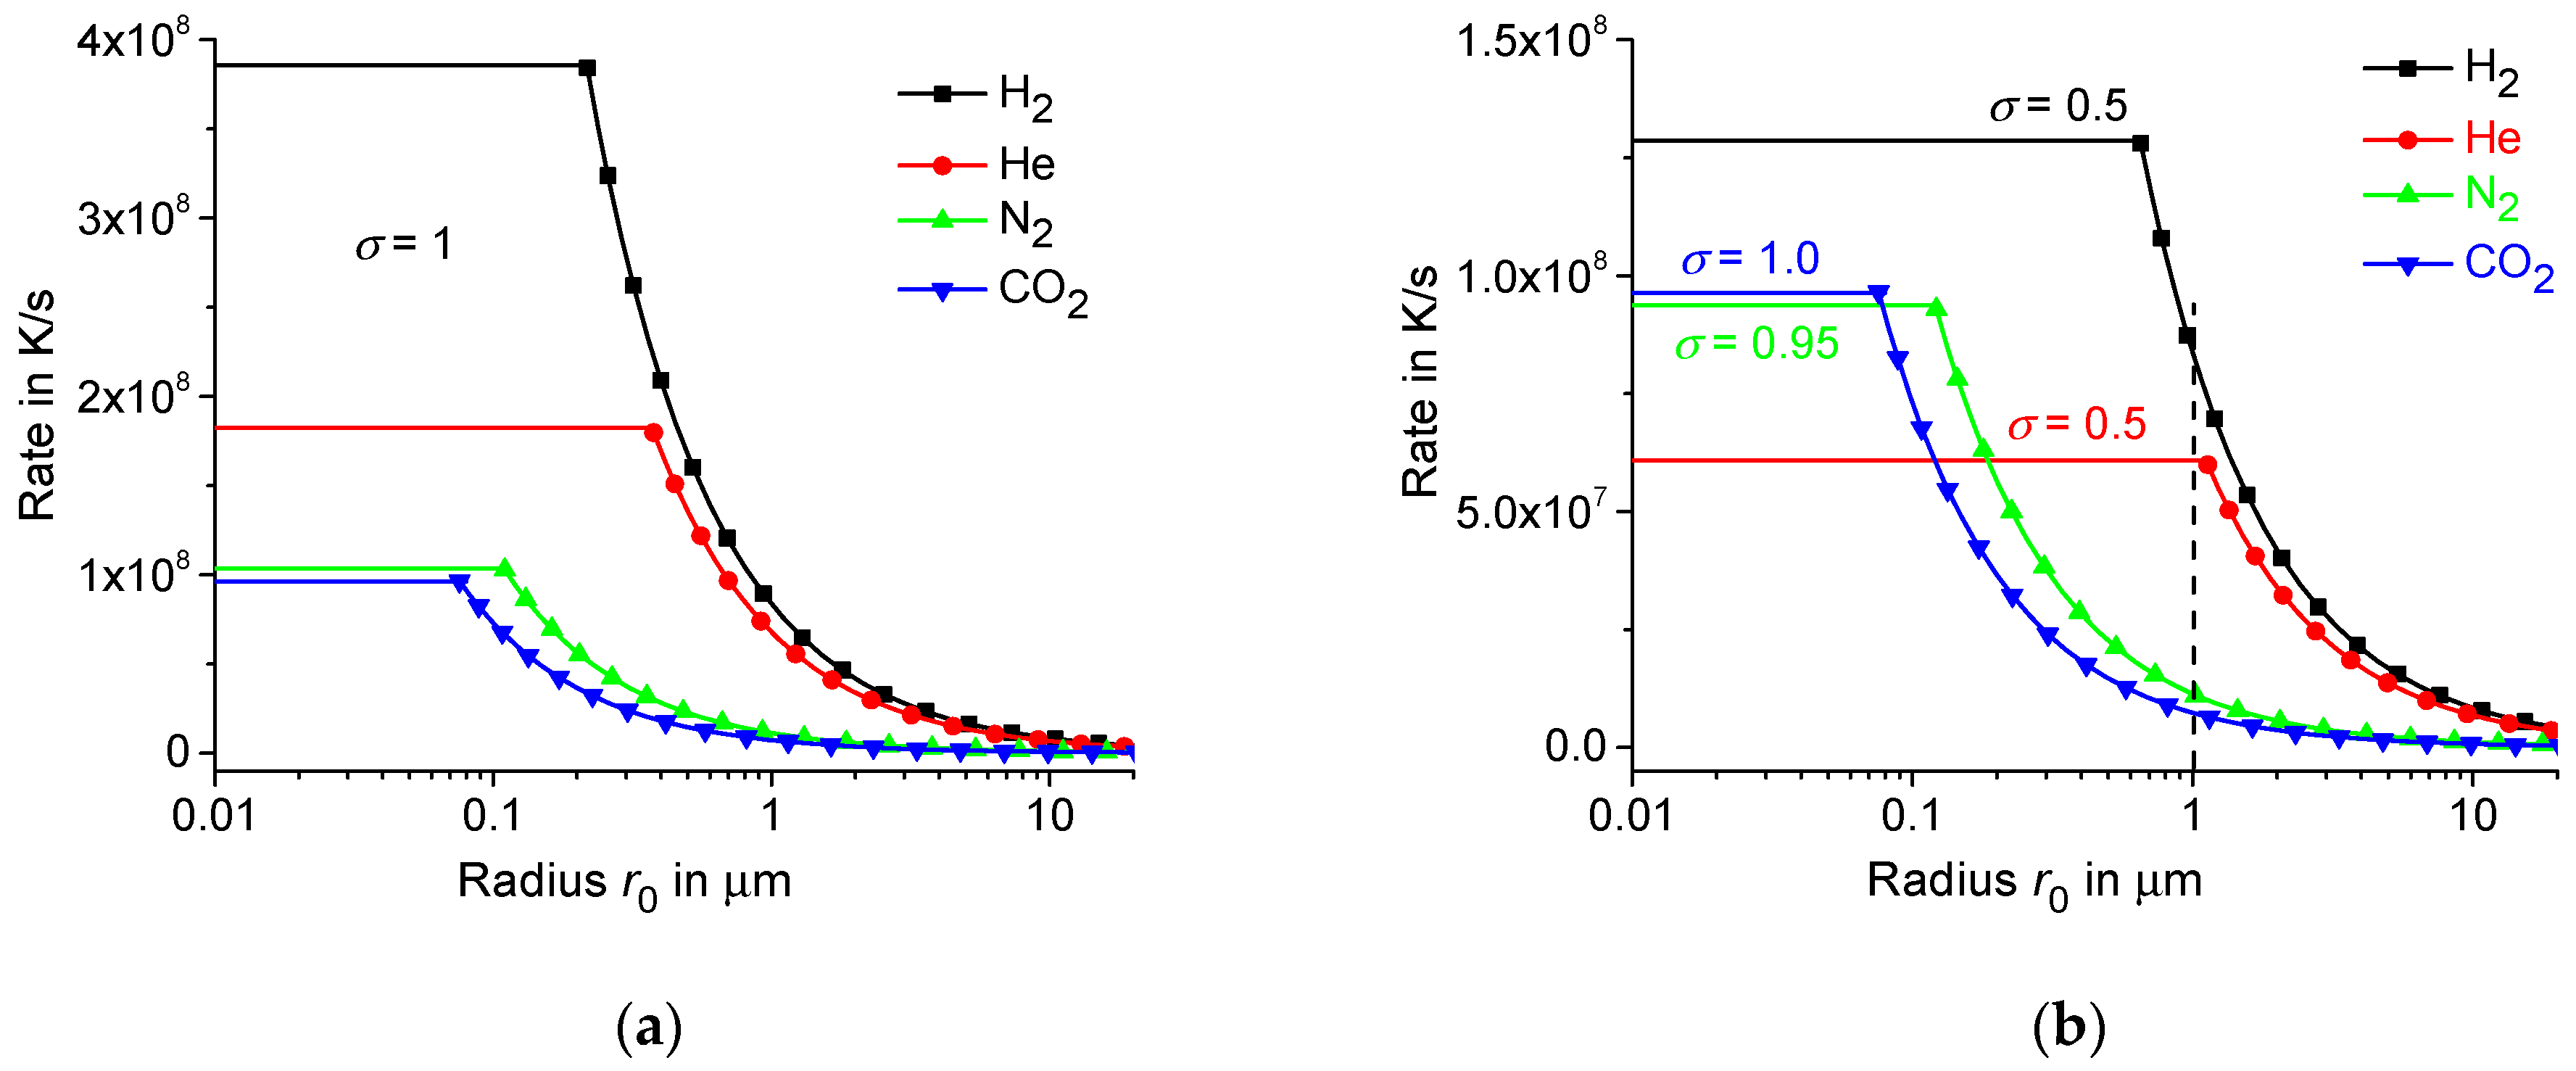
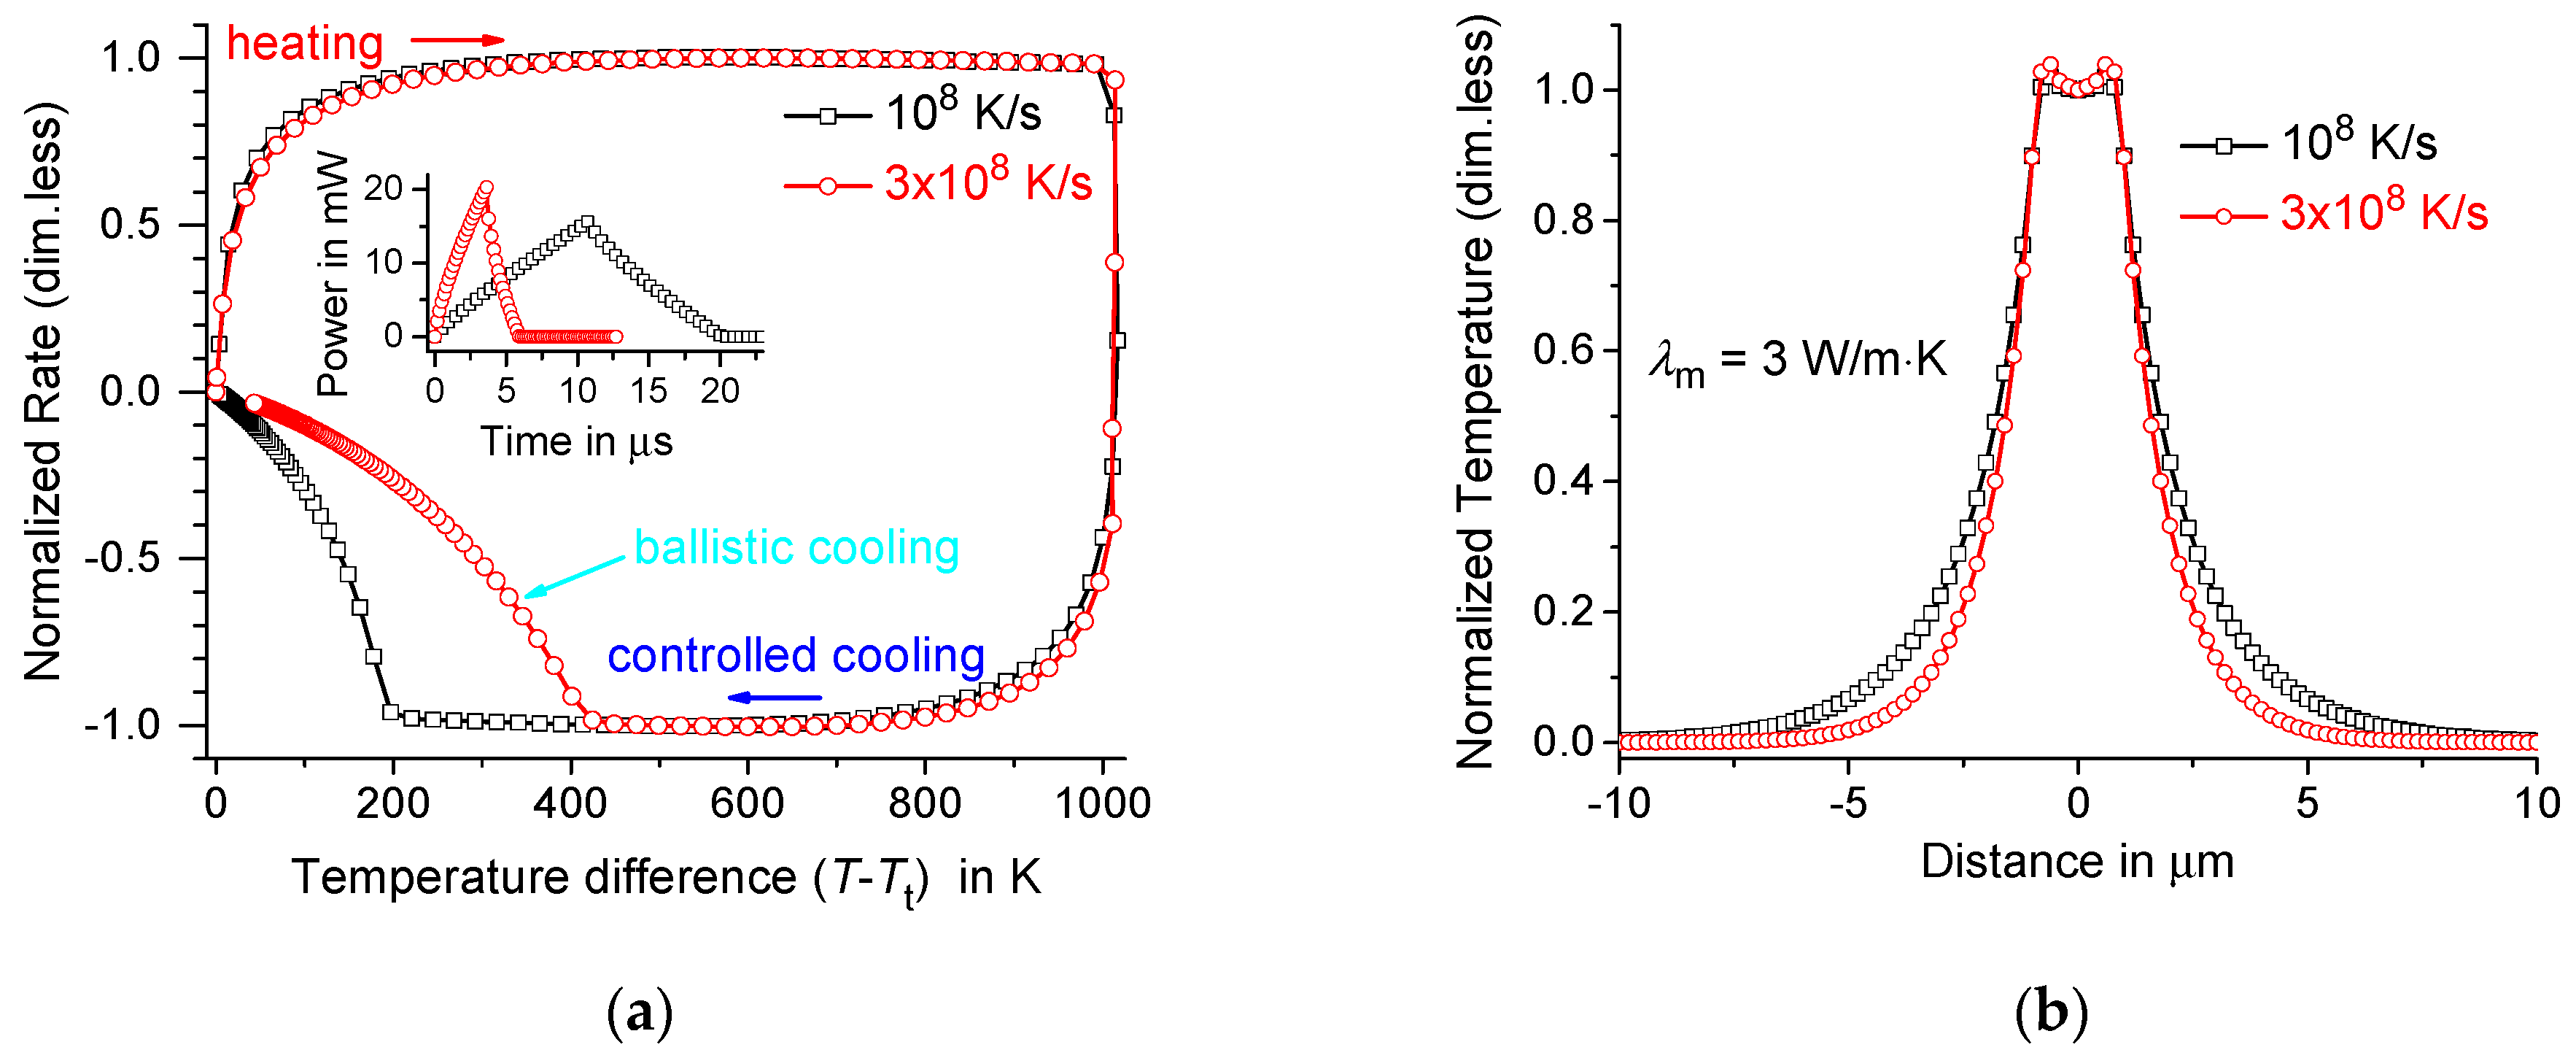
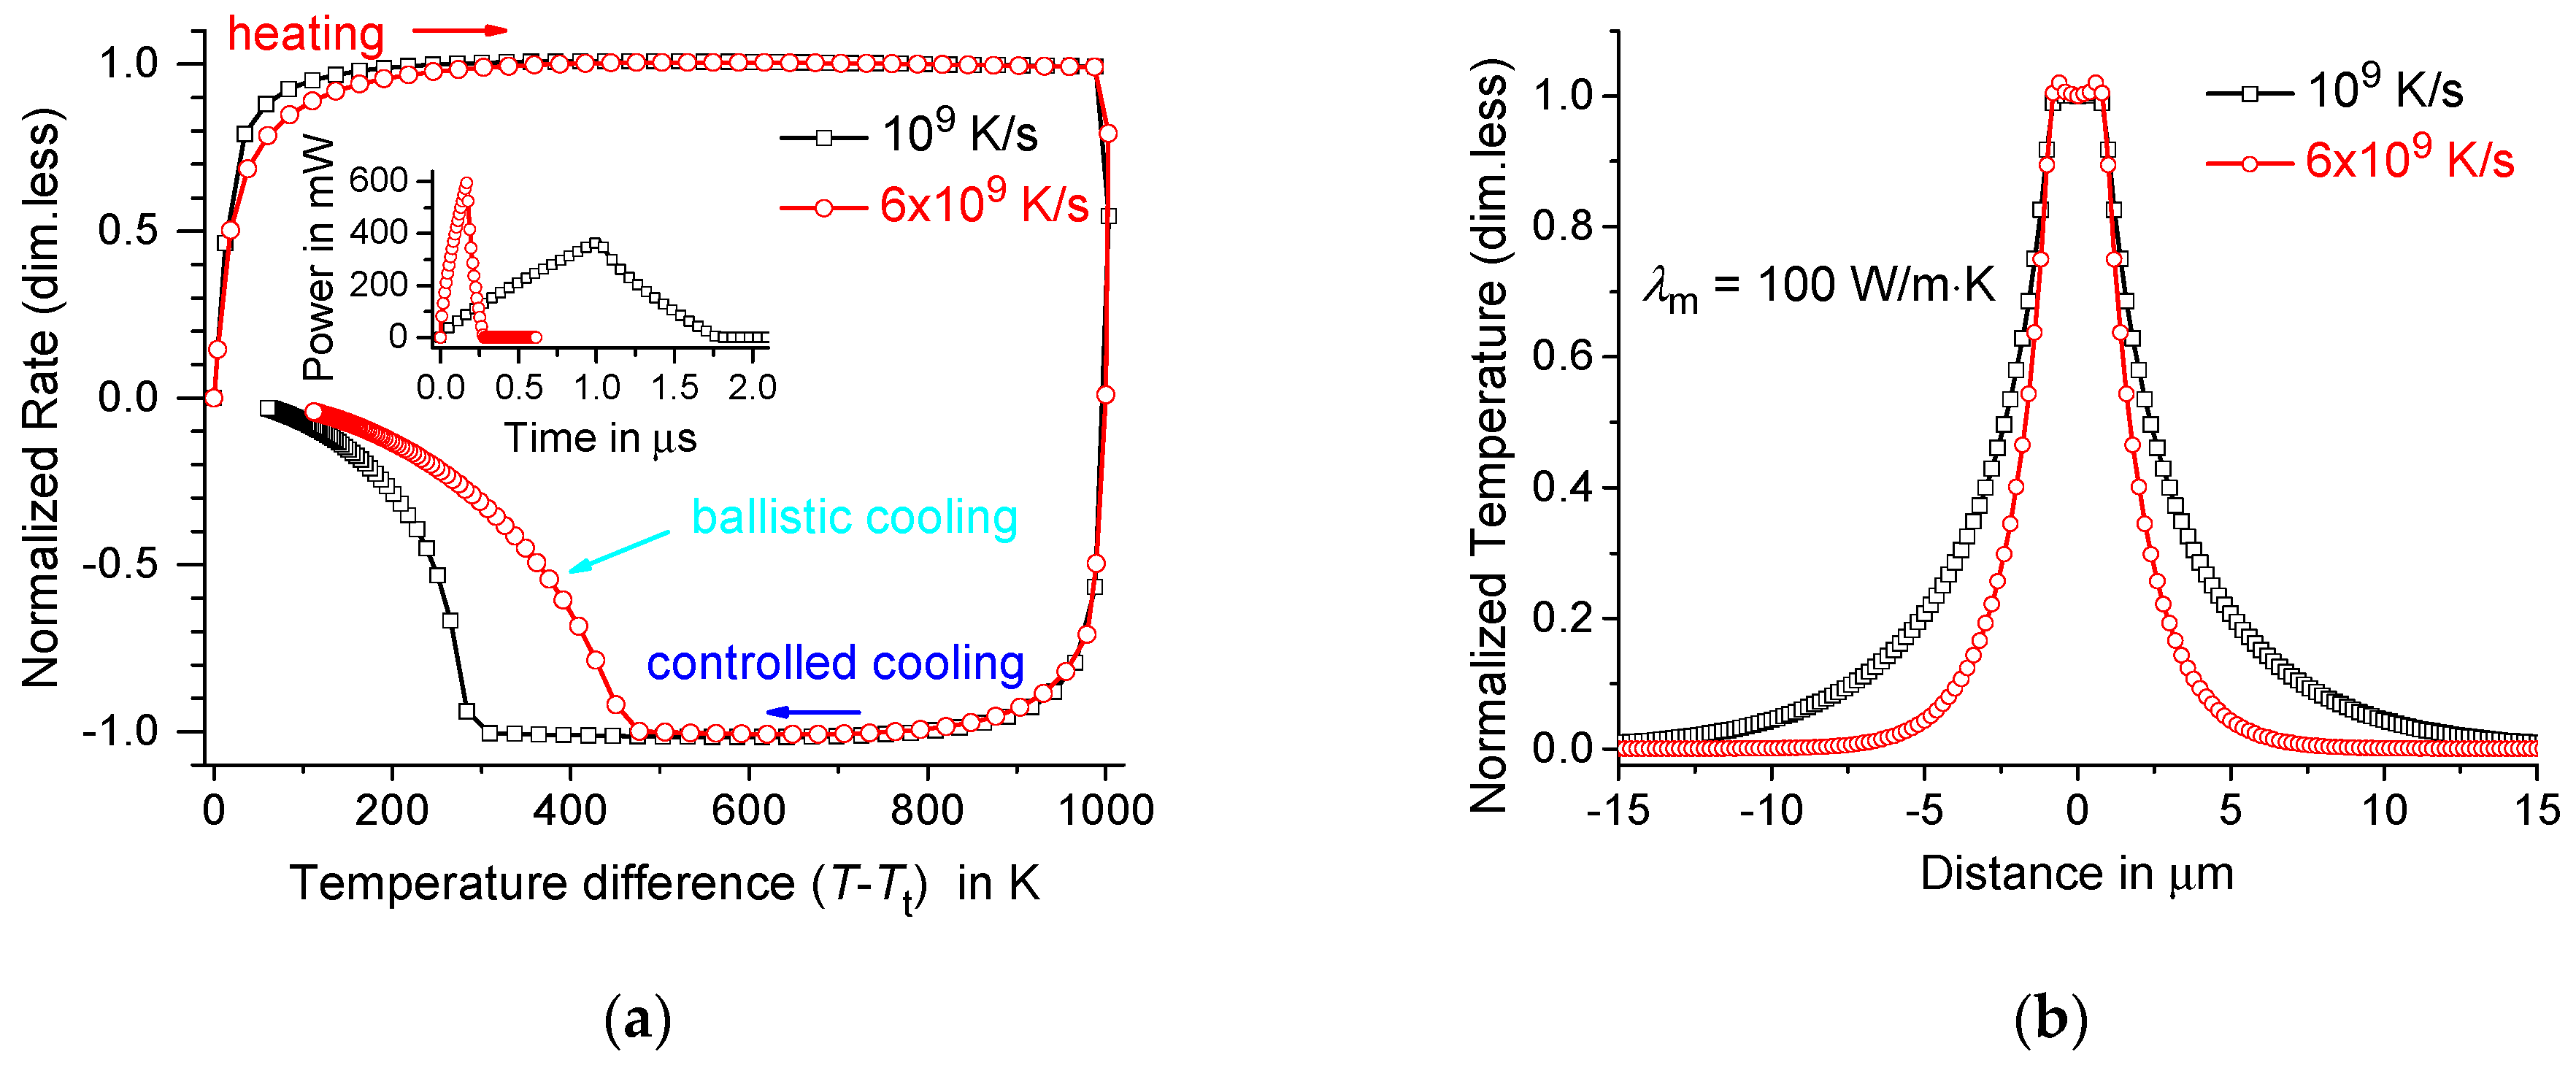
4. Maximum Possible Controlled Cooling Rate in the Membrane-Gas System

Heat in gases is transferred by molecules moving at a speed sufficient to achieve high cooling rates. In fact, a cooling rate of about 108 K/s was achieved in the experiment [23]. The diffusion Fourier heat equation for gasses is a good approximation on a time scale that is much larger than the average time between collisions of gas molecules [28,34]. Denoted by τ m = l m f p / V m the average time between collisions of gas molecules, where V m = 8 k B T / π m is the average velocity of gas molecules [32,33]. In fact, τ m = 0.07 ns, 0.16 ns, and 0.14 ns for hydrogen, helium, and nitrogen gases at V m = 1.78 km/s, 1.26 km/s, and 0.476 km/s, respectively (see Table 3). The thermal perturbation in the gas around the heated region of radius r 0 relaxes during the thermal diffusion time τ D = r 0 2 / D . In fact, τ D = 6.2 ns, 5.3 ns, and 45 ns at D = 1.6 · 10−4 m2/s, 1.9 · 10−4 m2/s, and 2.2 · 10−5 m2/s for hydrogen, helium, and nitrogen gases, respectively, at r 0 = 1 µm. The thermal parameters of the gases are available in [33] and collected in Table 3. Thus, τ D is much longer than the average time between collisions of gas molecules, τ D τ m , and about 102 collisions per molecule occurs during τ D . In this case, the diffusion Fourier heat equation can be used [28,34]. However, the limited rate of relaxation of thermal perturbations in the gas imposes the following limitation on the cooling rate: R < Δ T / τ D , where Δ T is the interval of the temperature scanning. Assume Δ T = 1000 K, then the cooling rate R is limited to about 1.6 · 1011 K/s, 2 · 1011 K/s, and 2 · 1010 K/s for hydrogen, helium, and nitrogen gases, respectively. This limitation is not the most significant. The main restriction is associated with thermal relaxation of the membrane–gas system; this relaxation depends on the heat loss from the membrane, which mainly depends on the thermal conductivity of the gas λ .
Let us consider the temperature distribution T ( t , r ) in the lateral direction of the membrane for a ring-shaped heater. The temperature difference in the z direction is insignificant, since λ is much less than the membrane thermal conductivity λ m . Note that the temperature gradients near the central hot zone in the gas and membrane are approximately the same and equal to ( T T t ) / r 0 . Therefore, ∂T/∂z is about ( λ / λ m )∂T/∂r, as follows from the boundary condition for the heat flux at the membrane/gas interface. Thus, gradients along the z direction in the membrane can be neglected at λ << λ m . In addition, the temperature distribution T ( t , r ) tends to zero at a distance of the order of r 0 , see below. Thus, the shape of the membrane at the periphery does not matter at r r 0 . Therefore, we consider a boundary value problem with a homogeneous boundary condition T ( t , b 0 ) = 0 , where b 0 is the distance from the center of the membrane to the silicon frame, the temperature of which is equal to the temperature of the thermostat, and the temperature T ( t , r ) is measured from T t . Thus, for the membrane–gas system, we have an equation for T ( t , r ) in cylindrical coordinates, see Equation (9). The second term ( T / τ ) on the right-hand side of Equation (9) describes the heat loss from the membrane to the gas.
T t = D m ( 2 T r 2 + 1 r T r ) T τ + Φ ( t , r ) ,
where D m = λ m / ρ m c m is the thermal diffusivity of the membrane, τ = ρ m c m d m / α , α = λ / r 0 , Φ ( t , r ) = H F ( t , r ) / ρ m c m d m , and H F ( t , r ) is the surface density of the heat flux generated by the heater [35]. The solution to the problem can be represented as a series expansion:
T ( t , r ) = n = 1 N J 0 ( μ n r / b 0 ) ψ n ( t ) ,
where J 0 ( μ n r / b 0 ) are the orthogonal Bessel functions of the first kind and of zero order, { μ n } is a monotonously increasing sequence of positive roots of the equation J 0 ( μ n ) = 0 for n = 1 , 2 , 3 , and N is the number of terms in the series expansion sufficient to achieve the required accuracy. Note that the structure within the hot zone can be accurately calculated if the number N is large compared to b 0 / b 1 , where b 1 is the thickness of the thinnest heater structure. Good accuracy can be achieved with N 1000 for b 1 = 1/3 μm and b 0 = 350 μm. Further calculations are performed at N = 2000. In fact, the difference in the results for N = 1000 and 2000 was insignificant.
The functions ψ n ( t ) can be obtained from the Fourier components of Equation (9).
ψ n ( t ) / t + ( τ 1 + τ n 1 ) ψ n ( t ) = B n ( t ) ,
where τ n = 1 / D m ( μ n / b 0 ) 2 and
B n ( t ) = 2 b 0 2 J 1 ( μ n ) 2 0 b 0 J 0 ( μ n r / b 0 ) Φ ( t , r ) r d r .
Consider the solution T ( t , r ) for a ring heater. Suppose Φ ( t , r ) = q ( t ) F ( r ) , where F ( r ) = 1 in the ring r ( r 1 , r 0 ) and F ( r ) = 0 outside this ring. Thus,
B n ( t ) = q ( t ) ρ m c m d m 2 r 0 J 1 ( μ n r 0 / b 0 ) 2 r 1 J 1 ( μ n r 1 / b 0 ) μ n b 0 J 1 ( μ n ) 2 ,
where q ( t ) = P ( t ) / π ( r 0 2 r 1 2 ) and P ( t ) is the heater power. Therefore, with a zero initial condition T ( t , r ) = 0 at t 0 , we obtain a solution to Equation (11):
ψ n ( t ) = 0 t B n ( t ) exp ( ( τ 1 + τ n 1 ) ( t t ) ) d t .
For model calculations, in order to obtain approximately constant heating and cooling rates, we take the power P ( t ) increasing as ( t / t 0 ) β 1 during heating and decreasing as 1 ( ( t t 0 ) / t 1 ) β 2 during cooling, where t 0 and t 1 are the duration of temperature scanning during heating and cooling, respectively, β 1 and β 2 are positive parameters less than 1. Thus, we obtain the temperature distribution T ( t , r ) calculated at R = 108 K/s and 3 · 108 K/s, see Figure 3. The calculations were carried out for helium gas with λ = 0.156 W/m·K at r 0 = 1 μm, r 1 = 2 r 0 / 3 , d m = 1 μm, λ m = 3W/m·K, D m = 1.3 · 10−6 m2/s, ρ m c m = 2.3 · 106 J/m3K, and the scanning temperature range Δ T = 1000 K. The temperature profile T ( t 0 , r ) was calculated at the end of heating for t 0 = 10.8 μs and 3.65 μs at R = 108 K/s and 3 · 108 K/s, respectively.
Thus, controlled cooling is possible at R = 108 K/s and even 3 · 108 K/s. Note that at R = 3 · 108 K/s, ballistic (uncontrolled) cooling begins at some critical temperature difference ( T C T t ) of about 400 K. This critical temperature difference ( T C T t ) increases with increasing R, so that controlled cooling above 5 · 108 K/s is practically impossible, even with a scanning interval as large as Δ T = 1000 K.
However, the controlled cooling rate can be increased by additional heat transfer in a membrane with a higher thermal conductivity λ m . The thermal conductivity λ m can be increased by depositing an additional heat-conducting Au layer on the membrane. This idea was successfully demonstrated on a commercially available chip calorimeter with a hot zone radius r 0 of about 5 µm [23]. A rate of about 108 K/s was achieved in helium gas for a sensor with an additional heat-conducting Au layer on the membrane [23]. In this article, we estimate the maximum possible cooling rate as r 0 decreases. In fact, for an additional Au layer with a thickness d A u and thermal conductivity λ A u = 317 W/m·K [33], we obtain a membrane with λ m = λ A u ( d A u / d 0 ) + λ 0 ( d / d 0 ) in the lateral direction of the membrane, where d 0 is the thickness of the silicon nitride layer. Suppose d 0 = 0.8 µm and d A u = 0.4 µm, then d m = 1.2 μm, λ m = 100 W/m·K, and the average volumetric heat capacity of the membrane is ρ m c m = 2.4 · 106 J/m3K at ρ A u c A u = 2.5 · 106 J/m3K for Au [33]. In this case, controlled cooling is possible at R = 109 K/s and even at 6 · 109 K/s, see Figure 4. The calculations were carried out for helium gas with λ = 0.156 W/m·K at r 0 = 1 μm, r 1 = 2 r 0 / 3 , d m = 1.2 μm, λ m = 100 W/m·K, D m = 4.2 · 10−5 m2/s, ρ m c m = 2.4 · 106 J/m3K, and Δ T = 1000 K. The temperature profile T ( t 0 , r ) was calculated at the end of heating for t 0 = 1.03 μs and 0.177 μs at R = 109 K/s and 6 · 109 K/s, respectively.
The maximum possible rate of controlled cooling can be even higher if the heater is uniformly distributed over the entire hot zone for r ( 0 , r 0 ) . However, in this case, the temperature profile in the middle of the hot zone is not as flat as in the case of the ring heater, see Figure 4 and Figure 5. Controlled cooling is possible at R = 109 K/s, 6 · 109 K/s, and even 1010 K/s, see Figure 5. The calculations were carried out for helium gas with λ = 0.156 W/m·K at r 0 = 1 μm, d m = 1.2 μm, λ m = 100 W/m·K, D m = 4.2 · 10−5 m2/s, ρ m c m = 2.4 · 106 J/m3K, and Δ T = 1000 K. The temperature profile T ( t 0 , r ) was calculated at the end of heating for t 0 = 1.03 μs, 0.175 μs, and 0.105 μs at R = 109 K/s, 6 · 109 K/s, and 1010 K/s, respectively.

5. Conclusions

The controlled maximum possible cooling rate is limited due to the fundamental heat transfer limitation associated with the thermal resistance at the membrane/gas interface. Heat losses from the membrane due to thermal conductivity λ of the surrounding gas are proportional to the heat transfer parameter α = λ / r 0 , which increases with decreasing of the radius of the membrane hot zone r 0 if L t r 0 l m f p . However, the possibility of decreasing the radius r 0 is limited by the temperature jump distance δ . Thus, it makes no sense to reduce the radius r 0 to less than 1 μm, at least for the most heat-conducting gases hydrogen and helium. In fact, this limitation is associated with the maximum possible value of the heat flux G m a x ( T T t ) at the membrane/gas interface, where the maximum interfacial thermal conductance G m a x is about 0.9 MW/m2K and 0.42 MW/m2K for a blackened membrane ( σ = 1 ) and the most heat-conducting gases hydrogen and helium, respectively. Thus, for a free blackened membrane, the maximum cooling rate 2 G m a x ( T T t ) / ( ρ m c m d m ) is about 3.9 · 108 K/s and 1.8 · 108 K/s at ( T T t ) = 500 K for hydrogen and helium gases, respectively. Solving the heat transfer problem for the complete membrane-gas system, we find that the maximum possible controlled cooling rate is about 3 · 108 K/s for a silicon nitride membrane with a thickness of 1 μm in helium gas. However, the controlled cooling rate can be increased using the combined membrane with a higher thermal conductivity. Thus, a controlled cooling rate of the order of billions of K/s (up to 1010 K/s) is possible for helium gas, r 0 = 1 μm, and ( T T t ) = 1000 K.

Author Contributions

Conceptualization, A.A.M.; formal analysis, A.A.M.; funding acquisition, C.S.; methodology, A.A.M.; supervision, C.S.; visualization, A.A.M.; writing—original draft, A.A.M.; writing—review and editing, C.S. Both authors have read and agreed to the published version of the manuscript.

Funding

This research was funded by the Ministry of Education and Science of the Russian Federation, grant number 14.Y26.31.0019. The APC was funded by Deutsche Forschungsgemeinschaft and Universität Rostock within the funding program Open Access Publishing.

Institutional Review Board Statement

Not applicable.

Informed Consent Statement

Not applicable.

Data Availability Statement

The datasets generated during and/or analyzed during the current study are available from the corresponding author on reasonable request.

Acknowledgments

CS acknowledges financial support from the Ministry of Education and Science of the Russian Federation grant 14.Y26.31.0019.

Conflicts of Interest

The authors declare no conflict of interest.

Nomenclature

Latin Symbols
b 0 distance from the center to the periphery of the membrane (m)
c p , c m specific heat of gas and membrane at constant p (J/kgK)
D , D m thermal diffusivity of gas and membrane (m2/s)
d m membrane thickness (m)
f number of degrees of freedom of a gas molecule (dimensionless)
g acceleration of gravity (m/s2)
G C thermal contact conductance (W/m2K)
G m a x membrane/gas maximum thermal conductance (W/m2K)
G r Grashof number (dimensionless)
k B Boltzmann constant (J/K)
l m f p mean-free-path (m)
L t distance from the membrane hot zone to the thermostat (m)
m mass of a gas molecule (kg)
N u Nusselt number (dimensionless)
P r Prandtl number (dimensionless)
p pressure (Pa)
P ( t ) heater power (W)
q C heat flux through thermal contact (W/m2)
R ( t ) temperature scan rate (K/s)
R m a x maximum possible cooling rate (K/s)
r 0 radius of the hot zone of the membrane (m)
r m i n minimum radius of the hot zone (m)
t 0 scan duration on heating (s)
T t thermostat temperature (K)
T C T t critical temperature difference of controlled cooling (K)
V m average velocity of gas molecules (m/s)
Greek Symbols
α heat transfer coefficient W/m2K
α C convective contribution to the heat transfer coefficient W/m2K
α r radiative contribution to the heat transfer coefficient W/m2K
γ heat capacity ratio (dimensionless)
δ temperature jump distance (m)
Δ T scanning temperature range (K)
Δ T C temperature jump at the membrane/gas contact (K)
ε membrane emissivity (dimensionless)
λ ,   λ m thermal conductivity of gas and membrane (W/K · m)
ν kinematic viscosity of gas (m2/s)
ρ ,   ρ m density of gas and membrane (kg/m3)
σ thermal accommodation coefficient (dimensionless)
σ r Stefan-Boltzmann constant (W/m2K4)
τ time constant (s)
τ D thermal diffusion time (s)
τ m average time between collisions (s)
τ n time constant of nth component (s)
Φ ( t , r ) reduced heat flux (K/s)
ψ n ( t ) nth Fourier component (K)

Appendix A. Radiative and Convective Contributions to Membrane Heat Loss

The radiative contribution to the heat transfer coefficient is α r = ε σ t ( T 4 T t 4 ) / ( T T t ) , where the Stefan-Boltzmann constant σ r = 5.67 · 10−8 W/(m2K4) [33] and the emissivity of the silicon nitride membrane ε 0.2 [36,37]. Therefore, α r = 16 W/(m2K) at T = 1000 K and T t = 300 K. Thus, α r / α is about 0.01% at α = λ / r 0 , which is about 1.56 · 105 W/(m2K) for helium gas λ = 0.156 W/m·K and r 0 = 1 µm. Then α r is negligible compared to α .
The convective component α C of the heat losses from the membrane decreases with a decrease in the characteristic length of the problem [21,22,35]. Convective heat losses arise due to the temperature dependence of the gas density in the gravitational field in the presence of temperature gradients. The ratio α C / α is equal to the Nusselt number N u = ( G r ) 1 / 4 f ( P r ) [38]. The Prandtl number P r and f ( P r ) . for gases are about 1 [33,38]. The Grashof number G r = r 0 3 g ν 2 ( T T t ) T [38], where g is the acceleration due to gravity. Thus, the Nusselt number N u decreases as r 0 3 / 4 with decreasing r 0 . In fact, ( G r ) 1 / 4 is about or less than ( r 0 3 g / ν 2 ) 0.25 = 5 · 10−3 at r 0 = 1 µm and ν = 1.24 · 10−4 m2/s [33], that is, N u < 0.005. Convective heat loss only acts on the upper side of the membrane. However, heat losses due to thermal conductivity λ of the surrounding gas act on both sides of the membrane. Thus, the convective contribution to the membrane heat loss N u / 2 α is about 0.25% for r 0 = 1 µm.

References

  1. Lai, S.L.; Guo, J.Y.; Petrova, V.; Ramanath, G.; Allen, L.H. Size-dependent melting properties of small tin particles: Nanocalorimetric measurements. Phys. Rev. Lett. 1996, 77, 99–102. [Google Scholar] [CrossRef] [Green Version]
  2. Zhang, M.; Efremov, M.Y.; Schiettekatte, F.; Olson, E.A.; Kwan, A.T.; Lai, S.L.; Wisleder, T.; Greene, J.E.; Allen, L.H. Size-dependent melting point depression of nanostructures: Nanocalorimetric measurements. Phys. Rev. B 2000, 62, 10548–10557. [Google Scholar] [CrossRef] [Green Version]
  3. Efremov, M.Y.; Olson, E.A.; Zhang, M.; Lai, S.L.; Schiettekatte, F.; Zhang, Z.S.; Allen, L.H. Thin-film differential scanning nanocalorimetry: Heat capacity analysis. Thermochim. Acta 2004, 412, 13–23. [Google Scholar] [CrossRef]
  4. Zhang, M.; Wen, J.G.; Efremov, M.Y.; Olson, E.A.; Zhang, Z.S.; Hu, L.; de la Rama, L.P.; Kummamuru, R.; Kavanagh, K.L.; Ma, Z.; et al. Metastable phase formation in the Au-Si system via ultrafast nanocalorimetry. J. Appl. Phys. 2012, 111, 093516. [Google Scholar] [CrossRef]
  5. De La Rama, L.P.; Hu, L.; Ye, Z.; Efremov, M.Y.; Allen, L.H. Size effect and odd-even alternation in the melting of single and stacked AgSC n layers: Synthesis and nanocalorimetry measurements. J. Am. Chem. Soc. 2013, 135, 14286–14298. [Google Scholar] [CrossRef]
  6. Molina-Ruiz, M.; Lopeandía, A.F.; González-Silveira, M.; Anahory, Y.; Guihard, M.; Garcia, G.; Clavaguera-Mora, M.T.; Schiettekatte, F.; Rodríguez-Viejo, J. Formation of Pd2Si on single-crystalline Si (100) at ultrafast heating rates: An in-situ analysis by nanocalorimetry. Appl. Phys. Lett. 2013, 102, 143111. [Google Scholar] [CrossRef] [Green Version]
  7. Ye, Z.; De La Rama, L.P.; Hu, L.; Efremov, M.Y.; Allen, L.H. Nanocalorimetry study of the evolution of melting characteristics of single layer silver alkanethiolate lamella: Fast heating/cooling and electrical annealing. Thermochim. Acta 2015, 603, 69–78. [Google Scholar] [CrossRef]
  8. Ye, Z.; De La Rama, L.P.; Efremov, M.Y.; Zuo, J.M.; Allen, L.H. Approaching the size limit of organometallic layers: Synthesis and characterization of highly ordered silver-thiolate lamellae with ultra-short chain lengths. Dalton Trans. 2016, 45, 18954–18966. [Google Scholar] [CrossRef] [PubMed]
  9. Ye, Z.; De La Rama, L.P.; Efremov, M.Y.; Sutrisno, A.; Allen, L.H. Critical Size for Bulk-to-Discrete Transition in 2D Aliphatic Layers: Abrupt Size Effect Observed via Calorimetry and Solid-State 13C NMR. J. Phys. Chem. C 2017, 121, 13916–13929. [Google Scholar] [CrossRef]
  10. Schick, C.; Mathot, V. Fast Scanning Calorimetry; Springer: Cham, Switzerland, 2016. [Google Scholar] [CrossRef]
  11. Yi, F.; LaVana, D.A. Nanocalorimetry: Exploring materials faster and smaller. Appl. Phys. Rev. 2019, 6, 031302. [Google Scholar] [CrossRef]
  12. Monnier, X.; Napolitano, S.; Cangialosi, D. Direct observation of desorption of a melt of long polymer chains. Nat. Commun. 2020, 11, 4354. [Google Scholar] [CrossRef]
  13. Monnier, X.; Marina, S.; Lopez de Pariza, X.; Sardón, H.; Martin, J.; Cangialosi, D. Physical Aging Behavior of a Glassy Polyether. Polymers 2021, 13, 954. [Google Scholar] [CrossRef] [PubMed]
  14. Gao, Y.; Zhao, B.; Vlassak, J.J.; Schick, C. Reprint of: Nanocalorimetry: Door opened for in situ material characterization under extreme non-equilibrium conditions. Prog. Mater. Sci. 2021, 120, 100819. [Google Scholar] [CrossRef]
  15. Simon, C.; Gao, J.; Mao, Y.; Wilde, G. Fast scanning calorimetric study of nucleation rates and nucleation transitions of Au-Sn alloys. Scr. Mater. 2017, 139, 13–16. [Google Scholar] [CrossRef]
  16. Mileva, D.; Wang, J.; Gahleitner, M.; Jariyavidyanont, K.; Androsch, R. New Insights into Crystallization of Heterophasic Isotactic Polypropylene by Fast Scanning Chip Calorimetry. Polymers 2020, 12, 1683. [Google Scholar] [CrossRef] [PubMed]
  17. Yang, B.; Peng, Q.; Milkereit, B.; Springer, A.; Liu, D.; Rettenmayr, M.; Schick, C.; Keßler, O. Nucleation behaviour and microstructure of single Al-Si12 powder particles rapidly solidified in a fast scanning calorimeter. J. Mater. Sci. 2021, 56, 12881–12897. [Google Scholar] [CrossRef]
  18. Zhang, R.; Du, M.; Zhuravlev, E.; Androsch, R.; Schick, C. Surface crystal nucleation and growth in poly (ε-caprolactone): Atomic force microscopy combined with fast scanning chip calorimetry. Polymers 2021, 13, 2008. [Google Scholar] [CrossRef]
  19. Lapuk, S.E.; Mukhametzyanov, T.A.; Schick, C.; Gerasimov, A.V. Crystallization kinetics and glass-forming ability of rapidly crystallizing drugs studied by Fast Scanning Calorimetry. Int. J. Pharm. 2021, 599, 120427. [Google Scholar] [CrossRef]
  20. Lee, D.; Zhao, B.; Perim, E.; Zhang, H.; Gong, P.; Gao, Y.; Liue, Y.; Toher, C.; Curtarolo, S.; Schroers, J.; et al. Crystallization behavior upon heating and cooling in Cu50Zr50 metallic glass thin films. Acta Mater. 2016, 121, 68–77. [Google Scholar] [CrossRef] [Green Version]
  21. Minakov, A.; Morikawa, J.; Zhuravlev, E.; Ryu, M.; Schick, C. Thermal contact conductance at melting and crystallization of metal micro-droplets. Mater. Res. Express 2020, 7, 066524. [Google Scholar] [CrossRef]
  22. Minakov, A.; Morikawa, J.; Ryu, M.; Zhuravlev, E.; Schick, C. Variations of interfacial thermal conductance at melting and crystallization of an indium micro-particle in contact with a solid. Mater. Des. 2021, 201, 109475. [Google Scholar] [CrossRef]
  23. Minakov, A.; Morikawa, J.; Zhuravlev, E.; Ryu, M.; van Herwaarden, A.W.; Schick, C. High-speed dynamics of temperature distribution in ultrafast (up to 10^8 K/s) chip-nanocalorimeters, measured by infrared thermography of high resolution. J. Appl. Phys. 2019, 125, 054501. [Google Scholar] [CrossRef]
  24. Minakov, A.A.; van Herwaarden, A.W.; Wien, W.; Wurm, A.; Schick, C. Advanced non-adiabatic ultrafast nanocalorimetry and superheating phenomenon in linear polymers. Thermochim. Acta 2007, 461, 96–106. [Google Scholar] [CrossRef]
  25. Minakov, A.A.; Schick, C. Ultrafast thermal processing and nanocalorimetry at heating and cooling rates up to 1 MK/s. Rev. Sci. Instr. 2007, 78, 073902–073910. [Google Scholar] [CrossRef] [PubMed]
  26. Minakov, A.A.; Schick, C. Dynamics of the temperature distribution in ultra-fast thin-film calorimeter sensors. Thermochim. Acta 2015, 603, 205–217. [Google Scholar] [CrossRef]
  27. Zhuravlev, E.; Schick, C. Fast scanning power compensated differential scanning nano-calorimeter: 1. The device. Thermochim. Acta 2010, 505, 1–13. [Google Scholar] [CrossRef]
  28. Landau, L.D.; Lifshitz, E.M. Course of Theoretical Physics 10: Physical Kinetics, 1st ed.; Pergamon Press: Oxford, UK; Frankfurt, Germany, 1981. [Google Scholar] [CrossRef]
  29. Kennard, E.H. Kinetic Theory of Gases. In With an Introduction to Statistical Mechanics; McGraw-Hill Book Company, Inc.: New York, NY, USA; London, UK, 1938. [Google Scholar] [CrossRef]
  30. Madhusudana, C.V. Thermal Contact Conductance. Mechanical Engineering Series, 2nd ed.; Springer: Cham, Switzerland, 2014. [Google Scholar]
  31. Liang, Z.; Evans, W.; Keblinski, P. Equilibrium and nonequilibrium molecular dynamics simulations of thermal conductance at solid-gas interfaces. Phys. Rev. E 2013, 87, 022119. [Google Scholar] [CrossRef] [PubMed]
  32. Vincenti, W.G.; Kruger, C.H. Introduction to Physical Gas Dynamics; Wiley: New York, NY, USA, 1965. [Google Scholar]
  33. Lide, D.R. Crc Handbook of Chemistry and Physics, 90th ed.; CRC Press: Boca Raton, FL, USA, 2010. [Google Scholar]
  34. Zhang, Z.M. Nano/Microscale Heat Transfer, 2nd ed.; Springer International Publishing: Singapore, 2020; ISBN 978-3-030-45039-7. [Google Scholar] [CrossRef]
  35. Minakov, A.A. Temperature gradients in ultrafast thin-film nanocalorimetry. Thermochim. Acta 2019, 677, 32–41. [Google Scholar] [CrossRef]
  36. Jacquot, A.; Chen, G.; Scherrer, H.; Dauscher, A.; Lenoir, B. Improvements of on-membrane method for thin-film thermal conductivity and emissivity measurements. Sens. Actuators A Phys. 2005, 117, 203–210. [Google Scholar] [CrossRef]
  37. Van Zwol, P.J.; Vles, D.F.; Voorthuijzen, W.P.; Peter, M.; Vermeulen, H.; Van der Zande, W.J.; Sturm, J.M.; van der Kruijs, R.W.E.; Bijkerk, F. Emissivity of freestanding membranes with thin metal coatings. J. Appl. Phys. 2015, 118, 213107. [Google Scholar] [CrossRef]
  38. Landau, L.D.; Lifshitz, E.M. Course of Theoretical Physics 6: Fluid Mechanics, 2nd ed.; Butterworth–Heinemann: Oxford, UK, 2000. [Google Scholar]
Figure 1. Schematic sectional view of a membrane-based nanocalorimeter, not to scale.
Applsci 11 08224 g001
Figure 2. Possible cooling rate R vs. the radius r 0 of the hot zone for blackened (a) and bright (b) membrane surfaces for different gases.
Applsci 11 08224 g002
Figure 3. Normalized scanning rate T / t vs. temperature at the center of the membrane for the power P ( t ) shown in the inset (a) and the temperature profile T ( t 0 , r ) (b) for R = 108 K/s and 3 · 108 K/s—black squares and red circles, respectively. The heater acts uniformly in the ring r ( r 1 , r 0 ) at r 1 = 2 r 0 / 3 . Thermal conductivity of the membrane λ m = 3 W/m·K.
Applsci 11 08224 g003
Figure 4. Normalized scanning rate T / t vs. temperature in the center of the membrane for the power P ( t ) shown in the inset (a) and the temperature profile T ( t 0 , r ) (b) for R = 109 K/s and 6 · 109 K/s—black squares and red circles, respectively. The heater acts uniformly in the ring r ( r 1 , r 0 ) at r 1 = 2 r 0 / 3 . Thermal conductivity of the membrane λ m = 100 W/m·K.
Applsci 11 08224 g004
Figure 5. Normalized scanning rate T / t vs. temperature in the center of the membrane for the power P ( t ) shown in the inset (a) and the temperature profile T ( t 0 , r ) (b) for R = 109 K/s, 6 · 109 K/s, and 1010 K/s—black squares, red circles, and green crosses, respectively. The heater acts uniformly in the disk r ( 0 , r 0 ) . Thermal conductivity of the membrane λ m = 100 W/m·K.
Applsci 11 08224 g005
Table 1. Thermal and contact parameters of gases for a blackened membrane at 300 K and 105 Pa.
GasNumber of Degrees of Freedom of Gas MoleculesMean Free Path of Gas MoleculesTemperature Jump DistanceThermal ConductivityMaximum Possible ParameterMaximum Interfacial Thermal ConductanceMaximum Cooling Rate
f l m f p δ λ α = λ r m i n G m a x R m a x
DimensionlessμmμmW/m·KMW/m2KMW/m2KK/s
H250.1260.210.1920.900.903.9 · 108
He30.2000.380.1560.410.421.8 · 108
N250.0680.110.0260.240.241.04 · 108
CO260.0450.070.0170.220.220.96 · 108
Table 2. Thermal and contact parameters of gases for a bright membrane at 300 K and 105 Pa.
GasThermal Accom-Modation CoefficientMean Free Path of Gas MoleculesTemperature Jump DistanceThermal ConductivityMaximum Possible ParameterMaximum Interfacial Thermal ConductanceMaximum Cooling Rate
σ l m f p δ λ α = λ r m i n G m a x R m a x
DimensionlessμmμmW/m·KMW/m2KMW/m2KK/s
H20.70.1260.400.1920.480.482.1 · 108
H20.50.1260.640.1920.300.301.3 · 108
N20.950.0680.120.0260.210.220.9 · 108
He0.50.2001.130.1560.140.140.6 · 108
Table 3. Thermal parameters of gases at 300 K and 105 Pa.
GasMean Free PathThermal DiffusivityThermal Diffusion Time Average Velocity of Gas Molecules Average Time between Collisions
l m f p D τ D = r 0 2 / D V m = 8 k B T / π m τ m = l m f p / V m
μmm2/sskm/ss
H20.1261.6 · 10−46.2 · 10−91.780.7 · 10−10
He0.2001.9 · 10−45.3 · 10−91.261.6 · 10−10
N20.0682.2 · 10−545 · 10−90.4761.4 · 10−10
Publisher’s Note: MDPI stays neutral with regard to jurisdictional claims in published maps and institutional affiliations.

