Article

Time–Frequency Domain Characteristics of Acoustic Emission Signals and Critical Fracture Precursor Signals in the Deep Granite Deformation Process

1
College of Civil and Resource Engineering, University of Science and Technology Beijing, Beijing 100083, China
2
Beijing Key Laboratory of Urban Underground Space Engineering, University of Science and Technology Beijing, Beijing 100083, China
*
Authors to whom correspondence should be addressed.
Appl. Sci. 2021, 11(17), 8236; https://doi.org/10.3390/app11178236
Submission received: 14 July 2021 / Revised: 29 August 2021 / Accepted: 31 August 2021 / Published: 5 September 2021
(This article belongs to the Special Issue Advanced Support Technologies in Roadway)

Abstract

:

Featured Application

This article describes the frequency-domain characteristics of acoustic emission signals of granite in ultra-deep gold mine.

Abstract

To study the crack evolution law and failure precursory characteristics of deep granite rocks in the process of deformation and failure under high confining pressure, granite samples obtained from a depth of 1150 m are tested using a TAW-2000 triaxial hydraulic servo testing machine and a PCI-II acoustic emission monitoring system. Based on the stress–strain curve and IET function, the loading process of the sample is divided into five stages: crack closure, linear elastic deformation, microcrack generation and development, macroscopic fracture generation and energy surge, and post-peak failure. The evolution trend and fracture evolution law of the acoustic emission signal event interval function in different stages are analyzed. In particular, the signals with an amplitude greater than 85 dB, a peak frequency greater than 350 kHz, and a frequency centroid greater than 275 kHz are defined as the failure precursor signals before the rock reaches the peak stress. The defined precursor signal conditions agree well with the experimental results. The time–frequency analysis and wavelet packet decomposition of the precursor signal are performed on the extracted characteristic signal of the failure precursor. The results show that the time-domain signal is in the form of a continuous waveform, and the frequency-domain waveform has multi-peak coexistence that is mainly concentrated in the high-frequency region. The energy distribution obtained by the wavelet packet decomposition of the characteristic signal is verified with the frequency-domain waveform. The energy distribution of the signal is mainly concentrated in the 343.75–375 kHz frequency band, followed by the 281.25–312.5 kHz frequency band. The energy proportion of the high-frequency signal increases with the confining pressure.

1. Introduction

The rapid developments of science and technology, the increasing energy demand, and hundreds of years of exploitation are presently leading to the gradual exhaustion of energy resources on the earth’s surface [1]. Theoretically, the available metallogenic space in the earth’s interior is distributed from the surface to 10,000 m below the surface. To cater to the requirements of social development, deep mining on the earth is a strategic scientific and technological matter that calls for research focus [2]. The deep rock exists in an environment of high temperature, geostress, and pore water pressure, and its microstructure and macroscopic properties largely differ from those of shallow rock [3]. In the deep mining process, specific damage phenomena such as rockburst and spalling may occur [4,5]. To ensure the safety and stability of deep rock mass in the mining process, investigating the development law of crack initiation, propagation, and failure in deep rocks during loading is beneficial to understand the change law of deep rocks and obtain the rock failure precursor information in actual construction [6].
Solid materials such as rocks store strain energy in their internal structures. When rocks are subjected to external loads, their internal strain energy will be released rapidly in the form of elastic waves, referred to as acoustic emission (AE) [7,8,9]. AE information analysis methods in the rock fracture process mainly include parameter analysis and waveform analysis. Parameter analysis is the most commonly used AE signal analysis method [10,11,12,13,14,15,16,17]. Typical AE parameters include event number, absolute energy, duration, and rise time. In addition to these basic parameters, b-value [18,19,20], average frequency (AF) value (AE counts/duration), and RA value (rise time/amplitude) [21,22,23] can also represent the failure mode and damage process of rocks or concrete materials. However, parameter analysis only provides a simple description of waveform characteristics. By comparison, waveform analysis is an in-depth analysis based on the time–frequency domain of the signal and explains the failure mechanism and precursors from the waveform spectrum characteristics of the signal. In recent years, waveform analysis has been studied extensively. Xu used Fourier transform to analyze microseismical signals and concluded that the rockburst signal is the superposition of low-frequency and high-frequency signals [24]. D.g.aggelis discussed the acoustic emission characteristics of different fracture modes and concluded that tensile failure signals prefer higher frequency and shorter waveform than shear failure signals [25]. This study analyzed the acoustic emission data of sedimentary limestone and found that a large number of high-amplitude and low-frequency events occurred near the failure of the rock sample [26]. Li studied the two characteristic frequency bands of the AE waveform obtained from a marble tensile test [27]. Zhang used the peak frequency of AE signals as a parameter to classify them by fuzzy C-means and studied the distribution of different signals in the loading process feature [28]. Wang studied the AE frequency-domain characteristics of granite under freezing–thawing cycles and revealed that the rock structure degrades when subjected to high frequency–temperature cycles, showing the characteristics of relatively high number of low-frequency signals and small intervals [29].
Most of the studies on AE characteristics during rock deformation and failure focus on the time- and frequency-domain parameter variability of AE signals from shallow rocks. Therefore, to analyze the mechanical properties and failure precursors of deep granite under high confining pressure, this study uses the time–frequency evolution of acoustic emission signals in the triaxial test of granite obtained from 1150 m depth underground in Sanshandao Gold Mine, Laizhou, Shandong Province, China. Based on the time–frequency characteristics of AE signals and mechanical tests, the AE signal distribution and the deformation and failure process of deep granite under different confining pressures are studied. Furthermore, the failure precursor signal before peak stress is defined. The research results provide some theoretical guidance for rock failure prediction in the actual construction of acoustic emission technology.

2. Test Process and Design

A triaxial compression test was conducted on granite samples to study the AE information, precursor characteristics, and energy distribution of the samples during loading deformation and failure under high confining pressure. The granite samples were all excavated from 1150 m underground in Sanshandao Gold Mine in Laizhou, Shandong, China. All samples were collected from the same rock mass, with uniform mass and without obvious joint layers, thereby avoiding the effect of varied samples on the test results. According to the method recommended by ISRM, the sample was prepared into a cylinder with a diameter of 50 mm and a height of 100 mm, maintaining the unevenness error of both ends of the sample less than 0.05 mm and the diameter error along the sample height less than 0.3 mm. In general, when the deformation ratio of the testing machine is inconsistent with that of the granite sample in the loading process, the friction at the sample end will limit the end deformation of the sample, thus affecting the mechanical properties, such as the stress distribution of the sample. To eliminate this sample end effect, we polished both ends of the sample with 400 grit emery paper, reducing the friction of the end faces. The in situ stress measured at −1150 m is 30 MPa. To simulate the real rock occurrence environment and conduct the control test, the confining pressure in this test was preset to 10, 20, and 30 MPa. The size of each granite sample was measured and recorded as shown in Table 1.
The test equipment includes a rock mechanics loading system and an AE system (Figure 1). The loading system adopts a TAW-2000 triaxial hydraulic servo testing machine. During the loading process, the preset confining pressure value was first applied, and then the axial pressure on the rock sample was gradually increased until its failure under the constant confining pressure. In the later stage of loading, to obtain a clear post-peak curve, the loading rate was reduced at 0.008 mm/s until the sample was destroyed. For AE signal acquisition, the PCI-II acoustic emission monitoring instrument and its software were used. Vaseline was smeared on the end of the AE monitoring probe to ensure the coupling effect between the probe and the sample. The sampling evaluation rate of the AE monitoring system was set at 1 MSPS, the acquisition threshold was 40 dB, and the front gain was 40 dB to eliminate the effect of external noise.

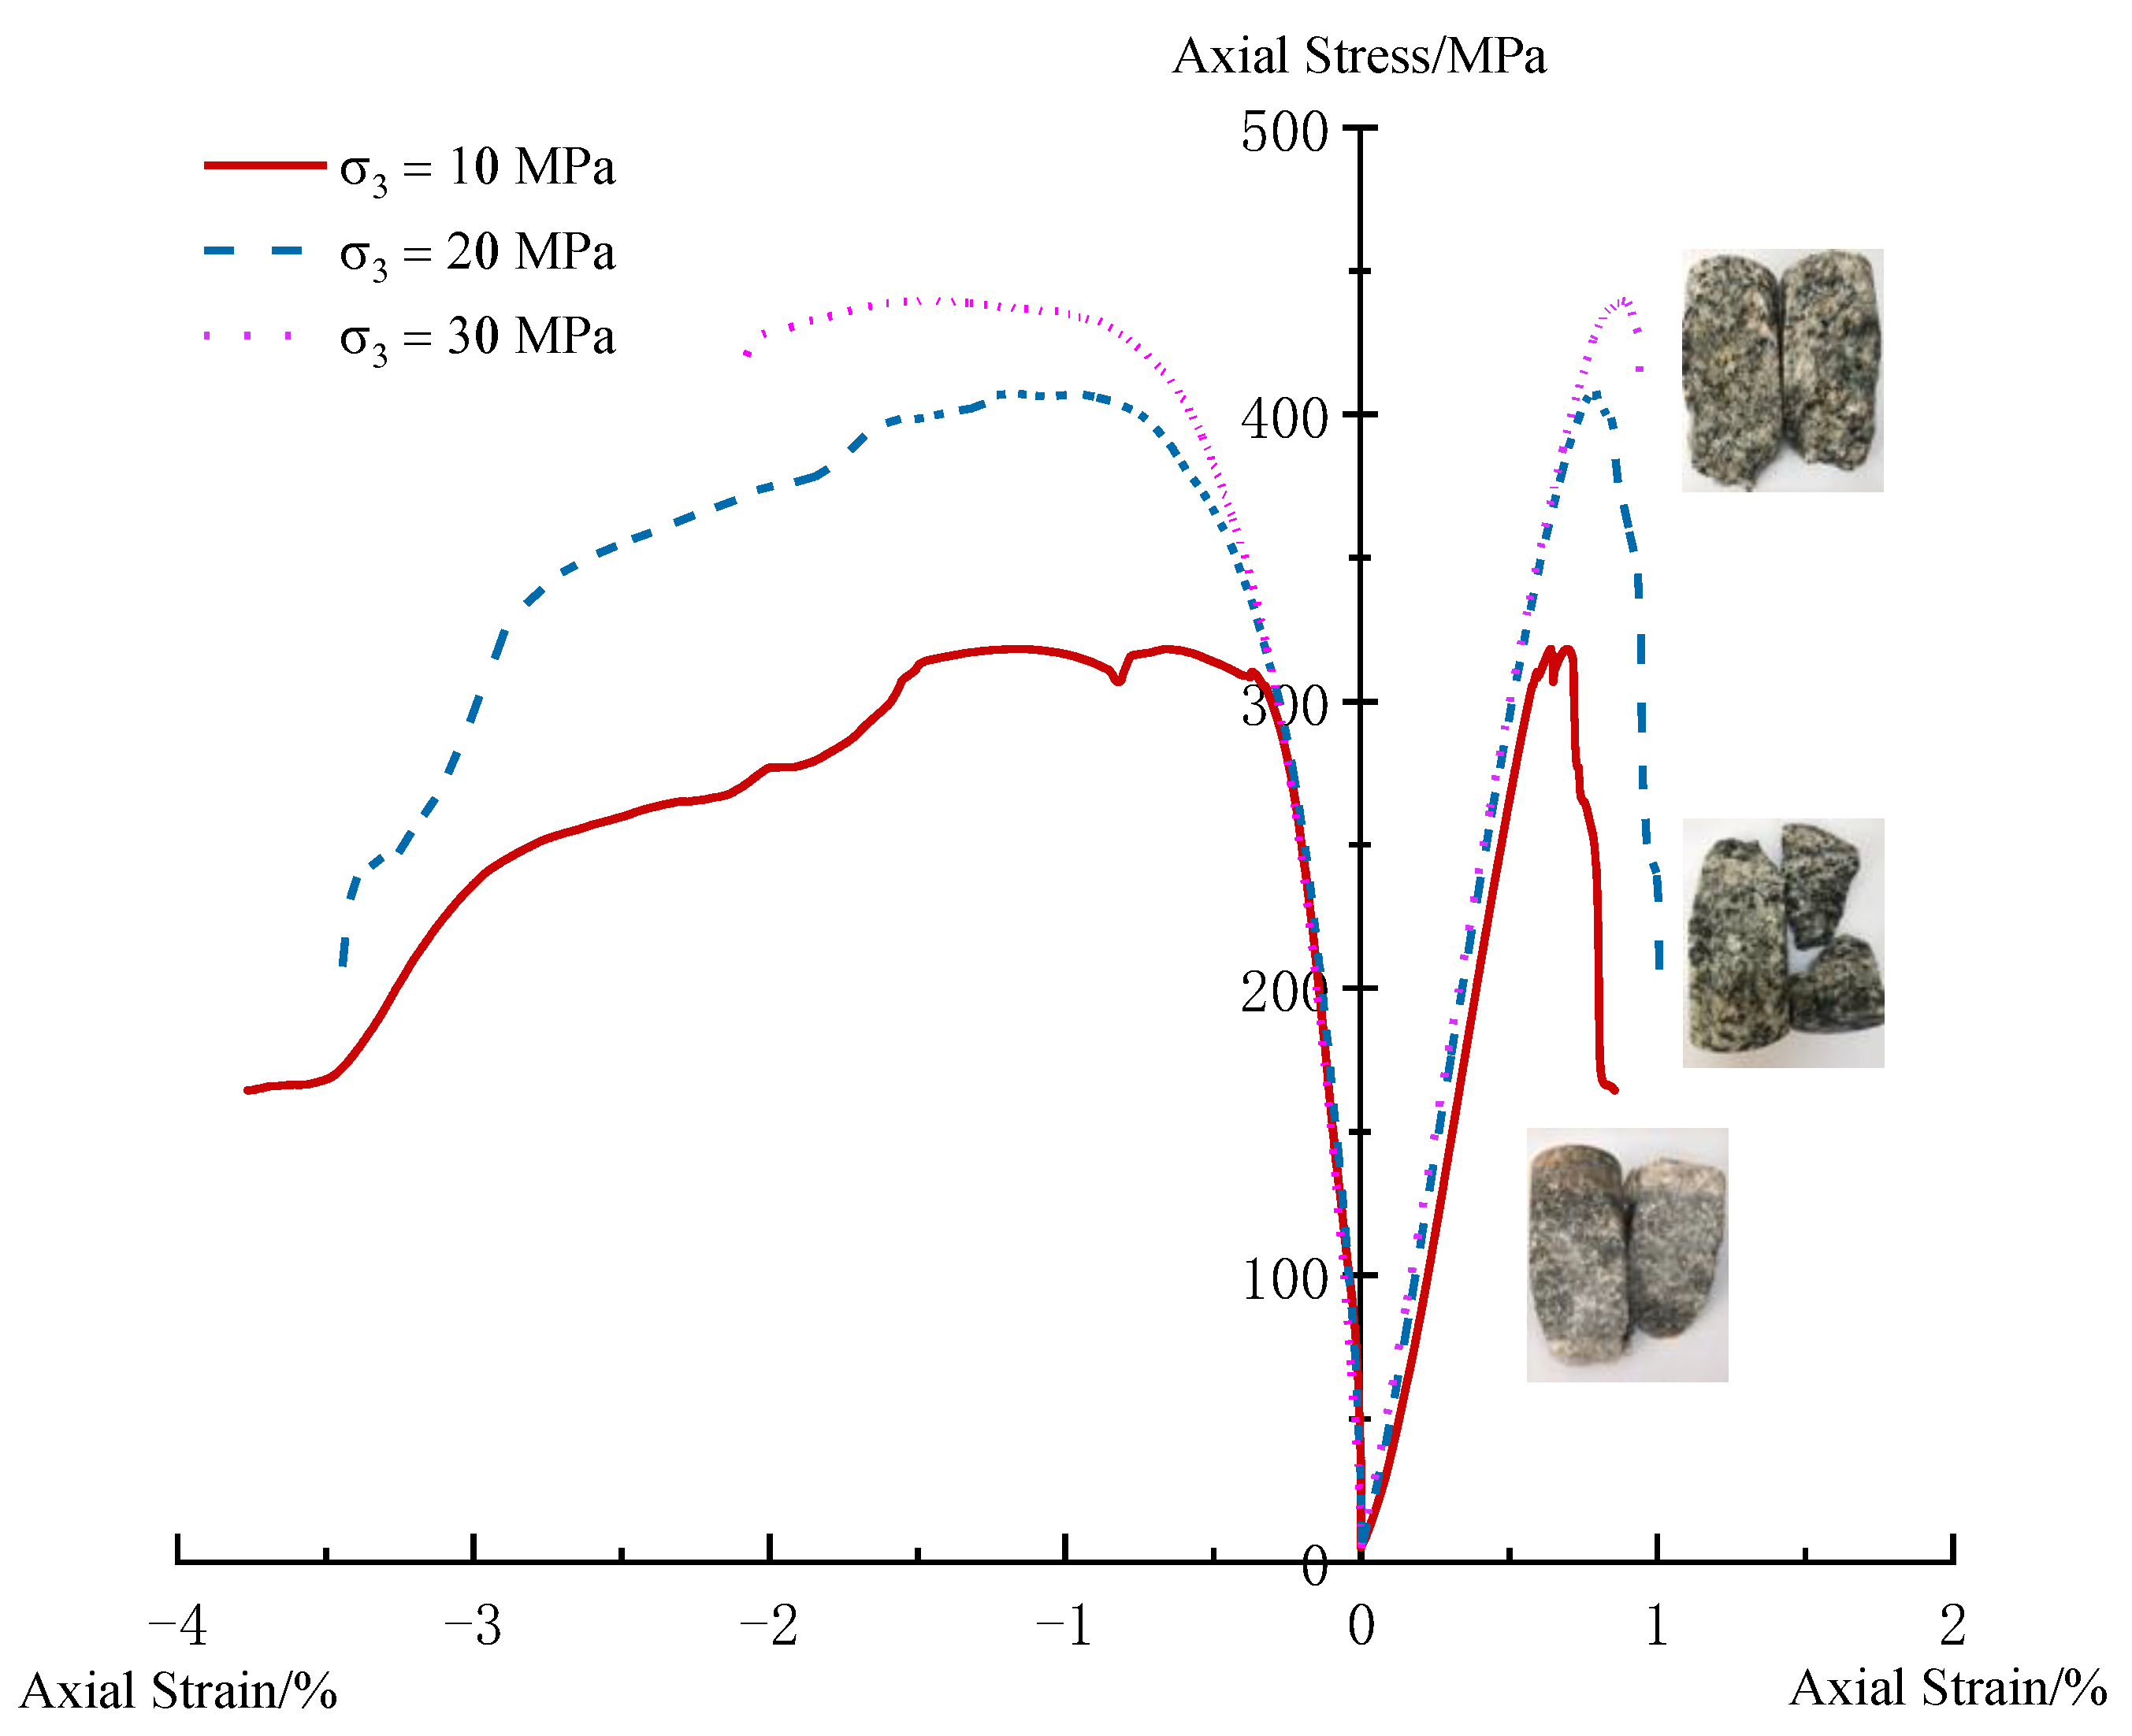
3. Experimental Phenomena and Mechanism Analysis

The peak strength, peak strain, and elastic modulus of granite samples A1 to C4 were obtained under confining pressures of 10, 20, and 30 MPa applied until sample failure. The samples under the same confining pressure show similar mechanical properties; hence, in this paper, we mainly analyze samples A1, B1, and C1. Figure 2 shows the stress–strain curves and cross-sections of these samples.
As shown in Figure 2, the deep granite samples mainly show elastic deformation until the peak stress, after which their strength decreases rapidly, indicating strong brittleness under different confining pressures. These rocks originate in an environment of high geostress, temperature, and hydraulic pressure, and under the action of low confining pressure, the main fracture surfaces of the rock samples exhibit obvious scratch marks, and many rock fragments are observed. Moreover, the opening degree of the main fracture is relatively large, which shows obvious signs of tension and distortion. This is mainly due to the secondary shear failure caused by the concentration of slip stress on the fracture surface after failure. As the confining pressure increases, the main fracture surface develops from the end to the sample’s side. Under high confining pressure, the fracture surface of the rock sample is rough, which indicates a volume expansion phenomenon of the micro drum.
The fracture morphology of the three rock samples under triaxial compression was observed by scanning electron microscopy (SEM).
As shown in Figure 3, the granite samples’ fracture morphology is extremely complex, with their surfaces showing diverse morphology consisting of defects. The whole rock mass comprises layers, which consist of defects between them. Further, rock debris accumulates on the defects. The fracture boundary is locally concentrated due to brittle fracture. The fracture of granite is characterized by cleavage fracture, which is mainly fluvial cleavage, with obvious scratches and slip marks. The fault is predominantly composed of intracrystalline cracks (with rock debris accumulation on the surface) and intergranular cracks.
Many primary fractures of different sizes exist in granite. When subjected to splitting load, the microcracks begin to sprout at small-sized cracks and hard components. With increasing load, these microcracks and main cracks begin to expand and connect into main cracks. The cracks propagate completely and produce an obvious fracture surface until the rock is destroyed. Therefore, the fracture surface of granite has various shapes and obvious surface cracks. Thus, cracks formed through cracks of varied size will produce a large amount of rock debris on the surface.

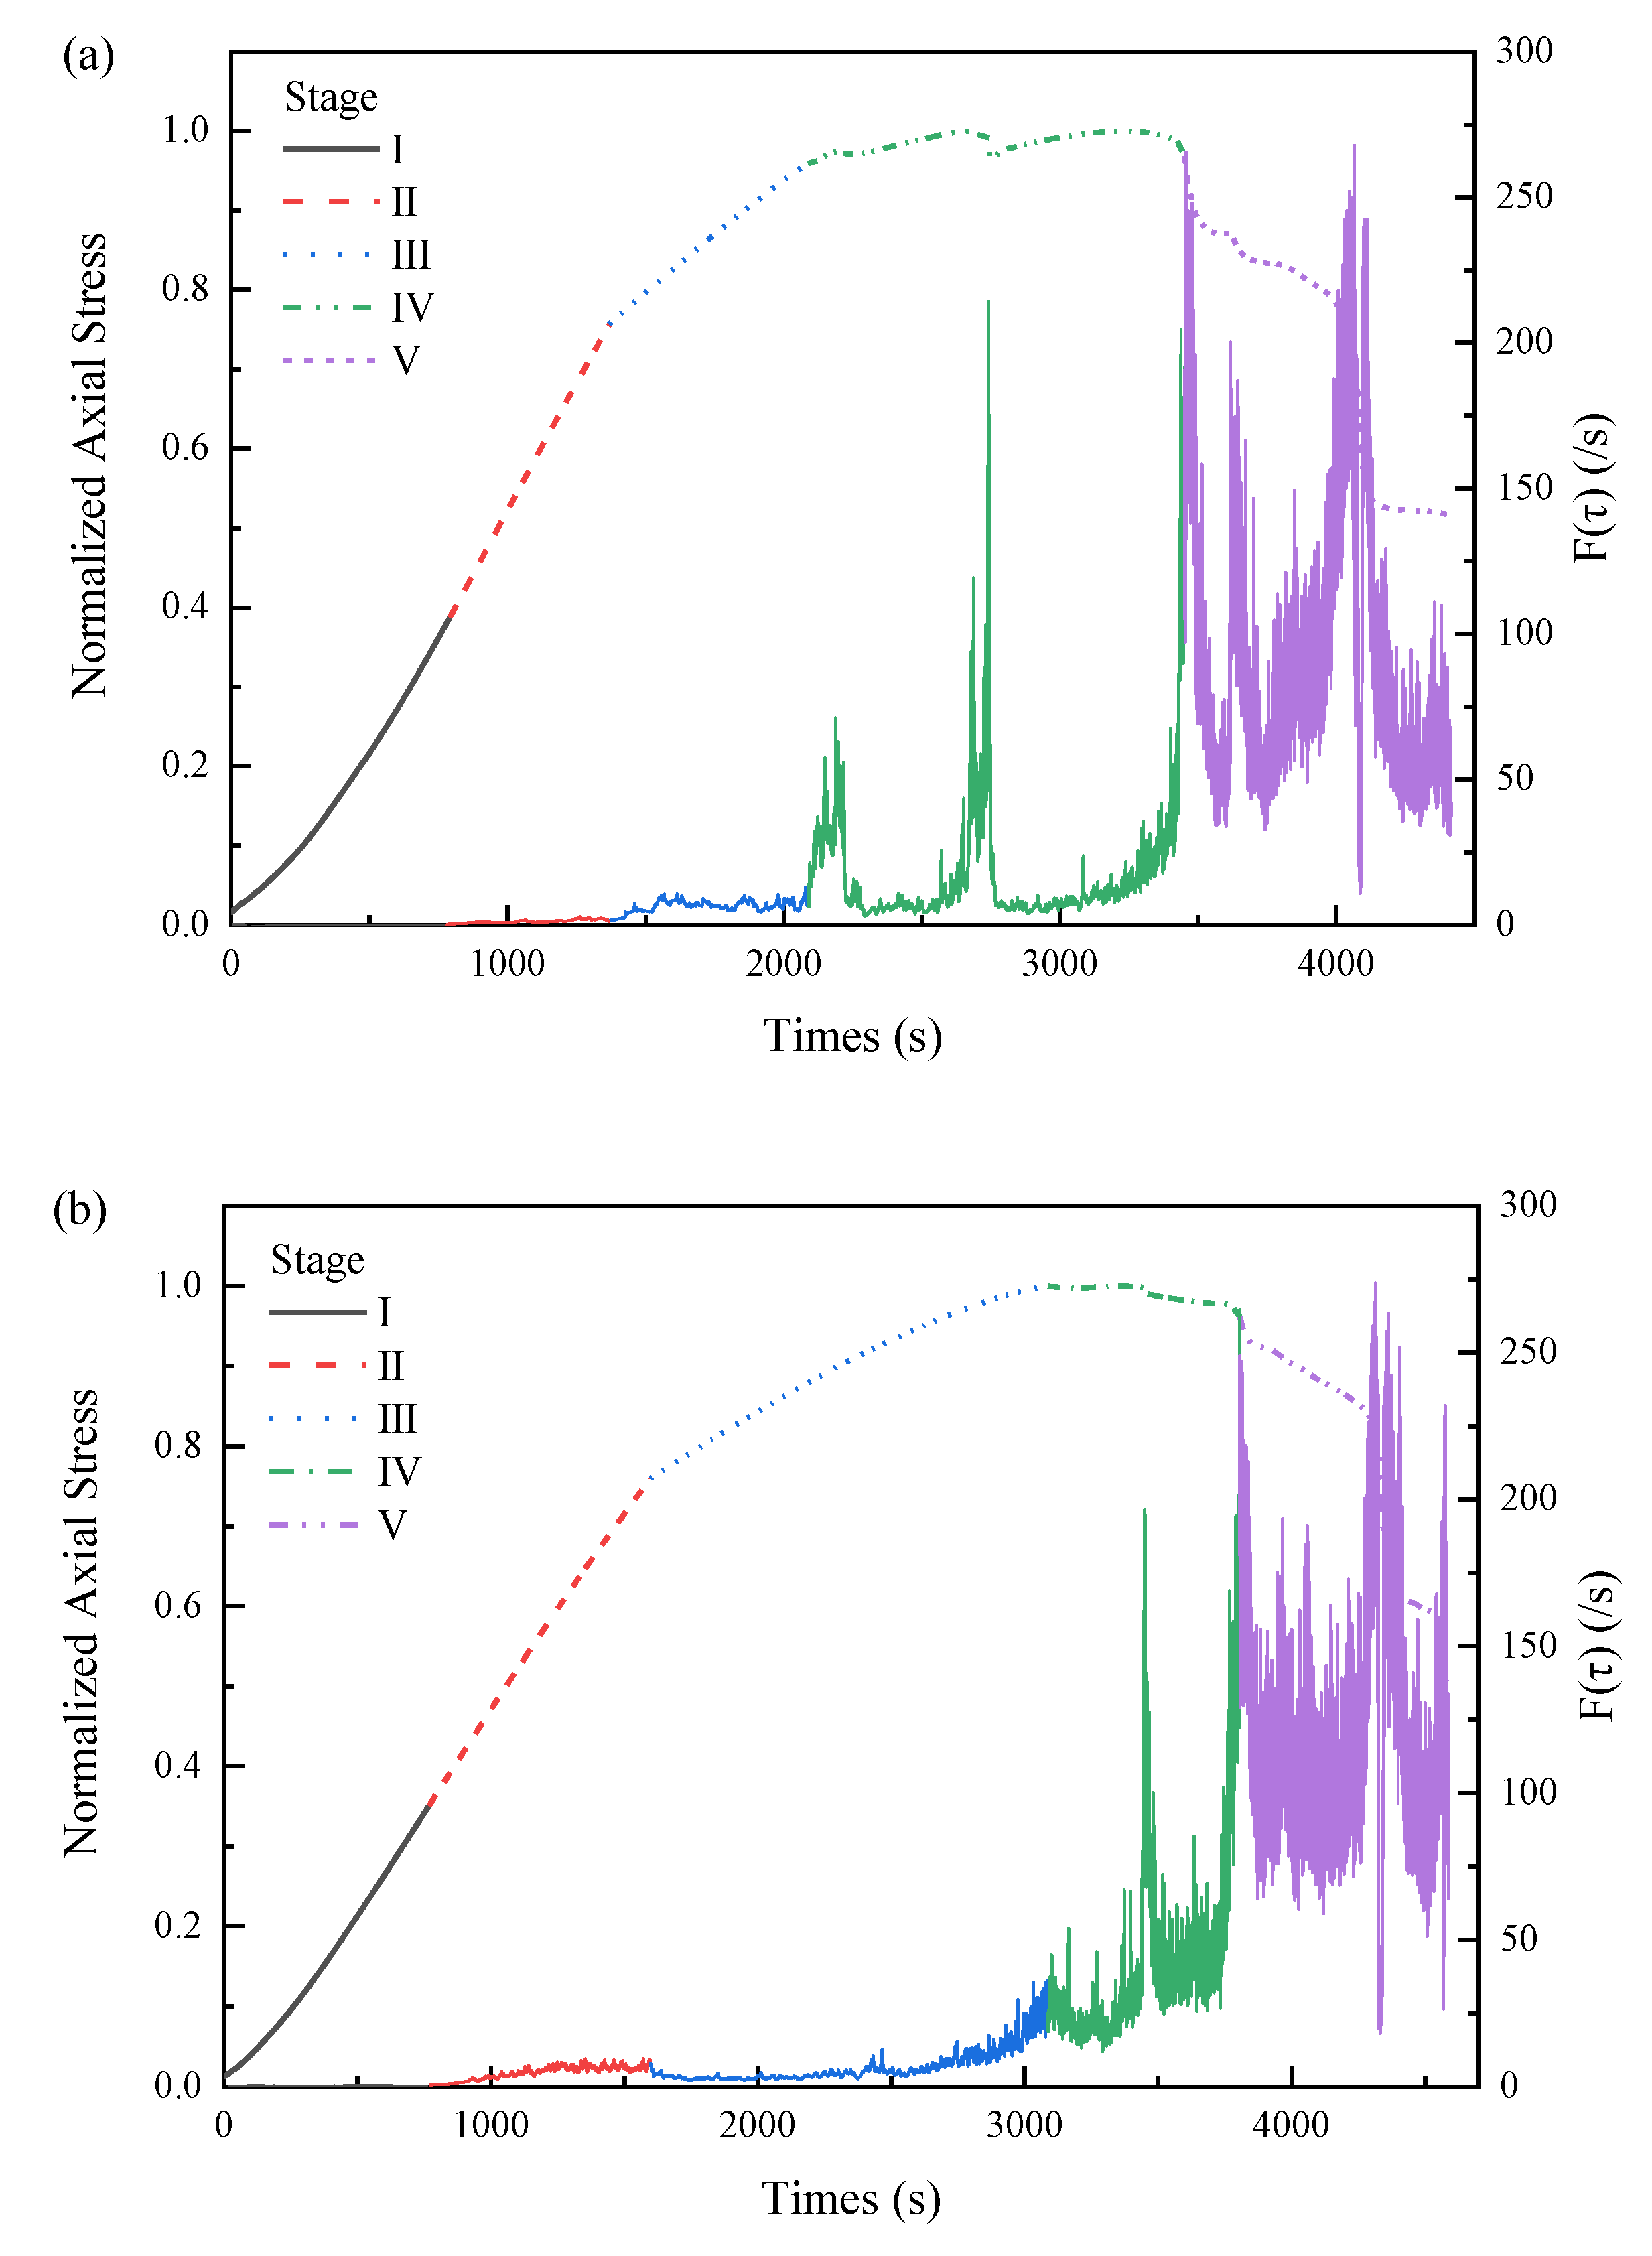
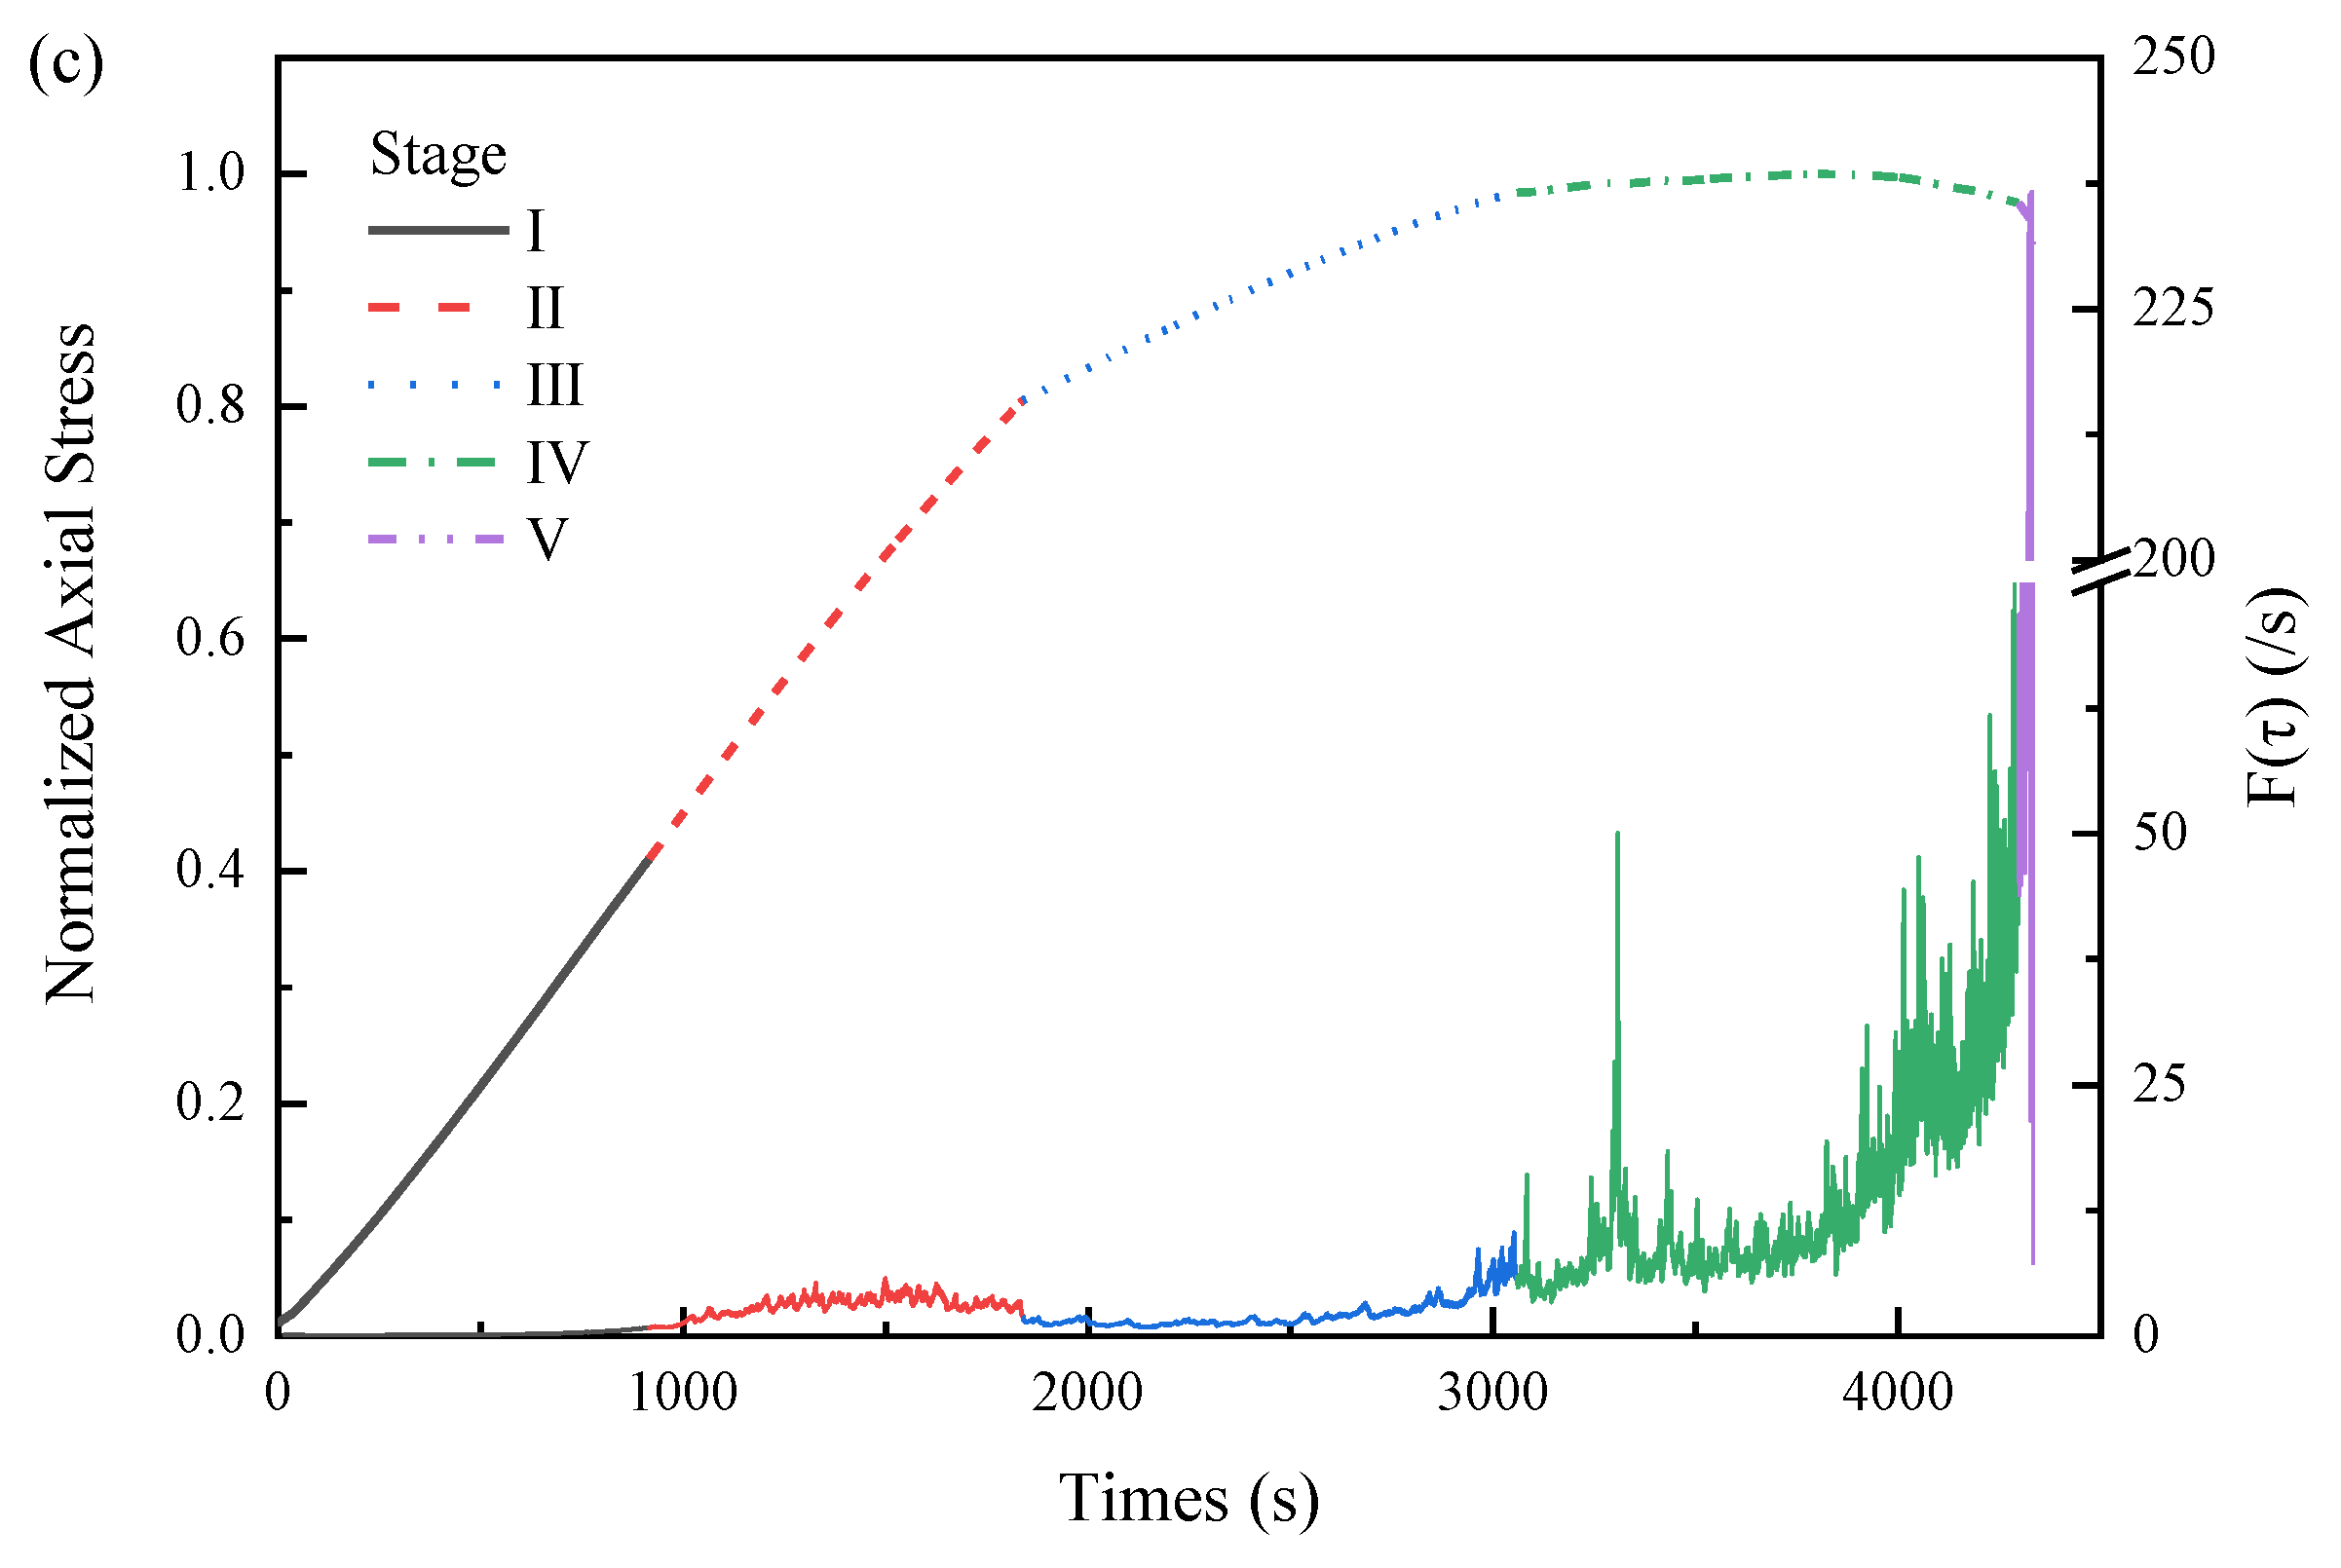
4. Analysis of Micro-Scale Failure Evolution of Deep Granite Based on IET Function

A large number of microcracks are randomly distributed in natural granite. When an external load is applied to the granite sample, the primary microcracks cause local stress concentration inside the sample, which further promotes the occurrence and propagation of internal microcracks. The expansion and aggregation of microcracks lead to the production of macroscopic cracks and local failure surfaces until the failure produces a large number of AE signals. These signals contain the evolution information of internal failure and fracture in the process of rock deformation and failure [20,30].
As all the samples were obtained from the same core, their stress–strain curves indicate that the axial stress–strain relationship and the AE event curve of all samples under different confining pressures shows similar trends. This reflects that the distribution of microcracks in the deep granite samples is basically similar, with no remarkable difference between the samples.
According to the deformation characteristics, the loading process of rock can be classified into five stages: (1) crack closure, (2) linear elastic deformation, (3) crack initiation and stable crack growth, (4) critical energy release and unstable crack growth, and (5) failure and post-peak behavior [31,32]. During rock loading, the AE event rate of each fracture level differs considerably. The AE event monitoring method has been widely used to classify and verify the degree of rock cracking [33,34]. To further explore the evolutionary relationship between the AE event number and the fracture degree, this study adopts the IET function F ( τ ) proposed by Triantis and Kourkolis [35,36].
The calculation method is as follows:
(1) Define a sliding time window with N impact event intervals
( t i 1 , t i + N 1 )
(2) Calculate the moving average of N event intervals in the specified time window:
τ i = t i + N 1 t i 1 N ( i = 2 , 3 , )
special:
τ 1 = t N t 1 N ( i = 1 )
(3) For a given time window:
F ( τ ) = τ i 1 ( i = 1 , 2 , 3 , )
In this test analysis, we adopted n = 50, as explained by Triantis and Kourkolis. Here, N represents the resolution of AE characteristics and does not majorly affect the analysis results [36].
Figure 4 shows the stress–strain–F(τ) evolution curves for the three granite samples.
For sample A1, the value of the event interval function is extremely low and the curve is close to the horizontal axis within 0–2087 s, implying less AE activity. According to Z. Moradian [31], a small amount of AE activity is mainly caused by the compaction of primary pores or shear slip on the primary failure surface.
Within 784–1869 s, the stress curve of the rock sample is approximately a straight line, indicating that the rock is in the elastic loading stage. The microcracks close and destroy the cementation points on the rough grain surface of some fracture surfaces, and the F ( τ ) value increases slightly.
Within 1869–2087 s, the stress curve of the rock sample still shows a straight-line form, but with slightly decreasing slope. This is because the loading rate is reduced to 0.008 mm/s to obtain a clear post-peak curve in the loading stage. At the same time, the later value of F ( τ ) in this stage increases significantly, which indicates that the rock sample undergoes the formation and development of microcracks and the phenomenon of microcrack nucleation. This is the fracture generation and development stage.
Within 2087–3455 s, the stress curve no longer shows linear development, the stress value gradually increases to the maximum value, and a series of U-shaped evolution paths of the function F ( τ ) appears. The U-shaped evolution path of F ( τ ) is the path in which F ( τ ) decreases, then stays at a relatively low level, and finally increases with time. In this time period, the sample shows stable crack propagation, and the minority of macroscopic crack extension is limited because of the expansion of the macroscopic crack generation. The expansion of the macroscopic cracks of the frontier forms the surface for new strain energy dissipation. This strain energy is used to maintain the new microcrack generation at a high speed, which subsequently leads to the reduction of F ( τ ) . After a series of cracking events occur, the value of F ( τ ) returns to a high level.
After 3455 s, the rock sample moves to the post-peak failure stage, and F ( τ ) initially remains at a high level, showing a typical unstable crack growth form. The function value F ( τ ) also shows a continuous and compact U-shaped evolution trend. The continuous occurrence of large F ( τ ) values indicates rapid increase in the AE activity simultaneously. Further, the accumulated energy of the granite sample begins to release during the loading process, and the internal cracks of the sample are connected under the action of sustained external force. This allows the rock sample to slide along the internal main fracture surface of the sample, resulting in local shear tensile failure and, finally, in the macroscopic failure of the sample.
According to the AE signal value F ( τ ) and the stress–strain curve of granite under compression, the loading process of the granite sample is divided into five stages: (1) crack closure, (2) linear elastic deformation, (3) microcrack generation and development, (4) macroscopic fracture generation and energy surge, and (5) post-peak failure. In stages 1 and 2, the rock sample experiences the compaction of primary pores, shear slip on the primary failure surface, relative slip between grains, and destruction of the rough particle surface at the microscale. After the end of the elastic loading stage, the stress–strain curve of the sample is no longer linear; the stress rapidly reaches the maximum value and a large number of microcrack propagation aggregates produce macroscopic cracks. In the post-peak stage, all three samples show high brittleness. In this stage, the large crack is quickly connected and formed. With continuously increasing loading, the main fracture surface inside the sample slides, causing local damage to the granite interior and complete damage eventually.

5. Research on the Frequency-Domain Characteristics of AE Signals

The inhomogeneity and defects in the rock cause stress concentration in the loading process. Internal microcracks cause and expand or intensify plastic deformation, resulting in the rapid release of strain energy stored in the rock and subsequent AE. In practice, thousands of AE events occur when a sample is loaded until it breaks. Thus, the experimental and practical construction efficiency could be greatly improved by extracting characteristic signals from many AE signals that explain different degrees of rock fracture and determining the AE frequency-domain precursors of rock fracture.

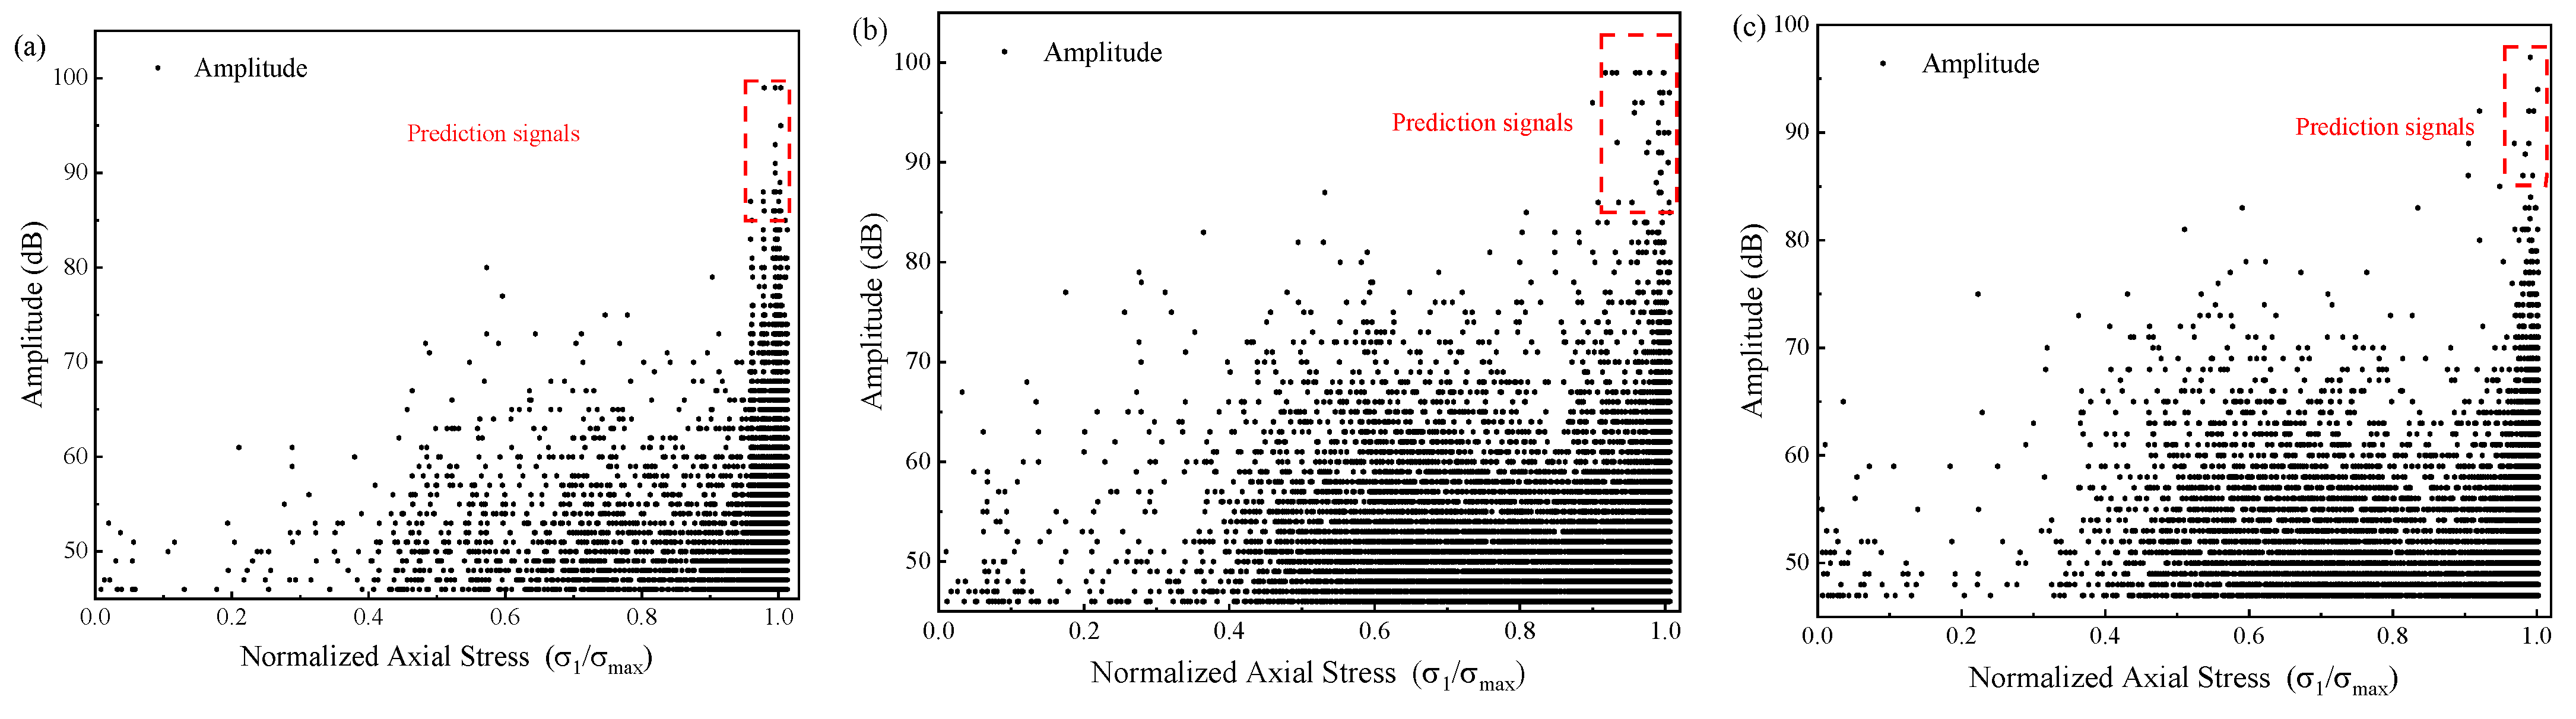
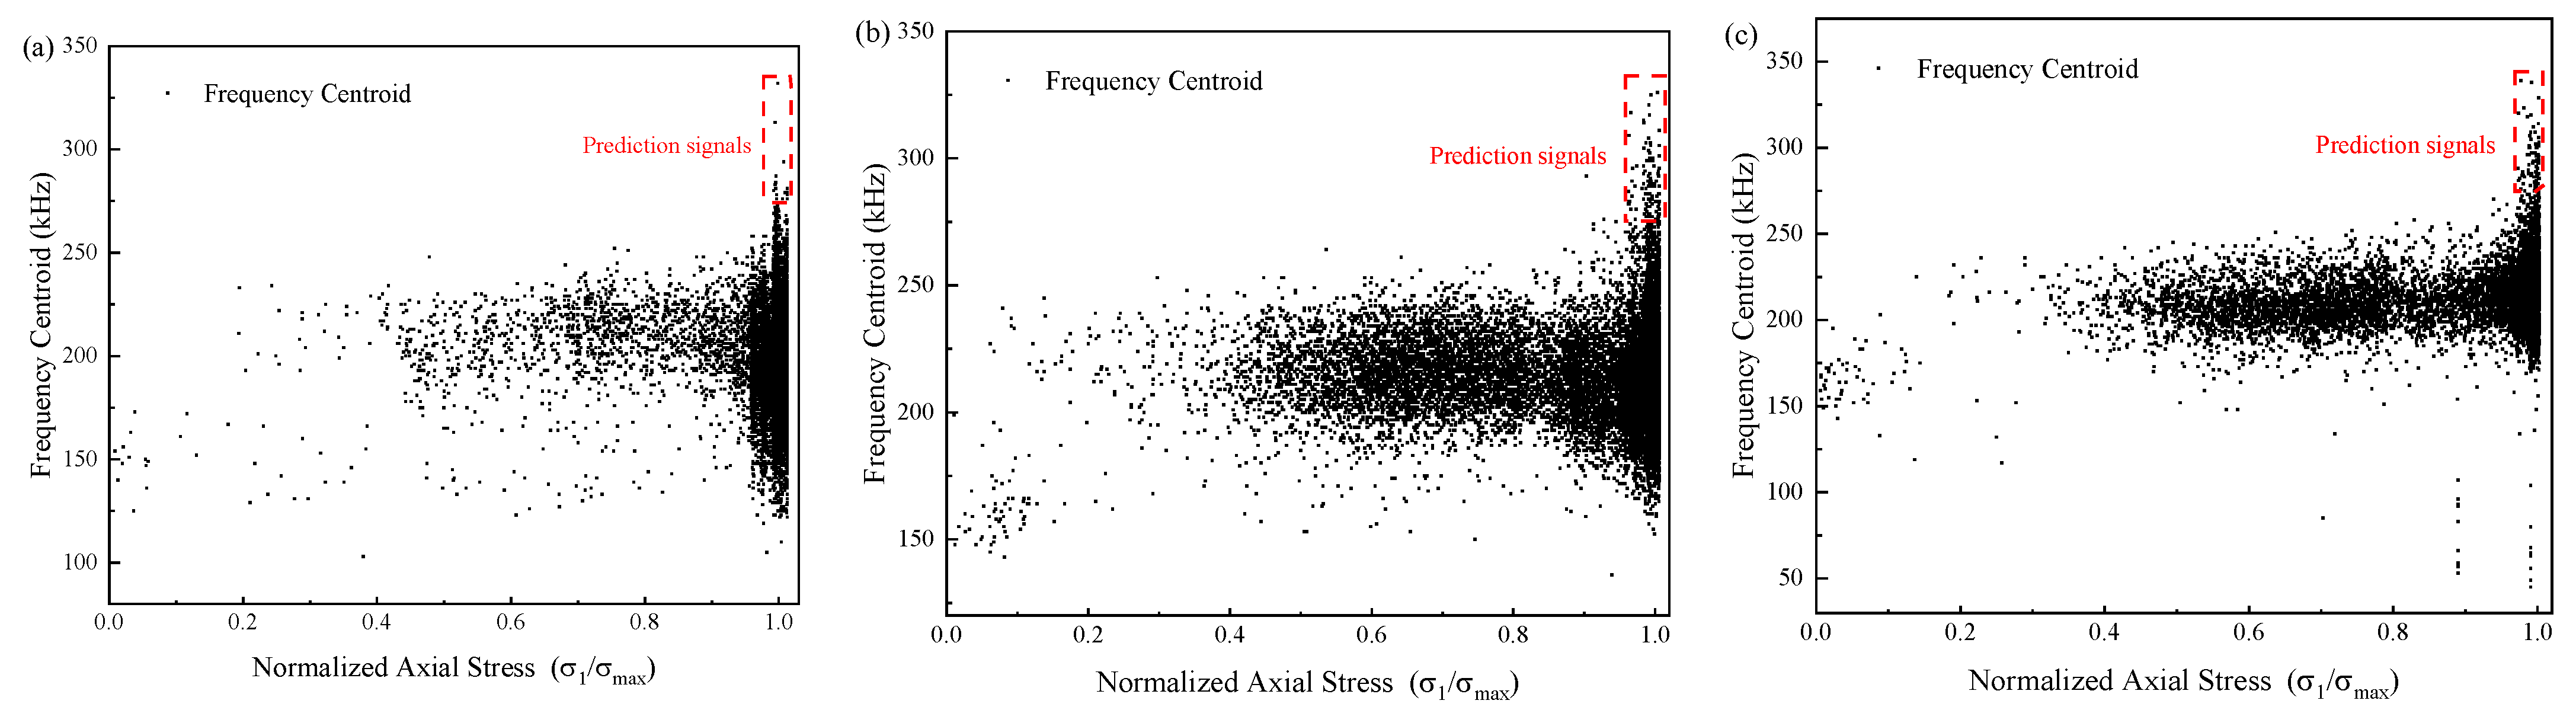
5.1. Discussion on AE Signal Distribution and Peak Stress Precursor

The peak frequency of the AE signal is a characteristic parameter of the signal in the frequency domain. It is defined as the peak value observed in the power spectrum. The frequency centroid is also a frequency feature calculated, in kilohertz, as the sum of magnitude times frequency divided by the sum of magnitude, as equivalent to the first moment of inertia. As shown in Figure 5, the amplitude represents the maximum amplitude of the signal waveform, which is usually expressed in dB.
In addition to using AE parameters to predict fracture precursors, this section studies the failure mechanism and precursory characteristics of critical failure by statistical analysis of the distribution of peak frequency, frequency centroid, and amplitude in the deformation and failure process of granite samples.

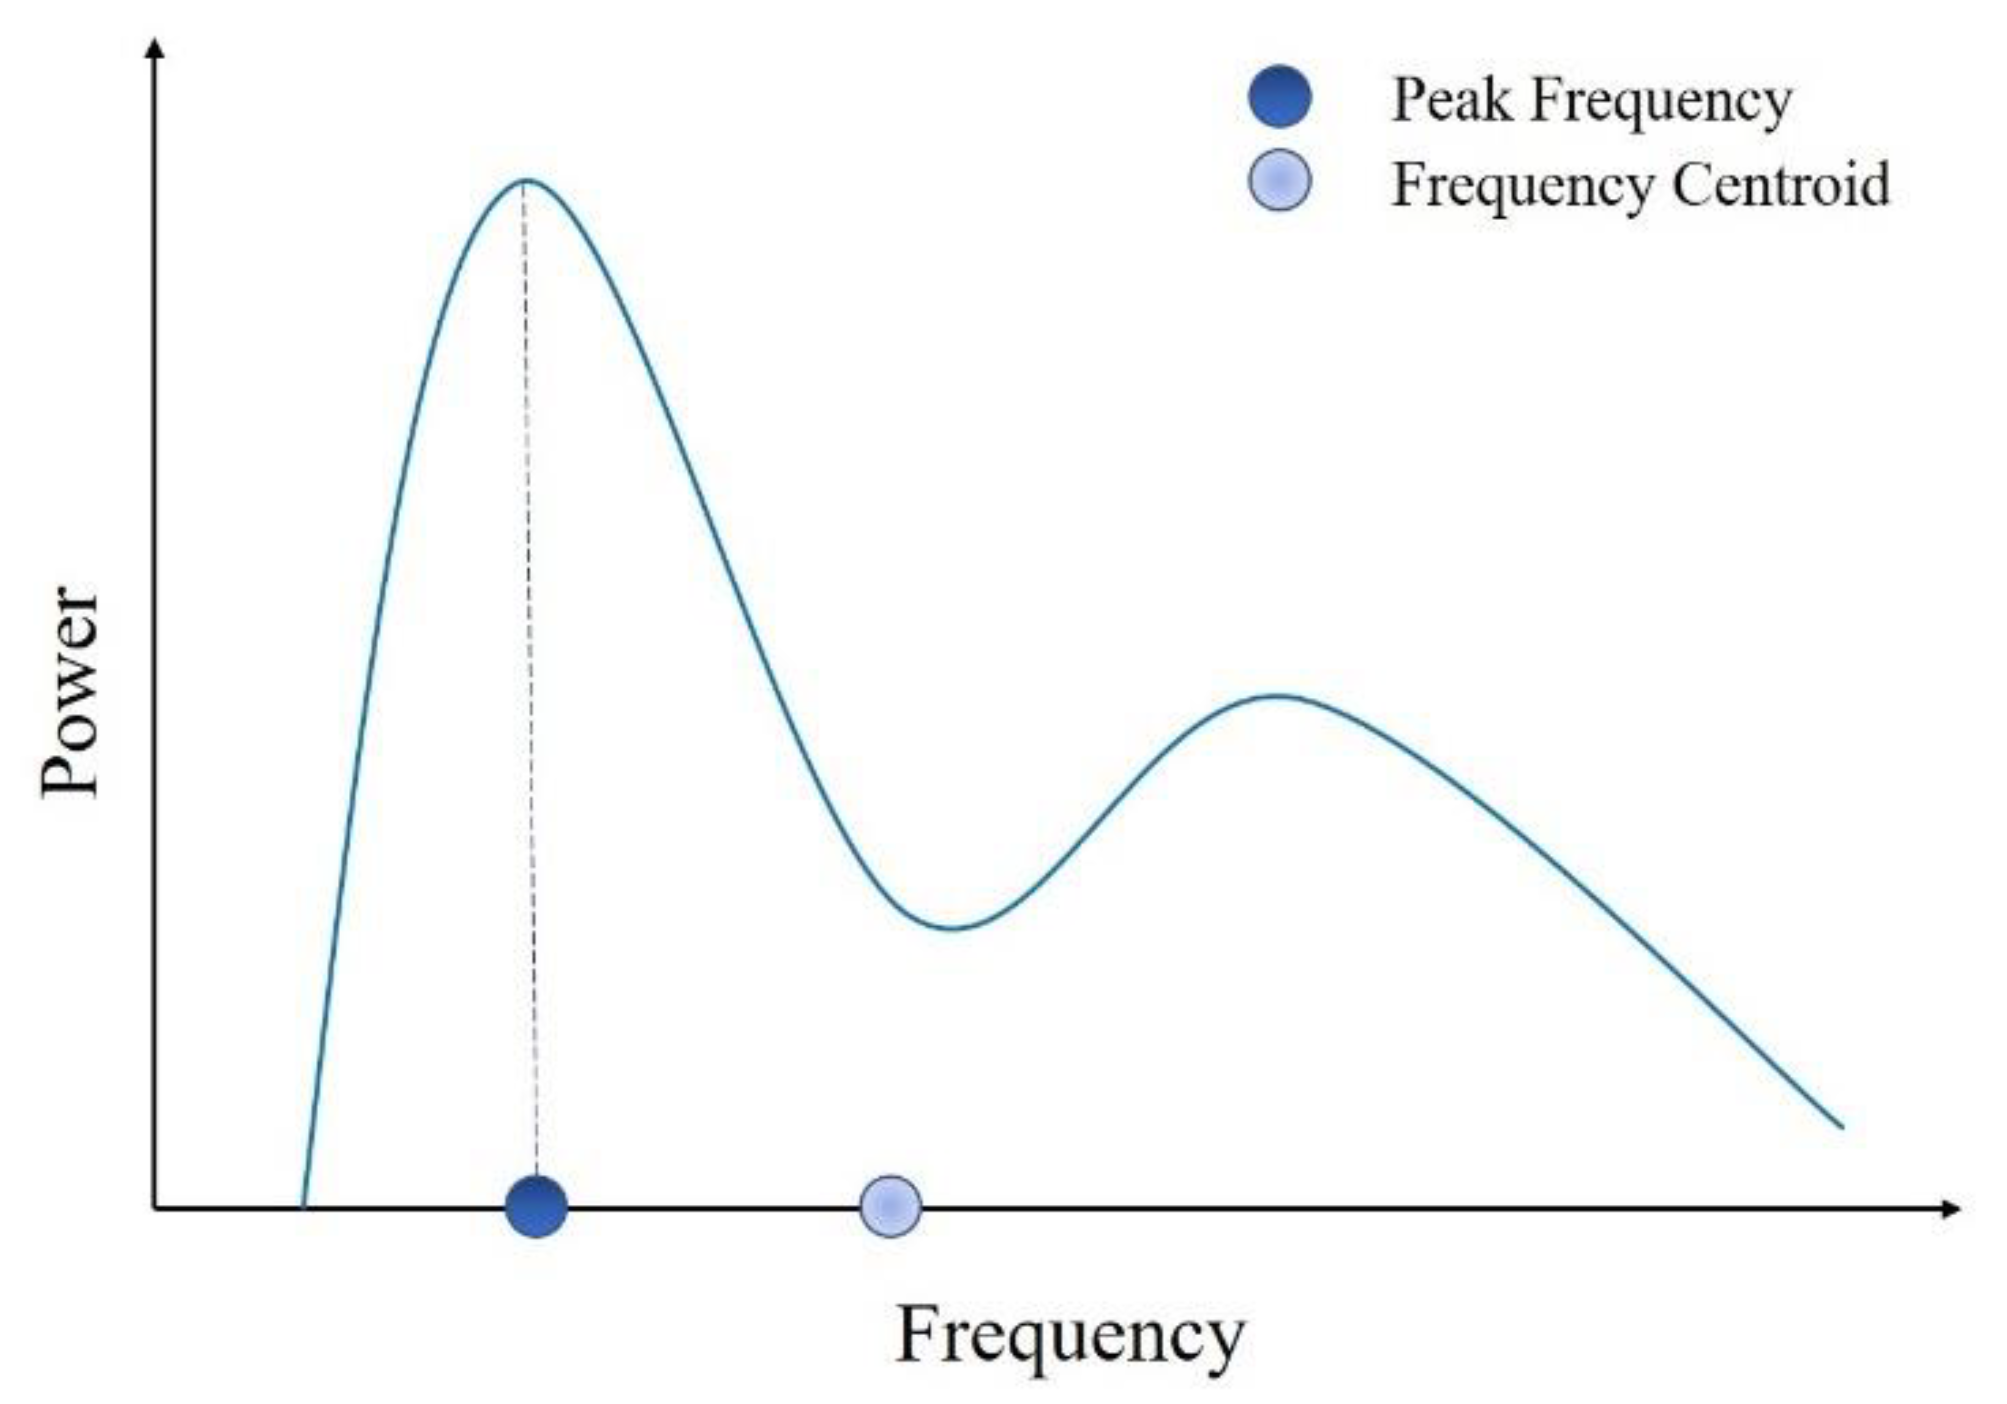
5.1.1. Frequency-Domain Distribution of AE Signals and the Definition of Prediction Signals

To study the variation of crack degree and peak AE signal frequency by the triaxial compression test under different confining pressures of the deep granite samples A1, B1, and C1, the relation scatter plots of amplitude, peak frequency, and frequency centroid with respect to normalized axial stress ( σ 1 / σ max ) were drawn, as shown in Figure 6, Figure 7 and Figure 8, respectively, to acquire the frequency domain distribution law of deep granite AE signals and the precursory characteristics before reaching peak stress.
The figures indicate that during the test, the AE signals with an amplitude of 35–80 dB account for the majority. The peak frequency presents an obvious stratification phenomenon, while the distribution of frequency centroid band shows the law from thin to wide. In general, the distribution characteristics of the three AE parameters show some similar regularity during the test. Therefore, the study of the frequency-domain characteristics of AE signals before loading to the peak stress in the triaxial test can more comprehensively grasp the change patterns of fracture corresponding to various AE signals. It can better define the AE signals of rock failure prediction before loading to the peak stress from the perspective of the frequency domain.
The amplitude distribution of AE signals clearly shows that the number of AE signals is less in the crack closure stage and the early stage of linear elastic deformation. The corresponding results can also be obtained in the distribution of the other two signals. The maximum amplitude in each stage shows a similar trend with stress; it increases with increasing stress, before reaching the peak stress. Beyond this, the amplitude distribution breaks in the range of 35–80 dB and some signals larger than 80 dB begin to appear.
The peak frequency spectrum can be divided into three parts: low-frequency band (0–200 kHz), medium-frequency band (200–350 kHz), and high-frequency band (350–500 kHz). The low-frequency signals exist in the entire testing process. The frequency band around 75 and 160 kHz begins to widen with stress. When the normalized axial stress value reaches 50–60%, a large number of medium-frequency signals begin to appear and are concentrated around 225 and 300 kHz. Compared with the low- and medium-frequency signals, the practical significance of high-frequency band signals is more obvious. These signals appear almost at the same time when the amplitude crosses 80 dB, and only a little earlier than the time the stress peak is reached. Therefore, the appearance of signals with a peak frequency greater than 350 kHz has a strong correlation with rock failure.
As shown in Figure 5 and the concept of frequency centroid mentioned above, the higher the energy of AE signals in a certain frequency band, the closer the frequency centroid value will be to that frequency band. The frequency centroid distribution diagram shows that the AE energy is mainly concentrated in the frequency band of 150–175 kHz at the beginning of crack closure. With increasing stress, the AE energy is concentrated at approximately 225 kHz until the peak stress is reached. The frequency centroid shows the same characteristics as the values of amplitude and peak frequency. That is, its bandwidth widens, and most importantly, more signals larger than 275 kHz appear.
Hence, according to the above results, the failure precursor signal can be considered to be the signal with an AE amplitude greater than 85 dB, a peak frequency greater than 350 kHz, and a frequency centroid greater than 275 kHz; hereinafter, this signal is referred to as the P-signal. Comparison of the stress value corresponding to the P-signals with the peak stress of the granite samples reveals that the stress corresponding to the P-signals under the three confining pressures is 97%, 96%, and 98% of the peak stress values of the granite samples, respectively, and they occur 212, 370, and 393 s ahead of the occurrence of the peak stress in the test.

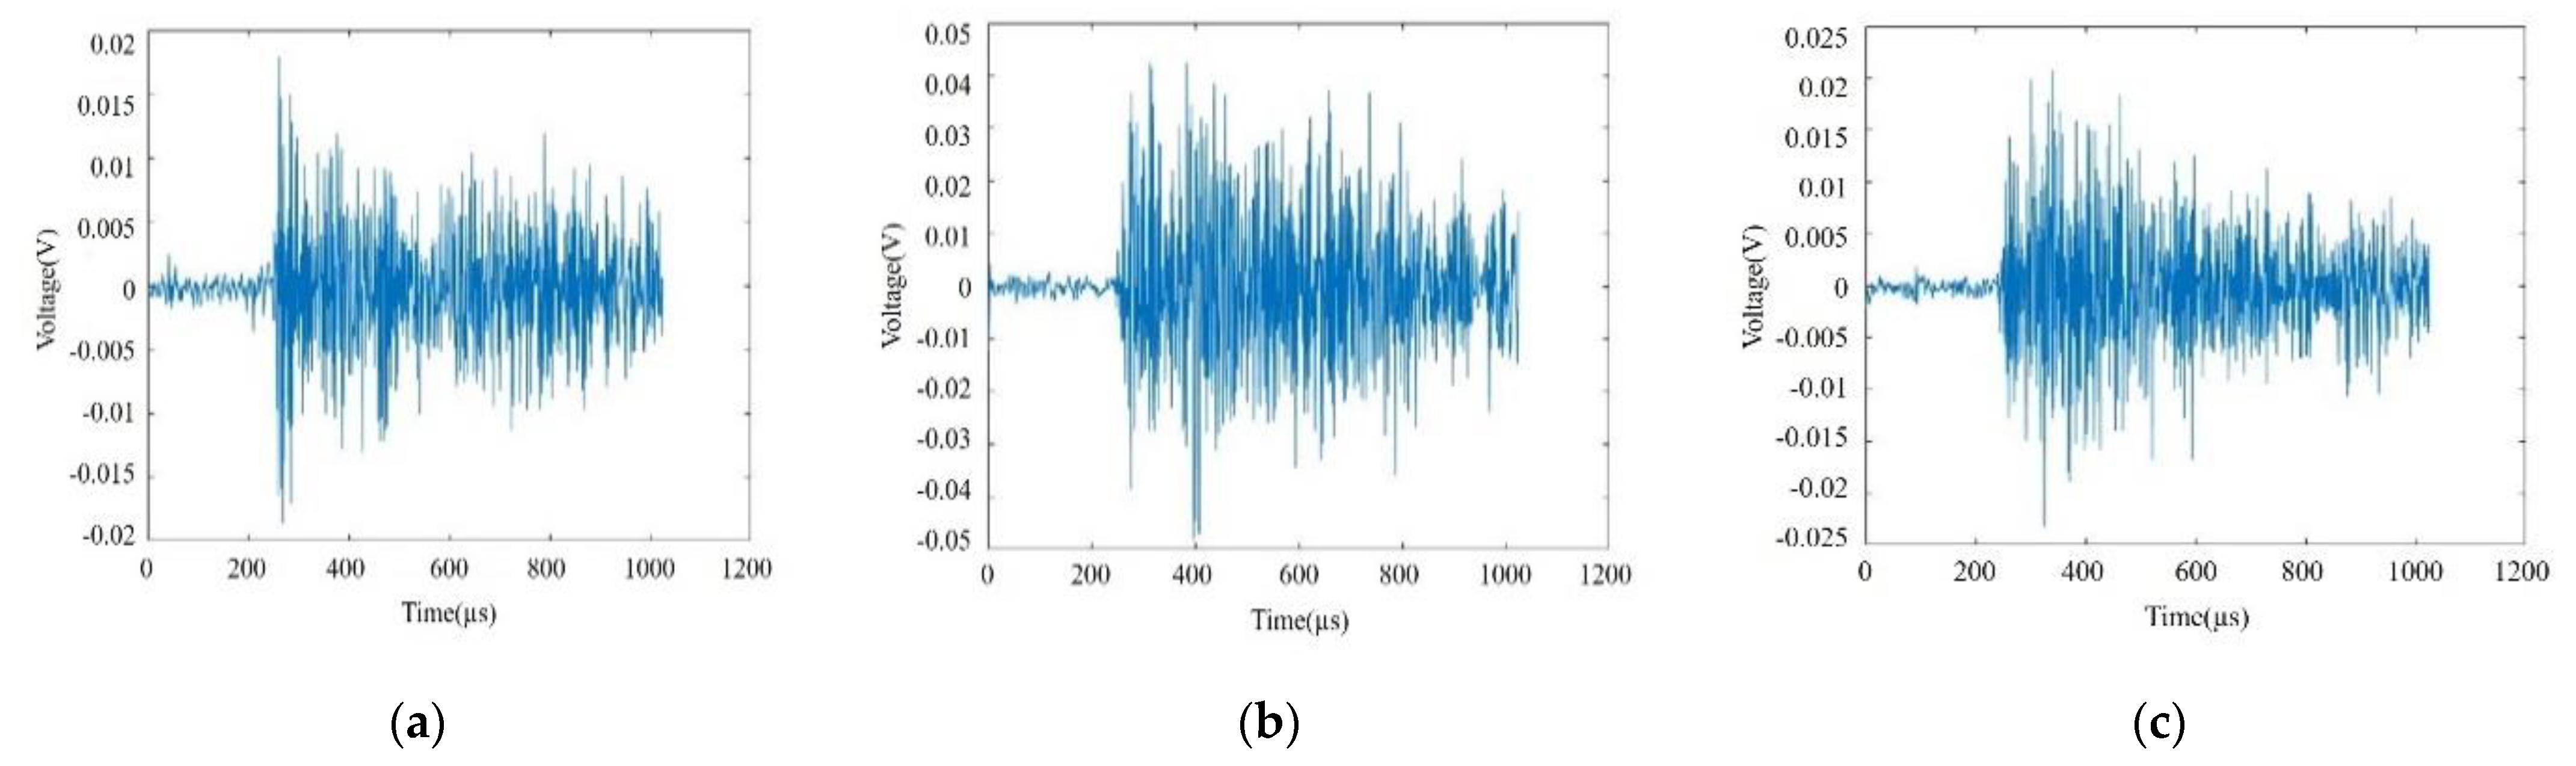
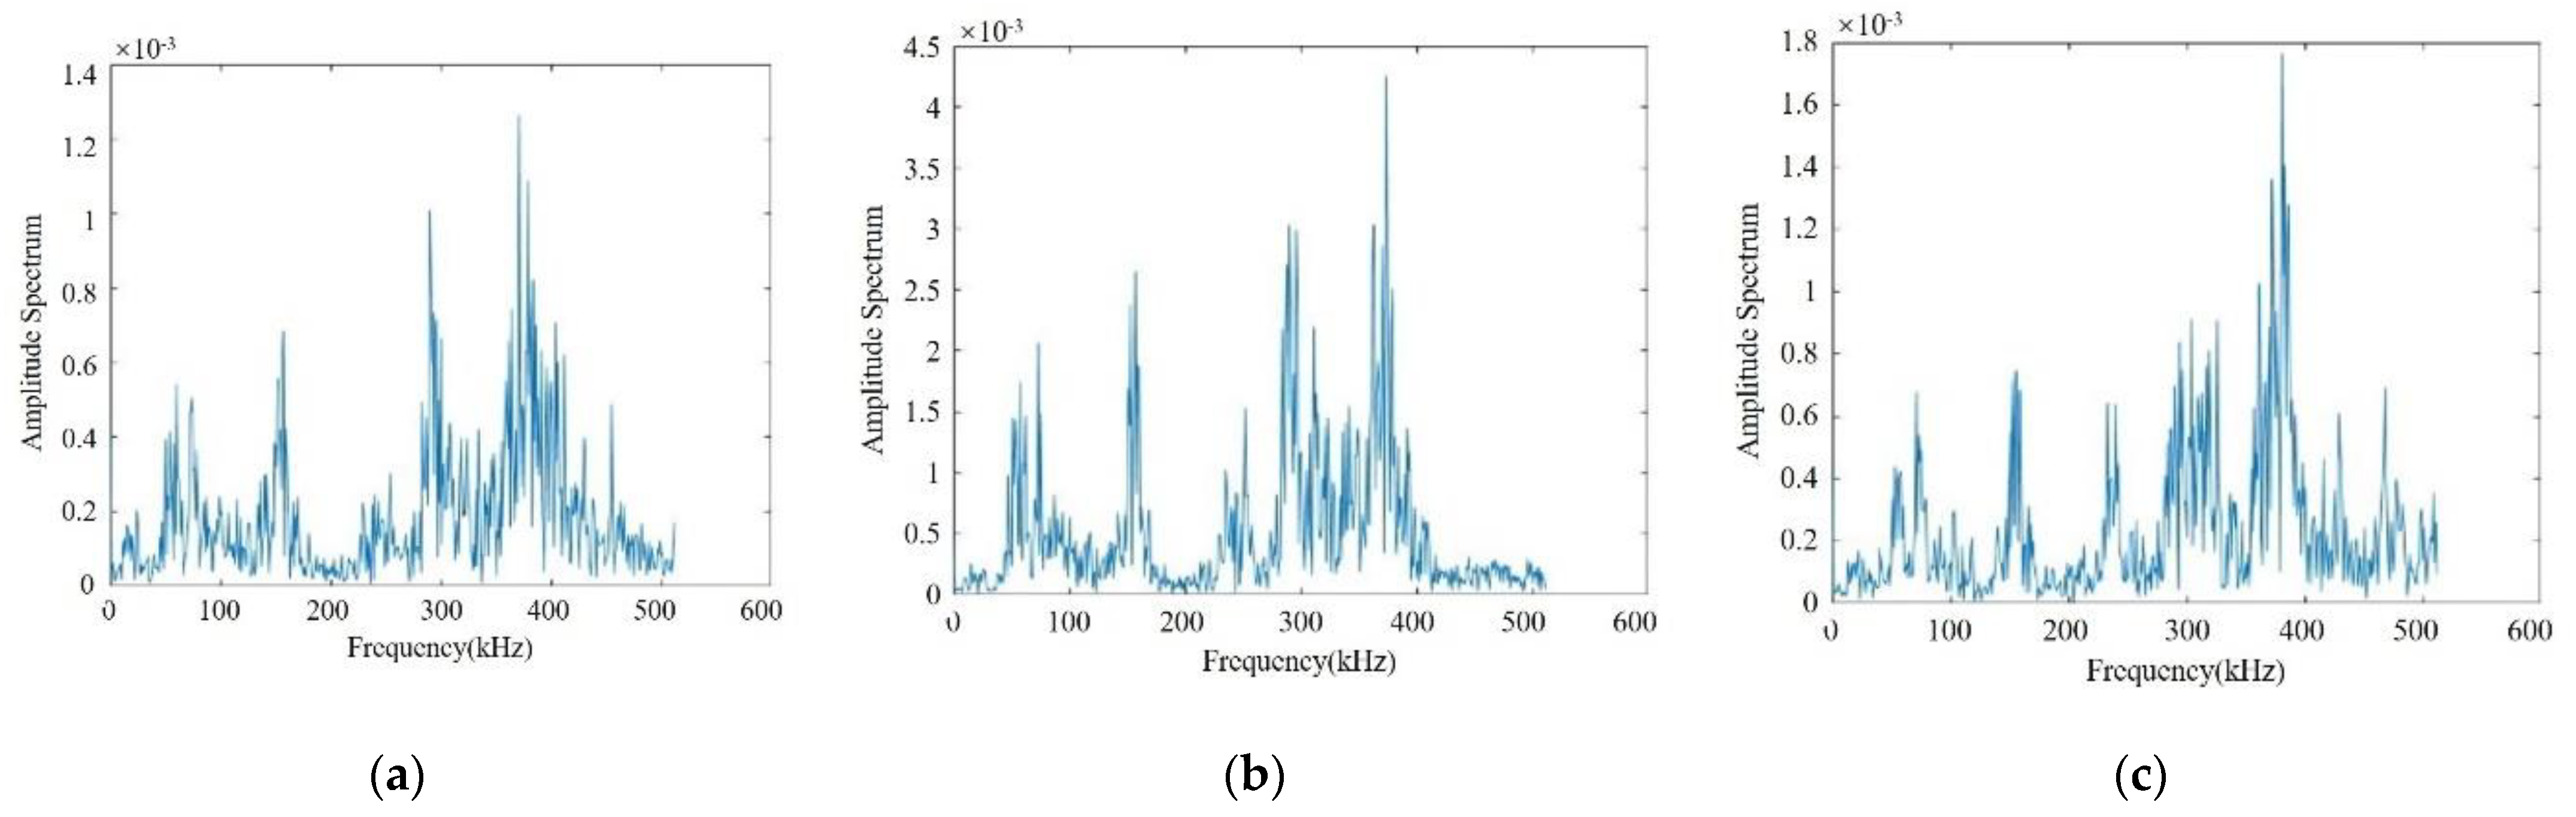
5.1.2. Time–Frequency Domain of the P-Signals

In Section 5.1.1, P-signals, with large peak frequency, frequency centroid, and amplitude, are defined as the precursor signals for rock instability and failure. Then, the P-signals in each confining pressure test were extracted and filtered, and the detailed frequency-domain information of the P-signals was obtained according to the fast Fourier transform (FFT). The time and frequency domain waveforms of the P-signals under different confining pressures are shown in Figure 9 and Figure 10, respectively. The P-signals under each confining pressure show extremely similar characteristics; that is, the primary dominant frequency of the P-signal is concentrated near 375 kHz, while the secondary dominant frequency is mostly concentrated at 310 kHz. The frequency-domain signal shows the phenomenon of “multi-peak coexistence,” dominated by the primary frequency.
This phenomenon shows that the selection of the P-signals is not strongly affected by the test environment but is mainly determined by the physical properties of rock. This means that the P-signals defined in this paper have strong representativeness and applicability.

5.2. Wavelet Packet Energy Analysis of AE Signals

Traditional analysis methods such as the FFT are not suitable to analyze typical non-stationary signals such as AE signals owing to the defects of the algorithm itself. By contrast, wavelet analysis is a localized analysis in the time and frequency domains, and it can not only present the frequency-domain analysis of the signal in local time but also describe the time-domain information corresponding to the frequency-domain information. Based on wavelet analysis theory, wavelet packet analysis introduces the concept of optimal basis selection, which has higher time–frequency resolution than wavelet analysis [37]. Therefore, wavelet packet analysis has greater advantages in the time–frequency domain analysis, feature extraction, and AE signal energy analysis.
The concept of the frequency centroid described in the previous section clarifies that the frequency centroid will be close to the dominant energy band of the signal. Therefore, in this section, we use wavelet packet analysis to further analyze the energy of the P-signals to obtain the energy distribution characteristics of the P-signals in each band. More importantly, we verify the practicability of peak stress prediction by the P-signals.

5.2.1. Wavelet Packet Frequency Band Decomposition of the P-Signals

The AE signals generated in the loading process of a rock sample are abruptly occurring non-stationary signals with complex characteristics. Wavelet packet analysis can effectively identify these signals and further decompose their high-frequency and low-frequency components. Then, the corresponding frequency band is adaptively selected according to the characteristics of the decomposed signals. According to the sampling law, if the sampling frequency of the AE system is 1 MHz, the Nyquist frequency is 500 kHz. Rock is a type of anisotropic and heterogeneous material, with random microstructural planes. Different wavelet bases provide different results. Various wavelet bases have been applied to wavelet packet analysis, such as Symlets basis, Morlet basis, and Meyer basis [38,39,40,41,42]. In view of the complexity and diversity of AE signals, wavelet bases with symmetry and tight support should be selected [43,44]. In this paper, the db3 wavelet basis function of Daubechies wavelet series was selected and the AE signals were decomposed to the fourth layer. A total of 16 sub-bands (labeled 1–16) with a band length of 31.25 kHz were obtained. The specific range of each frequency band is shown in Table 2.

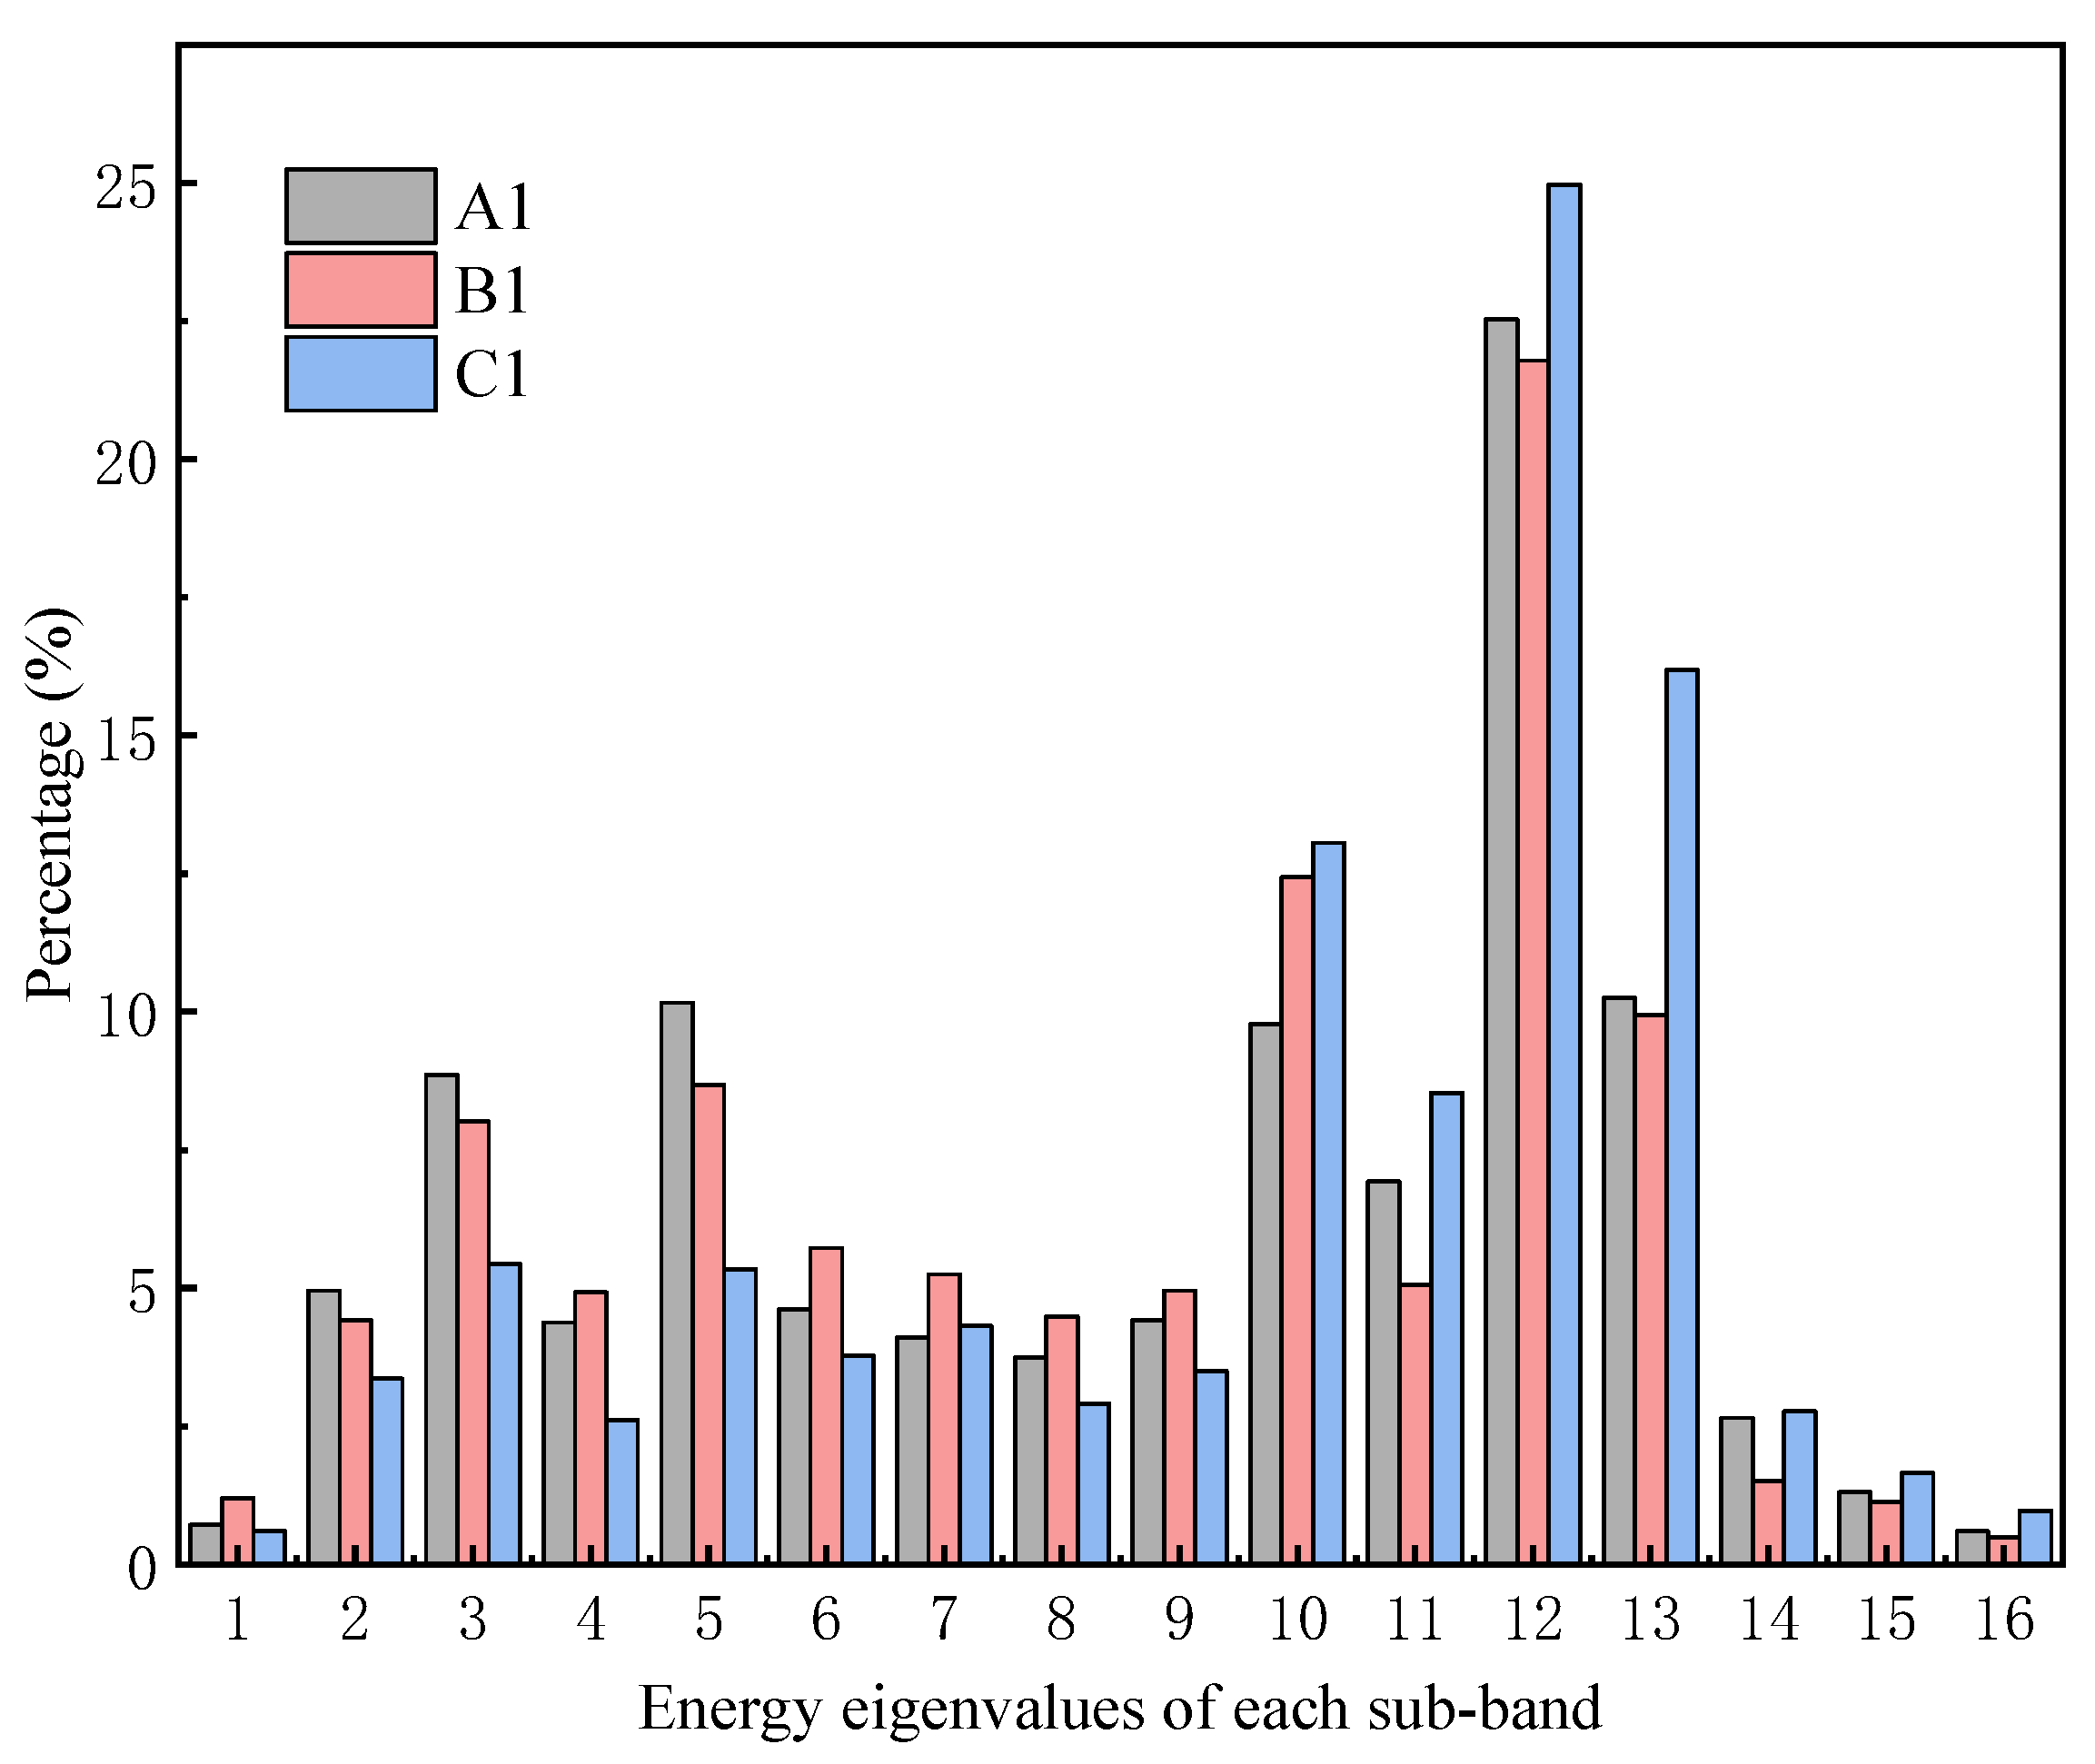
5.2.2. Energy Distribution of Each Sub-Band

When the AE signal is decomposed to the fourth layer, the analyzed signal is recorded as S 4 , j , and its corresponding energy is E 4 , j ; then, the energy of each frequency band can be expressed as
E 4 , j = | S 4 , j ( t ) | 2 d t = k = 1 m | x j , k | 2
where m is the number of discrete sampling points of the signal; x j , k represents the amplitude of S 4 , j discrete points of the signal.
That is, if the total energy of the analyzed signal is E 0 , then
E 0 = j = 0 2 4 1 E 4 , j
The percentage of the energy of each sub-band of the signal in the total energy of the analyzed signal is calculated as follows:
P j = E 4 , j E 0
Based on the above formula, the energy ratio distribution of the AE signal in each sub-band after wavelet packet decomposition can be obtained.

5.2.3. Energy Distribution of the P-Signals

In Section 5.1, the frequency-domain characteristics of the P-signals obtained by FFT are extracted. In this section, the P-signals of granite samples under each confining pressure are extracted by the wavelet packet energy analysis method, and the proportions of all P-signals in the sub-bands of granite samples under various confining pressures are obtained, as shown in Figure 11.
Figure 11 shows that the frequency band energy of the P-signals under various confining pressures is mainly concentrated in the No. 10–13 frequency band (281.25–406.25 kHz), accounting for more than 50% of the total signals. This result confirms the rationality of defining the signal with frequency centroid greater than 275 kHz as the P-signal. The No. 12 frequency band (343.75–375 kHz) accounts for the highest proportion of the single frequency band. This result validates the definition of the P-signal as the signal with a peak frequency greater than 375 kHz. The No. 10 frequency band (281.25–312.5 kHz) occupies the second-highest proportion of all frequency bands because the second peak frequency of most signals is concentrated in this area. However, the energy proportion of the single frequency band is less than 25%. As the confining pressure increases, the energy proportion of low-frequency signal decreases.
The energy proportions of all the P-signals under various confining pressure values in each frequency band obtained through the wavelet packet analysis are the same as the conditions proposed in the previous section for defining P-signals. That is, the results confirm that the peak frequency and frequency centroid of the precursor signals should be greater than 350 and 275 kHz, respectively.

6. Discussion

The geological conditions of deep well construction engineering are complex, and the surrounding rocks are prone to rockburst, spalling, and other geological disasters; these conditions are quite different from those of shallow rocks. The deformation characteristics and mechanical behavior of deep rock under high confining pressure serve as effective indicators for the construction safety of deep shaft structures. As a non-destructive testing technology, the use of the AE signal monitoring technology to determine the deformation and failure characteristics of rock has been extensively studied. This method works on the principle that the damage and failure of brittle rock are attributed to the process of the initial compaction and closure of internal microcracks, followed by the nucleation of the microcracks and gradual development of large-scale cracks, resulting in macroscopic failure [30]. Therefore, this paper focused on the physical and mechanical properties of granite in the deep strata of Sanshandao Gold Mine in Laizhou. The loading failure process of deep granite was first divided into five distinct stages according to the AE IET function. Then, test results demonstrated that the deep granite shows extremely strong brittle characteristics under different confining pressures in the triaxial test.
In practical engineering, the surrounding rock stress field is redistributed after the excavation of deep rock mass, resulting in regional stress concentration and other phenomena. If the appropriate support is not applied in a timely manner, the rock mass will eventually be damaged. In this paper, the effect of rock depth on rock strength, deformation, and AE characteristics was further revealed by the triaxial tests under different confining pressures. The test results showed that the deep granite has higher compressive strength and elastic brittleness than the shallow rock [3,4]. For the granite samples with lower confining pressure, under the same loading conditions, first, the macroscopic fracture is generated and energy is increased, and the phenomenon of high AE rate occurs in the early and middle stages. This indicates that the development of internal cracks in rock is more active under low confining pressure. Under high confining pressure, some natural pores and microcracks are compacted in advance by the confining pressure, so the AE rate is extremely low in the early stage. High confining pressure also results in the accumulation of a large amount of energy in the stage of macroscopic fracture generation, and energy is rapidly released in the post-peak stage at an extremely high rate. These results suggest that the greater the buried depth, the higher the strength and elastic brittleness of the rock, and the redistribution process of the stress field after the excavation of the deep well causes different mechanical responses to the rock in the area.
In this study, we analyzed the frequency-domain characteristics of AE signals in the entire loading process to determine the early warning AE signals, which can reveal the critical state of rock failure. During the loading process, the rock undergoes microcrack nucleation and crack growth, followed by the formation of large-scale cracks and a fracture surface, eventually resulting in rock failure [30]. To better describe the AE signal when the rock reaches the peak stress, the relationship of the peak frequency, amplitude, and centroid frequency with axial stress was studied under the test conditions. The P-signals related to the frequency-domain characteristics were defined exactly. The test results showed that the peak stress of rock rapidly reaches the critical point of loading after a large number of P-signals appear. Next, the energy distribution of the P-signals was studied accurately by wavelet packet analysis, and the feasibility of the P-signal definition was verified. According to the inverse relationship between AE frequency and crack size [29,41], it can be inferred that with increasing confining pressure, the proportion of small cracks in granite increases.
However, in practical engineering, environments with high temperature and high pore water pressure clearly affect rock’s physical and mechanical properties as well as AE characteristics. In this study, the high confining pressure environment was simulated under in situ conditions. To further study the effect of high temperature and high pore water pressure on the mechanical properties of rock and the characteristics of precursory AE of rock under the coupling conditions of multiple factors closer to the actual engineering environment, it is necessary to conduct in-depth processing and analysis using a true triaxial testing machine with THMC coupling effects in the future.

7. Conclusions

This study systematically investigated the damage and failure evolution law and frequency-domain distribution characteristics of AE signals of deep granite under tri-axial loading tests. Further, the conditions for the prediction signals before peak stress were defined. The important conclusions are summarized as follows:
(1) The AE IET function could effectively identify the deformation and failure degree of rocks, and the loading process was divided into five stages. In the early stage of loading, the function fluctuated in a low region; however, the rapid increase in its value in the later stage indicates the generation of macroscopic cracks and rock fracture.
(2) The AE signals with amplitude greater than 85 dB, peak frequency greater than 350 kHz, and frequency centroid greater than 275 kHz were defined as the precursor signals before the occurrence of the peak stress. The signals are applicable to all samples under different confining pressures and have good universality and applicability.
(3) Through wavelet packet analysis, the frequency domain was divided into 16 sub-frequency bands of 31.25 kHz. The energy proportion of the characteristic signal was mainly concentrated in the 343.75–375 kHz frequency band, followed by the 281.25–312.5 kHz frequency band, and these were related to the distribution of the primary peak frequency and the secondary peak frequency of all signals. These results agree well with the selection standard of the precursor signals.

Author Contributions

Conceptualization, H.J.; methodology, L.Z.; software, L.Z. and L.L.; validation, J.Z.; writing—original draft preparation, L.Z.; writing—review and editing, L.L.; supervision, H.J. All authors have read and agreed to the published version of the manuscript.

Funding

This research was funded by the Beijing Natural Science Foundation (No. 2204084), the National Key Research Development Program of China (No. 2016YFC0600801), and the National Natural Science Foundation of China (Nos. 51534002 and 52004015).

Conflicts of Interest

The authors declare no conflict of interest.

References

  1. Feng, X.-T.; Liu, J.; Chen, B.; Xiao, Y.; Feng, G.-L.; Zhang, F. Monitoring, Warning, and Control of Rockburst in Deep Metal Mines. Engineering 2017, 3, 538–545. [Google Scholar] [CrossRef]
  2. Cai, M.; Brown, E.T. Challenges in the Mining and Utilization of Deep Mineral Resources. Engineering 2017, 3, 432–433. [Google Scholar] [CrossRef]
  3. Li, X.; Gong, F.; Tao, M.; Dong, L.; Du, K.; Ma, C.; Zhou, Z.; Yin, T. Failure mechanism and coupled static-dynamic loading theory in deep hard rock mining: A review. J. Rock Mech. Geotech. Eng. 2017, 9, 767–782. [Google Scholar] [CrossRef]
  4. Gong, Q.M.; Yin, L.J.; Wu, S.Y.; Zhao, J.; Ting, Y. Rock burst and slabbing failure and its influence on TBM excavation at headrace tunnels in Jinping II hydropower station. Eng. Geol. 2012, 124, 98–108. [Google Scholar] [CrossRef]
  5. Martin, C.D.; Christiansson, R. Estimating the potential for spalling around a deep nuclear waste repository in crystalline rock. Int. J. Rock Mech. Min. Sci. 2009, 46, 219–228. [Google Scholar] [CrossRef]
  6. Armaghani, D.J.; Mamou, A.; Maraveas, C.; Roussis, P.C.; Siorikis, V.G.; Skentou, A.D.; Asteris, P.G. Predicting the unconfined compressive strength of granite using only two non-destructive test indexes. Geomech. Eng. 2021, 25, 317–330. [Google Scholar]
  7. Du, K.; Liu, M.; Yang, C.; Tao, M.; Wang, S. Mechanical and Acoustic Emission (AE) Characteristics of Rocks under Biaxial Confinements. Appl. Sci. 2021, 11, 769. [Google Scholar] [CrossRef]
  8. Li, H.; Dong, Z.; Yang, Y.; Liu, B.; Chen, M.; Jing, W. Experimental Study of Damage Development in Salt Rock under Uniaxial Stress Using Ultrasonic Velocity and Acoustic Emissions. Appl. Sci. 2018, 8, 553. [Google Scholar] [CrossRef] [Green Version]
  9. Liu, X.; Zhang, H.; Wang, X.; Zhang, C.; Xie, H.; Yang, S.; Lu, W. Acoustic Emission Characteristics of Graded Loading Intact and Holey Rock Samples during the Damage and Failure Process. Appl. Sci. 2019, 9, 1595. [Google Scholar] [CrossRef] [Green Version]
  10. Cai, M.; Morioka, H.; Kaiser, P.; Tasaka, Y.; Kurose, H.; Minami, M.; Maejima, T. Back-analysis of rock mass strength parameters using AE monitoring data. Int. J. Rock Mech. Min. Sci. 2006, 44, 538–549. [Google Scholar] [CrossRef]
  11. Du, K.; Li, X.; Tao, M.; Wang, S. Experimental study on acoustic emission (AE) characteristics and crack classification during rock fracture in several basic lab tests. Int. J. Rock Mech. Min. Sci. 2020, 133, 104411. [Google Scholar] [CrossRef]
  12. Peng, S.; Sbartaï, Z.M.; Parent, T. Mechanical damage evaluation of masonry under tensile loading by acoustic emission technique. Constr. Build. Mater. 2020, 258, 120336. [Google Scholar] [CrossRef]
  13. Lei, X.; Satoh, T. Indicators of critical point behavior prior to rock failure inferred from pre-failure damage. Tectonophysics 2007, 431, 97–111. [Google Scholar] [CrossRef]
  14. Zhang, A.; Zhang, R.; Gao, M.; Zhang, Z.; Jia, Z.; Zhang, Z.; Zha, E. Failure Behavior and Damage Characteristics of Coal at Different Depths under Triaxial Unloading Based on Acoustic Emission. Energies 2020, 13, 4451. [Google Scholar] [CrossRef]
  15. Zhang, J. Investigation of Relation between Fracture Scale and Acoustic Emission Time-Frequency Parameters in Rocks. Shock. Vib. 2018, 2018, 1–14. [Google Scholar] [CrossRef] [Green Version]
  16. Liu, J.; Wu, N.; Si, G.; Zhao, M. Experimental study on mechanical properties and failure behaviour of the pre-cracked coal-rock combination. Bull. Int. Assoc. Eng. Geol. 2020, 80, 2307–2321. [Google Scholar] [CrossRef]
  17. Tuncay, E.; Obara, Y. Comparison of stresses obtained from Acoustic Emission and Compact Conical-Ended Borehole Overcoring techniques and an evaluation of the Kaiser Effect level. Bull. Int. Assoc. Eng. Geol. 2011, 71, 367–377. [Google Scholar] [CrossRef]
  18. Carpinteri, A.; Lacidogna, G.; Niccolini, G.; Puzzi, S. Critical defect size distributions in concrete structures detected by the acoustic emission technique. Meccanica 2007, 43, 349–363. [Google Scholar] [CrossRef]
  19. Carpinteri, A.; Lacidogna, G.; Puzzi, S. From criticality to final collapse: Evolution of the “b-value” from 1.5 to 1.0. Chaos Soliton Fract. 2009, 41, 843–853. [Google Scholar] [CrossRef]
  20. Sagar, R.V.; Rao, M. An experimental study on loading rate effect on acoustic emission based b-values related to reinforced concrete fracture. Constr. Build. Mater. 2014, 70, 460–472. [Google Scholar] [CrossRef]
  21. Dong, L.; Zhang, Y.; Ma, J. Micro-Crack Mechanism in the Fracture Evolution of Saturated Granite and Enlightenment to the Precursors of Instability. Sensors 2020, 20, 4595. [Google Scholar] [CrossRef]
  22. Ohtsu, M.; Tomoda, Y. Corrosion Process in Reinforced Concrete Identified by Acoustic Emission. Mater. Trans. 2007, 48, 1184–1189. [Google Scholar] [CrossRef] [Green Version]
  23. Rodríguez, P.; Celestino, T.B. Application of acoustic emission monitoring and signal analysis to the qualitative and quantitative characterization of the fracturing process in rocks. Eng. Fract. Mech. 2019, 210, 54–69. [Google Scholar] [CrossRef]
  24. Xu, X.; Dou, L.; Lu, C.; Zhang, Y. Frequency spectrum analysis on micro-seismic signal of rock bursts induced by dynamic disturbance. Int. J. Min. Sci. Technonol. 2010, 20, 682–685. [Google Scholar] [CrossRef]
  25. Aggelis, D.; Mpalaskas, A.; Matikas, T. Acoustic signature of different fracture modes in marble and cementitious materials under flexural load. Mech. Res. Commun. 2013, 47, 39–43. [Google Scholar] [CrossRef]
  26. He, M.; Miao, J.; Feng, J. Rock burst process of limestone and its acoustic emission characteristics under true-triaxial unloading conditions. Int. J. Rock Mech. Min. Sci. 2010, 47, 286–298. [Google Scholar] [CrossRef]
  27. Li, L.R.; Deng, J.H.; Zheng, L.; Liu, J.F. Dominant Frequency Characteristics of Acoustic Emissions in White Marble during Direct Tensile Tests. Rock Mech. Rock Eng. 2017, 50, 1337–1346. [Google Scholar] [CrossRef]
  28. Zhang, Y.; Wu, W.; Yao, X.; Liang, P.; Sun, L.; Liu, X. Study on Spectrum Characteristics and Clustering of Acoustic Emission Signals from Rock Fracture. Circuits Syst. Signal Process. 2019, 39, 1133–1145. [Google Scholar] [CrossRef]
  29. Wang, Y.; Han, J.; Li, C. Acoustic emission and CT investigation on fracture evolution of granite containing two flaws subjected to freeze–thaw and cyclic uniaxial increasing-amplitude loading conditions. Constr. Build. Mater. 2020, 260, 119769. [Google Scholar] [CrossRef]
  30. Ohnaka, M.; Mogi, K. Frequency characteristics of acoustic emission in rocks under uniaxial compression and its relation to the fracturing process to failure. J. Geophys Res. 1982, 87, 3873–3884. [Google Scholar] [CrossRef]
  31. Moradian, Z.; Einstein, H.H.; Ballivy, G. Detection of Cracking Levels in Brittle Rocks by Parametric Analysis of the Acoustic Emission Signals. Rock Mech. Rock Eng. 2015, 49, 785–800. [Google Scholar] [CrossRef]
  32. Xue, L.; Qin, S.; Sun, Q.; Wang, Y.; Qian, H. A quantitative criterion to describe the deformation process of rock sample subjected to uniaxial compression: From criticality to final failure. Phys. A Stat. Mech. Its Appl. 2014, 410, 470–482. [Google Scholar] [CrossRef]
  33. Zhang, J.Z.; Zhou, X.P.; Zhou, L.S.; Berto, F. Progressive failure of brittle rocks with non-isometric flaws: Insights from acousto-optic-mechanical (AOM) data. Fatigue Fract. Eng. Mater.Structures 2019, 42, 1787–1802. [Google Scholar] [CrossRef]
  34. Zhou, X.-P.; Zhang, J.-Z.; Qian, Q.-H.; Niu, Y. Experimental investigation of progressive cracking processes in granite under uniaxial loading using digital imaging and AE techniques. J. Struct. Geol. 2019, 126, 129–145. [Google Scholar] [CrossRef]
  35. Lennartz-Sassinek, S.; Main, I.G.; Zaiser, M.; Graham, C.C. Acceleration and localization of subcritical crack growth in a natural composite material. Phys. Rev. E 2014, 90, 052401. [Google Scholar] [CrossRef] [PubMed] [Green Version]
  36. Triantis, D.; Kourkoulis, S.K. An Alternative Approach for Representing the Data Provided by the Acoustic Emission Technique. Rock Mech. Rock Eng. 2018, 51, 2433–2438. [Google Scholar] [CrossRef]
  37. Tang, S.; Tong, M.; Hu, J.; He, X. Characteristics of acoustic emission signals in damp cracking coal rocks. Int. J. Min. Sci Technol. 2010, 20, 143–147. [Google Scholar] [CrossRef]
  38. Ebrahimian, Z.; Ahmadi, M.; Sadri, S.; Li, B.; Moradian, O. Wavelet analysis of acoustic emissions associated with cracking in rocks. Eng. Fract. Mech. 2019, 217, 106516. [Google Scholar] [CrossRef]
  39. Lee, I.-M.; Han, S.-I.; Kim, H.-J.; Yu, J.-D.; Min, B.-K.; Lee, J.-S. Evaluation of rock bolt integrity using Fourier and wavelet transforms. Tunn. Undergr. Space Technol. 2012, 28, 304–314. [Google Scholar] [CrossRef]
  40. Liu, X.; Liang, Z.; Zhang, Y.; Wu, X.; Liao, Z. Acoustic Emission Signal Recognition of Different Rocks Using Wavelet Transform and Artificial Neural Network. Shock. Vib. 2015, 2015, 1–14. [Google Scholar] [CrossRef] [Green Version]
  41. Liu, X.; Wu, L.; Zhang, Y.; Liang, Z.; Yao, X.; Liang, P. Frequency properties of acoustic emissions from the dry and saturated rock. Environ. Earth Sci. 2019, 78, 67. [Google Scholar] [CrossRef]
  42. Liu, X.-L.; Liu, Z.; Li, X.-B.; Rao, M.; Dong, L.-J. Wavelet threshold de-noising of rock acoustic emission signals subjected to dynamic loads. J. Geophys. Eng. 2018, 15, 1160–1170. [Google Scholar] [CrossRef] [Green Version]
  43. Wang, Y.; Chen, S.J.; Liu, S.J.; Hu, H.X. Best wavelet basis for wavelet transforms in acoustic emission signals of concrete damage process. Russ. J. Nondestruct. Test. 2016, 52, 125–133. [Google Scholar] [CrossRef]
  44. Wang, Z.; Ning, J.; Ren, H. Frequency characteristics of the released stress wave by propagating cracks in brittle materials. Theor. Appl. Fract. Mech. 2018, 96, 72–82. [Google Scholar] [CrossRef]
Figure 1. Rock mechanics test system and acoustic emission test layout. (a) PCI-II acoustic emission system; (b) TAW-2000 triaxial hydraulic servo testing machine; (c) the layout of acoustic emission monitoring probe.
Applsci 11 08236 g001
Figure 2. Stress–strain curve obtained from the triaxial test.
Applsci 11 08236 g002
Figure 3. SEM scanning image. (a) A1, (b) B1, (c) C1.
Applsci 11 08236 g003
Figure 4. Stress–strain F(τ) evolution curves of granites. (a) A1, (b) B1, (c) C1.
Applsci 11 08236 g004aApplsci 11 08236 g004b
Figure 5. Configuration of peak frequency and frequency centroid.
Applsci 11 08236 g005
Figure 6. Relationship between amplitude distribution and normalized axial stress. (a) A1, (b) B1, (c) C1.
Applsci 11 08236 g006
Figure 7. Relationship between peak frequency distribution and normalized axial stress. (a) A1, (b) B1, (c) C1.
Applsci 11 08236 g007
Figure 8. Relationship between frequency centroid distribution and normalized axial stress. (a) A1, (b) B1, (c) C1.
Applsci 11 08236 g008
Figure 9. Time domain waveform of the P-signals of each sample. (a) A1.No.17715, (b) B1.No.8200, (c) C1.No.6375.
Applsci 11 08236 g009
Figure 10. Frequency domain waveform of the P-signals of each sample. (a) A1.No.17715, (b) B1.No.8200, (c) C1.No.6375.
Applsci 11 08236 g010
Figure 11. Percentage of energy in each frequency band of the P-signals.
Applsci 11 08236 g011
Table 1. Mechanical parameters of deep granites.
SpecimenHeight/mmDiameter/mmWeight/gDensity/g/cm3Confining Pressures/MPa
A1100.8150.045182.61310
A2100.5350.055092.575
A3100.2850.215142.590
A4100.9650.145232.625
B1100.3050.035162.61720
B2100.2150.315122.572
B3100.4650.075212.635
B4100.7550.025162.608
C1100.0850.195252.65330
C2100.6550.005132.597
C3100.1250.225172.608
C4100.3650.065152.609
Table 2. Corresponding labels to band ranges.
Sub-Band LabelFrequency Band Range/kHz
10~31.25
231.25~62.5
362.5~93.75
16478.75~500
Publisher’s Note: MDPI stays neutral with regard to jurisdictional claims in published maps and institutional affiliations.

