Article

Effect of Urea Addition on Anatase Phase Enrichment and Nitrogen Doping of TiO2 for Photocatalytic Abatement of Methylene Blue

1
Department of Chemistry, The University of Lahore, 1-Km Raiwind Road, Lahore 54000, Pakistan
2
Institute of Energy and Environmental Engineering, University of the Punjab, Lahore 54590, Pakistan
3
Department of Chemical Engineering, COMSATS University Islamabad, Lahore 54000, Pakistan
4
School of Chemical and Materials Engineering (SCME), National University of Sciences and Technology, Sector H-12, Islamabad 44000, Pakistan
5
Department of Electronic Engineering, Faculty of Applied Energy System, Jeju National University, Jeju-si 63243, Korea
*
Authors to whom correspondence should be addressed.
These authors contributed equally to this work.
Appl. Sci. 2021, 11(17), 8264; https://doi.org/10.3390/app11178264
Submission received: 10 August 2021 / Revised: 30 August 2021 / Accepted: 1 September 2021 / Published: 6 September 2021
(This article belongs to the Special Issue Anatase Chemistry, Nanostructures and Functionalities‎)

Abstract

:
TiO2-based materials are commonly employed as photocatalysts for industrial wastewater treatment. The primary reasons of employing TiO2 include cost effectiveness, ready availability, eco-friendliness, non-toxic behavior, and exceptional resistance towards photo-corrosion. However, the wider band gap of pure TiO2 restricts its performance because of its optical absorption of solar light to the ultraviolet (UV) region only, and to some extent of photo-excited charge recombination. In the present work an attempt is made to develop a facile synthesis approach by using urea, a cheap chemical precursor, to form nitrogen doped TiO2 with the key objective of extended light absorption and thus enhanced photocatalytic performance. It was also observed that the urea-induced anatase phase enrichment of TiO2 is another key factor in promoting the photocatalytic performance. The photocatalysts prepared by varying the amount of urea as a nitrogen dopant precursor, are characterized using X-ray diffraction (XRD), scanning electron microscopy (SEM), Fourier transform infrared (FTIR) spectroscopy, and photoluminescence (PL) to evaluate their crystallinity, morphology, functional groups, and charge separation properties, respectively. Moreover, the surface area was also estimated by physicochemical adsorption. The maximum nitrogen-doped sample yielded >99% photodegradation efficiency of methylene blue (MB) dye-simulated wastewater as compared to a pure TiO2 sample which exhibited 6.46% efficiency. The results show that the simultaneous factors of nitrogen doping and anatase phase enhancement contributes significantly towards the improvement of photocatalytic performance.

1. Introduction

The industrial contamination of water, soil, or air, has always been an alarming issue for the human beings and life on Earth [1,2,3,4]. One vital constituent that severely affects the earth lifecycle is use of unhygienic and contaminated water due to industrial effluents and pollution. Hence, surrounded by industrialization and farming leftover, the major cause of organic impurities in water can be ascribed to the disposal of industrial wastewater without proper treatment. Amongst industries, the textile industry contributes to a great extent to water contamination and pollution, specifically in developing or underdeveloped countries [3,5,6]. The toxins present in textile wastewater consist of unmanageable toxic-colored dyes, surfactants, along with many chlorine-containing amalgams [3,5,7]. These dyes have the ability to persist in the environment for a prolonged time. The textile industry employs a variety of dyes which mainly consists of azo compounds, anthraquinones, diarylmethanes, phthalocyanines, etc. As reported approximately 70% of industrial wastewater consists of azo dyes [7]. These azo dyes are cancer-causing and also mutagenic in nature. They come into the body through incorporation as well as processing via gastric microbes and harming human and animal life.
Recent investigations have paid attention to numerous wastewater treatment procedures such as biodegradation, coagulation, adsorption, chemical treatment, advanced oxidation processes (AOPs), and membrane processes [8]. Amongst the abovementioned approaches, AOP seems one of the favorable methods for degradation of organic dyes as it is a cost-effective, easy, and competent approach with the ability to degrade dye compounds into CO2, water and other less hazardous intermediates. Amongst the various AOPs, photocatalysis is considered as a viable, renewable and eco-friendly approach for wastewater treatment [9,10,11,12]. Photocatalysis employs a photocatalyst, generally a semiconductor material, and light for the treatment of organic compounds in wastewater. Under light irradiation, photo-excited charges are generated which initiate electrochemical reactions with wastewater on their surface and decompose the organic contaminants completely or partially into harmless intermediates. Amongst the variety of photocatalysts being investigated, titanium dioxide (TiO2) is still a widely used photocatalyst because of its abundance, cost effectiveness and excellent properties such as nontoxicity, high excitation binding energy, and photocatalytic active crystal phases (anatase, rutile and brookite) [13,14,15,16]. Despite of all these benefits, TiO2 has some major drawbacks including its limited optical absorption, i.e., limited light absorption due to a wide band gap (3.2 eV), and moderate recombination of photo-excited charge carriers (e/h+), influencing its photocatalytic performance. Hence, to improve the photocatalytic performance of TiO2, several strategies have been employed with the objective of narrowing down the band gap of TiO2 which include methods such as metal and non-metals doping [17], noble metal loading [18,19], hetero-junction structures [16,20,21,22,23,24] and TiO2-based composites [20,23,25,26]. Doping/co-doping with non-metals e.g., nitrogen, sulphur, carbon, fluorine, etc. in TiO2 framework, are economical and capable of narrowing down the band gap leading to efficient photocatalyst behavior due to the resulting enhanced optical absorption [27,28].
Amongst the various doped TiO2 materials, nitrogen-doped TiO2 (N-TiO2) have received wider attention for various applications. In N-TiO2, nitrogen impurities are incorporated into the TiO2 lattice, influencing mainly the optical properties via generation of new states leading to enhanced photocatalytic performance [29,30]. Until today a variety of procedures have been adopted for the synthesis of N-TiO2 such as gas annealing processes (using gases such as ammonia), or by a wet chemical approaches employing thiourea, liquid ammonia, hydrazine or nitric acid as a nitrogen doping source [29,30,31,32,33,34,35,36,37,38,39,40]. Although all such approaches provide efficient photocatalysts with improved performance, however they utilize somewhat complex procedures for the nitrogen doping during the synthesis process. Hence, to overcome the key issue of complex synthesis procedure, and use of risky and unsafe doping precursors such as acids and highly basic ammonia, it is important to develop a synthesis approach which is facile, less complicated and employs no or less toxic doping precursors.
In the present study, a facile two-step synthesis strategy has been proposed, employing urea as an inexpensive nitrogen source for nitrogen doping, which can lower the cost of doped TiO2 for textile wastewater treatment. Urea interestingly also intensifies the anatase phase of TiO2 when its amount is increased. As well-established, TiO2 anatase phase is the most photocatalytic-active phase, thus the synergistic effect of urea as a dopant source leads to the formation of narrowed band gap nitrogen-doped TiO2 with an enriched anatase phase. The photocatalytic performance of the prepared samples was evaluated by their tendency to degrade a simulated MB dye-containing wastewater.

2. Materials and Methods

2.1. Chemicals and Materials

The materials and reagents employed for the synthesis of the photocatalyst includes: Titanium (IV) isopropoxide (TTIP, 97%, Sigma Aldrich, Beijing, China), ethanol (C2H5OH, 96%, Sigma Aldrich), urea ((CH4N2O), 98%, Daejung Chemicals, Daejeon, South Korea) were used. Deionized (DI) water having resistivity > 18.0 MΩ and conductivity of 0.055 µS was used for washing purposes during all the experiments. Methylene blue (MB, Sigma Aldrich, Bangalore, India) dye was purchased and employed to evaluate the photocatalytic activity of the prepared samples.

2.2. Synthesis of Pure and Nitrogen-Doped TiO2 Samples

The synthesis of nitrogen-doped TiO2 (NT) was accomplished by a facile two step synthesis strategy. In the first step a specified amount of urea is completely dissolved in ethanol (50 mL) followed by addition of a fixed volume (4.6 mL) of TTIP. Upon addition of TTIP, white precipitates of Ti(OH)2 are formed rapidly which are kept under stirring for at least 1 h to achieve homogeneous mixing. In the second step, this solution containing Ti(OH)2 precipitates is evaporated by placing the solution on a hotplate until a white powder is left over. The obtained samples were washed with DI water, dried at 100 °C in an oven for 24 h followed by calcination at 450 °C for 5 h in a muffle furnace resulting in yellow colored NT samples. To study the influence of urea as a doping precursor, three different samples were prepared with varied amounts of urea i.e., 0.983 g, 1.965 g and 2.940 g, identified as NT-1, NT-2, and NT-3, respectively. As a reference pure TiO2 was also synthesized by following the same procedure.

2.3. Materials Characterizations

The crystallinity of the as-prepared photocatalysts were examined by X-ray diffraction (XRD), using an X-pert powder diffractometer (PanAnalytical, Almelo, Netherlands) furnished with Cu-Kα (X-ray wavelength of 1.5406 Å), within 2θ = 10–80° range, scan-speed of 200 seconds/step and a step-size of 0.02°. Morphological analysis of the samples was performed by using scanning electron microscopy (SEM, TESCAN Vega LMU, Tescan, Kohoutvoice, Czech Republic) operating at 15 kV voltage. The size estimation of the nanoparticles employing SEM images was performed using the Image J 1.53 K software. Raman and photoluminescence (PL) spectra were obtained using an InVia Raman microscope (Renishaw, Wotton-under-Edge, England, UK) with a 514 nm excitation laser light source. Fourier transform infrared (FTIR) spectra were recorded for functional group analysis using a Spectrum II spectrometer by Perkin Elmer (Waltham, MA, USA) in the attenuated total reflectance (ATR) mode. Thermogravimetric analysis (TGA) of the samples were performed using a TGA-701 instrument (LECO, St. Joseph, MI, USA). Thermogravimetric analysis (TGA) of all samples was performed under continuous air flow (60 mL/min), heating up to 500 °C with a ramp of 20 °C/min.
UV-Vis diffuse reflectance spectra (DRS) of the samples were recorded using a V-770, UV-Visible/NIR spectrophotometer (Jasco, Mary’s court, Easton, PA, USA) within a wavelength range of 200–800 nm. Surface area of the as prepared samples was examined using a Tristar II 3020 system (Micrometrics, Norcross, GA, USA). All the samples were degassed at 150 °C, before analysis, and the isotherms were controlled at −196 °C. The exposed surface area of the samples was examined using Brunauer-Emmet-Teller (BET) method. The BET equation employed for surface area measurement of the samples is as follows [41]:
S = X m L a v A m / M v
where S = Total surface area. Xm = Monolayer capacity. Lav = Avogadro’s number. Am = cross sectional area of the adsorbate. Mv = Molar volume of the gas absorbed. The electronic states of Ti, O, N and C in pure TiO2 and NT-3 samples were analyzed by X-ray photoelectron spectroscopy (XPS) using Al Kα line as X-ray source. Peaks fitting for the XPS spectrum was done by the Gaussian method.

2.4. Photocatalytic Performance Evaluation

The photocatalytic activity performance of the as-prepared materials was assessed by the photocatalytic degradation capability for MB dye simulated textile wastewater. In brief 0.05 g of the photocatalyst was added to 100 mL of a 5.0 mgL−1 aqueous solution of MB dye and photocatalytic degradation efficiency was investigated. The solution was stirred for 60 min. in dark to achieve adsorption-desorption equilibrium between the photocatalyst and the dye. Afterwards the MB dye solution with photocatalysts is subjected to light illumination generated by 500 W xenon lamp for 120 min. An aliquot of 5.0 mL of the solution was recovered from the solution every 30 min., during the illumination period, centrifuged (6000 rpm for 5 min, Pro Research K241, Centurion Scientific, Chichester, UK), and MB dye degradation analyzed using UV-Vis absorption spectrometer (Biobase, BK-UV1900 PC, Jinan, China).
The formula for calculating the photocatalytic efficiency (%) is presented in Equation (2):
Photocatalytic   efficiency   % = Co   Ct Co × 100
where, Co (mg L−1) is the initial concentration and Ct (mg L−1) is the concentration at time t, after light irradiation.

3. Results and Discussion

3.1. Crystallinity

The crystallinity of the prepared samples was investigated by obtaining the corresponding XRD patterns, as exhibited in Figure 1. It is obvious that all samples display diffraction peaks occurring at 2θ values of 25.2, 37.9, 48.1, 62.8 and 75.16 degrees, corresponding to d101, d004, d200, d204 and d215 of anatase phase, [16,42] with no additional peak or peak shifting being observed upon urea addition. However, few peaks of rutile phase with low intensity are also observed appearing at 2θ values of 54.64, 56.56, 69.26, 69.83 degrees corresponding to d211, d220, d301, d112 of rutile phase, respectively [43,44]. Furthermore, all the peaks of anatase phase are increased with the increment of the urea amount. Such an effect can be explained based on the pH increment that occurs with the addition of the urea in solution, promoting the formation of anatase phase. When urea is dissolved in ethanol solvent, the pH value of the solution increases. Further on addition of TTIP, the urea can react with H2O to produce ammonium hydroxide (NH4OH), carbon dioxide and ammonia gas [45]. The ammonium hydroxide can be dissociated to NH4+ and OH to hydrolyze Ti4+, and the presence of ammonia increases the pH of solution, which finally results in higher anatase phase composition. Thus, urea simultaneously promotes the formation of anatase phase as well as nitrogen doping of TiO2.
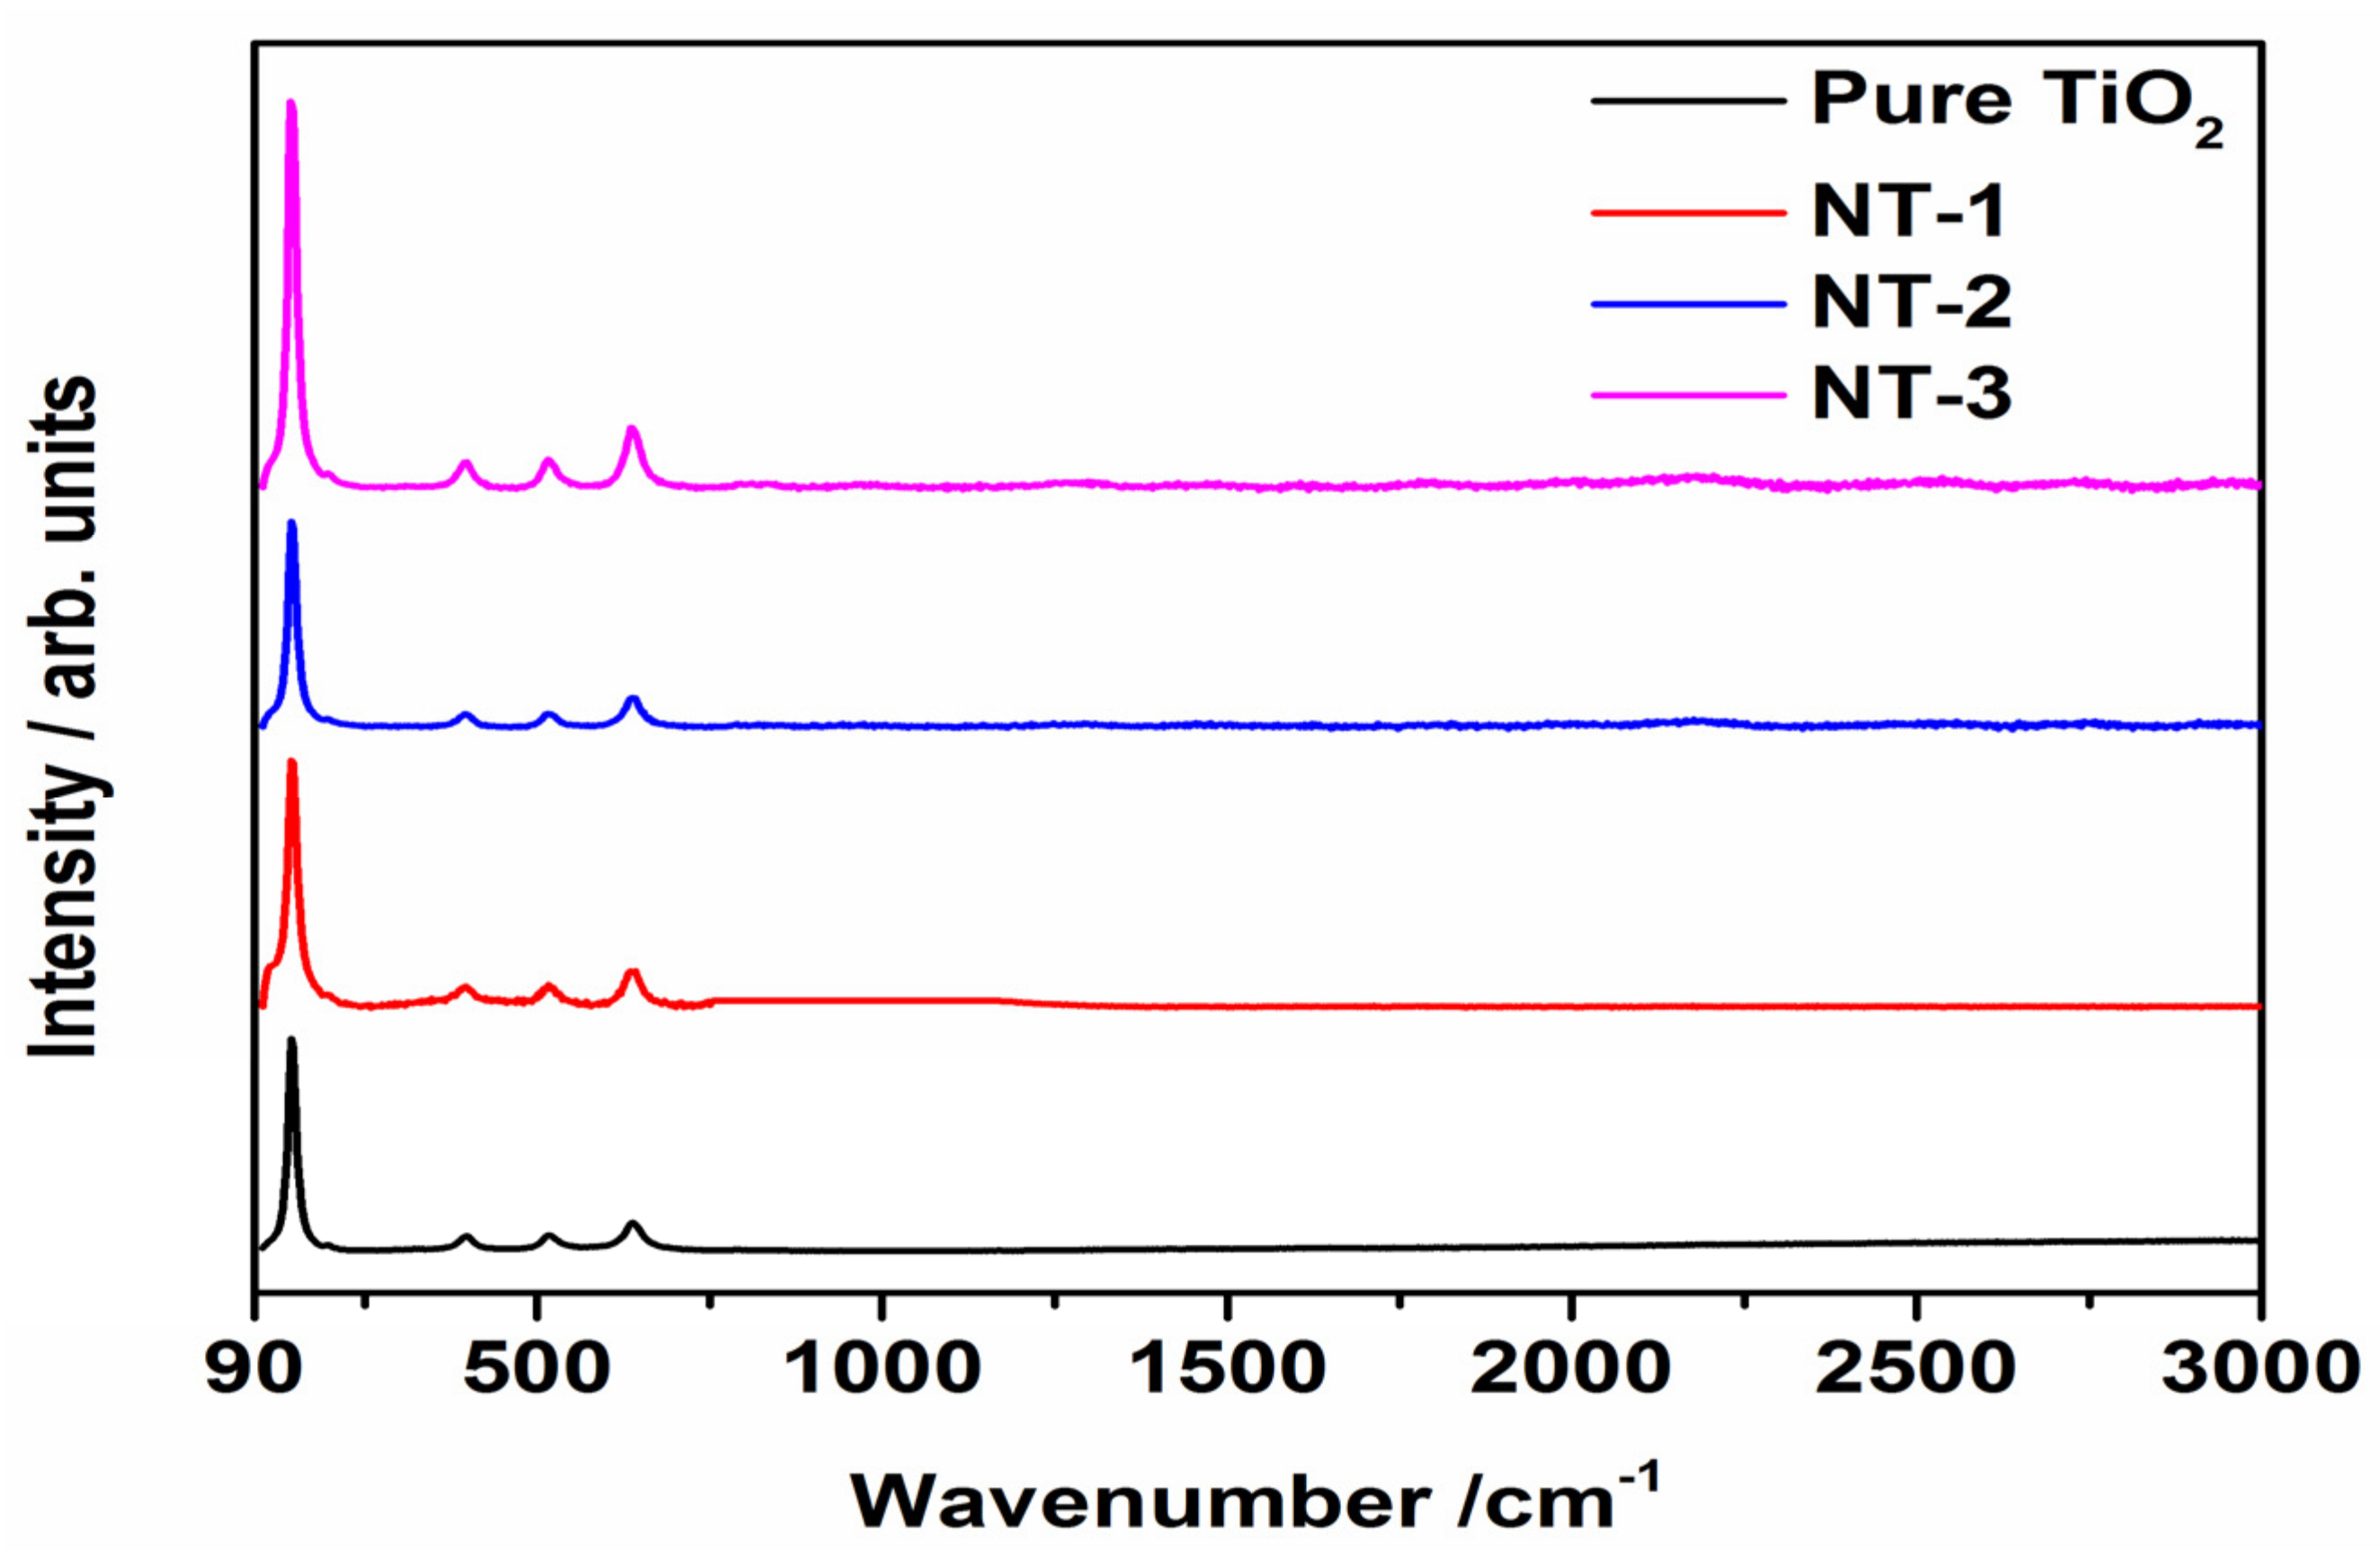
Further investigation of the crystalline phase and Raman modes of vibration were analyzed using Raman spectroscopy as shown in Figure 2. It can be observed that all samples exhibit Raman bands at 148 cm−1, 400 cm−1, 515 cm−1 and 640 cm−1 which mainly corresponds to anatase TiO2 [16,46]. The intensity of all the mentioned peaks intensifies with the increase of urea concentration as it goes from pure TiO2 to NT-3 sample, thus confirming the urea effect for anatase phase enrichment. Moreover, the increased intensity of all the Raman peaks can be ascribed to the enhanced crystallinity along with enriched anatase phase.

3.2. Morphological Analysis

The morphological analysis of as-prepared samples was carried out by performing scanning electron microscopy, as shown in Figure 3. Spherical aggregated morphology with a high packing density and narrow particle size distribution can be seen for all synthesized samples. However, the diffusion of nanospherical aggregates was observed at multiple locations owing to the addition of nitrogen into the titania lattice. It is further observed that the addition of urea reduces the agglomeration of nanoparticles, with the increased size of nanoparticles. On further increasing the amount of urea, the nanoparticles dispersion deteriorates, and agglomeration again dominates but the size of nanoparticles becomes smaller, revealing a narrower particle size distribution. The average sizes of the nanoparticles estimated using SEM images (via Image J software) are found as: 146 nm for pure TiO2, 116 nm for NT-1, 115 nm for NT-2, and 109 nm for NT-3 samples.

3.3. Fourier Transform Infrared Spectroscopy (FTIR) Analysis

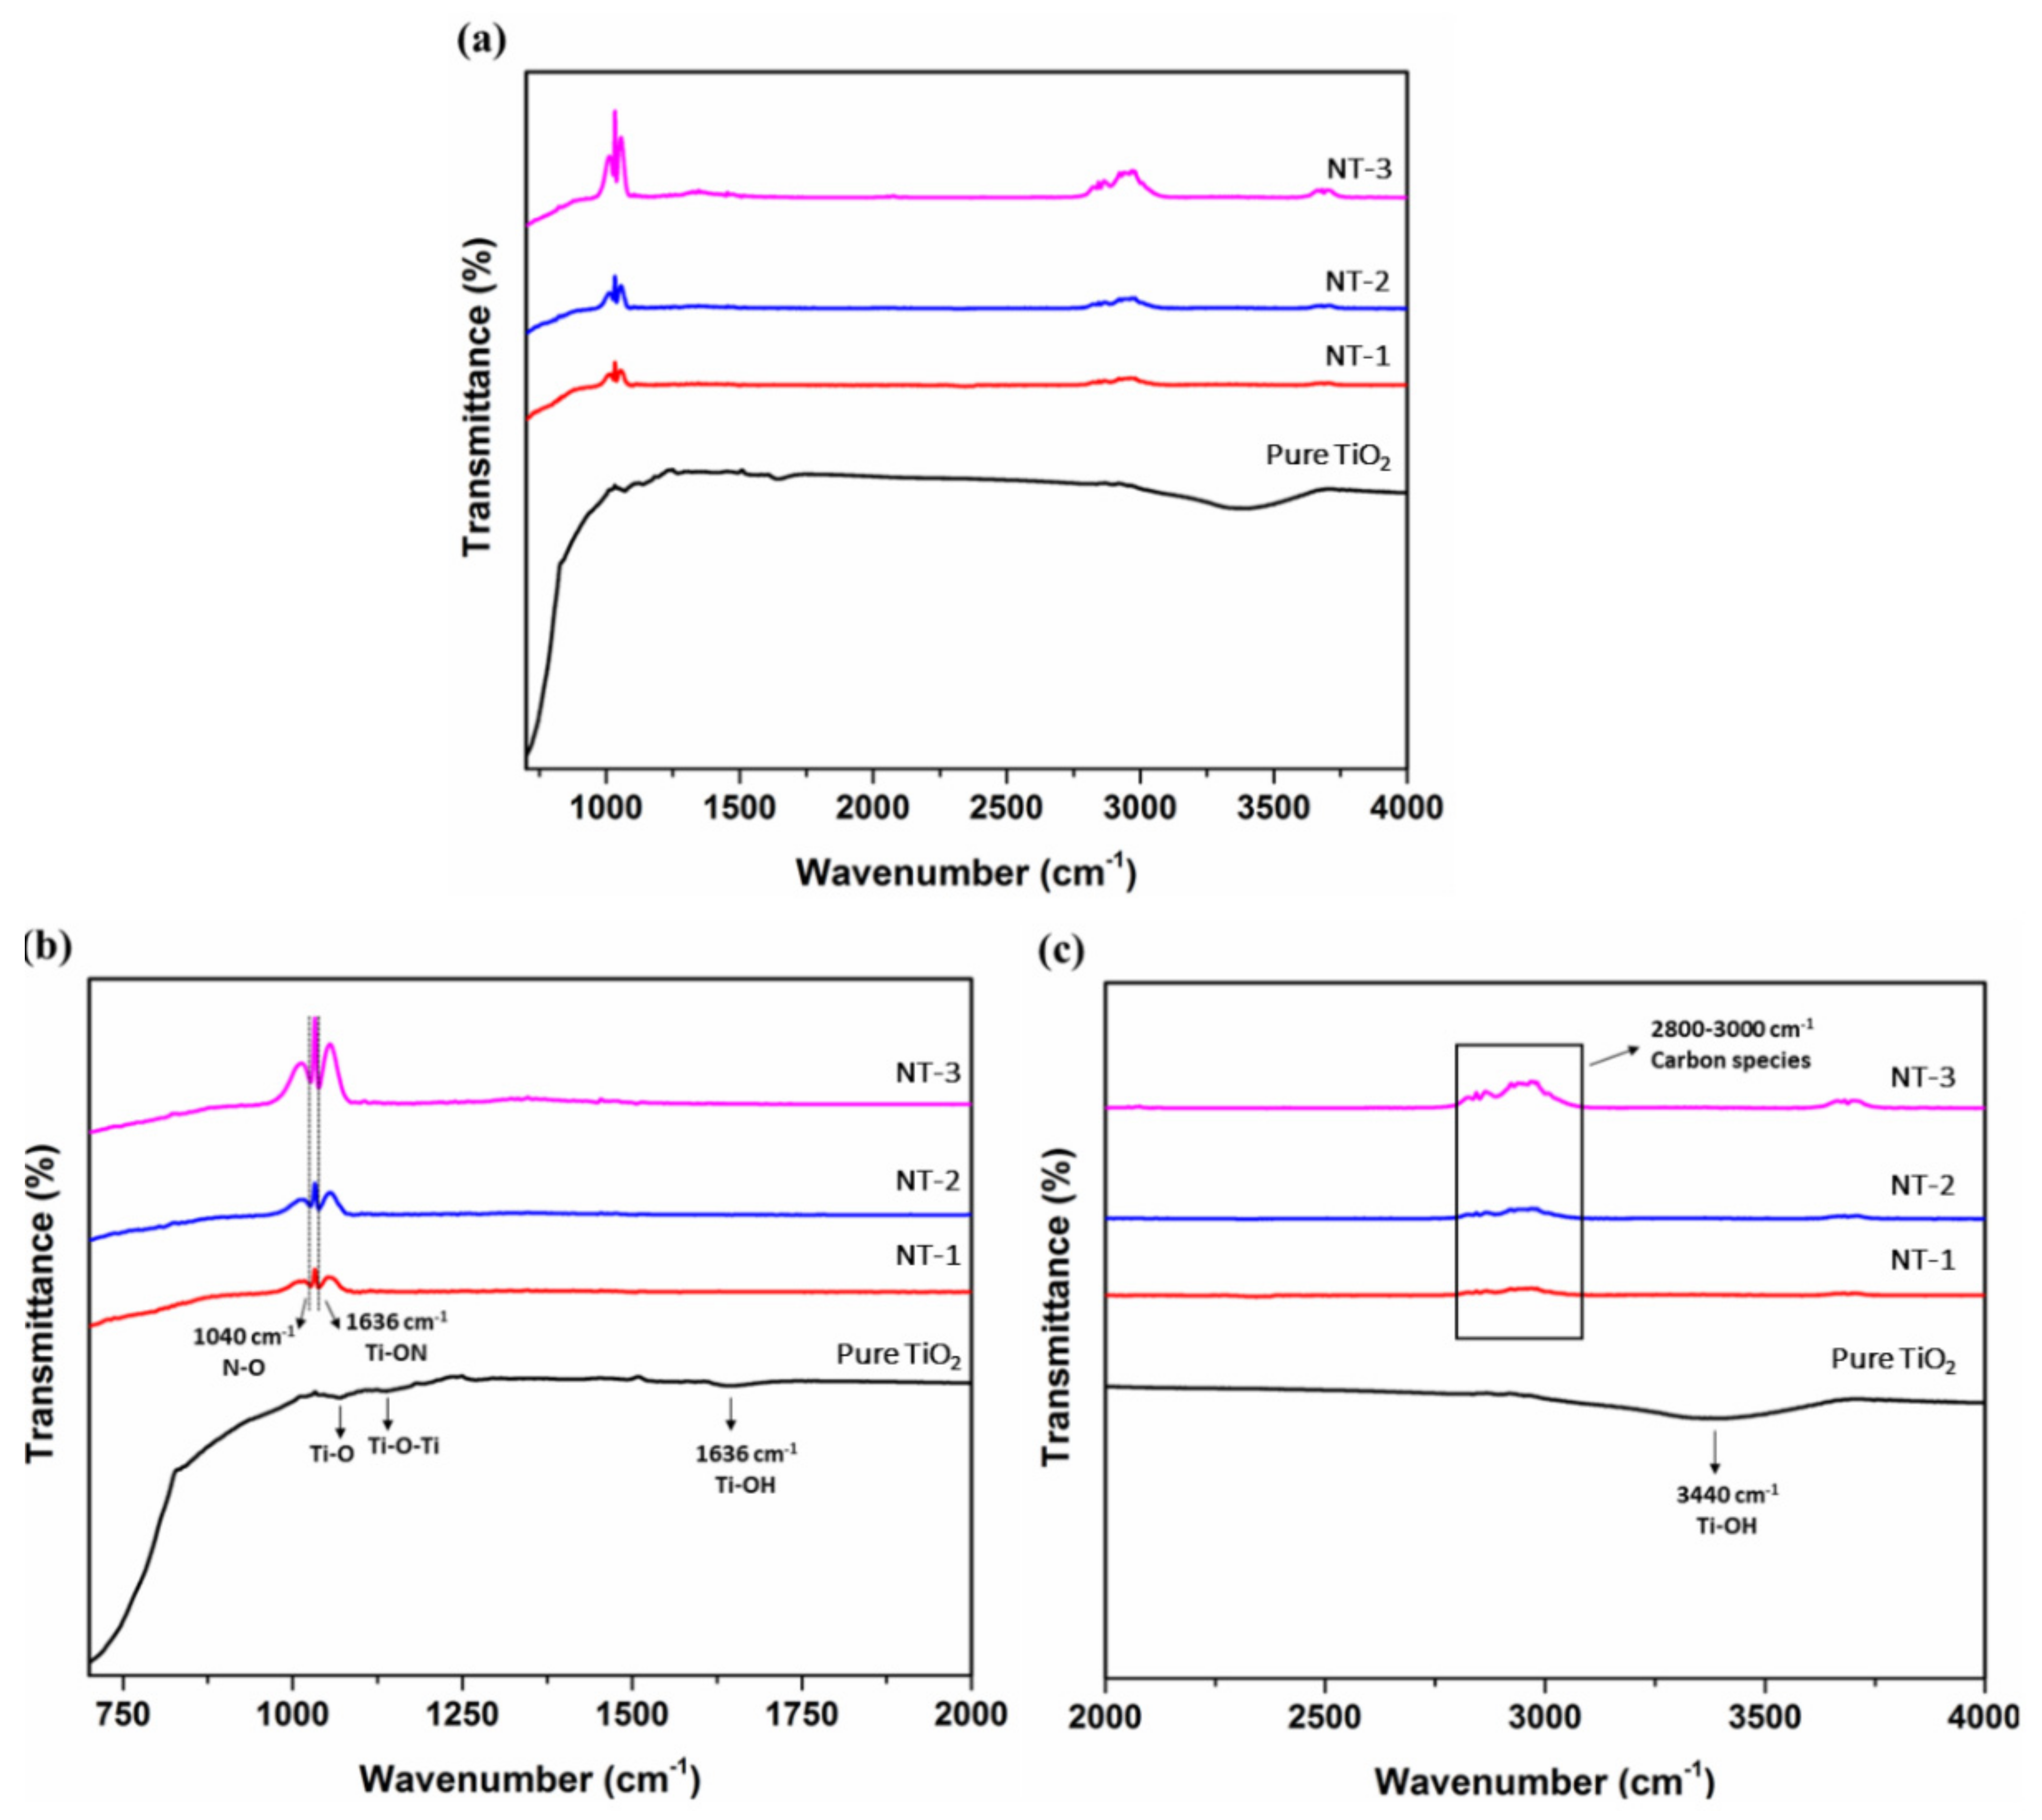
The doping of nitrogen into the titania lattice was further confirmed by the FTIR spectra. The FTIR spectra of all as-prepared samples are shown in Figure 4. The complete spectrum is shown in Figure 4a, whereas the enlarged view of regions between 750–2000 cm−1, and 2000–4000 cm−1 are shown in Figure 4b,c, respectively. The transmittance peaks for pure TiO2 can be observed within range of 1100–1200 cm−1 and is associated to the stretching vibrations of Ti-O and Ti-O-Ti bonds in the TiO2 lattice (Figure 4b). The peaks observed near 1636 cm−1 (Figure 4b) and 3440 cm−1 (Figure 4c) corresponds to the bending and stretching vibrations of the O-H bond related to the absorbed water molecules [47,48]. For all NT samples the transmittance peaks are observed appearing in the ranges of 1000–1100 cm−1 (Figure 4b), and 2800–3000 cm−1 (Figure 4c). The two peaks appearing in the first region at 1040 and 1090 cm−1, can be attributed to the interstitial N-O bond and Ti-O-N bond, respectively [32,49]. However, the peaks observed in the second region are probably due to the presence of C-H stretching vibrations because of organic species from the synthesis precursors during calcination [32].

3.4. Thermogravimetrical Analysis (TGA)

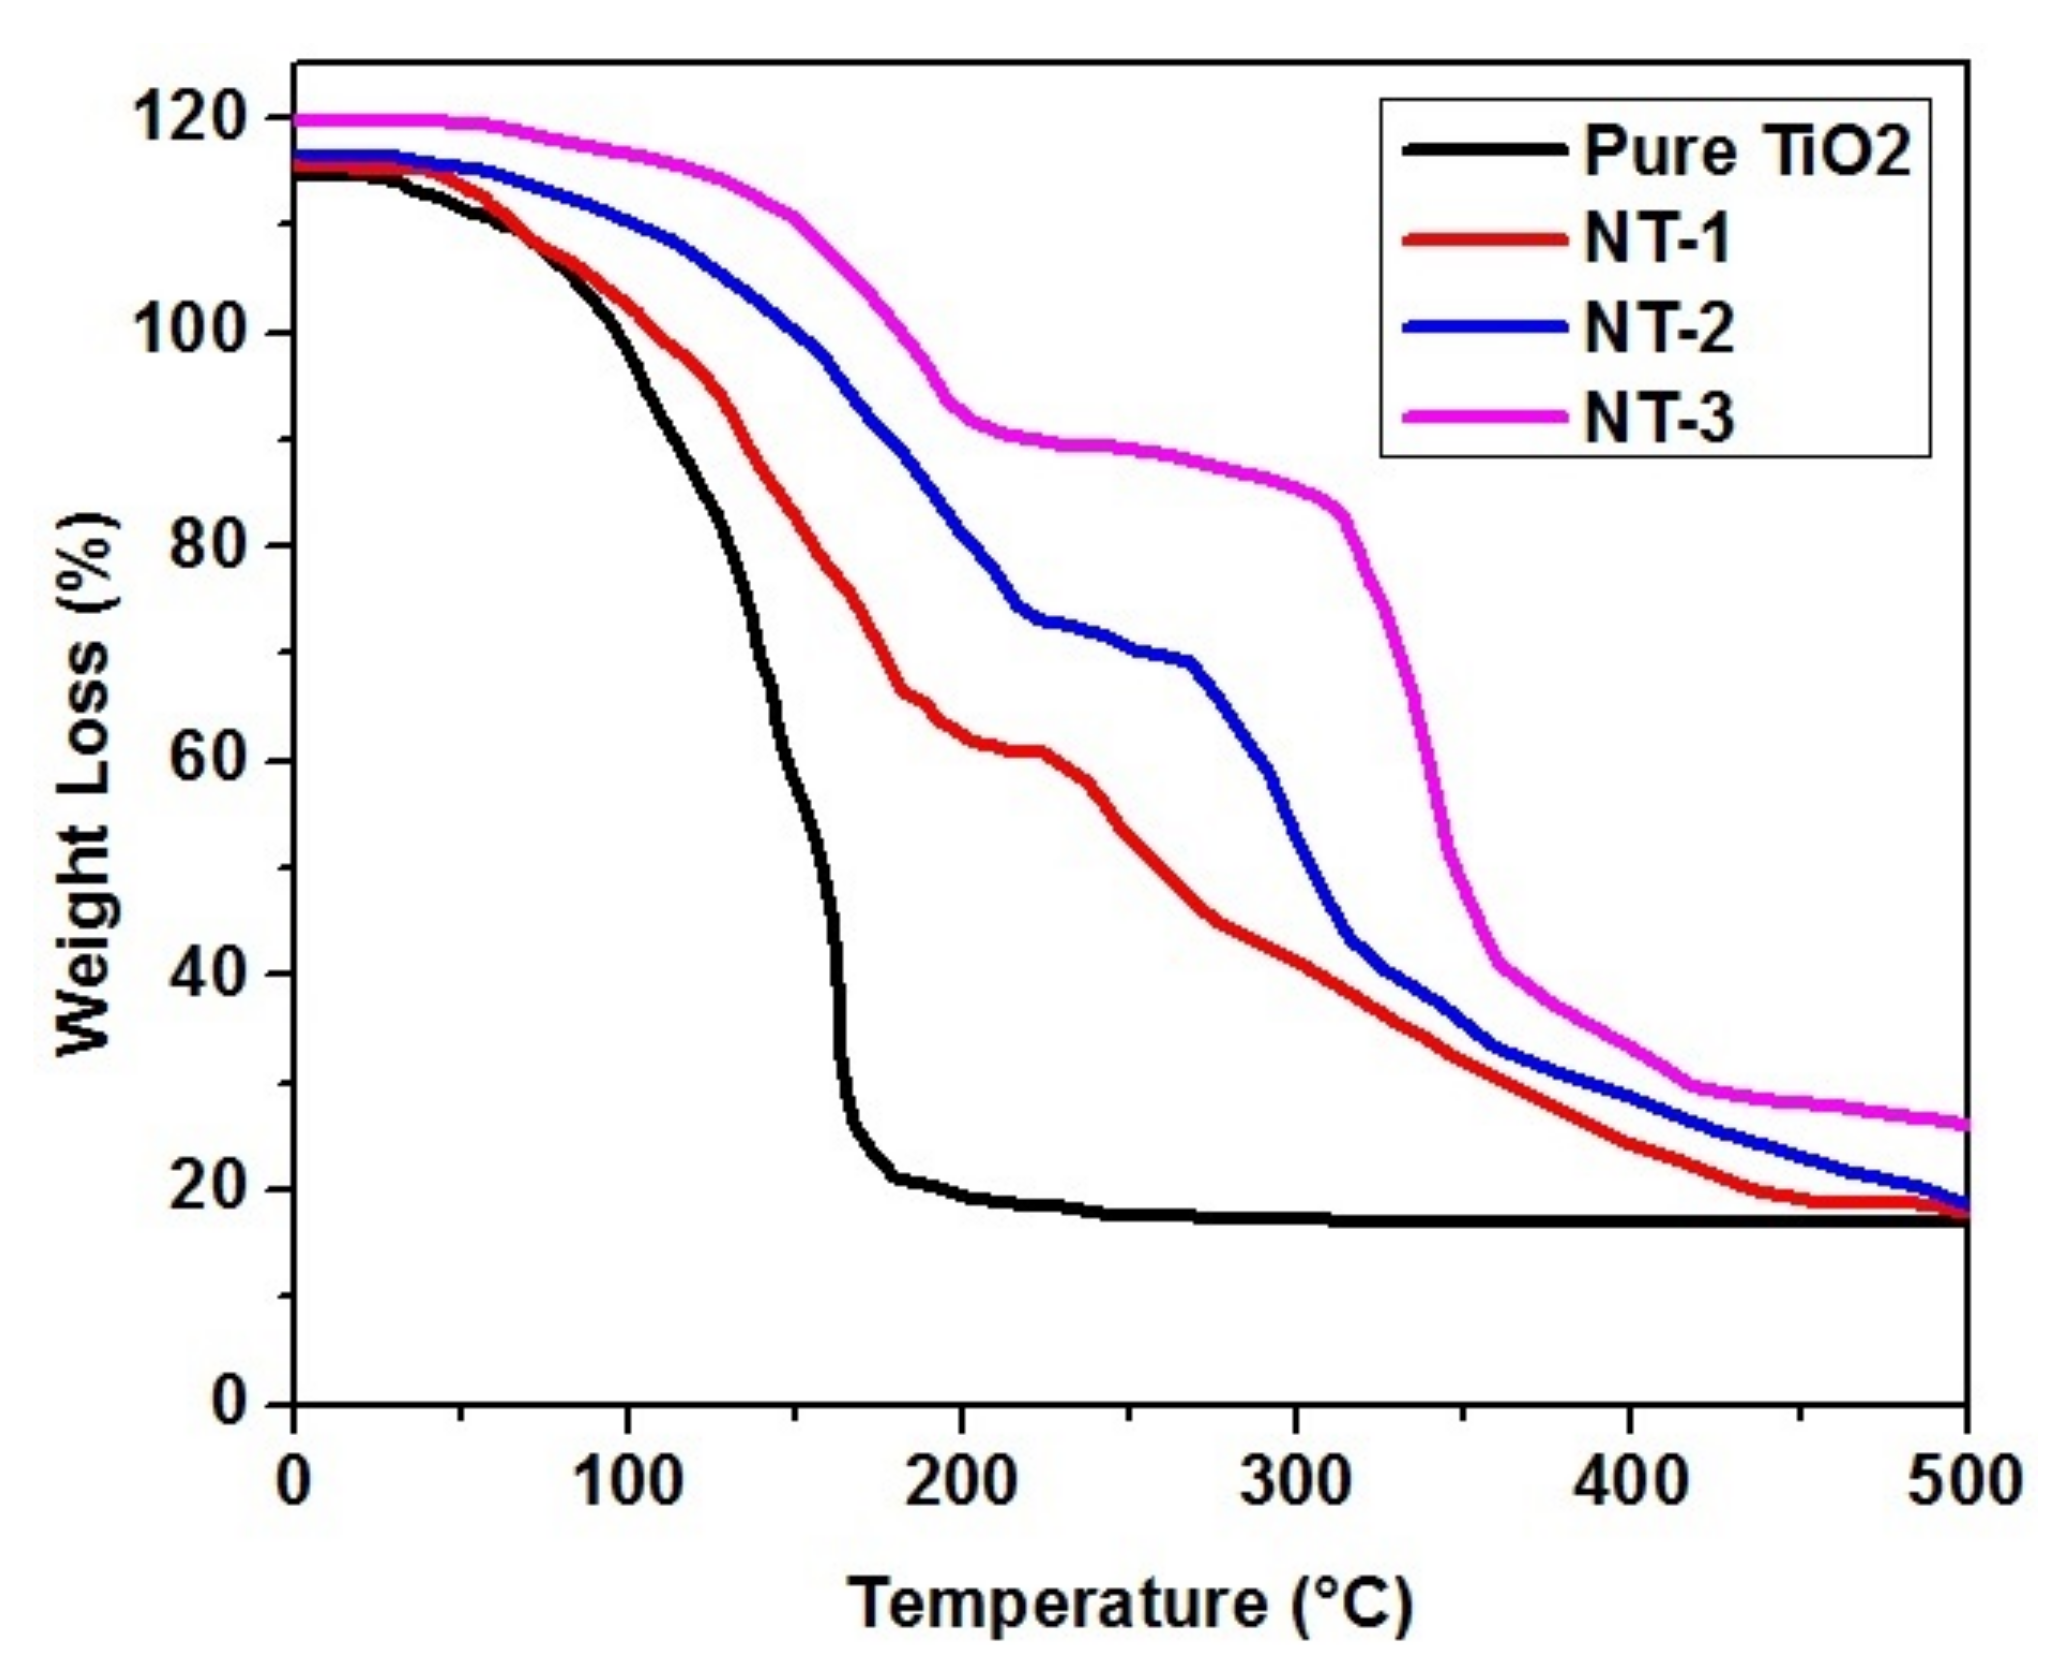
The comparative investigation between pure TiO2 and NT samples was also supported by thermogravimetric analysis. Figure 5 displays the TGA thermograms for pure TiO2 and all NT samples. It can be observed that for pure TiO2 sample, the TGA curve declines in the range of 150–200 °C, indicating a weight loss mainly due to the evaporative loss of water or any organic matter involved during the synthesis. However, the NT samples, on the contrary, exhibits two weight loss regions; the first region in between 150–200 °C and the second region lies between 220–350 °C. The weight loss in the first region can be associated similarly as the evaporative loss of water from pure TiO2 whereas, the second weight loss region can be attributed to the degradation of an organic matrix such as urea used as nitrogen dopant, as reported earlier [50].

3.5. Optical Properties Investigation

UV-visible diffuse reflectance spectra (UV Vis DRS) of the prepared samples are shown in Figure 6a. It is obvious that pure TiO2 sample only exhibits light absorbance in the UV region (200–400 nm), with a band appearing around 390 nm. However, upon doping with nitrogen, the NT samples exhibit a clear red shift in light absorption thus supporting the doping of pure TiO2. It is well established that upon doping of external element such as nitrogen, new energy levels are created above the valence band which might results in the extension of light absorption and narrowing of the band gap. The band gap energy ( E g ) of pure TiO2 and NT samples are also estimated utilizing Tauc’s equation [15,51]. Tauc’s plot is generated by plotting the Kubelka-Munk function α h v 2 against band gap energy E g = h v = h c λ , where α is absorption coefficient, h is the Plank’s constant, and v is the frequency of radiation. The estimation of band gap is then done by extrapolation of the linear portion of curve to the zero value of the y-axis. The Tauc’s plots for pure TiO2 and NT samples are shown in Figure 6b. It is noticeable that pure TiO2 possesses a band gap of 3.4 eV, however upon N doping the linear portion of band edge intercepts at x-axis value of 2.75 eV, 2.60 eV, and 2.50 eV for NT-1, NT-2 and NT-3 samples, respectively. Hence based on UV Vis DRS measurements and band gap estimation it can be assured that the narrowing down of band gap and extension of light absorption is mainly due to N doping of TiO2 [29,30,31,34,35,36,38,40].
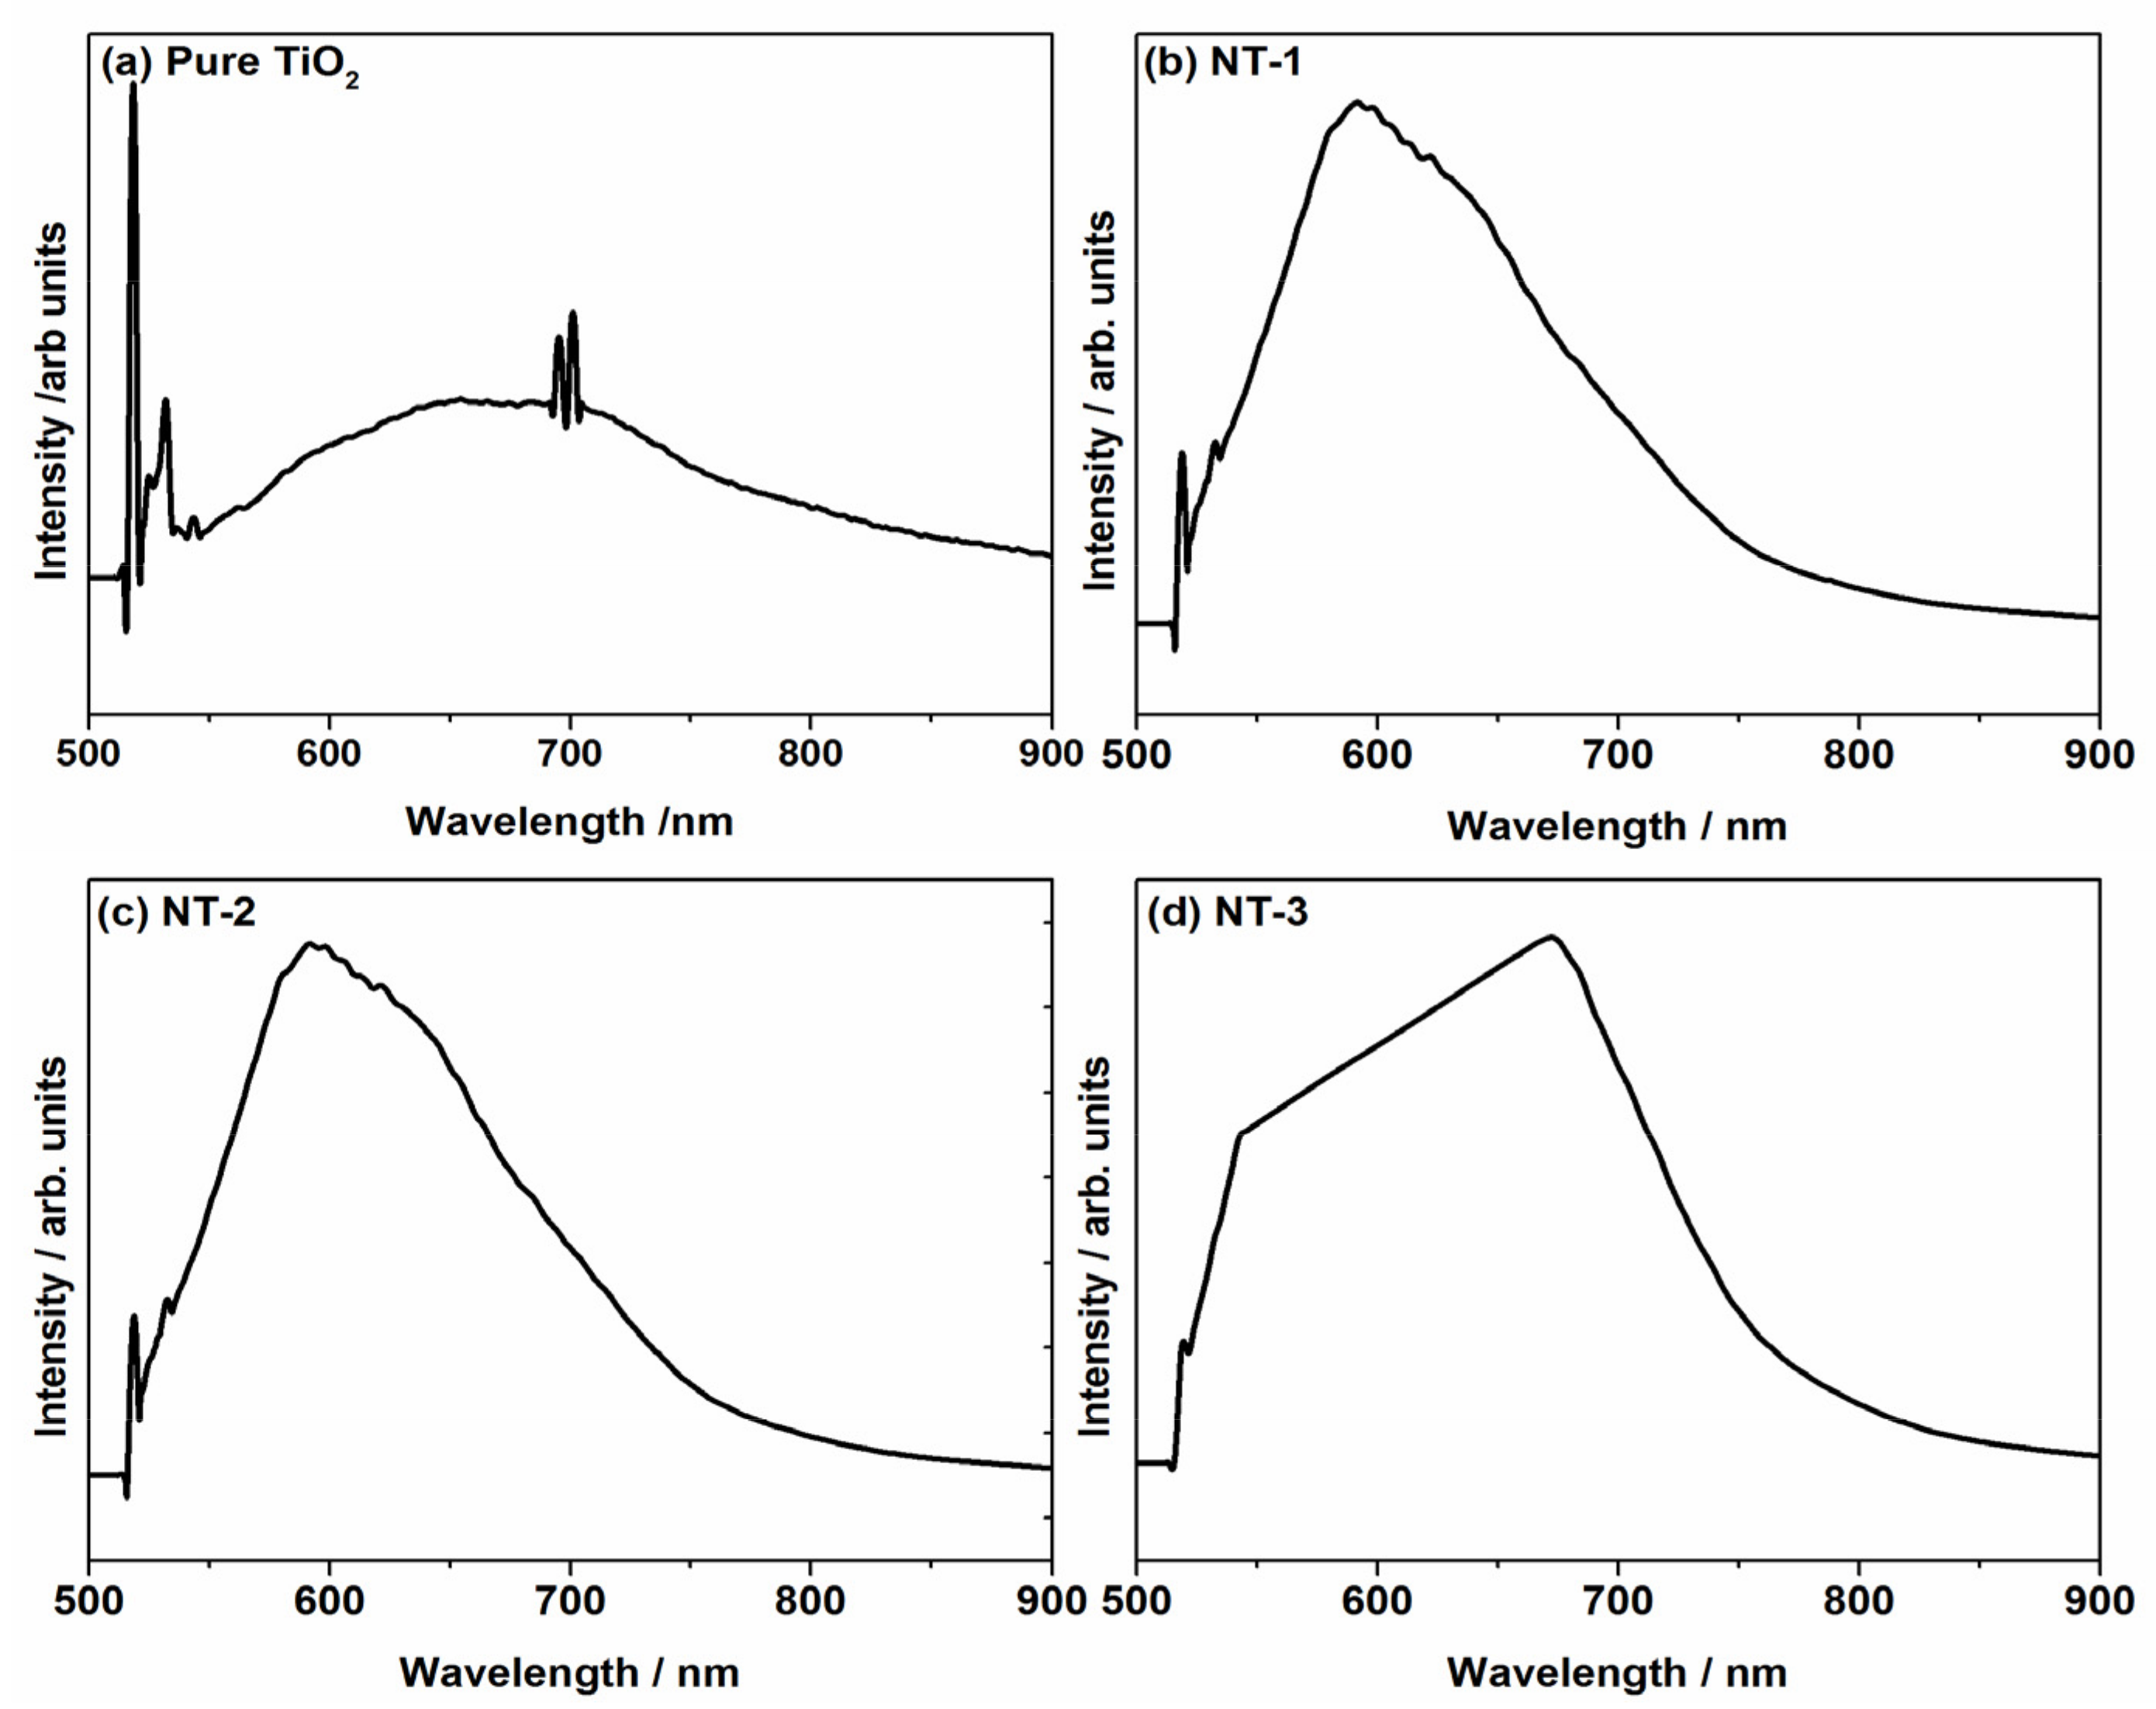
Figure 7 displays the PL spectra of all as-prepared samples. A sharp peak appearing within the range of 500–530 nm can be attributed to the band to band recombination, whereas a broad hump observed around 600 nm is mainly associated to the defects induced by foreign elements [52,53]. It can be observed that band to band peak is quenched for NT samples as compared to pure TiO2 thus indicating the efficient separation of photo-excited charges, whereas the later broad peak for NT samples is higher as compared to pure TiO2 thus again supporting the recombination of photo-excited charges, trapped by defects which were induced by doping process, and are less on the surface of pure TiO2.

3.6. Surface Area and Porosity Analysis

The surface area of the prepared samples is measured using the BET equation, and is an important parameter contributing the photocatalytic performance. When the surface area is higher the photocatalyst will provide more surface for reactions and thus better performance. The surface area and porosity of as-synthesized samples are summarized in Table 1. The small addition of urea resulted in a minor reduction of the surface area with minimal effect on the pore volume. However, upon increasing the amount of urea, a continual decrease in surface area and pore volume is observed. Thus, it can be seen that the surface area of the NT-3 samples is reduced to approximately 45% of pure TiO2. Such a decrease in the surface area can be attributed to the agglomeration of TiO2 nanoparticles and increased size as displayed by the SEM images. Thus, nitrogen doping creates defects and narrows the band gap, and with the anatase phase enrichment it makes NT samples more efficient despite their reduced surface area.

3.7. X-ray Photoelectron Spectroscopy (XPS)

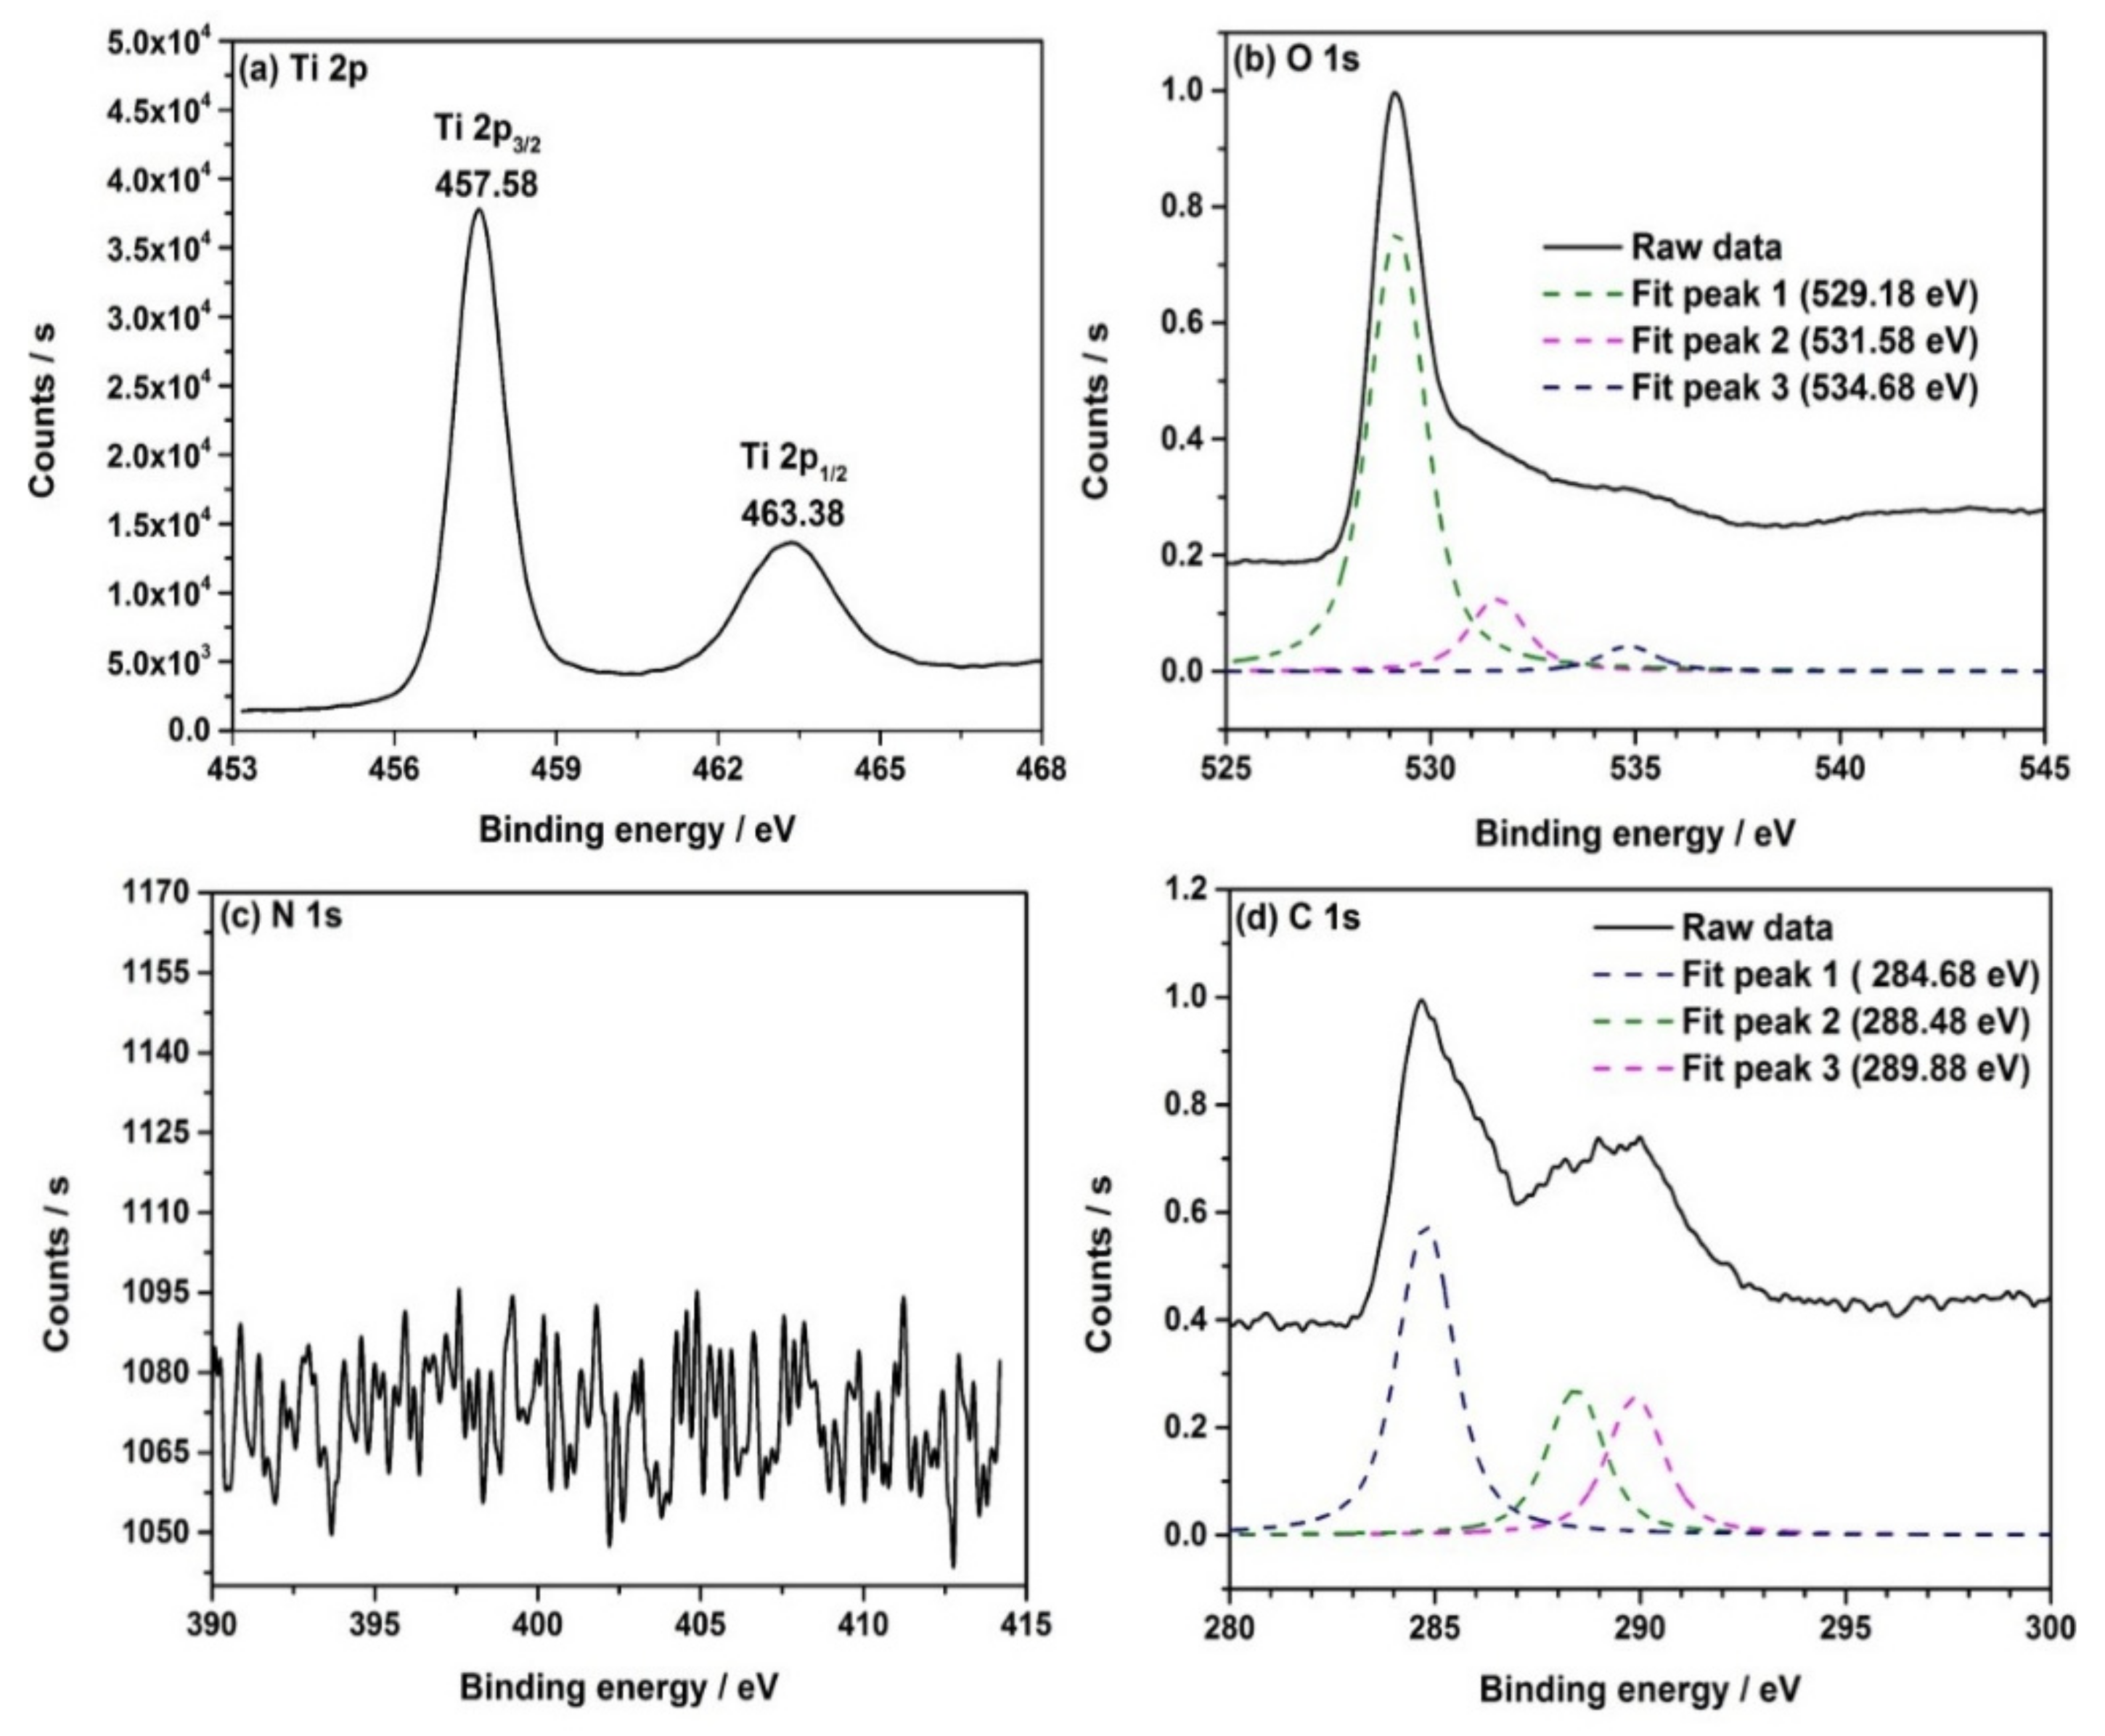
The surface analysis and oxidation states of the elements in pure TiO2 sample and NT-3 samples are analyzed using XPS. The high resolution XPS spectra with peak fitting for pure TiO2 and NT-3 sample are shown in Figure 8 and Figure 9, respectively. The high resolution XPS of Ti 2p for both samples (Figure 8a and Figure 9a) exhibits the corresponding peaks of Ti 2p3/2 and Ti 2p1/2 binding energies, indicating the presence of Ti4+ ions in both, pure TiO2 and NT-3 the samples [14,15]. Figure 8b displays the high resolution O 1s XPS spectrum with three fitted peaks for pure TiO2 sample, the peaks appearing around 529.18 eV, 531.58 eV and 534.68 eV are attributed to lattice Ti-O bonds [54], and non-lattice O-H and C-O bonds, respectively. The O 1s XPS spectrum for the NT-3 sample (Figure 9b) exhibits similar peaks with a slight shift towards higher binding energy that can be attributed to the effect of N doping. Figure 8c shows N 1s XPS spectrum for pure TiO2 which exhibits only noise rather than any peak and state of N, whereas, for the NT-3 sample, the N 1s XPS spectrum (Figure 9c) clearly displays peaks appearing around the binding energy of 398.48 eV and 407.48 eV. The former peak is associated to the Ti-N bonds formed after replacement of O atoms with N atoms within the TiO2 lattice [55], whereas the later peak indicates the presence of N atoms chemisorbed on the surface of the NT-3 sample [56]. Figure 8d shows the C 1s XPS spectrum for pure TiO2 samples with the peak fitting showing three peaks. The peak appearing at binding energy of 284.68 eV, is associated to the elemental carbon [57], whereas the peaks appearing at 288.48 eV and 289.88 eV are ascribed to C-O and C=O [58], indicating the presence of carbonaceous species within the samples. The C 1s XPS spectrum for NT-3 sample with peaks fitting is shown in Figure 9d. The peak appearing at 284.98 eV can be attributed to elemental carbon [57], whereas the peaks appearing at 287.78 eV and 289.58 eV can be associated to the C-O and C=O species [58], respectively. In both samples, pure TiO2 and the NT-3 sample, in addition to elemental carbon peaks, the peaks of carbonaceous species can be ascribed to the adsorption of carbon during the synthesis procedure and/or probable formation of Ti-O-C bonds.

3.8. Photocatalytic Activity Evaluation

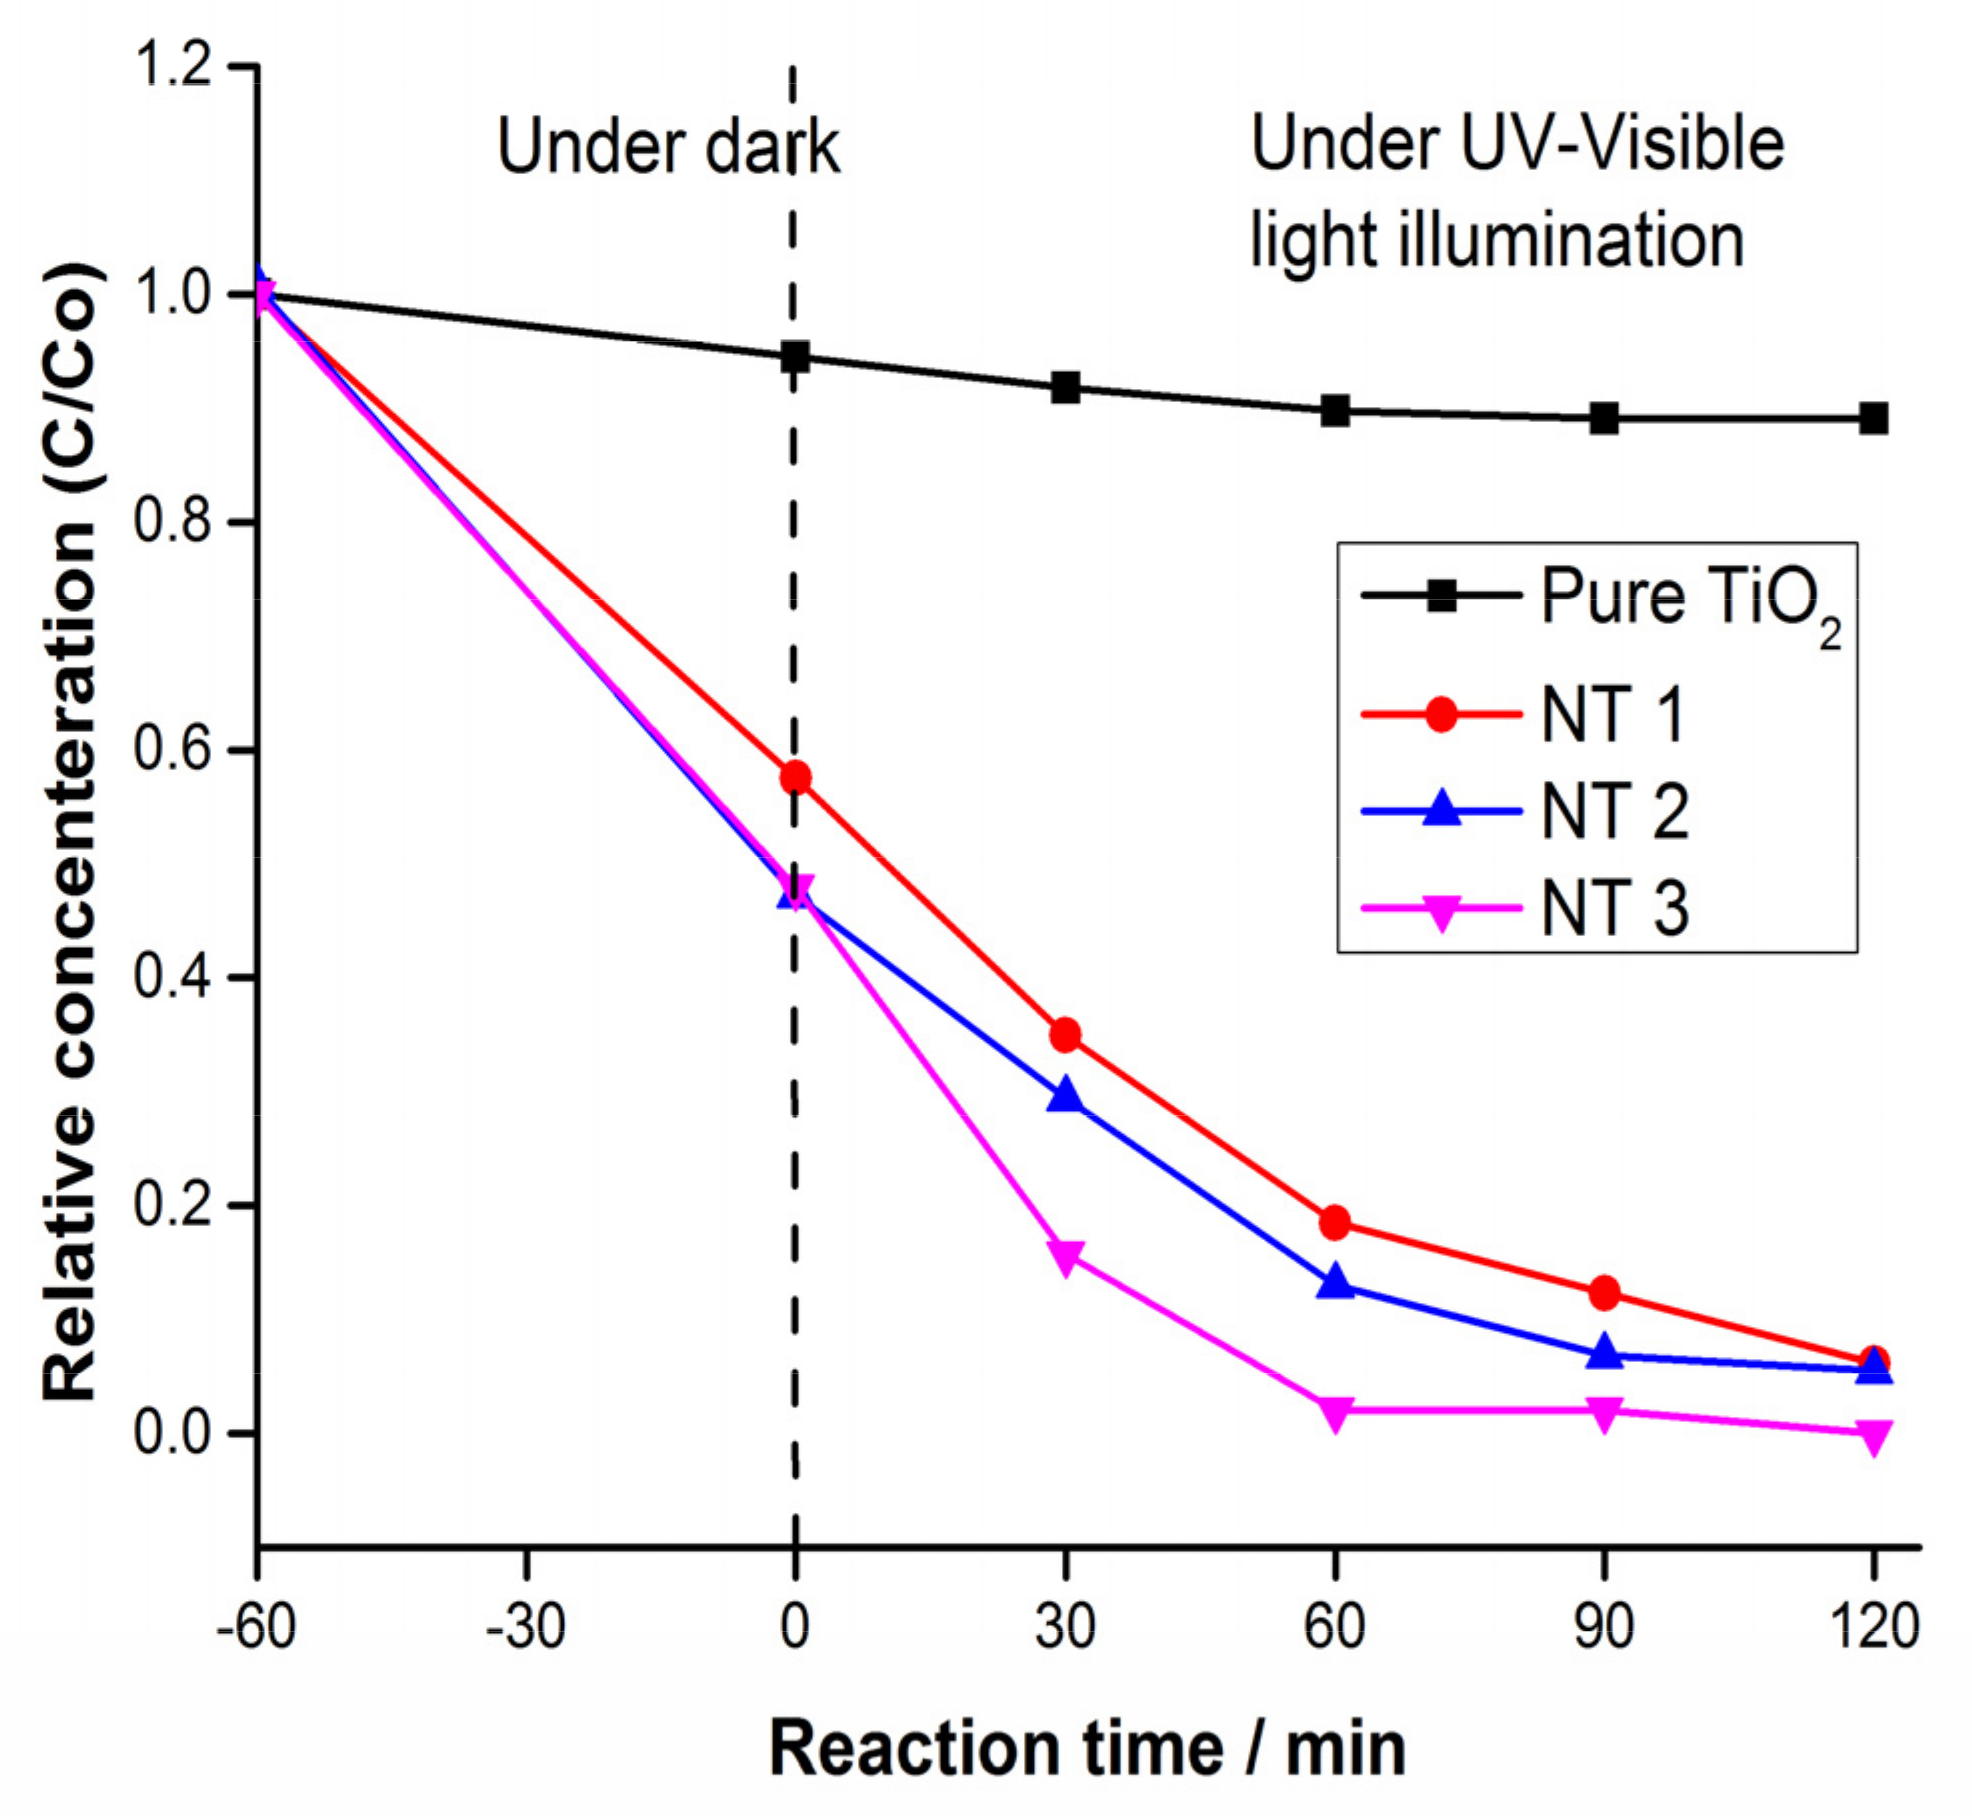
The photocatalytic activity of the prepared photocatalyst samples was evaluated via measuring the photodegradation efficiency of a simulated MB dye wastewater under light irradiation using a xenon lamp as a visible light source, over a period of 120 min (Figure 10). MB dye photodegradation was also tested by using pure TiO2 as a reference sample. It can be seen from Figure 10 that pure TiO2 sample under light irradiation shows negligible MB dye degradation (6.46%), while for NT samples the MB dye degradation performance follows the trend NT-3 > NT-2 > NT-1. Hence the N doping of pure TiO2 by urea addition as well as anatase phase enrichment enhances the photocatalytic performance and increases the photodegradation efficiency from 6.46% for pure TiO2 to greater than 99% for NT-3 samples. Such an enhanced performance can be attributed to the extension of light absorption towards the visible region induced by the energy states created by nitrogen doping. Such energy states created as a result of doping, narrow down the band gap of the photocatalysts, resulting in generation of increased photo-excited charges under light irradiation. In addition to nitrogen doping, enrichment of the anatase phase with increased urea amount also contributes to the photocatalytic performance. As a control test, photocatalytic dye degradation employing a standard TiO2 nanopowder (Degussa P25) was performed. The dye degradation absorption spectra and relative concentration profile are shown in Figure S2. It can be observed that P25 samples showed better performance (approximately 24% degradation after 120 min.) as compared to the pure TiO2 sample but less efficient than the N-doped TiO2 samples.
Furthermore, as is well-established, the photodegradation of MB dye is influenced by various parameters, such as nanoparticle size, crystallinity, phase composition, porous nature and surface area. It can be observed that amongst all samples, NT-3 sample exhibited the best performance with the lowest surface area, highest nitrogen doping and highest anatase phase. Such an increased performance might be attributed to these two effects i.e., more anatase phase in the NT samples and increased light absorption due to N doping of TiO2. It is well established that MB dye is considered a basic dye due to presence of cationic groups on its surface such as -NH3+. The affinity for adsorption for MB dye is enhanced towards anatase TiO2 phase, which is rich in surface OH groups [43,44]. Therefore, when the amount of urea used as a dopant is increased, the anatase phase is enriched along with N doping, which leads to enhanced and better MB dye adsorption (in dark) as compared to a pure TiO2 sample. Hence, an optimal combination of the anatase phase and N doping might lead to the formation of photocatalysts with best performance.
The proposed mechanism of MB dye photodegradation by the prepared samples is shown in Figure 11. Upon light irradiation, the photogenerated electrons jump to the conduction band whereas holes remain in the valence band. The photogenerated charges (electrons and holes) generate hydroxyl radicals by reacting with oxygen and water, respectively, which in turn acts as a strong oxidizing agent, degrading MB dye to other products such as CO2, SO42−, NH4+ and NO3. The possible reactions involved in the photodegradation of the MB dye simulated textile wastewater are presented in Equations (3)–(7).
NT +   h ν   light   irradiation NT ( e CB ) +   NT ( h + VB )  
NT   ( e CB ) +   O 2     O 2
NT   ( h + VB ) +   OH     OH  
MB   dye   +   🞍 OH     CO 2   +   H 2 O + Degradation   products  
MB   dye   +   🞍 O 2 CO 2 +   H 2 O + Degradation   products

4. Conclusions

Nitrogen-doped TiO2 (NT) photocatalysts were successfully synthesized by a simply designed two steps synthesis procedure, employing urea as a nitrogen dopant and anatase phase-enriching agent. The analysis, specifically XRD, Raman and FTIR confirm that urea addition during the synthesis process acts as a doping source as well as anatase phase enhancer for the NT samples. The improved photocatalytic performance of NT samples as compared to pure TiO2 sample is associated to the optimization of the photocatalytic active TiO2 anatase phase, nitrogen content and surface area. Hence, the strategy of adding certain cheap additives, oriented towards achieving simultaneous doping as well as active phase generation, can be a cost effective and efficient approach to photocatalysts with high activity for wastewater treatment.

Supplementary Materials

The following are available online at https://www.mdpi.com/article/10.3390/app11178264/s1, Figure S1. UV Vis absoprtion spectra for the dye degradation employing (a) Pure TiO2, (b) NT-1, (c) NT-2 and, (d) NT-3 sample; Figure S2. (a) UV Vis absoprtion spectra for the dye degradation employing standard TiO2 P25 and (b) relative dye degradation curve; Figure S3. Adsorption Isotherm linear plost for (a) Pure TiO2, (b) NT-1, (c) NT-2 and, (d) NT-3 samples.

Author Contributions

Conceptualization, M.A. and M.Z.; Investigation, A.R. and M.A.; Data curation, A.U.; Visualization, M.A.; Writing—original draft preparation, A.R. and M.A.; Writing—review and editing, M.Z. and W.-Y.K.; Supervision, M.H. and P.A.; Methodology; A.U., M.Z. and W.-Y.K.; Funding acquisition, A.R. and W.-Y.K. All authors have read and agreed to the published version of the manuscript.

Funding

This work was supported by Higher Education Commission, Pakistan, under the Start-Up Research Grant for Fresh PhD Holders, Project No. 21-1952/SRGP/R&D/HEC/2018, and the National Research Foundation of Korea (NRF) grant funded by the Korea Government (Ministry of Science and ICT) (NRF-2018R1A4A1025998).

Institutional Review Board Statement

Not applicable.

Informed Consent Statement

Not applicable.

Data Availability Statement

Not applicable.

Conflicts of Interest

The authors declare no conflict of interest.

References

  1. Mudakkar, S.R.; Zaman, K.; Khan, M.M.; Ahmad, M. Energy for economic growth, industrialization, environment and natural resources: Living with just enough. Renew. Sustain. Energy Rev. 2013, 25, 580–595. [Google Scholar] [CrossRef]
  2. Sihvonen, M.; Pihlainen, S.; Lai, T.Y.; Salo, T.; Hyytiäinen, K. Crop production, water pollution, or climate change mitigation—Which drives socially optimal fertilization management most? Agric. Syst. 2021, 186, 102985. [Google Scholar] [CrossRef]
  3. Shirvanimoghaddam, K.; Motamed, B.; Ramakrishna, S.; Naebe, M. Death by waste: Fashion and textile circular economy case. Sci. Total Environ. 2020, 718, 137317. [Google Scholar] [CrossRef] [PubMed]
  4. Xiao, L.; Liu, J.; Ge, J. Dynamic game in agriculture and industry cross-sectoral water pollution governance in developing countries. Agric. Water Manag. 2021, 243, 106417. [Google Scholar] [CrossRef]
  5. Le Marechal, A.M.; Krianec, B.; Vajnhandl, S.; Volmajer, J. Textile Finishing Industry as an Important Source of Organic Pollutants. In Organic Pollutants Ten Years after the Stockholm Convention-Environmental and Analytical Update; IntechOpen: Rijeka, Croatia, 2012. [Google Scholar] [CrossRef] [Green Version]
  6. Mohan, S.V.; Bhaskar, Y.V.; Karthikeyan, J. Biological decolourisation of simulated azo dye in aqueous phase by algae Spirogyra species. Int. J. Environ. Pollut. 2004, 21, 211–222. [Google Scholar] [CrossRef]
  7. Balapure, K.; Bhatt, N.; Madamwar, D. Mineralization of reactive azo dyes present in simulated textile waste water using down flow microaerophilic fixed film bioreactor. Bioresour. Technol. 2015, 175, 1–7. [Google Scholar] [CrossRef]
  8. Asghar, A.; Raman, A.A.A.; Daud, W.M.A.W. Advanced oxidation processes for in-situ production of hydrogen peroxide/hydroxyl radical for textile wastewater treatment: A review. J. Clean. Prod. 2015, 87, 826–838. [Google Scholar] [CrossRef] [Green Version]
  9. Šíma, J.; Hasal, P. Photocatalytic degradation of textile dyes in aTiO2/UV system. Chem. Eng. Trans. 2013, 32, 79–84. [Google Scholar] [CrossRef]
  10. Shehzad, N.; Zafar, M.; Ashfaq, M.; Razzaq, A.; Akhter, P.; Ahmad, N.; Hafeez, A.; Azam, K.; Hussain, M.; Kim, W.Y. Development of AgFeO2/rGO/TiO2 Ternary Composite Photocatalysts for Enhanced Photocatalytic Dye Decolorization. Crystals 2020, 10, 923. [Google Scholar] [CrossRef]
  11. Fazal, T.; Razzaq, A.; Javed, F.; Hafeez, A.; Rashid, N.; Amjad, U.S.; Ur Rehman, M.S.; Faisal, A.; Rehman, F. Integrating Adsorption and Photocatalysis: A Cost Effective Strategy for Textile Wastewater Treatment Using Hybrid Biochar-TiO2 Composite; Elsevier B.V.: Amsterdam, The Netherlands, 2020; Volume 390, ISBN 9242111001007. [Google Scholar]
  12. Azam, K.; Raza, R.; Shezad, N.; Shabir, M.; Yang, W.; Ahmad, N.; Shafiq, I.; Akhter, P.; Razzaq, A.; Hussain, M. Development of recoverable magnetic mesoporous carbon adsorbent for removal of methyl blue and methyl orange from wastewater. J. Environ. Chem. Eng. 2020, 8, 104220. [Google Scholar] [CrossRef]
  13. Razzaq, A.; In, S.-I. TiO2 Based Nanostructures for Photocatalytic CO2 Conversion to Valuable Chemicals. Micromachines 2019, 10, 326. [Google Scholar] [CrossRef] [Green Version]
  14. Parayil, S.; Razzaq, A.; Park, S.M.; Kim, H.R.; Grimes, C.A.; In, S. Il Photocatalytic conversion of CO2 to hydrocarbon fuel using carbon and nitrogen co-doped sodium titanate nanotubes. Appl. Catal. A Gen. 2015, 498, 205–213. [Google Scholar] [CrossRef]
  15. Razzaq, A.; Sinhamahapatra, A.; Kang, T.; Grimes, C.A.; Yu, J.; In, S. Applied Catalysis B: Environmental Efficient solar light photoreduction of CO2 to hydrocarbon fuels via magnesiothermally reduced TiO2 photocatalyst. Appl. Catal. B Environ. 2017, 215, 28–35. [Google Scholar] [CrossRef]
  16. Razzaq, A.; Grimes, C.A.; In, S.-I. Facile fabrication of a noble metal-free photocatalyst: TiO2 nanotube arrays covered with reduced graphene oxide. Carbon N. Y. 2016, 98, 537–544. [Google Scholar] [CrossRef]
  17. Pelaez, M.; Nolan, T.N.; Pillai, C.S.; Seery, K.M.; Falaras, P.; Kontos, A.G.; Dunlop, S.M.P.; Hamilton, W.J.J.; Byrne, A.J.; O’Shea, K.; et al. A review on the visible light active titanium dioixde photocatalysts for environmental applications. Appl. Catal. B Environ. 2012, 125, 331–349. [Google Scholar] [CrossRef] [Green Version]
  18. Kim, M.; Razzaq, A.; Kim, Y.K.; Kim, S.; In, S.-I. Synthesis and characterization of p latinum modified TiO2-embedded carbon nanofibers for solar hydrogen generation. RSC Adv. 2014, 4, 51286–51293. [Google Scholar] [CrossRef]
  19. Chen, Y.; Wang, Y.; Li, W.; Yang, Q.; Hou, Q.; Wei, L.; Liu, L.; Huang, F.; Ju, M. Enhancement of photocatalytic performance with the use of noble-metal-decorated TiO2 nanocrystals as highly active catalysts for aerobic oxidation under visible-light irradiation. Appl. Catal. B Environ. 2017, 210, 352–367. [Google Scholar] [CrossRef]
  20. Park, S.-M.; Razzaq, A.; Park, Y.H.; Sorcar, S.; Park, Y.; Grimes, C.A.; In, S.-I. Hybrid CuxO-TiO2 Heterostructured Composites for Photocatalytic CO2 Reduction into Methane Using Solar Irradiation: Sunlight into Fuel. ACS Omega 2016, 1, 868–875. [Google Scholar] [CrossRef] [PubMed] [Green Version]
  21. Kim, H.R.; Razzaq, A.; Grimes, C.A.; In, S.-I. Heterojunction p-n-p Cu2O/S-TiO2/CuO: Synthesis and application to photocatalytic conversion of CO2 to methane. J. CO2 Util. 2017, 20, 91–96. [Google Scholar] [CrossRef]
  22. Kim, K.; Razzaq, A.; Sorcar, S.; Park, Y.; Grimes, C.A.; In, S.-I. Hybrid mesoporous Cu2ZnSnS4 (CZTS)-TiO2 photocatalyst for efficient photocatalytic conversion of CO2 into CH4 under solar irradiation. RSC Adv. 2016, 6, 38964–38971. [Google Scholar] [CrossRef]
  23. Ali, S.; Razzaq, A.; In, S.-I. Development of graphene based photocatalysts for CO2 reduction to C1 chemicals: A brief overview. Catal. Today 2019, 335, 39–54. [Google Scholar] [CrossRef]
  24. Zubair, M.; Razzaq, A.; Grimes, C.A.; In, S.-I. Cu2ZnSnS4 (CZTS)-ZnO: A noble metal-free hybrid Z-scheme photocatalyst for enhanced solar-spectrum photocatalytic conversion of CO2 to CH4. J. CO2 Util. 2017, 20, 301–311. [Google Scholar] [CrossRef]
  25. Zubair, M.; Kim, H.R.; Razzaq, A.; Grimes, C.A.; In, S.-I. Solar spectrum photocatalytic conversion of CO2 to CH4 utilizing TiO2 nanotube arrays embedded graphene quantum dots. J. CO2 Util. 2018, 26, 70–79. [Google Scholar] [CrossRef]
  26. Wongso, V.; Chen, C.J.; Razzaq, A.; Kamal, N.A.; Sambudi, N.S. Hybrid kaolin/TiO2 composite: Effect of urea addition towards an efficient photocatalyst for dye abatement under visible light irradiation. Appl. Clay Sci. 2019, 180, 105158. [Google Scholar] [CrossRef]
  27. Ismael, M. A review and recent advances in solar-to-hydrogen energy conversion based on photocatalytic water splitting over doped-TiO2 nanoparticles. Sol. Energy 2020, 211, 522–546. [Google Scholar] [CrossRef]
  28. Varma, K.S.; Tayade, R.J.; Shah, K.J.; Joshi, P.A.; Shukla, A.D.; Gandhi, V.G. Photocatalytic degradation of pharmaceutical and pesticide compounds (PPCs) using doped TiO2 nanomaterials: A review. Water-Energy Nexus 2020, 3, 46–61. [Google Scholar] [CrossRef]
  29. Vaiano, V.; Sacco, O.; Sannino, D.; Ciambelli, P. Nanostructured N-doped TiO2 coated on glass spheres for the photocatalytic removal of organic dyes under UV or visible light irradiation. Appl. Catal. B Environ. 2015, 170–171, 153–161. [Google Scholar] [CrossRef]
  30. Powell, M.J.; Dunnill, C.W.; Parkin, I.P. N-doped TiO2 visible light photocatalyst films via a sol-gel route using TMEDA as the nitrogen source. J. Photochem. Photobiol. A Chem. 2014, 281, 27–34. [Google Scholar] [CrossRef]
  31. Saravanan, R.; Aviles, J.; Gracia, F.; Mosquera, E.; Gupta, V.K. Crystallinity and lowering band gap induced visible light photocatalytic activity of TiO2/CS (Chitosan) nanocomposites. Int. J. Biol. Macromol. 2018, 109, 1239–1245. [Google Scholar] [CrossRef]
  32. Liu, T.; Chen, W.; Liu, X.; Zhu, J.; Lu, L. Well-dispersed ultrafine nitrogen-doped TiO2 with polyvinylpyrrolidone (PVP) acted as N-source and stabilizer for water splitting. J. Energy Chem. 2016, 25, 1–9. [Google Scholar] [CrossRef]
  33. Liu, W.X.; Jiang, P.; Shao, W.N.; Zhang, J.; Cao, W. Bin A novel approach for the synthesis of visible-light-active nanocrystalline N-doped TiO2 photocatalytic hydrosol. Solid State Sci. 2014, 33, 45–48. [Google Scholar] [CrossRef]
  34. Gohari-Bajestani, Z.; Akhlaghi, O.; Yürüm, Y.; Yürüm, A. Synthesis of anatase TiO2 with exposed (001) facets grown on N-doped reduced graphene oxide for enhanced hydrogen storage. Int. J. Hydrogen Energy 2017, 42, 6096–6103. [Google Scholar] [CrossRef]
  35. Ferrari-Lima, A.M.; Marques, R.G.; Gimenes, M.L.; Fernandes-Machado, N.R.C. Synthesis, characterisation and photocatalytic activity of N-doped TiO2-Nb2O5 mixed oxides. Catal. Today 2015, 254, 119–128. [Google Scholar] [CrossRef]
  36. Fan, J.; Zhao, Z.; Liu, W.; Xue, Y.; Yin, S. Solvothermal synthesis of different phase N-TiO2 and their kinetics, isotherm and thermodynamic studies on the adsorption of methyl orange. J. Colloid Interface Sci. 2016, 470, 229–236. [Google Scholar] [CrossRef]
  37. Bakar, S.A.; Ribeiro, C. Nitrogen-doped titanium dioxide: An overview of material design and dimensionality effect over modern applications. J. Photochem. Photobiol. C Photochem. Rev. 2016, 27, 1–29. [Google Scholar] [CrossRef]
  38. Katoueizadeh, E.; Zebarjad, S.M.; Janghorban, K. Synthesis and enhanced visible-light activity of N-doped TiO2 nano-additives applied over cotton textiles. J. Mater. Res. Technol. 2018, 7, 204–211. [Google Scholar] [CrossRef]
  39. Sanchez-Martinez, A.; Ceballos-Sanchez, O.; Koop-Santa, C.; López-Mena, E.R.; Orozco-Guareño, E.; García-Guaderrama, M. N-doped TiO2 nanoparticles obtained by a facile coprecipitation method at low temperature. Ceram. Int. 2018, 44, 5273–5283. [Google Scholar] [CrossRef]
  40. Albrbar, A.J.; Djokić, V.; Bjelajac, A.; Kovač, J.; Ćirković, J.; Mitrić, M.; Janaćković, D.; Petrović, R. Visible-light active mesoporous, nanocrystalline N,S-doped and co-doped titania photocatalysts synthesized by non-hydrolytic sol-gel route. Ceram. Int. 2016, 42, 16718–16728. [Google Scholar] [CrossRef]
  41. Bae, Y.S.; Yazayd’n, A.Ö.; Snurr, R.Q. Evaluation of the BET method for determining surface areas of MOFs and zeolites that contain Ultra-Micropores. Langmuir 2010, 26, 5475–5483. [Google Scholar] [CrossRef] [PubMed]
  42. Sorcar, S.; Razzaq, A.; Tian, H.; Grimes, C.A.; In, S.-I. Facile electrochemical synthesis of anatase nano-architectured titanium dioxide films with reversible superhydrophilic behavior. J. Ind. Eng. Chem. 2017, 46. [Google Scholar] [CrossRef]
  43. Li, Y.; Wang, W.; Wang, F.; Di, L.; Yang, S.; Zhu, S.; Yao, Y.; Ma, C.; Dai, B.; Yu, F. Enhanced photocatalytic degradation of organic dyes via defect-rich tio2 prepared by dielectric barrier discharge plasma. Nanomaterials 2019, 9, 720. [Google Scholar] [CrossRef] [Green Version]
  44. Wang, Y.; Li, L.; Huang, X.; Li, Q.; Li, G. New insights into fluorinated TiO2 (brookite, anatase and rutile) nanoparticles as efficient photocatalytic redox catalysts. RSC Adv. 2015, 5, 34302–34313. [Google Scholar] [CrossRef]
  45. Mutuma, B.K.; Shao, G.N.; Kim, W.D.; Kim, H.T. Sol-gel synthesis of mesoporous anatase-brookite and anatase-brookite-rutile TiO2 nanoparticles and their photocatalytic properties. J. Colloid Interface Sci. 2015, 442, 1–7. [Google Scholar] [CrossRef]
  46. Parayil, S.K.; Razzaq, A.; In, S.-I. Formation of titania-silica mixed oxides in solvent mixtures and their influences for the photocatalytic CO2 conversion to hydrocarbon. J. Nanosci. Nanotechnol. 2015, 15, 7285–7292. [Google Scholar] [CrossRef]
  47. Tran, V.A.; Truong, T.T.; Phan, T.A.P.; Nguyen, T.N.; Van Huynh, T.; Agresti, A.; Pescetelli, S.; Le, T.K.; Di Carlo, A.; Lund, T.; et al. Application of nitrogen-doped TiO2 nano-tubes in dye-sensitized solar cells. Appl. Surf. Sci. 2017, 399, 515–522. [Google Scholar] [CrossRef]
  48. Cheng, X.; Yu, X.; Xing, Z. Characterization and mechanism analysis of N doped TiO2 with visible light response and its enhanced visible activity. Appl. Surf. Sci. 2012, 258, 3244–3248. [Google Scholar] [CrossRef]
  49. In, S.-I.; Vesborg, C.K.P.; Abrams, B.L.; Hou, Y.; Chorkendof, I. A comparative study of two techniques for determining photocatalytic activity of nitrogen doped TiO2 nanotubes under visible light irradiation: Photocatalytic reduction of dye and photocatalytic oxidation of organic molecules. J. Photchem. Photobiol. A Chem. 2011, 222, 258–262. [Google Scholar] [CrossRef]
  50. Larumbe, S.; Monge, M.; Gómez-Polo, C. Comparative study of (N, Fe) doped TiO2 photocatalysts. Appl. Surf. Sci. 2015, 327, 490–497. [Google Scholar] [CrossRef]
  51. Raciti, R.; Bahariqushchi, R.; Summonte, C.; Aydinli, A.; Terrasi, A.; Mirabella, S. Optical bandgap of semiconductor nanostructures: Methods for experimental data analysis. J. Appl. Phys. 2017, 121. [Google Scholar] [CrossRef]
  52. Jagadale, T.C.; Takale, S.P.; Sonawane, R.S.; Joshi, H.M.; Patil, S.I.; Kale, B.B.; Ogale, S.B. N-doped TiO2 nanoparticle based visible light photocatalyst by modified peroxide sol-gel method. J. Phys. Chem. C 2008, 112, 14595–14602. [Google Scholar] [CrossRef]
  53. Liu, G.; Wang, X.; Chen, Z.; Cheng, H.M.; Lu, G.Q. (Max) The role of crystal phase in determining photocatalytic activity of nitrogen doped TiO2. J. Colloid Interface Sci. 2009, 329, 331–338. [Google Scholar] [CrossRef] [PubMed]
  54. Xu, H.; Zhang, L. Selective nonaqueous synthesis of C-Cl-codoped TiO2 with visible-light photocatalytic activity. J. Phys. Chem. C 2010, 114, 11534–11541. [Google Scholar] [CrossRef]
  55. Asahi, R.; Morikawa, T.; Ohwaki, T.; Aoki, K.; Taga, Y. Visible-light photocatalysis in nitrogen-doped titanium oxides. Science 2001, 293, 269–271. [Google Scholar] [CrossRef]
  56. Soares, G.B.; Bravin, B.; Vaz, C.M.P.; Ribeiro, C. Facile synthesis of N-doped TiO2 nanoparticles by a modified polymeric precursor method and its photocatalytic properties. Appl. Catal. B Environ. 2011, 106, 287–294. [Google Scholar] [CrossRef]
  57. Zhang, L.; Han, M.; Tan, O.K.; Tse, M.S.; Wang, Y.X.; Sze, C.C. Facile fabrication of Ag/C-TiO2 nanoparticles with enhanced visible light photocatalytic activity for disinfection of Escherichia coli and Enterococcus faecalis. J. Mater. Chem. B 2013, 1, 564–570. [Google Scholar] [CrossRef]
  58. Fan, W.; Zhang, Q.; Wang, Y. Semiconductor-based nanocomposites for photocatalytic H2 production and CO2 conversion. Phys. Chem. Chem. Phys. 2013, 15, 2632–2649. [Google Scholar] [CrossRef] [PubMed]
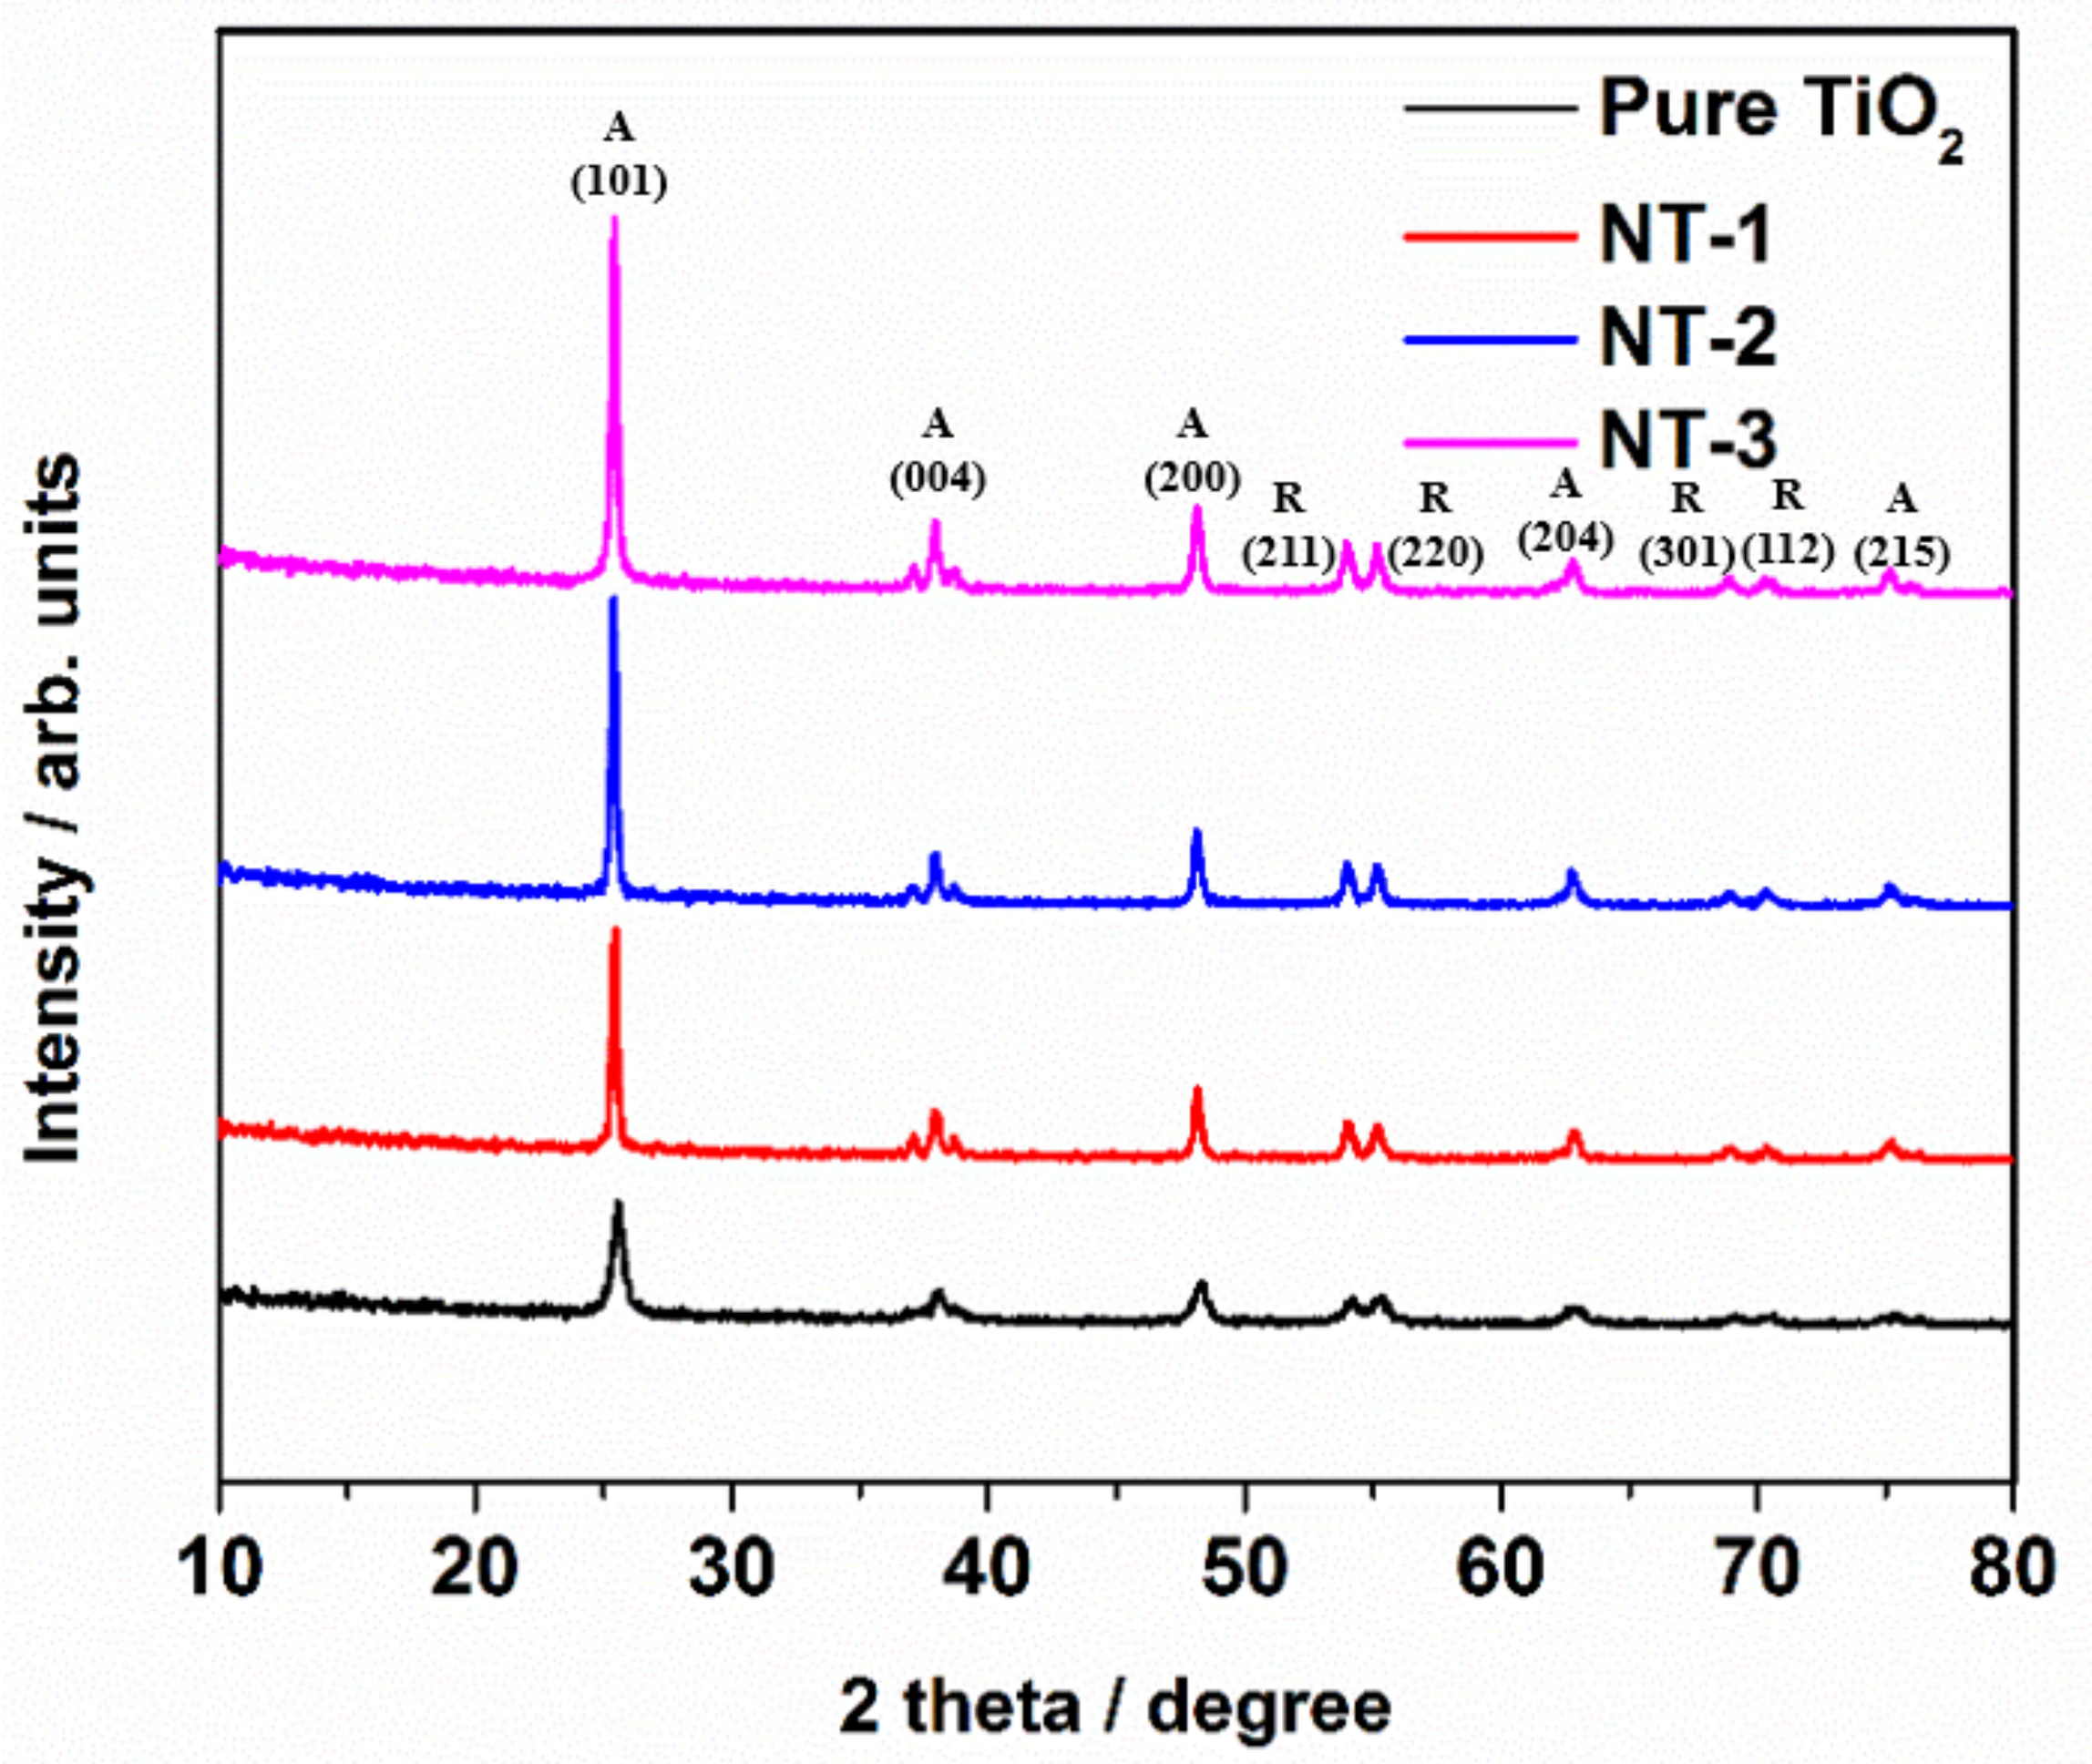
Figure 1. XRD patterns of pure TiO2, NT-1, NT-2 and NT-3, synthesized by using 0.0 g, 0.983 g, 1.965 g and 2.940 g of urea respectively (A: anatase phase, and R: rutile phase).
Applsci 11 08264 g001
Figure 2. Raman spectra of pure TiO2, NT-1, NT-2 and NT-3, synthesized by using 0.0 g, 0.983 g, 1.965 g and 2.940 g of urea respectively.
Applsci 11 08264 g002
Figure 3. SEM images of (a) Pure TiO2, (b) NT-1, (c) NT-2 and, (d) NT-3.
Applsci 11 08264 g003
Figure 4. FTIR spectra of pure TiO2, NT-1, NT-2 and NT-3, synthesized by using 0.0 g, 0.983 g, 1.965 g and 2.940 g of urea respectively. (a) The complete spectrum; The enlarged view of regions between 750–2000 cm−1 (b), and 2000–4000 cm−1 (c).
Applsci 11 08264 g004
Figure 5. TGA curves for pure TiO2, NT-1, NT-2 and NT-3, synthesized by using 0.0, 0.983, 1.965 and 2.940 g of urea, respectively.
Applsci 11 08264 g005
Figure 6. (a) UV Vis DRS spectra, and (b) Band gap estimation of, Pure TiO2, NT-1, NT-2 and NT-3.
Applsci 11 08264 g006
Figure 7. PL spectra of (a) Pure TiO2, (b) NT-1, (c) NT-2 and (d) NT-3.
Applsci 11 08264 g007
Figure 8. High resolution XPS spectra with peak fittings for pure TiO2 sample showing: (a) Ti 2p, (b) O 1s, (c) N 1s, and (d) C 1s, regions.
Applsci 11 08264 g008
Figure 9. High resolution XPS spectra with peak fittings for pure NT-3 sample showing: (a) Ti 2p, (b) O 1s, (c) N 1s, and (d) C 1s, regions.
Applsci 11 08264 g009
Figure 10. Photocatalytic degradation of MB dye simulated wastewater by pure TiO2, NT-1, NT-2 and NT-3 samples.
Applsci 11 08264 g010
Figure 11. Mechanistic overview for photocatalytic degradation of MB dye simulated wastewater by NT samples.
Applsci 11 08264 g011
Table 1. Textural properties of pure TiO2, NT-1, NT-2 and NT-3, synthesized by using 0.0, 0.983, 1.965 and 2.940 of urea, respectively.
PhotocatalystBET Surface Area
[m2/g]
Pore Size
[nm]
Pure TiO242.980.6427
NT-138.870.5947
NT-230.180.5788
NT-323.930.5776
Publisher’s Note: MDPI stays neutral with regard to jurisdictional claims in published maps and institutional affiliations.