Article

Ionic Conductivity and Dielectric Relaxation of NASICON Superionic Conductors at the Near-Cryogenic Regime †

by
Athanasios Tiliakos
1,2,*,
Mihaela Iordache
1 and
Adriana Marinoiu
1,*
1
National R&D Institute for Cryogenic and Isotopic Technologies (ICSI), 240050 Râmnicu Vâlcea, Romania
2
National R&D Institute for Laser, Plasma and Radiation Physics (INFLPR), 077125 Măgurele, Romania
*
Authors to whom correspondence should be addressed.
In Memoriam: Athanasios Tiliakos has dedicated this work to the memory of his beloved uncle, Nikolaos Xanthopoulos, whose untimely passing marked the completion of this project.
Appl. Sci. 2021, 11(18), 8432; https://doi.org/10.3390/app11188432
Submission received: 21 July 2021 / Revised: 4 September 2021 / Accepted: 9 September 2021 / Published: 11 September 2021
(This article belongs to the Special Issue Advances in Porous Materials for Energy Storage)

Abstract

:

Featured Application

NASICON membranes (i.e., sodium-based superionic conductors) serve as solid electrolytes in sodium-ion batteries and, more recently, in seawater flow batteries.

Abstract

With a crystal lattice structure first characterized in the 1970s, NASICON sodium-based superionic conductors have recently found renewed interest as solid electrolytes in sodium-ion and seawater flow batteries due to their exceptional ionic conductivity being on the same scale as liquid electrolytes. Since sodium ions in the crystal lattice move among interstitial positions through site-specific bottlenecks, the overall conductivity is strongly dependent on the NASICON composition. In this work, we report on the synthesis protocols and processing parameters of Na3Zr2Si2PO12 prepared from Na2CO3, SiO2, ZrO2, and NH4H2PO4 precursors by the conventional solid-state reaction (SSR) route. We critically evaluated important observations made in the extended literature on the topic including: (i) the importance of precursor particle size concerning the SSR synthesis, focusing on effective ball-milling protocols; and (ii) the onset of excess zirconia contamination, expanding on the effects of both thermal and pressure processing—the latter often overlooked in the available literature. In approaching the cryogenic regime, the dataset availability concerning ionic conductivity and dielectric permittivity measurements for NASICON was extended, starting from elevated temperatures at 200 °C and reaching into the very low temperature zone at −100 °C.

1. Introduction

In the mid-20th century, research efforts on ionic conductors had reached an apparent stalemate, when promising materials under investigation (such as Ca2+ or Y3+-substituted zirconia and α-AgI) were plagued by diminished conductivity for specific ions (O2− for the substituted zirconia) or instability in air as in the case of silver halides [1]. A novel pathway was opened in the late 1960s by the introduction of a solid ionic conductor, β-alumina (Na2O∙11Al2O3, with the general formula Na1+xAl11O17+x/2), having a layered structure that permitted the migration of Na+ ions between conductive 2D planes [2]. The success—but also the profound limitations—of β-alumina led to the design of 3D framework structures with an appropriate tunnel size for the migration of Na+. The new compounds were named NASICON (Na super ionic conductors), complying to the general formula Na1+xZr2SixP3−xO12, with 0 ≤ x ≤ 3 [3,4,5,6,7,8,9,10,11,12,13,14]. In a broader sense, the term can be extended to include similar compounds, with Na, Zr, or Si being replaced by other isovalent elements. NASICON materials constitute a class of structurally isomorphous 3D framework compounds of high ionic conductivity, which is comparable to that of liquid electrolytes at elevated temperatures; other key properties include ion storage capacity within their crystal lattice and low thermal expansion [3,4,5,6,7,8,9,10,11,12,13,14,15]. Such properties led to the early employment of NASICON ceramics in a variety of applications, which ranged from ion-exchange membranes to waste management and sensors [16,17,18,19].
Apart from the above implementations, NASICON has recently seen a renewed interest in energy storage applications: a response to the growing concerns at the international level regarding escalating climate change driven by greenhouse gas emissions. The latter has dictated the imperative shift to clean and renewable energy sources (RES) as a replacement for fossil fuels. Since most RES suffer from intermittency issues (e.g., wind, solar, and tidal energy), cost-effective utility-scale energy storage installations are needed to balance the energy supply–demand budget, thus underlining the importance of flexible and reliable grid systems [20,21,22]. Current grid-scale battery systems rely on the fully developed lithium-ion technology; however, with lithium being limited as a natural resource and therefore having high cost, other ion-exchange systems are sought as viable replacements. A most promising candidate has been identified in the form of sodium due to its high availability and low cost, giving rise to Na-ion batteries and thus upgrading the importance of NASICON as a sodium-based ion-exchange electrolyte in such systems [23,24,25,26,27,28,29,30,31]. Even more recent R&D advancements have seen the use of NASICON as a solid electrolyte in seawater flow batteries. Still in its infancy, the concept has the potential of becoming a true game-changer in the field of energy storage and conversion, especially since the flow electrolyte component (i.e., seawater) may be supplied in unprecedentedly large volumes, which translates into unfettered scalability [32,33,34,35,36].
In light of such developments, we marshaled a thorough investigation of the archetypal Na3Zr2Si2PO12 (where x = 2 in the Na1+xZr2SixP3−xO12 formula) that represents the limit case below which ionic conductivity decreases [3,4,37,38,39]. The primary challenge arises in navigating through the multiple methods developed for NASICON synthesis, which vary from the conventional solid-state reaction (SSR) to sol-gel Pechini methods, and to laser and plasma deposition [40,41,42,43,44,45]. The above also diverge to include variations for optimizing electrical properties, by either controlling the elemental composition (e.g., sodium content) or by optimizing the grain boundaries in the crystalline lattice [46,47,48,49,50,51,52,53,54,55,56]. Since our priority lies in gaining insights into the primary mechanisms underlying Na+ mobility and ionic conductivity, we chose to focus on the conventional SSR method and its associated protocols for synthesizing the classic Na3Zr2Si2PO12 system, while keeping the SSR protocol as straightforward as possible without elemental substitutions or additions. Thus, the work presented here can serve as a benchmark for further studies.
In parallel, we also addressed secondary processing parameters of the synthesis protocol that are often overlooked in the available literature, but nevertheless have dramatic effects on the investigated properties such as the applied pressure levels needed to compact the synthesized powders into pellet form—a key process for both laboratory and industrial scale preparation of NASICON solid electrolytes. We reassess the analytical techniques encountered in the bulk of the relevant literature concerning ionic conductivity determination and reporting by revisiting the arguments introduced in earlier fundamental research pertaining to the classic NASICON system [8,37], and then expanding the investigated parameter space of frequency and temperature to make use of the capabilities offered by broadband dielectric spectroscopy. Thus, we complied with a more holistic approach imported from dynamical systems theory, as we visualized the evolution of all associated properties (real and imaginary conductivity and dielectric permittivity) as 2D and 3D parametric phase space mappings over extended frequency and temperature scales. The latter reaching down to the near-cryogenic regime occurred as a necessity to better comprehend the corresponding dynamics. Nevertheless, this expanded thermal range of investigation, ranging from 200 °C to −100 °C, may reinvigorate the discussion around ionic conductivity of NASICON materials.

2. Materials and Methods

2.1. Solid-State Reaction (SSR) Synthesis Protocol and Post-Synthesis Processing

Na3Zr2Si2PO12 was synthesized according to the conventional SSR protocol, obtained by a thorough comparison of procedures found in the literature [40,41,42,43,44,45,46,47,48,49,50,51,52,53,54,55]. Precursors were selected according to availability without special considerations for particle size [54,55], in order to comply with the typical selection of starting materials employed conventionally. Thus, the SSR precursors were: Na2CO3 (98%, 0.5 mm granulates, Alfa Aesar|Thermo Fisher Scientific, Waltham, MA, USA), SiO2 (0.2 to 0.7 mm granulates, Umicore, Belgium), ZrO2 (99%, 5 μm average particle size, MilliporeSigma (Burlington, MA, USA)|Sigma-Aldrich (St. Louis, MO, USA)|Merck (Kenilworth, NJ, USA)), and NH4H2PO4 (0.5 mm granulates, Scharlab, Barcelona, Spain), in the molar ratio of 1.5:2:2:1 (corresponding to the stoichiometric ratio of 3:2:2:1 in terms of Na:Si:Zr:P). No fillers or additives for sodium content enhancement or grain size refinement were added [46,47,48,49,50,51,52,53,54,55], instead relying on ball-milling and post-synthesis processing to produce materials of appropriate quality.
The precursors were loaded in zirconia holders and mixed with ethanol (96%, laboratory reagent grade, MilliporeSigma|Sigma-Aldrich|Merck, USA) to prepare a slurry for wet-grinding in planetary ball-mills (wet-grinding increases the specific surface area of hard agglomerated powders). Ball-milling was performed in three consecutive steps of 3 h each at 300 rpm, using zirconia balls of the recommended loading and diameters of 10, 5, and 3 mm in succession. The collected powders were dried at 80 °C, preheated at 600 °C for 4 h to remove any volatile species, and then calcinated at 1100 °C for 4 h under dry nitrogen in a tubular furnace. This was followed by a final dry-grinding step at 500 rpm for 2 h using 3 mm zirconia balls, and a drying step at 80 °C as before.
The collected fine powders were pressed into pellet form by cold isostatic pressing (RT) for 5 min using a conventional hydraulic press to form uniaxial pellets of ~16 mm diameter and ~1.4 mm thickness (final dimensions varied based on applied pressure levels and material loading in the stainless-steel tubular holder, with a maximum recorded size reduction of 20% for some samples discarded after quality screening). Varying pressure levels were applied to gauge the response of the material, with the initial considerations being mechanical stability and density. In order to eliminate triviality and redundancy from the dataset, results are presented for the selected pressure levels at 245 MPa (~2500 kg cm−2), 345 MPa (~3500 kg cm−2), and 540 MPa (~5500 kg cm−2). The manufactured pellets were returned to the tubular furnace for sintering at 1250 °C for 10 h, at the heating rate of 5 °C min−1 over dry nitrogen flux. A commercially procured NASICON membrane (4TOONE Ltd., Ulsan, Republic of Korea), of the same composition and with dimensions of 12 mm diameter and 0.9 mm thickness, was used as the reference for all subsequent analysis.

2.2. Instrumentation and Characterization Methods

Ball-milling was performed on planetary ball-mills (PM 200, <10 mm feed size, <1 μm (normal grinding based on feed material),and <0.1 μm (colloidal) grind size, Retsch, Haan, Germany), using zirconia holders of corresponding volumetric capacities and zirconia balls of 10-, 5-, and 3-mm diameters; ball charging was selected for maximum energy output based on sample mass and applied technique (wet- vs. dry-grinding).
Particle size distributions for NASICON powders, before and after processing, were measured using a Nano DS Dual Light Scattering Particle Size Analyzer (CILAS, Orléans, France), operated in static light scattering (SLS) mode to comply with the estimated micronic particle size of the NASICON phases, and in dynamic (DLS) mode for the detection of submicronic particles.
Surface area and microporosity analyses were performed on an Autosorb iQ analyzer (Quantachrome, Boynton Beach, FL, USA). Samples were degassed prior to analysis at 115 °C for 4 to 6 h; nitrogen adsorption–desorption isotherms were obtained at the temperature of 77 K. Specific surface areas were calculated according to the Brunauer–Emmett–Teller (BET) equation using the linearity criterion over the range of 0.1 to 0.3 (P/P0); the Barrett–Joyner–Halenda (BJH) equation was used to characterize pore size distributions based on the desorption isotherms.
Thermogravimetric analysis (TGA) and differential scanning calorimetry (DSC) were conducted on a STA 449 F3 Jupiter thermal analyzer (NETZSCH, Germany) equipped with a water-cooled graphite furnace. Scans were performed over the temperature range of 20 °C to 800 °C in an inert argon atmosphere using an open 85-µL (137.72 mg) alumina crucible, at the scanning step of 5 K min−1 to emulate the heating rate during the thermal processing of NASICON. Prior to DSC measurements, the equipment was calibrated at the same conditions by loading only the empty alumina crucible. Sample masses were 43.13 mg of untreated NASICON powder and 42.40 mg of the calcinated material, the latter produced by pulverizing an in-lab manufactured pellet.
Optical microscopies were collected using a portable electronic microscope at ×100 magnification; pellets were manually broken along their diameters so that cross-sectional profiles could be imaged; micrography images were processed using the ImageJ software package (FIJI version) for scaling, without applying any form of image manipulation. Crystal lattice models were portrayed using the Jmol software for molecular modeling.
X-ray diffraction (XRD) measurements were conducted on a MiniFlex600 X-ray diffractometer (Rigaku, Japan) equipped with a CuKa X-ray source (λ of 1.541838 Å). Scans were performed over the 10° to 60° range at high resolution (0.01° step, 1.0° min−1 scanning speed) using a monochromator to suppress background fluorescence. NASICON samples were scanned in powder form as received, or were pulverized in a mortar when in pellet form; persistent zirconia aggregates were retained to consistently portray the corresponding phase of the composite material. Crystallographic lattice parameters were indexed according to COD cards 1529809 and 1530657 for NASICON (PDF 01-084-1190 and 00-035-0412) as well as COD 5000038 for zirconia (PDF 01-070-2491) [13,14,57,58].
Broadband dielectric and conductivity measurements were performed on an Alpha-A Modular Measurement System (NOVOCONTROL, Montabaur, Germany) for dielectric, conductivity, and electrochemical impedance spectroscopy, equipped with a Quattro Cryosystem temperature controller. Scans were performed over the frequency range of 0.1 Hz to 10 MHz and temperature range of 173 K to 393 K under a dry nitrogen atmosphere—with the exception of the reference sample that was scanned up to 293 K instead, as its measurement preceded the in-lab manufacturing of samples and was consumed in subsequent analyses. Dielectric permittivity and conductivity were measured isothermally in steps of 5 K using an AC voltage amplitude of 0.1 V. Prior to measurement, NASICON pellets were dried at 120 °C for 2 h under nitrogen to remove moisture and solvents, and silver paint was administered on their surfaces to secure good contact with the measuring electrodes.

3. Results and Discussion

3.1. Preliminary Material Characterization: Effects of Processing Parameters

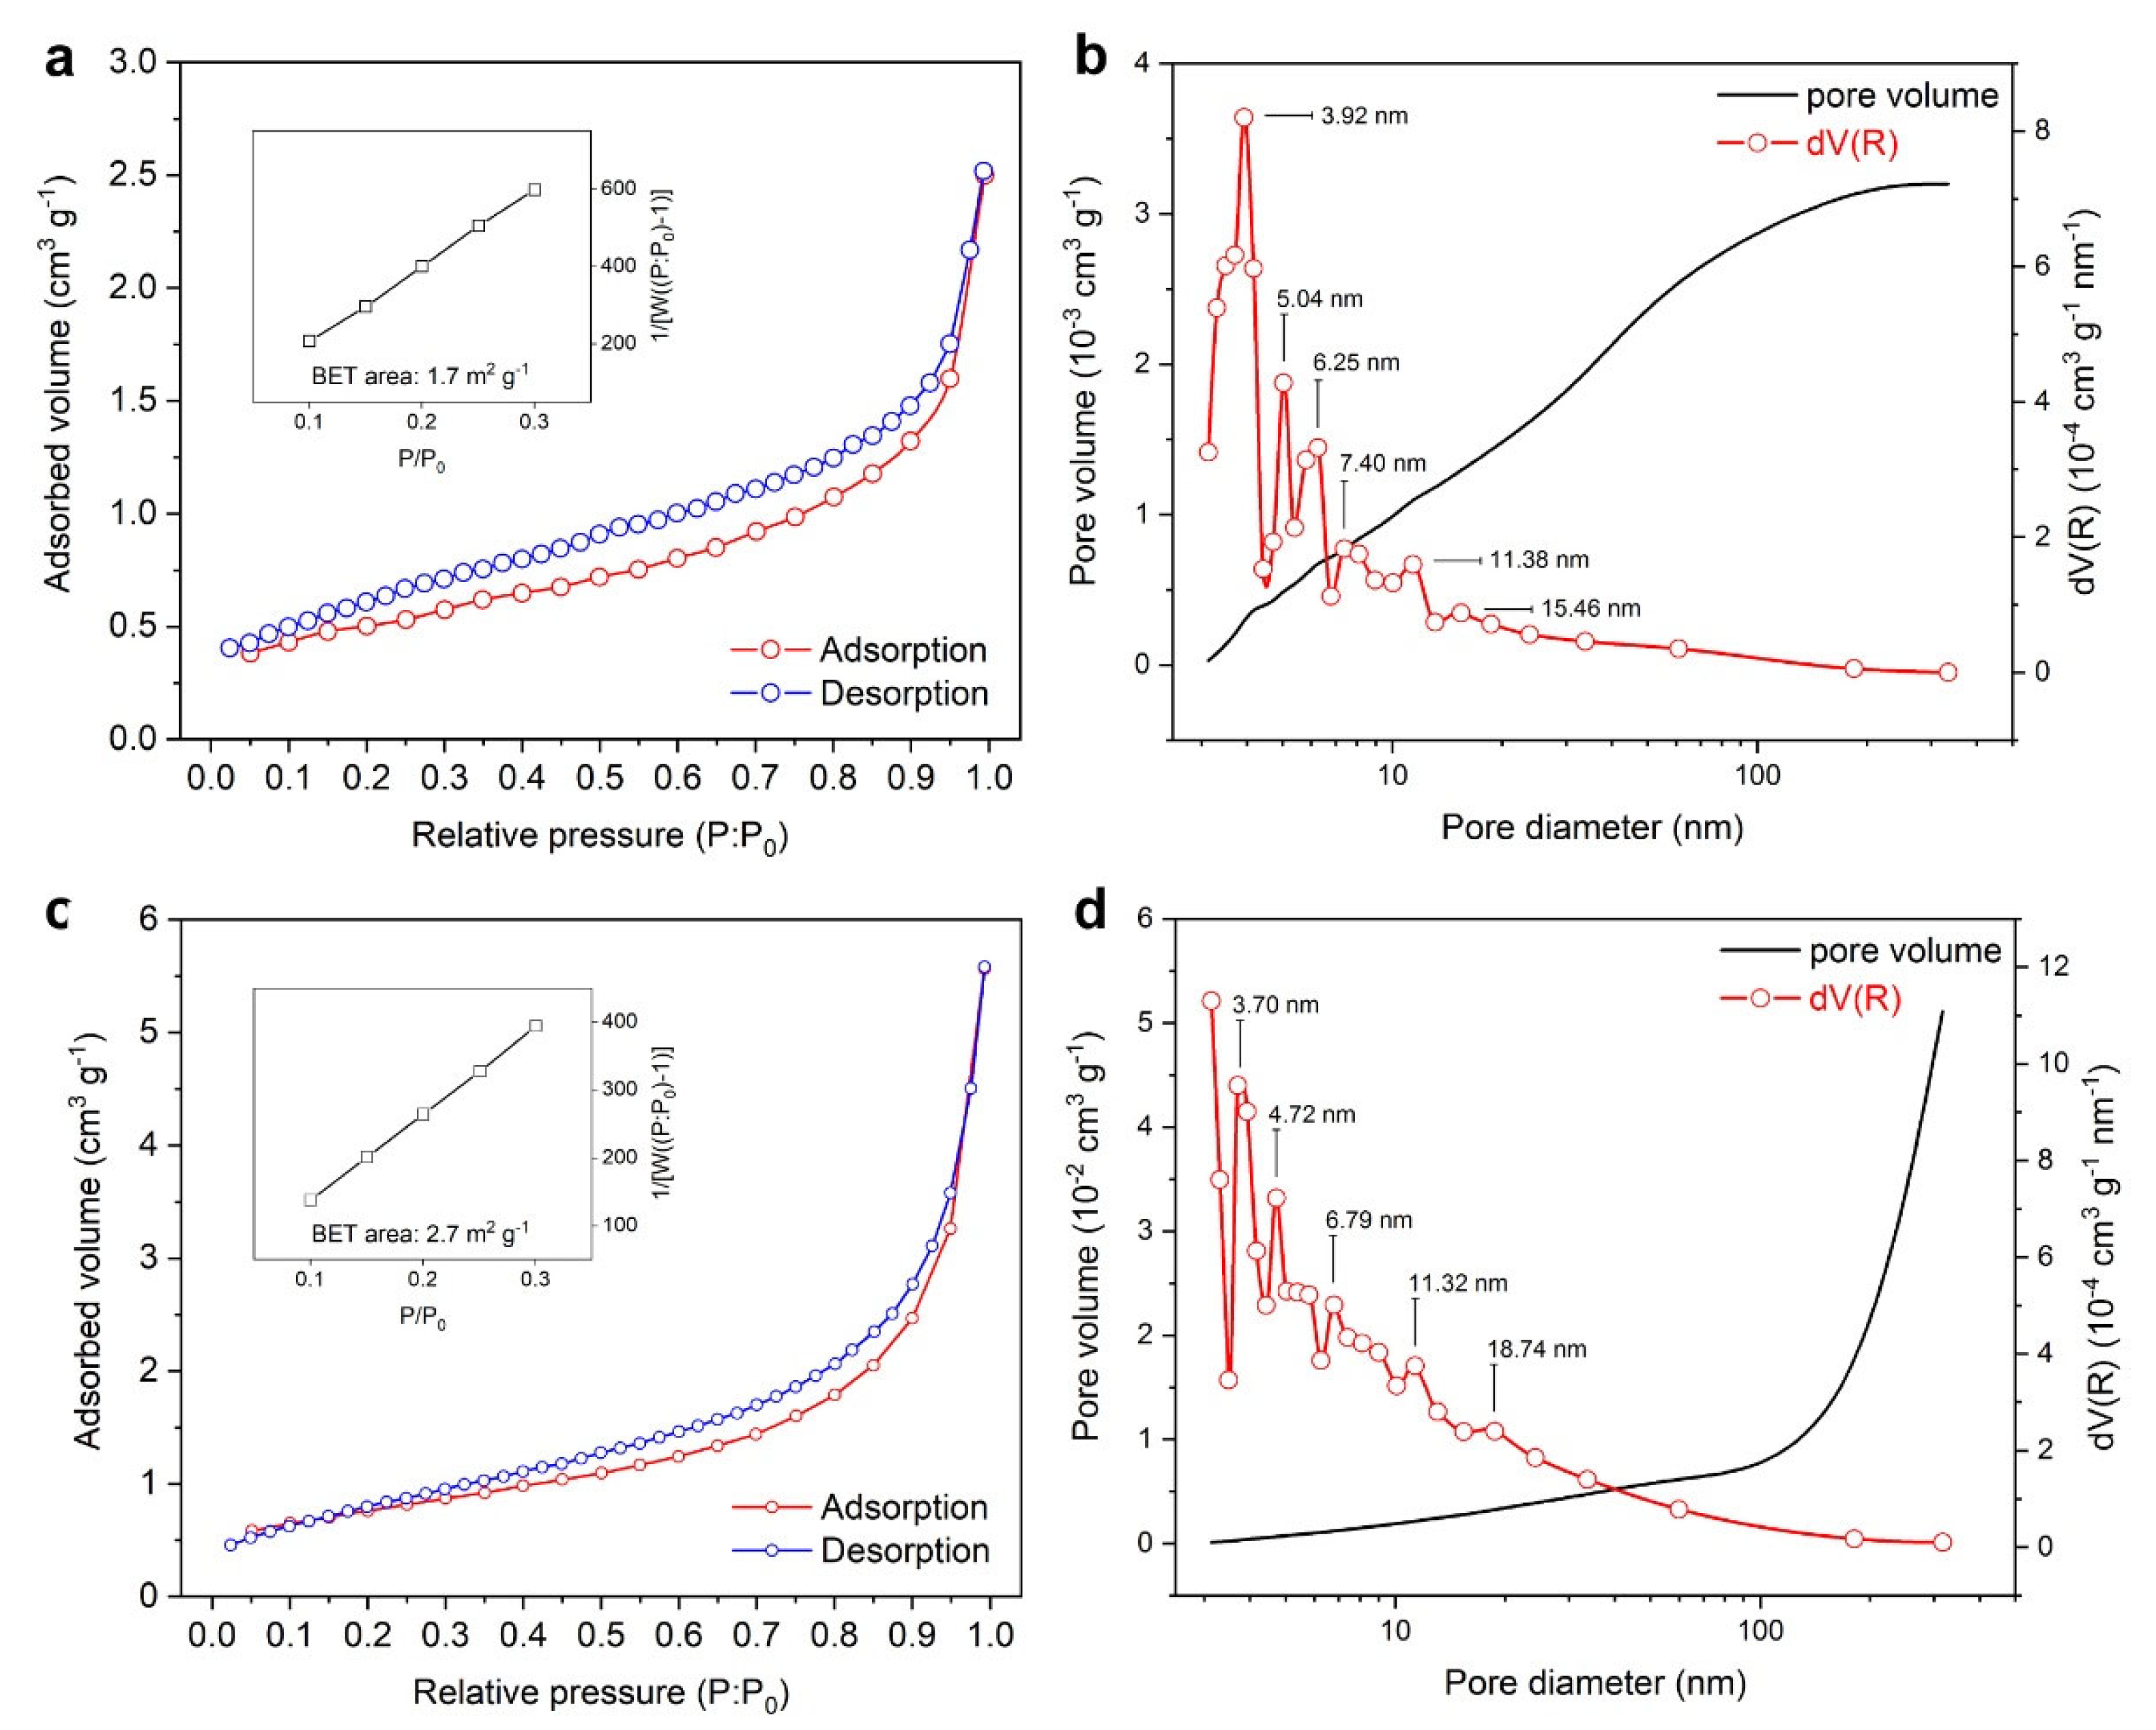
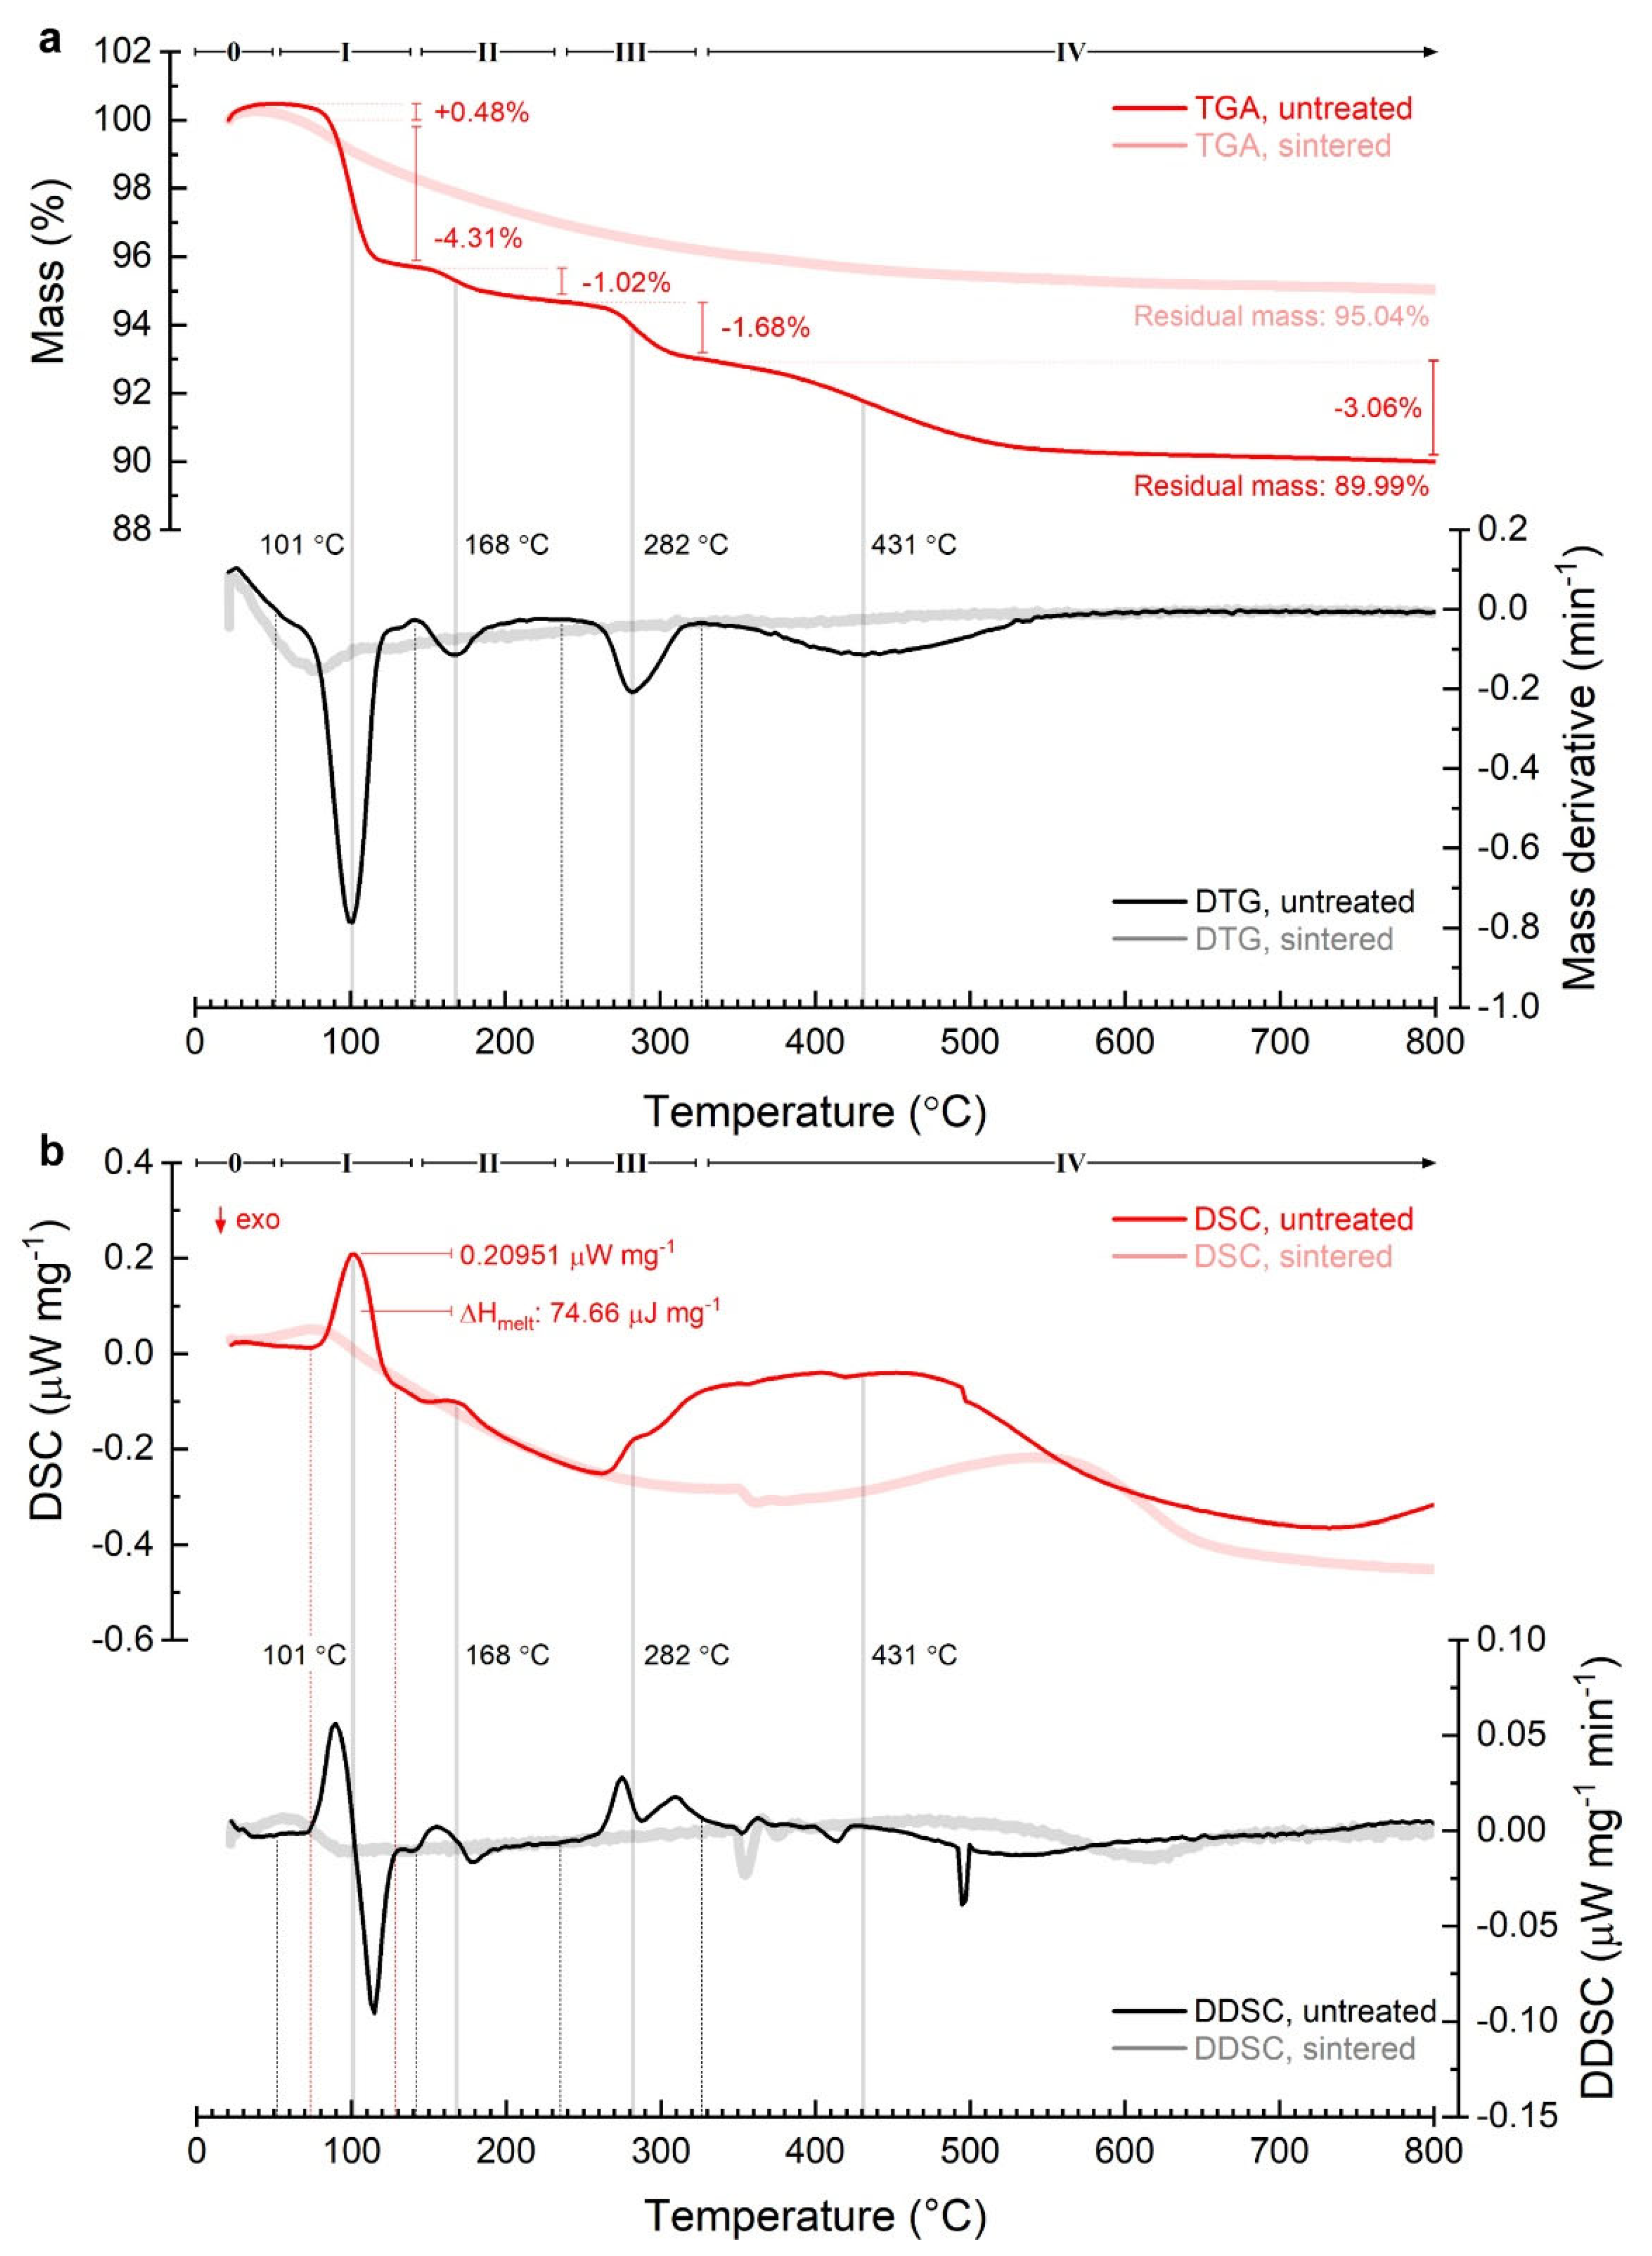
3.1.1. Particle Size Distribution, Microporosity, and Thermal Profiles

According to recent studies [54,55], particle size distribution for the precursor materials can have an effect on the upper limit for ionic conductivity, making a distinction between materials in the nanoparticle range (<100 nm for ZrO2, and 10 to 20 nm for SiO2) vs. macro-precursors (5 μm for ZrO2, and 216 μm for SiO2). However, such claims may not be universal, primarily because (i) the applied ball-milling procedure may be considered anemic (wet-milling at 120 RPM for 2 h, followed by calcination at 400 °C and pressing into pellets, manual grinding, calcination at 1100 °C, and wet-milling at 120 RPM for 3 h; no sequencing of ball diameters mentioned for fine grinding [54]), which can be remedied by subsequent jet-milling [55]; and (ii) pre-sintered powders originating from nano- and macro-precursors both displayed the exact same bimodal particle size distribution with peaks at 5 μm and 90 μm [54], albeit at relatively different frequencies, thus rendering the effect of initial particle size essentially negligible as smaller particles agglomerated into the same size scales during thermal processing.
In this study, starting from macro-precursors (5 μm for ZrO2, and 200 to 500 μm for SiO2), a noticeably finer grade of particles was achieved by applying a rigorous and highly energetic ball-milling procedure to gradually reduce and homogenize particle sizes. After ball-milling concluded, the precursor mix displayed an average particle size in the low micrometric range (~1.7 μm), which was conserved after sintering with particles of larger diameters (<5 μm) accumulating due to thermally induced aggregation—the latter was also evident in the numerical frequencies of the cumulative distributions shifting toward the larger diameters after thermal treatment (Figure 1). Submicronic particles (≥480 nm) occurring after thermal treatment most possibly originated from the thermal decomposition of the more volatile phases of the precursor constituents (melting point of NH4H2PO4 at 190 °C). Table 1 presents the statistical metrics for the particle size distributions before and after sintering of NASICON powders, obtained by dynamic light scattering (DLS) measurements conducted in static mode to account for micronic particles and verified for the sub-micronic range in dynamic mode.
Dmode and Daverage correspond to the mode and the average hydrodynamical diameter of the distributions, respectively; the DA metrics signify the diameter value corresponding to the cumulative curve at A% (e.g., D50 corresponds to the median); CV is the covariance of the sample; PI is the polydispersity index, where PI = (D90D10)/D50; and RMS is the root mean square. Analysis revealed that the sintered NASICON powders were polydispersed (PI >> 70%) compared to the monodispersed pre-sintered material, while both distributions were monomodal. Polydispersity occurs as a consequence of thermally induced aggregation at the high temperatures of sintering; modality, however, is strictly dependent on the effectiveness of ball-milling, and is conserved before and after thermal processing.
Surface area and microporosity analyses of pre-sintered NASICON samples were conducted by BET and BJH, respectively (Figure 2), based on nitrogen adsorption caused by intrinsic surface energies (i.e., non-selective and reversible physical adsorption between gas molecules and the exposed surface of the porous material). The pre-sintered powders registered a BET surface area of 1.7 m2 g−1, rising to 2.7 m2 g−1 after thermal treatment, within the order of magnitude for BET area reported elsewhere [41]. The adsorption/desorption isotherms displayed a hysteresis loop, suggesting the dominance of a mainly mesoporous structure; their near overlap revealed a relatively poor porosity behavior corresponding to IV-type isotherms. These occur when gas condenses in the miniscule capillary pores of solid media at pressures below their saturation points (capillary condensation), indicating the dominance of finite-length pores; hysteresis occurs due to the difference in interface geometry between adsorption and desorption [59].
The effects of thermal processing were gauged by thermogravimetric analysis (TGA) and differential scanning calorimetry (DSC) conducted over the 20 °C to 800 °C range in an inert atmosphere at the same heating rate to emulate the non-oxidative conditions of calcination (Figure 3). It is noteworthy that thermal analysis in the literature has been conducted largely in synthetic (oxidative) atmospheres, thus severely limiting the derivable information [40,46]. Samples of untreated NASICON powder collected after ball-milling and fully thermally treated powder (pulverized from NASICON pellet after sintering) were compared.
Thermal analysis revealed four main regions of thermal events, with an initiatory apparent mass increase (0.48%) preceding the 50 °C mark—this is a typical artifact due to the Archimedean buoyancy effect caused by the density of the carrier gas decreasing on heating [60]. The initial thermal event (I) occurs in the zone between 51 °C and 142 °C, with a dominant endothermic peak at 101 °C (rate of 0.21 μW mg−1, enthalpy change ΔH of 74.66 μJ mg−1) resulting in a mass loss of 4.31%; this can be attributed to the loss of physisorbed water. Events of a lesser magnitude follow with thermal peaks at 168 °C (II: monoclinic to rhombohedral 2nd order phase transition, i.e., an A-type anomaly [40,58,61]), 282 °C (III: NH4H2PO4 decomposition [62]), and 431 °C (IV: chemisorbed water; susceptibility to hydration: NaAl5O8 (β″-alumina) > NaAl11O17 (β-alumina) > Na3Zr2Si2PO12 (NASICON) > Na3Sc2(PO4)3 (PHOSCAN) [63,64,65]) resulting in gradual losses until the residual mass was stabilized at 89.99% by the 800 °C mark. In contrast, TGA/DSC curves of the thermally treated material did not display event peaks of a significant magnitude, with minor mass losses being limited to less than 5%.

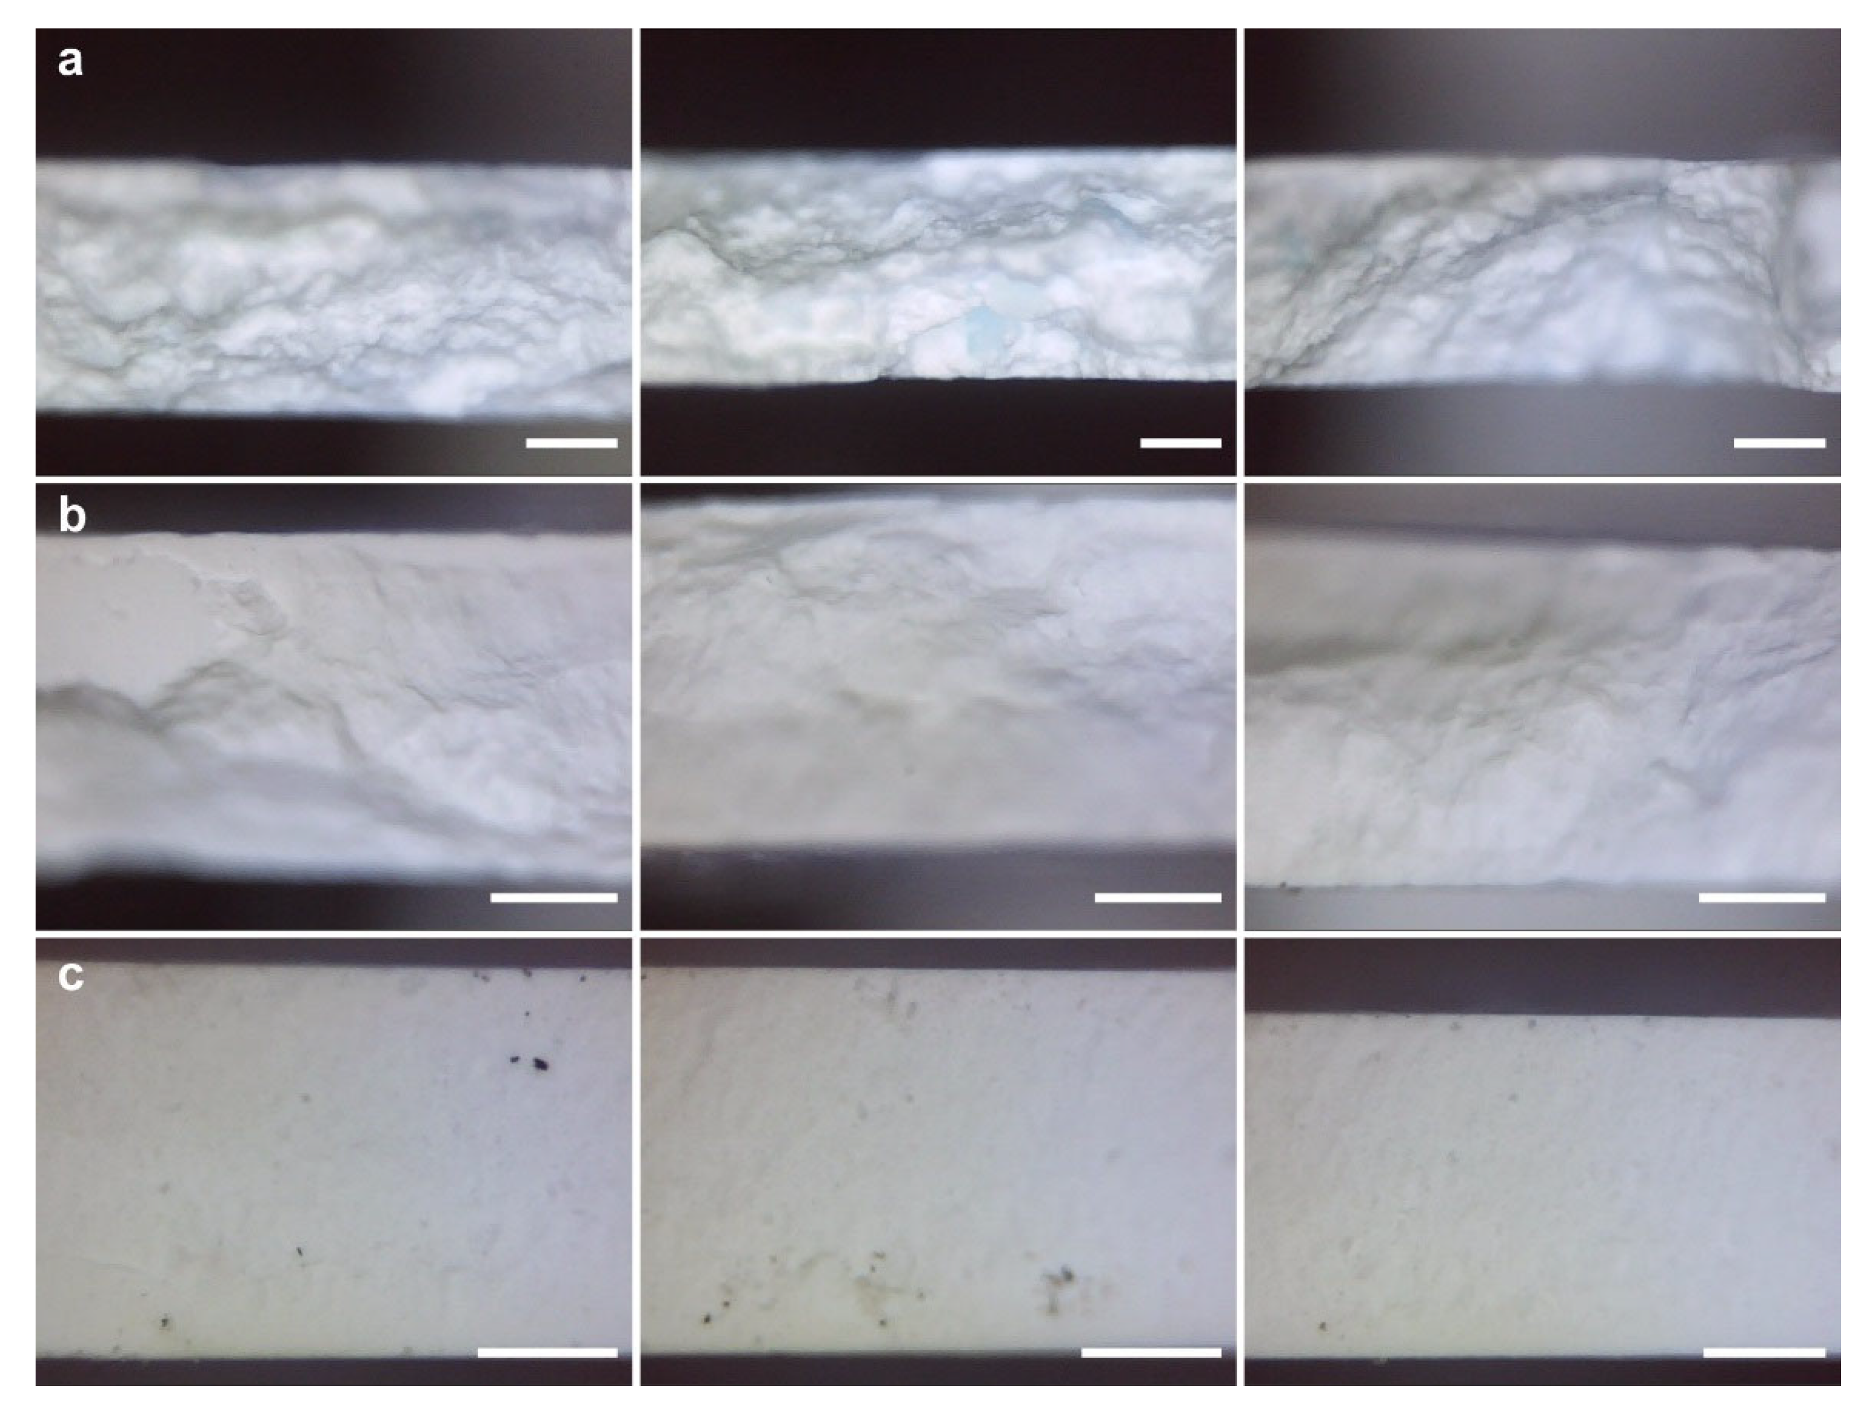
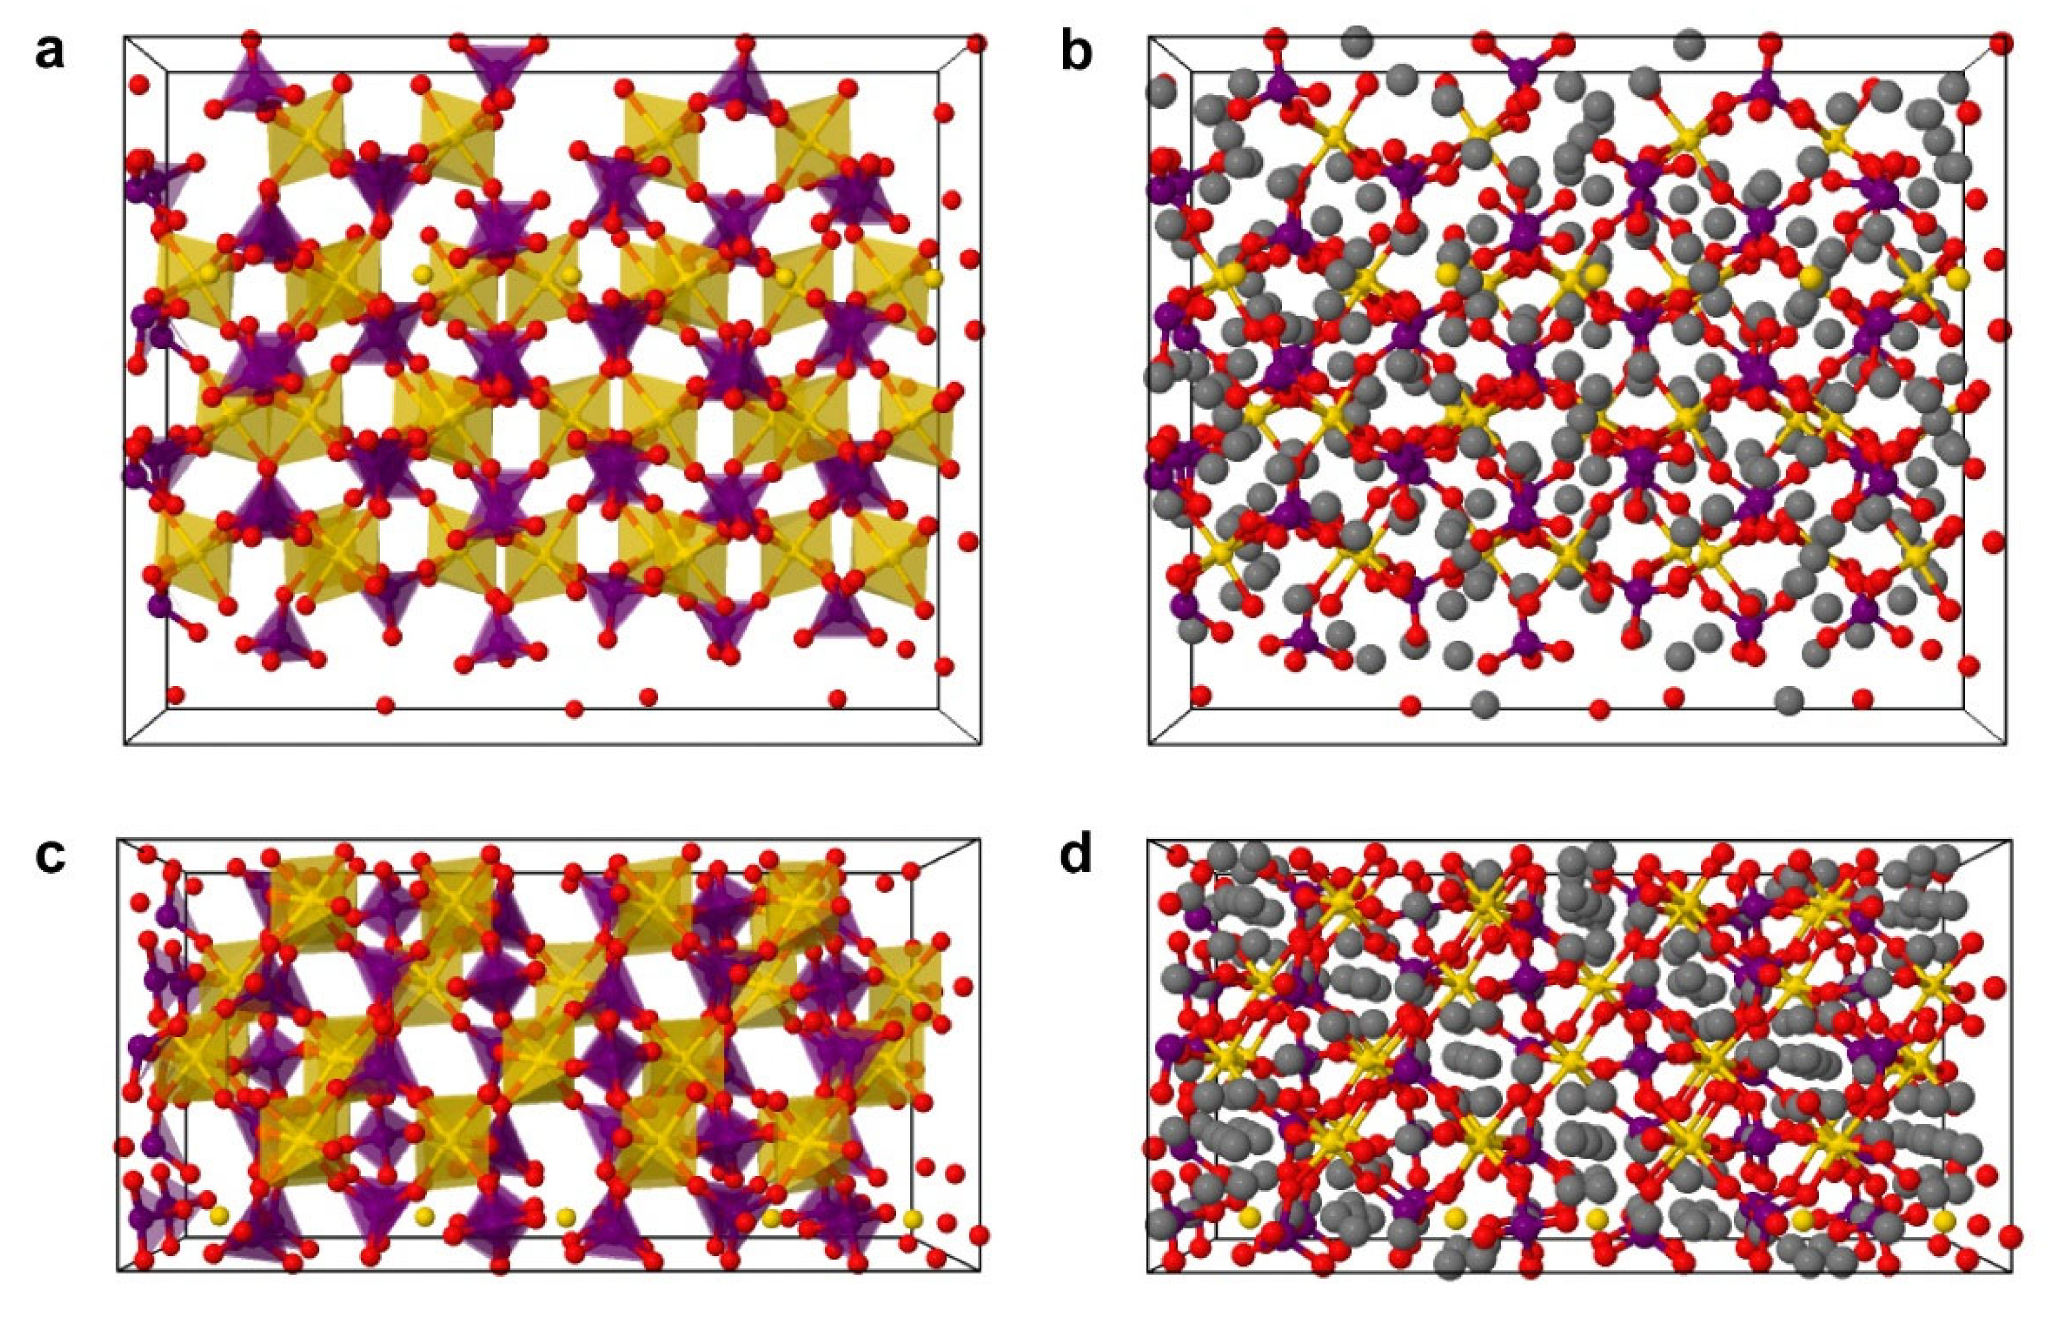
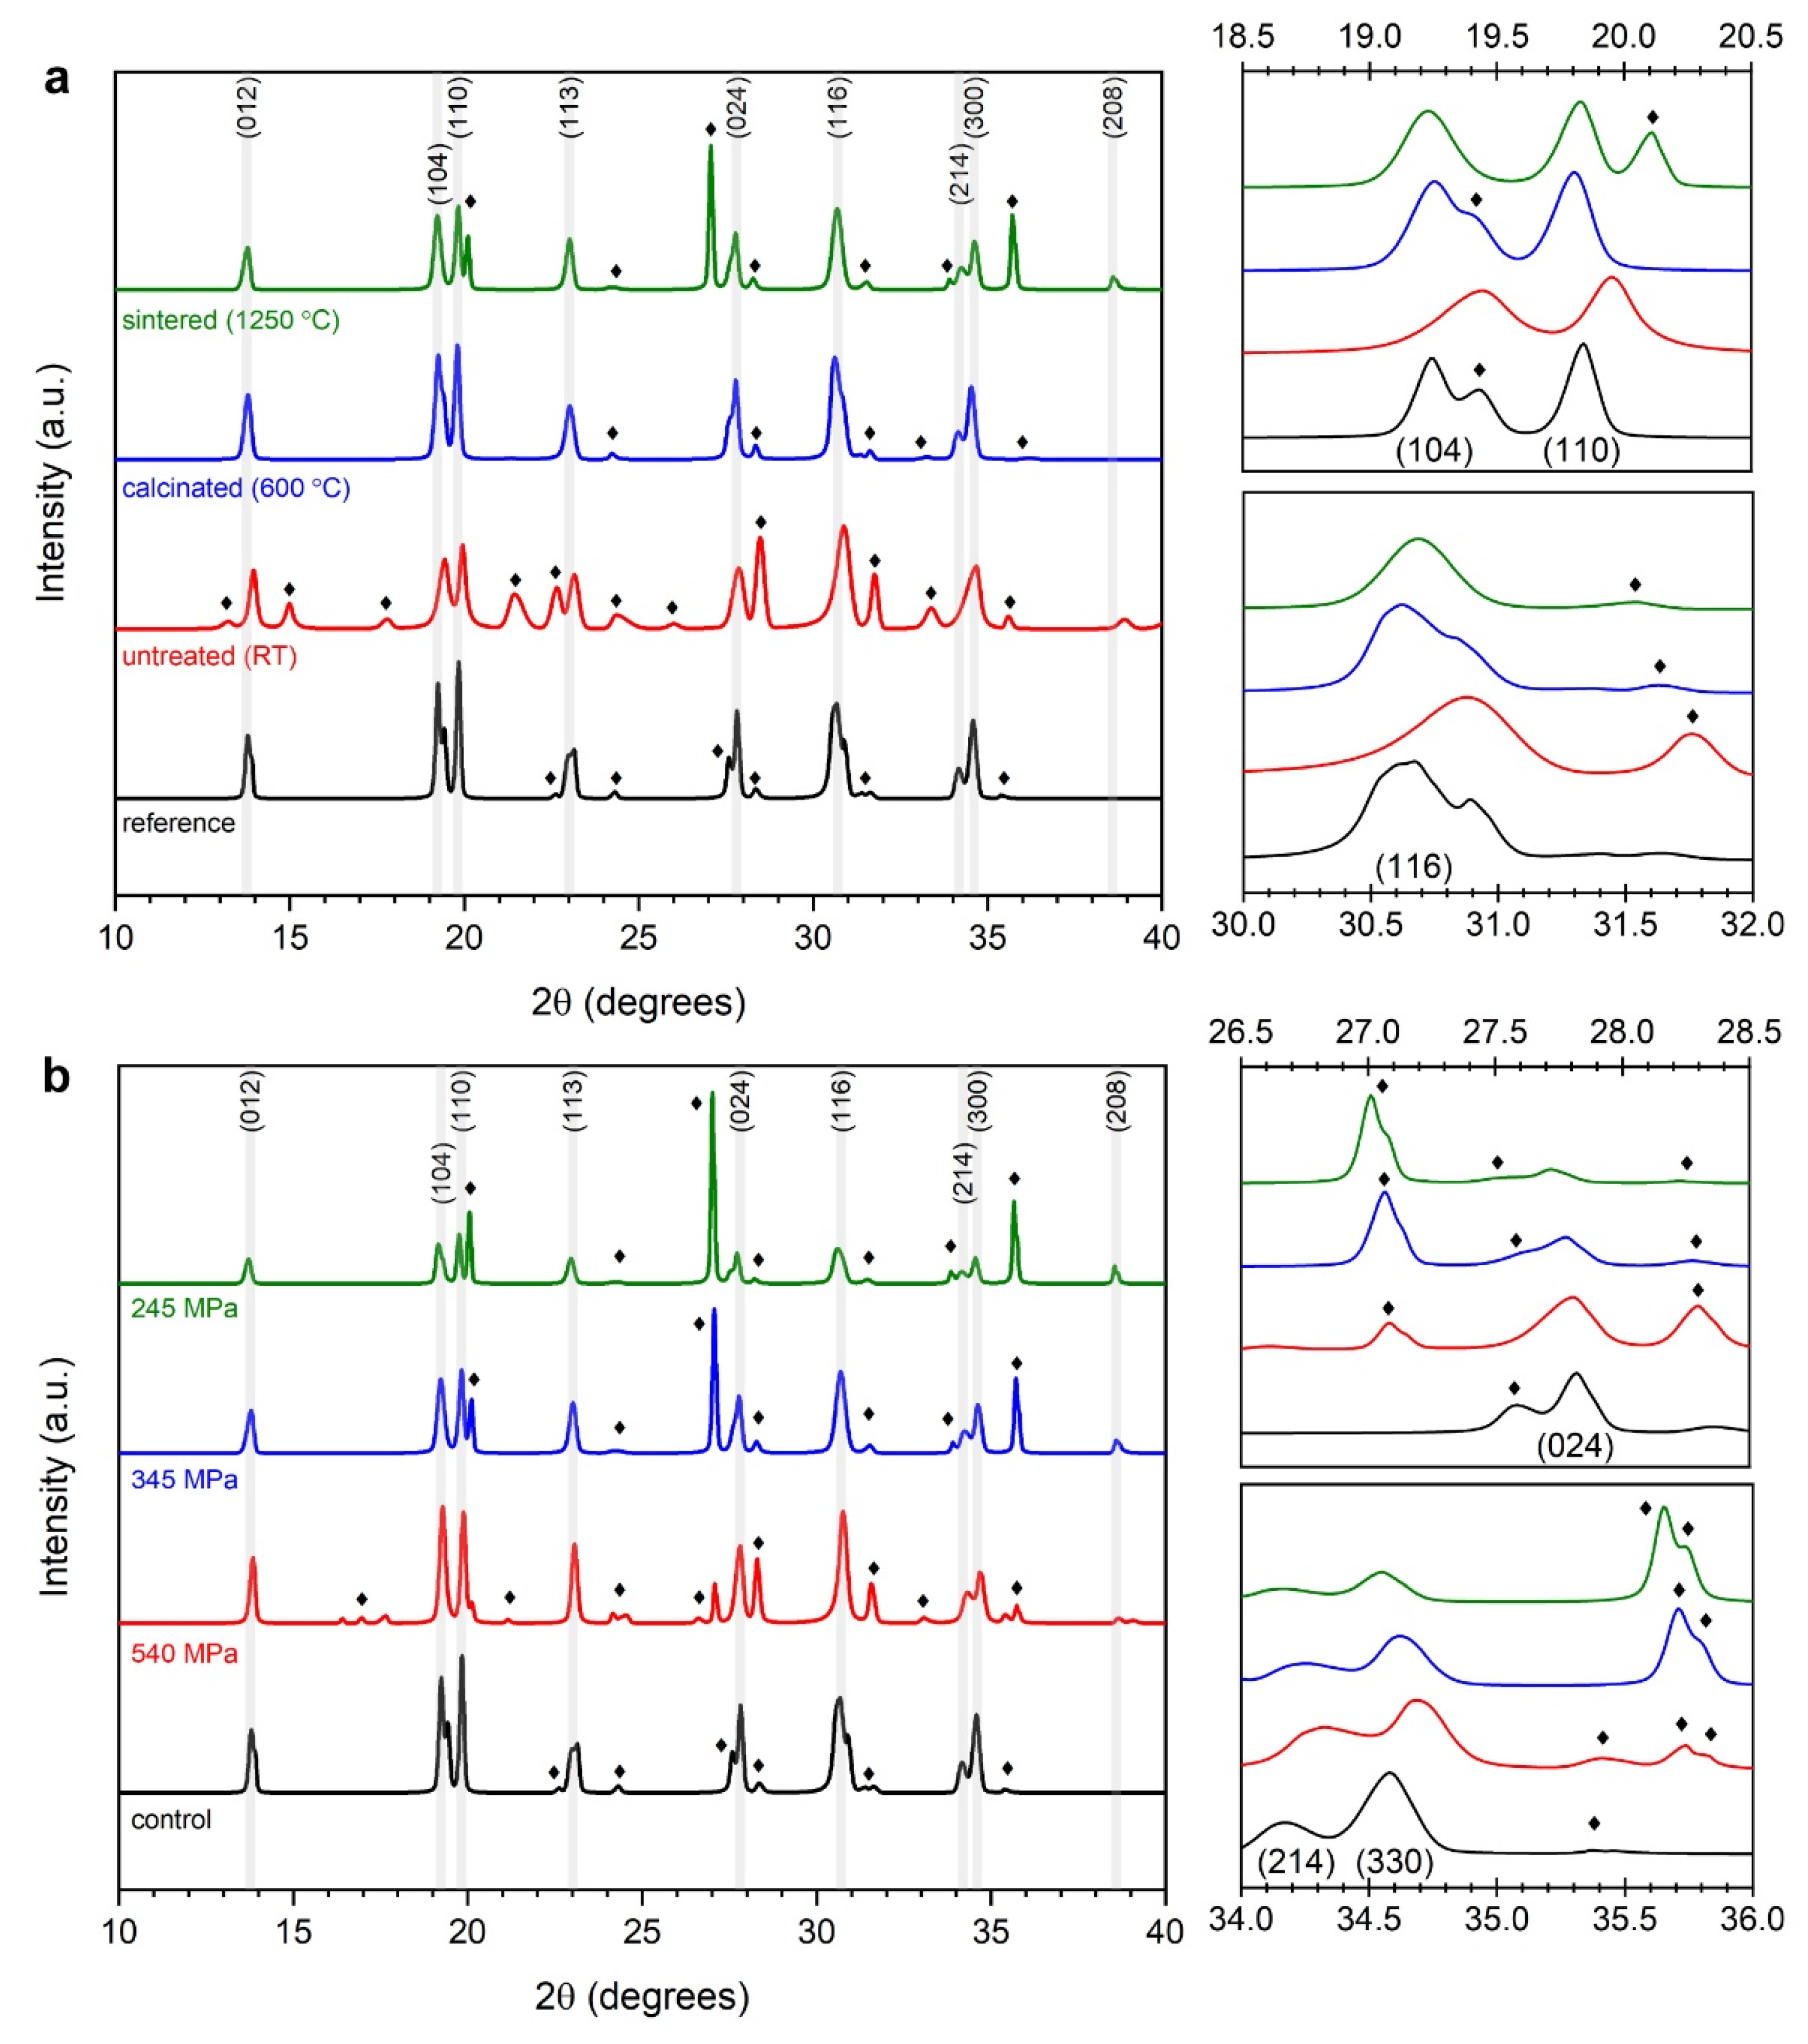
3.1.2. Macro- and Microstructure Phase Investigations

The effects of aggregation on the macrostructure of pellets produced by cold isostatic pressing are displayed by the optical micrographs in Figure 4. Cross-sections revealed a packing order with visible anisotropy, manifesting as clusters of different orientations but with distinct grain boundaries within the pellet volume. The elevated applied pressures ensure high packing ratios of clusters and structural integrity of the assembled pellets. Another observation concerns the occurrence of miniscule dark spots within the matrix, albeit at low frequencies due to random carbonic impurities introduced by poor sample handling—this can be remedied by storing pre-sintered pellets in their source material.
Investigations on the microstructure of NASICON need to commence with considerations of its crystal structure: Na1+xZr2SixP3-xO12 is an interstitial alloy of NaZr2P3O12 and Na4Zr2Si3O12 arranged into a 3D framework comprised of (Si/P)O4 tetrahedra sharing pocket corners with ZrO6 octahedra (Figure 5); its lattice conforms to a C2/c monoclinic phase (a = 15.6723 Å; b = 9.0537 Å; c = 9.2758 Å; V = 1088.15 Å3) at room temperature, transitioning to R3̅c rhombohedral (a = b = 9.0535 Å; c = 23.0677 Å; V = 1637.45 Å3) above approximately 160 °C [4,7,13,14,58,66,67]. Both phase structures present four Na sites (monoclinic: 1 Na1, 2 Na2, 1 Na3; rhombohedral 1 Na1, 3 Na2). In the monoclinic phase, both Na1 and Na2 sites are occupied, whereas in the rhombohedral phase, only Na1 sites are fully occupied. The ionic conduction mechanism consists of Na+ ions migrating from Na1 to Na2 or to Na3 and in reverse through the oxygen bottleneck within the crystal lattice. During this phase transition, the ZrO6 and (Si/P)O4 3D framework remains intact, while one Na2 and two Na3 sites convert into Na2 sites. Due to the higher symmetry of the rhombohedral phase, there are more diffraction peaks emanating from the monoclinic crystal, thus high-temperature in situ X-ray diffractometry (XRD) provides a viable means of detecting the two structures [58]. Being more symmetrical, the rhombohedral phase also displayed the higher Na+ ion mobility, with lower activation energy Ea and higher bulk conductivity than the monoclinic phase [3,4,25,53].
However, further elaboration on phase transitioning is beyond the scope of this work, especially since this transition is both temperature-dependent and reversible [7,58,66,67]. The NASICON structure will permanently transform only if the Na:Si:P stoichiometry is altered—the end-members of Na1+xZr2SixP3-xO12 (i.e., x = 0 and 4) are rhombohedral at room temperature, but their lattice parameters change significantly as x approaches 2, where the lattice reverts to the monoclinic crystal structure [58,61,66,67]. The critical temperature of this phase transition can be continuously lowered by incrementally increasing Na and the Si:P ratio in the general formula, until the rhombohedral phase is stabilized at room temperature [66].
In this work, XRD was employed to study the evolution of the SSR over selected temperature levels that mark the different stages of thermal treatment and also investigate any possible changes in the structure induced by the different isostatic pressure levels applied during pellet formation (Figure 6). Primary peak signatures revealed the high crystallinity of the calcinated and sintered materials, with NASICON-associated signatures increasing both in crystallite size and intensity (Table 2). SSR is completed at the final sintering stage at 1250 °C, with the primary NASICON peaks also appearing at the calcination stage at 600 °C. The untreated sample presented most of its zirconia content in unreacted form, transforming from its initial tetragonal to the monoclinic phase (PDF 00-037-1484) at elevated temperatures—these traces of monoclinic zirconia persisted as significant secondary phases throughout the thermal treatments, most possibly due to the loss of volatile elements during the high-temperature SSR [5,53]. The peak around 21.5°, present only in the untreated material, corresponded to an unreacted cubic γ-Na3PO4 phase, which vanished over elevated temperatures [51].
Another important observation concerning the XRD spectra over the investigated thermal treatment stages is the marked deviation between the characteristic signatures observed for the in-lab produced sample sintered at 1250 °C and the commercial reference one, which is instead more closely mirrored by the calcinated sample at 600 °C. This becomes more evident by the close inspection of the (104), (110), and (116) peaks, as seen in the side-panels of Figure 6a, suggesting that the commercial sample was sintered at low temperature (below 1100 °C) to avoid zirconia contamination, which is a common negative effect occurring over elevated sintering temperatures [46,48,50,52,53,58]. Here, it needs to be underlined that the commercial reference sample was treated as a “black-box” (there was no information provided by the industrial manufacturer on its synthesis method and parameters), as the aim of this study was to focus on the intrinsic characteristics—both positive and negative—of the classic (i.e., non-optimized) SSR synthesis route.
Zirconia contamination was further investigated by examining XRD spectra of samples obtained after applying different levels of isostatic pressure (245, 345, and 540 MPa) to compact the 1100 °C sintered samples into pellet form (Figure 6b, Table 3). Prominent zirconia signatures included: (i) the trace at 20.1° appearing as a shoulder of the (110) peak (top side-panel of Figure 6a); (ii) the trace at 27.0° before the (024) peak (top side-panel of Figure 6b) that has been identified as zirconium orthosilicate (ZrSiO4) contaminant [58]; and (iii) the traces around 35.7° following the (330) peak (bottom side-panel of Figure 6b). Increasing pressure levels did not necessarily cause the above traces to recede. At the highest applied pressure of 540 MPa, for example, the high-intensity zirconia contaminants were redispersed—without disappearing—into a cascade of minor traces traversing the wider 2θ range. The effect of this on the ionic conductivity of NASICON pellets will determine whether a balancing strategy is viable regarding the applied pressure levels for countering the negative repercussions of elevated temperature (i.e., zirconia contamination).

3.2. Ionic Conductivity and Dielectric Relaxation Investigations

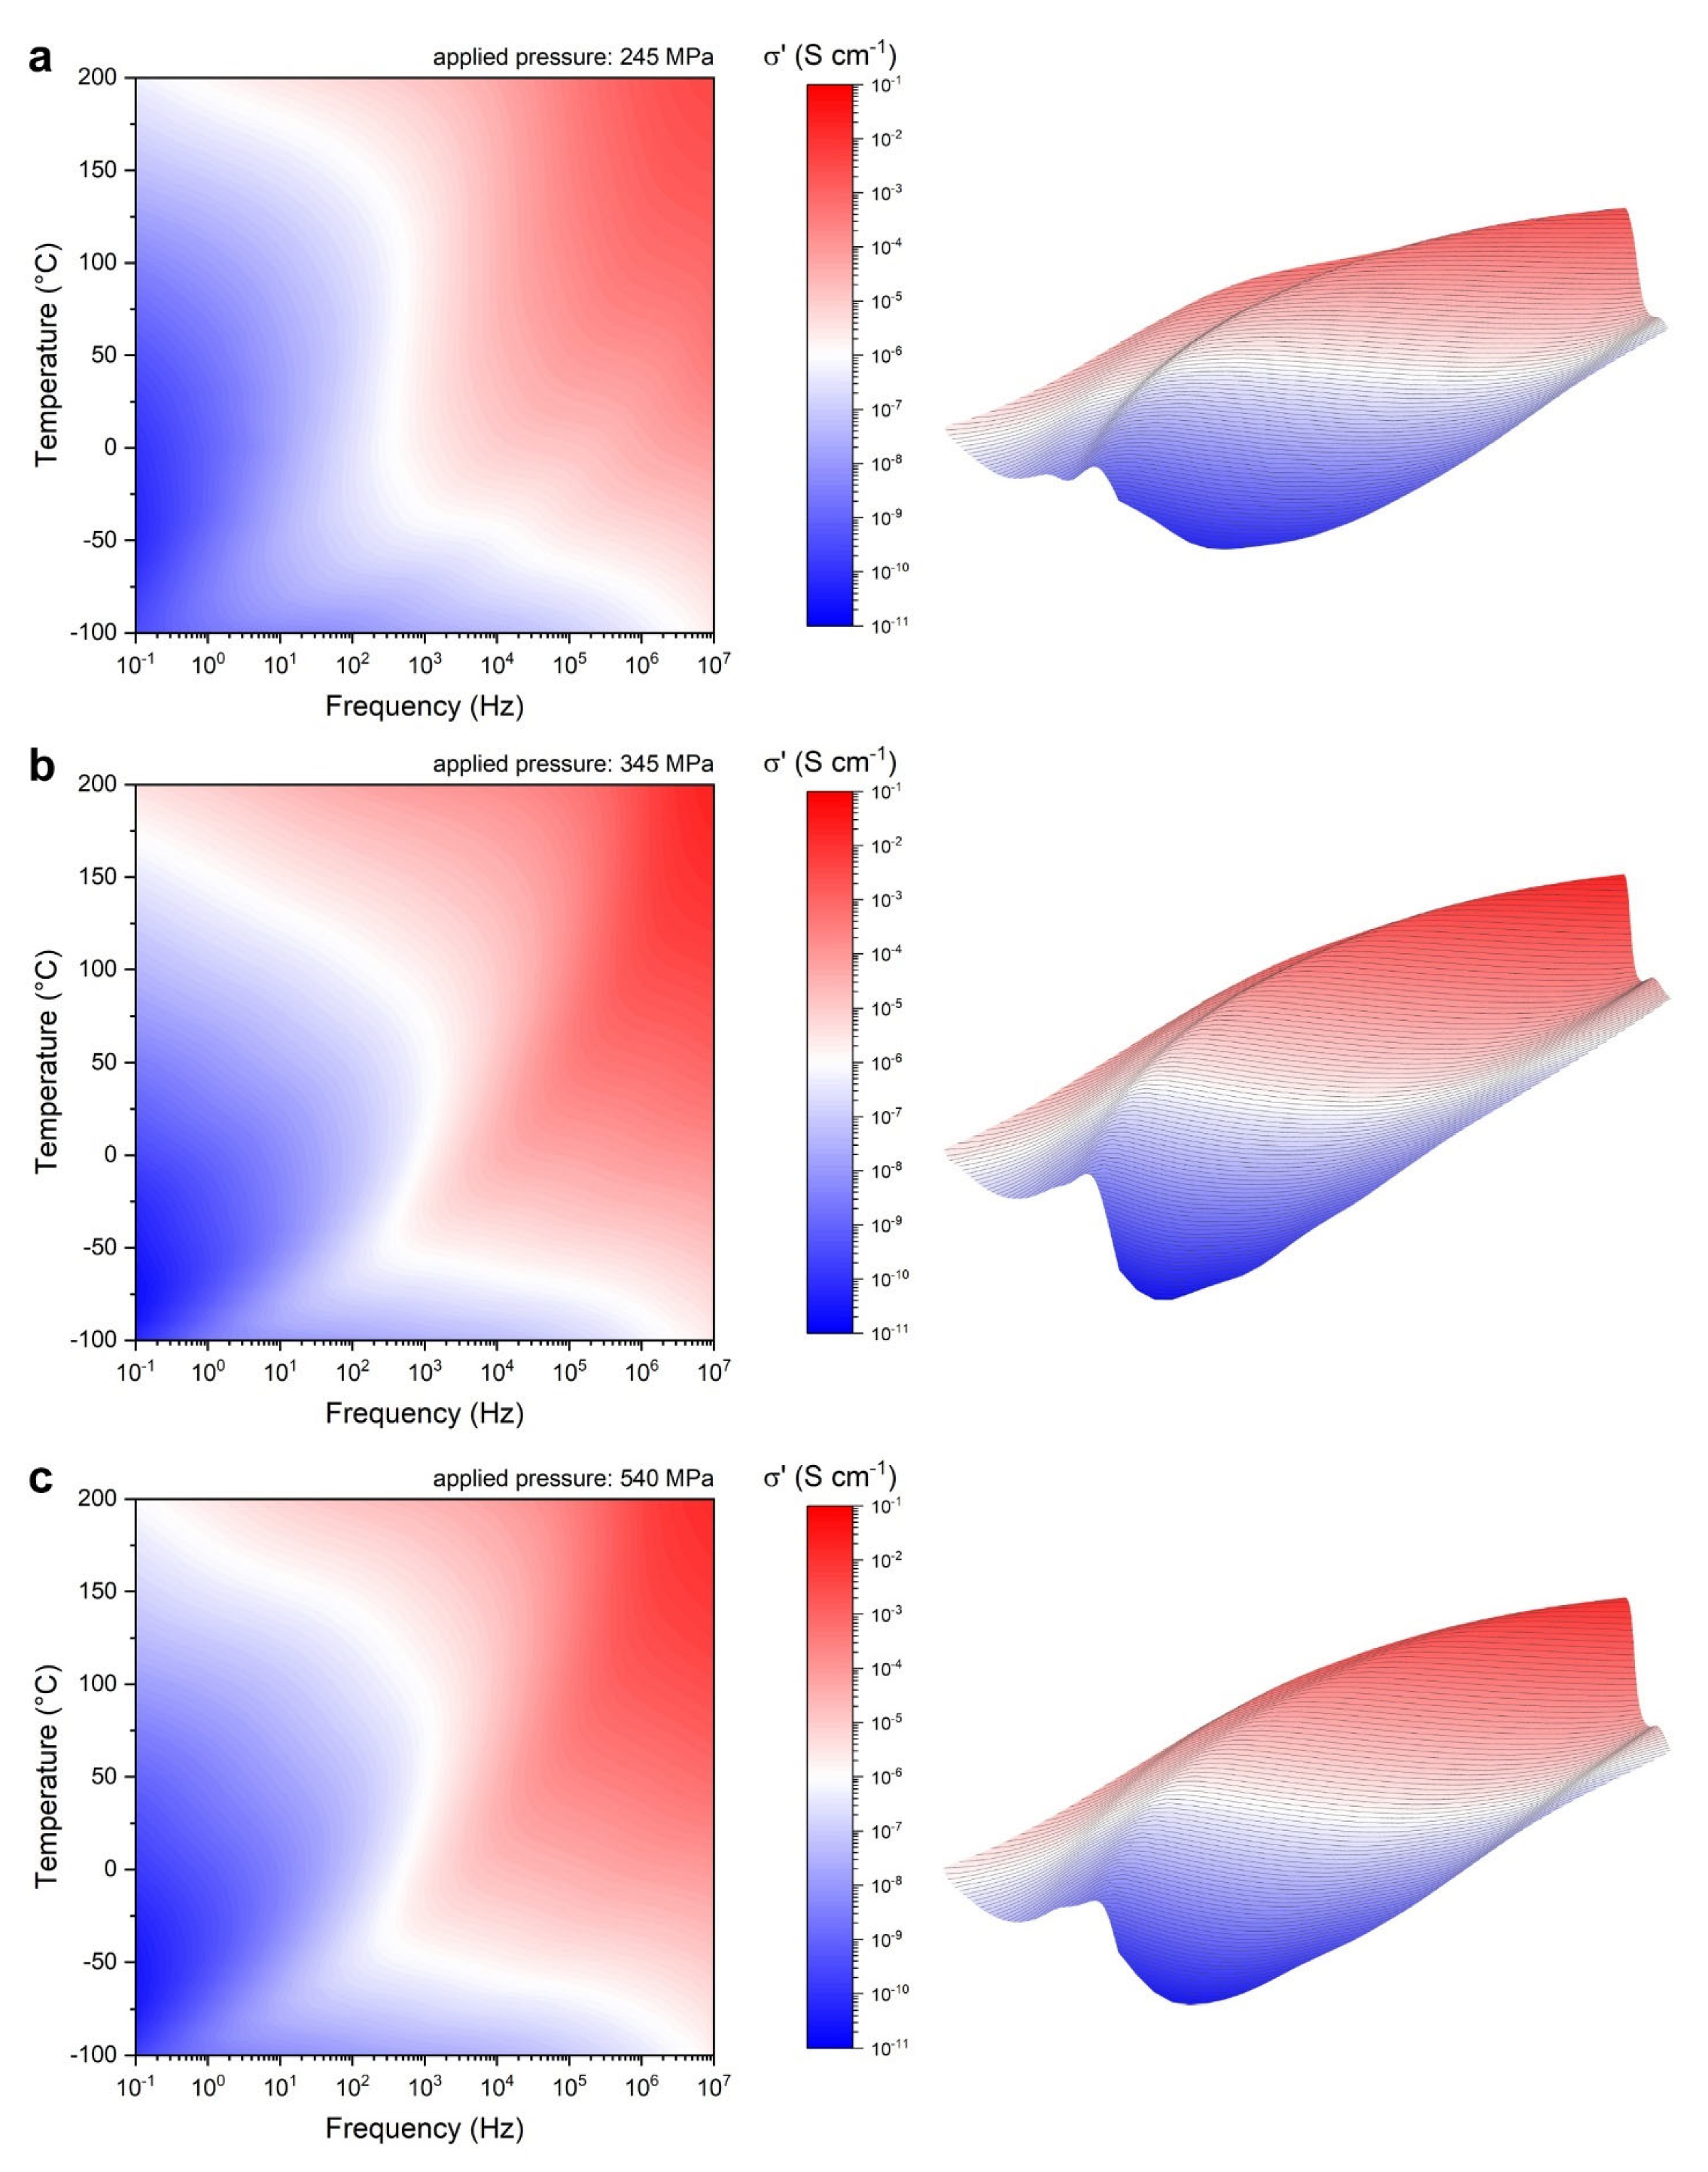
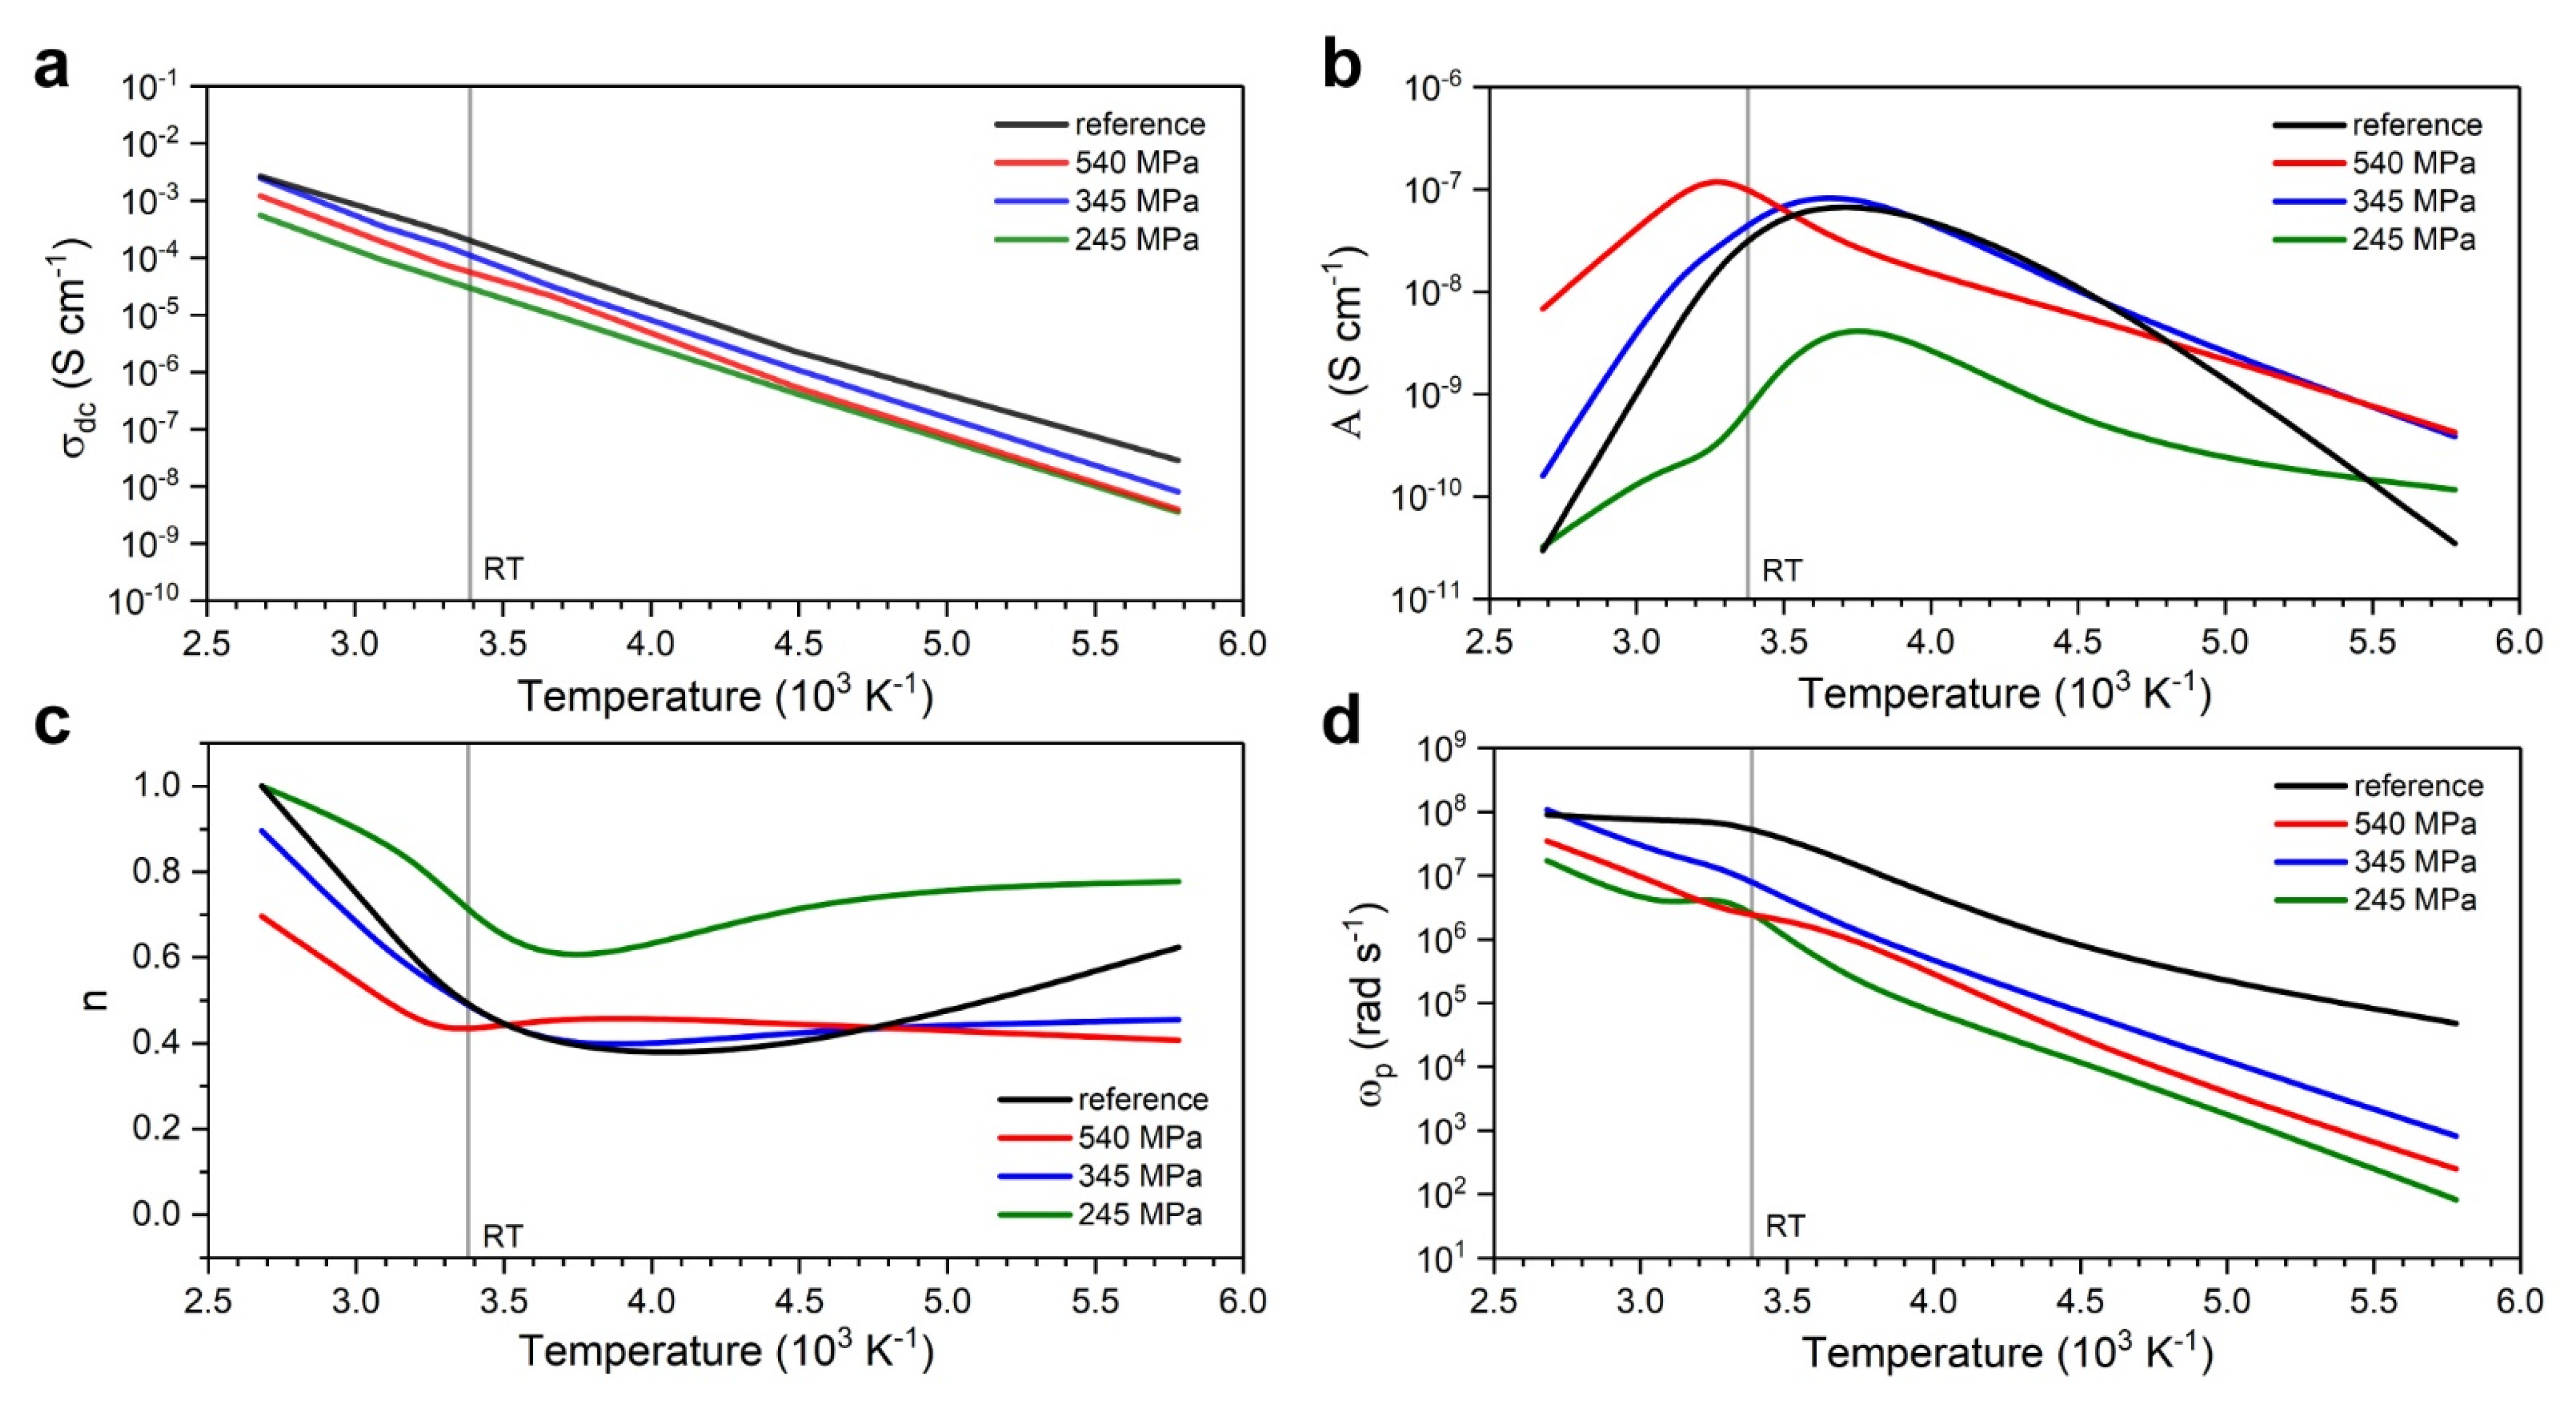
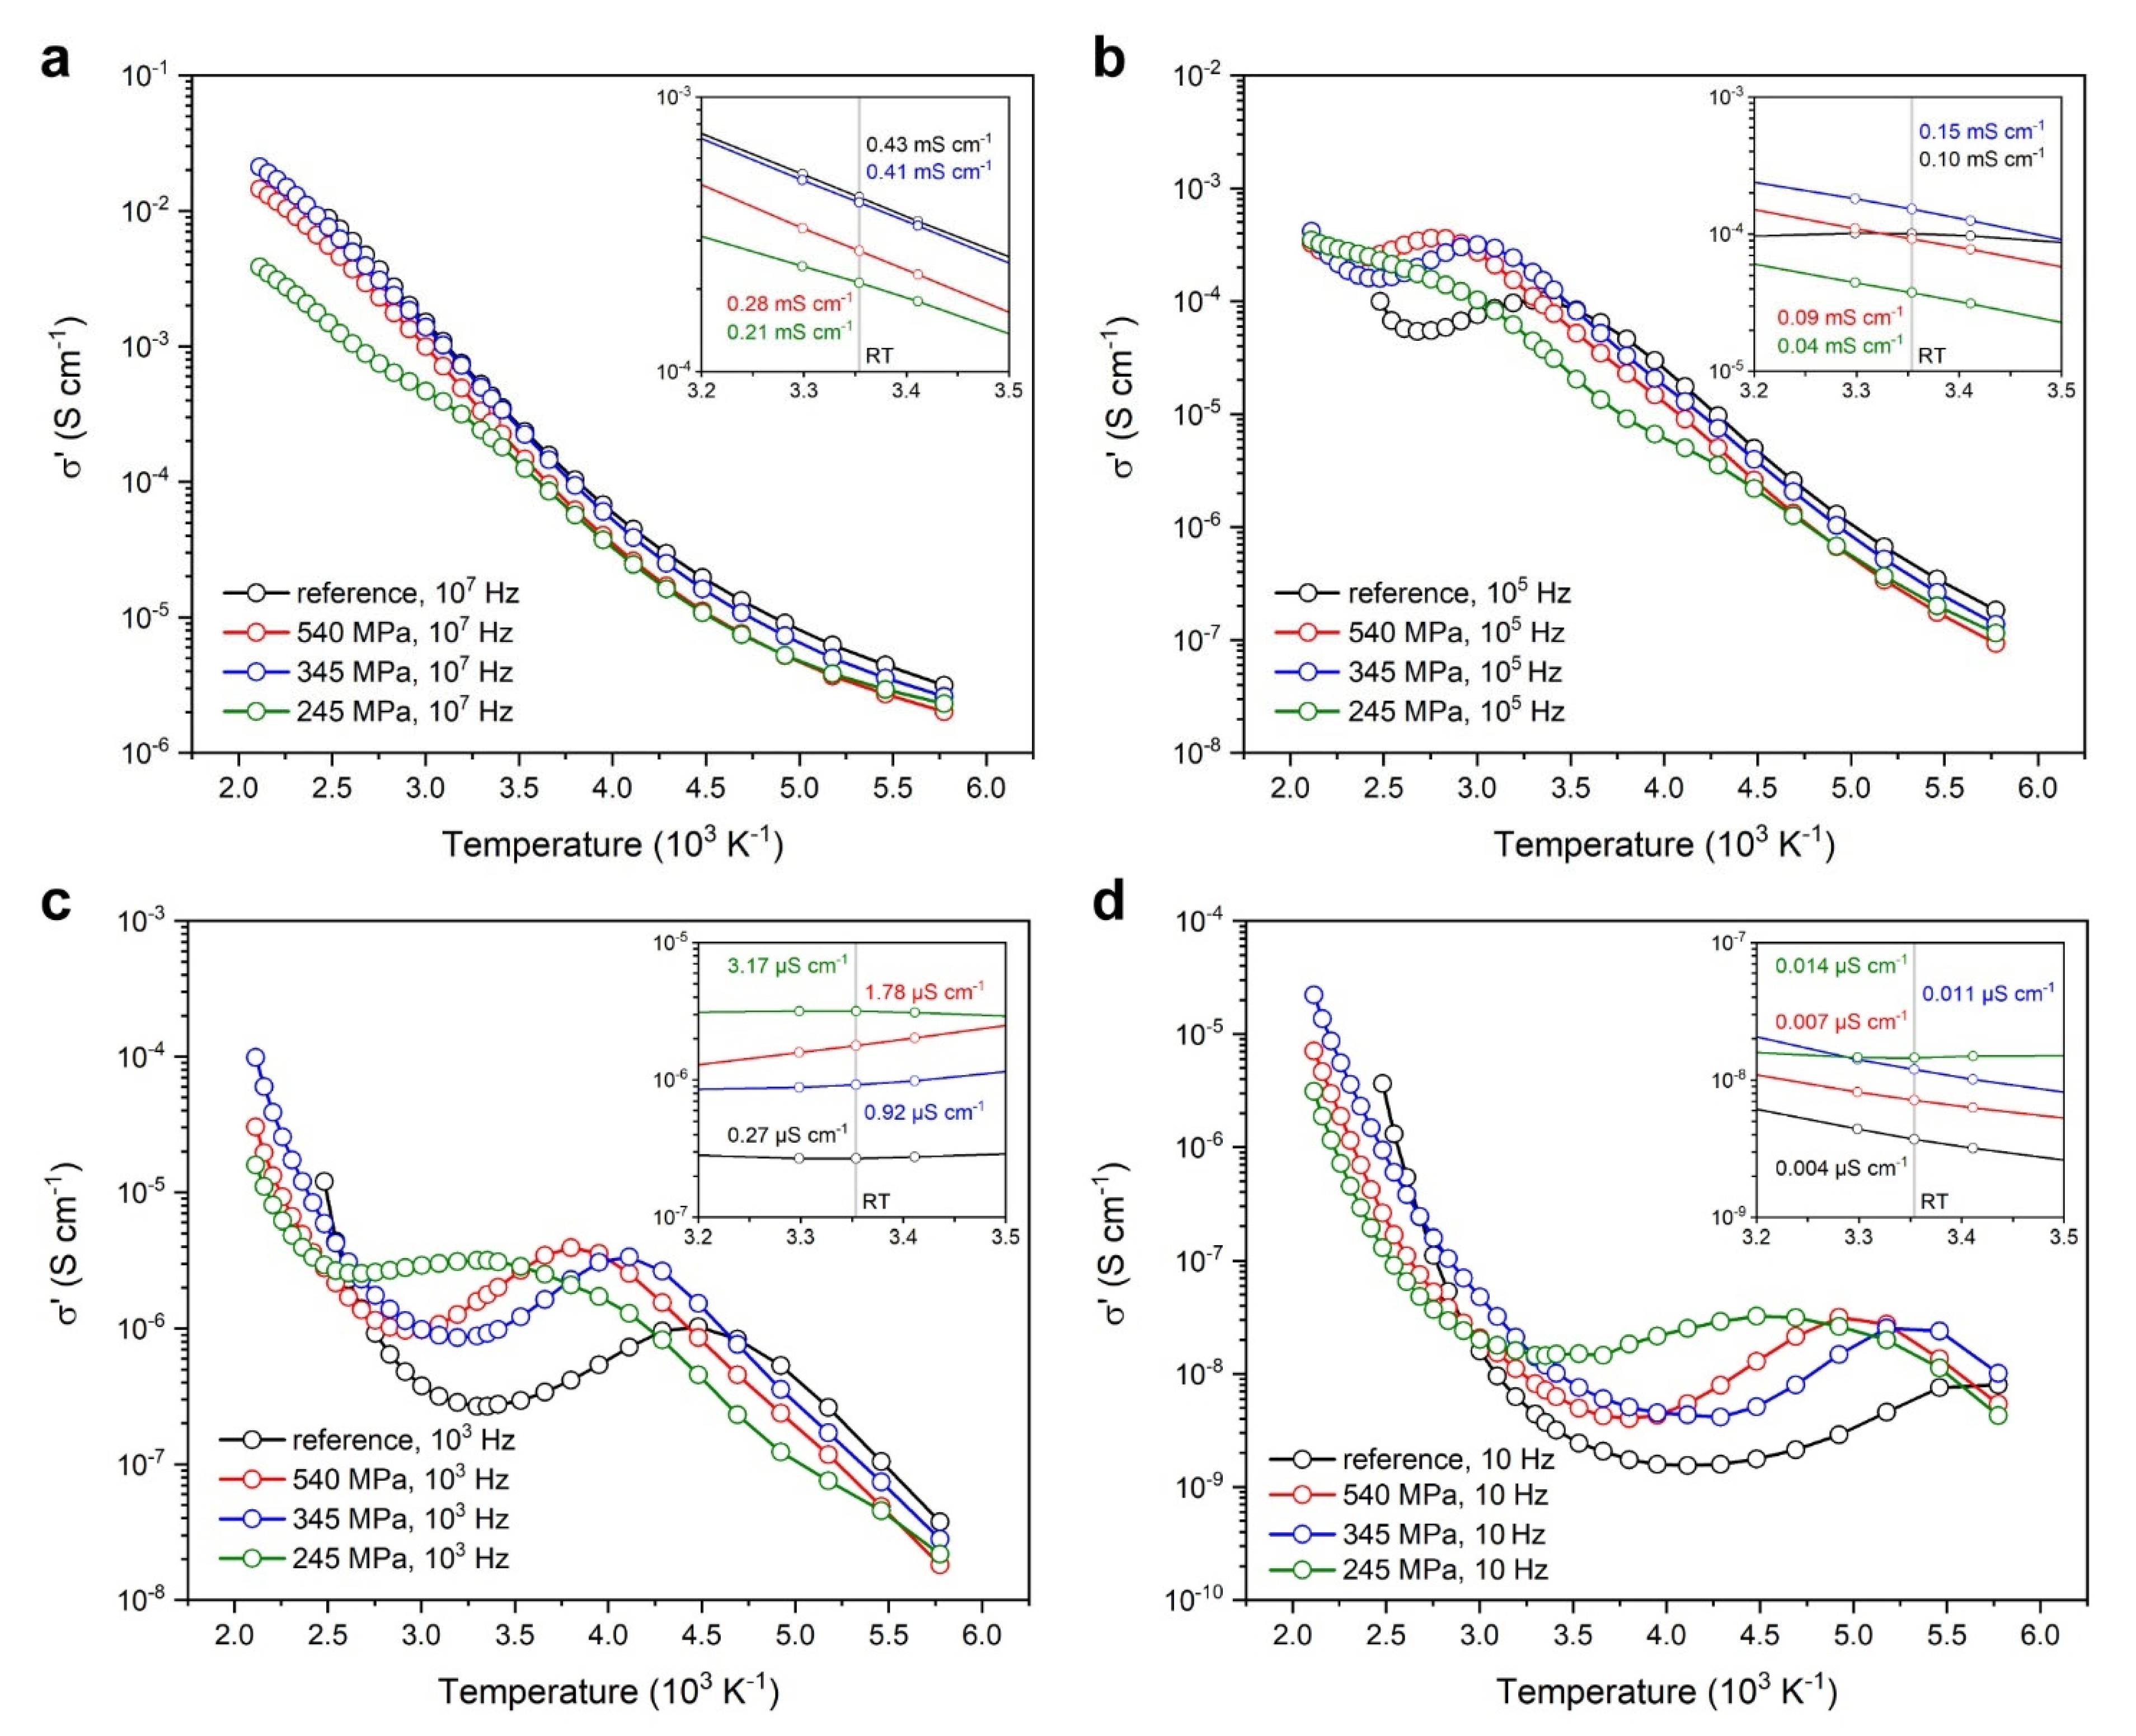
3.2.1. Broadband Ionic Conductivity Measurements

As stated earlier, there exists a considerable body of work reporting on the conductivity of NASICON-type materials based exclusively on impedance analysis decoupled from any form of dielectric relaxation studies—the latter having the potential of offering valuable insight on transport phenomena in solid-state ionic conductors. Seeking to remedy this issue, we chose to forego the typical EIS-based investigative procedure, and shifted instead to coupled dielectric and conductivity measurements over a broadband frequency range (10−1 to 1011 Hz), with temperatures starting from 200 °C and approaching the cryogenic regime at −100 °C. The formalism applied here followed similar procedures encountered in the general dielectric/ionic conductivity literature [67,68,69,70,71,72,73], with the addition of parametric phase-space mapping adapted from dynamical systems theory.
The total conductivity, σ(ω) [S cm−1], comprises the sum of ac and dc conductivities, expressed according to the Jonscher/Almond–West power law [70,71,72,73,74]:
σ ( ω ) = σ a c + σ d c A ω n + σ d c
where σac is the frequency-dependent ac conductivity (reflective of information on the chemical environment within the material and used in the analysis of ionic dynamics) and σdc the temperature-dependent bulk dc electrical conductivity; ω is the angular frequency based on the formula ω = 2 π f [rad s−1], with f [Hz] being the ac frequency; A and n are the semi-empirical temperature-dependent coefficient and frequency exponent of the mobile ions ( 0 n 1 ), respectively [56,67,68,69,70,71,72,73,74]. The frequency exponent n reflects the degree of connectedness of long-range ion-hopping pathways or the extent of tortuosity (a measure of the geometric complexity in porous media) for mobile charges [72].
Conductivity, being a complex phasor ( σ ^ ) comprised of real and imaginary parts, is expressed as:
σ ^ ( ω ) = R ( σ ( ω ) ) + ( σ ( ω ) ) σ ( ω ) i σ ( ω )
In the context of ionic conductivity studies, the metric with a complex value essentially represents a phase lag between the electric field and the ionic current density. Ultimately, primary observations are made by referring to the real part of conductivity [73].
Figure 7 shows the variation of the real and imaginary parts of conductivity, σ′ and σ″, respectively, against frequency over the full temperature range for NASICON pellets assembled over different isostatic pressure levels. The double-logarithmic plot of conductivity over frequency typically displays three regions classified on the basis of frequency: (i) the low-frequency polarization region; (ii) the frequency-independent dc conductivity plateau; and (iii) the high-frequency dispersive region corresponding to ac conductivity. For all samples scanned at RT, a similar behavior was observed: the polarization region extended beyond the low frequency zone by reaching into and over the 104 Hz mark, followed by the dc conductivity plateau and the dispersion zone at the high frequency region. This pattern shifted when moving toward the lower temperatures near the cryogenic regime. At −100 °C, the polarization region became steeper and shorter, establishing firmly at lower frequencies below 1 Hz, then gradually relocating its upper limits toward higher frequencies as the temperature rose to RT levels. The plateau that followed was confined to within an order of magnitude on the frequency range, and shifted toward higher frequencies as the temperature rose. The dispersion zone dominated at low temperatures, also following the higher-frequency shifting trend with rising temperature. At high temperatures this behavior persists, with the polarization region spanning the entire lower frequency range, albeit with a milder slope. The dc plateau contracts toward the middle frequency range (below 104 Hz). The ac dispersion zone dominates the higher frequencies (104 Hz and above), with ionic conductivities at the typical mS cm−1 benchmark for rhombohedral NASICON at temperatures above 160 °C.
Identification of this pattern of plateau shifting toward higher frequencies with rising temperature is critical for the successful application of data fitting by the Jonscher power law. In Figure 8, the compound conductivity evolution over frequency and temperature is visualized more comprehensibly in 2D and 3D phase-space mappings, allowing for the detection of any apparent trends in the ionic dynamics that are not readily apparent in more traditional representations. Phase-space mappings for all NASICON samples revealed a frequency- and temperature-dependent regional shift manifesting as a narrow diagonal ridge preceded by the dc plateau. Juxtaposing the various representation formats allows for demarcating the narrow frequency band where the Jonscher power law is applicable (i.e., by excluding the polarization regions and post-dispersion features), so that fitting parameters can be extracted. In the above graphical representations, displays corresponding to the commercial reference sample have been omitted for economy of space, although all fitting parameters have been extracted for comparison. As a general observation, the NASICON pellet produced by applying 345 MPa of pressure displayed the closest approximation to the reference (e.g., 0.34 mS cm−1 vs. 0.35 mS cm−1 of conductivity at the highest measured frequency of 107 Hz, respectively) within the range of typical values for NASICON at RT [27].
The parameters σdc, A, and n of the Jonscher power law (Equation (1)) were extracted from the frequency series after conversion into the angular frequency format by using the nonlinear Levenberg–Marquardt iteration algorithm. The crossover frequency ωp [rad s−1] marks the transition from dc conductivity to ac dispersion (its inverse provides an assessment of relaxation time), and is also derived from the power law [69,74]:
ω p = ( σ d c / A ) 1 / n
In Figure 9, the results of the fitting procedure are displayed. Bulk dc conductivity, σdc, clearly displays temperature dependence by rising proportionally with temperature for all samples, from 10−9 to 10−8 S cm−1 at −100 °C and reaching the 10−4 to 10−3 S cm−1 scale at 100 °C. The in-lab prepared sample at 345 MPa displayed the closest approximation to the commercial one, with dc conductivity reaching 2.49 mS cm−1 vs. 2.68 mS cm−1, respectively at 100 °C, but diverging by an order of magnitude at the low-temperature zone. This can be attributed to the higher availability of charge carriers becoming thermally excited and overcoming the minimum energy barriers at the higher temperatures [56]. The activation energy Ea associated with ionic transport can be evaluated from the variation of dc conductivity expressed by the empirical Arrhenius equation [75]:
σ = σ 0 exp ( E a / k B T )
where σ0 [S cm−1] is the pre-exponential factor; Ea [eV] is the activation energy for the Na+ ion transfer; kB is the Boltzmann constant (8.617·10−5 eV K−1); and T [K] is the temperature. Activation energies for the commercial reference and the in-lab prepared samples were evaluated at 322 meV (reference), 350 meV (540 MPa), 349 meV (345 MPa), and 330 meV (245 MPa), respectively. The measured conductivities and derived activation energies were within the reported limits for NASICON [27,46,47,48,49,50,51,52,53,54,55].
Finally, overall temperature dependency was monitored by obtaining Poincaré sections from the phase-space mappings at different frequency intervals; these are displayed as Arrhenius plots of the real component σ′ of conductivity against scaled reciprocal temperature in Figure 10. Temperature dependency manifests as linearity in the high-frequency region, which becomes distorted at lower frequencies due to polarization dominance. Overall, conductivity increased with temperature, with low-temperature conduction being associated with bipolar hopping mechanisms and high-temperature conduction being attributed to thermally activated polaron hopping [56].
In review, conductivity measurements can be readily associated with observations established in the material characterization stage of the analysis: zirconia contamination remains a critical factor, limiting ionic conductivity in comparison to the commercial reference throughout the temperature and frequency scanning ranges. This is evident in the contaminated samples prepared at 540 MPa and 245 MPa, implying that applied pressure acts in conjunction with zirconia contamination by influencing its local distribution. This, in turn, affects the degree of connectedness of long-range ion-hopping pathways and the extent of tortuosity, and is reflected in both frequency and temperature-dependent factors of the Jonscher power law by transposing their global inflection points alongside their values. Divergence compared to the reference becomes more pronounced as the crystallite size of zirconia contaminants increases, as porous pathways for ion hopping are blocked by enlarged zirconia partitions and defects. At this point, it is not clear if and how packing order and mechanical stability induced by applied pressure can affect conductivity, but the comparably larger deviation in power law factors displayed by the 245 MPa sample may lend support to this interpretation. Finally, it is noteworthy that the values of power law factors diverge considerably as the temperature dropped near the cryogenic scale, although the deviations in temperature-dependent dc conductivity and activation energies remained relatively stable. This implies that thermally activated polaron hopping acts as the main conduction mechanism, which diminishes considerably in low temperature regimes where bipolar hopping mechanisms instead dominate. The marked difference between the in-lab prepared samples and the commercial reference is again associated with the degree of connectedness of long-range ion-hopping pathways, which is hampered by the extent of zirconia contamination.
The above observations allude to concepts upheld by the Dyre–Schrøder macroscopic model of ac conductivity in disordered solids (in the case of NASICON, defined by the intrusion of zirconia contaminants) [71,76,77]. The model assumes length scales on the order of the correlation length of charge transfer groups, and considers the distribution of disordered percolation pathways that are accessible for charge flow. Thus, long-range macroscopic conduction ensues once a charge percolation threshold is reached. The morphology of a percolation cluster affects the connectivity between nearest neighboring contacts, thus defining the tortuosity of the porous media. Over high frequencies, sub-percolation clusters become ac conductive, as rapid electric field fluctuations limit charge displacement to within the period of field reversal. At lower frequencies, charge transport can extend to longer distances, thus approximating dc flow, giving rise to dc plateaus accordingly. This can account for the diminishing dc plateaus over increasing frequencies and the emergence of the diagonal ridge feature of high ac conductivity observed in the phase-space mappings. The relatively similar activation energies are also accounted for by the fact that ac currents at extreme disorder (in this case induced by excess zirconia contaminants) are carried entirely by the percolating cluster above the threshold; thus, contributions from isolated low activation energy clusters are negligible [77].

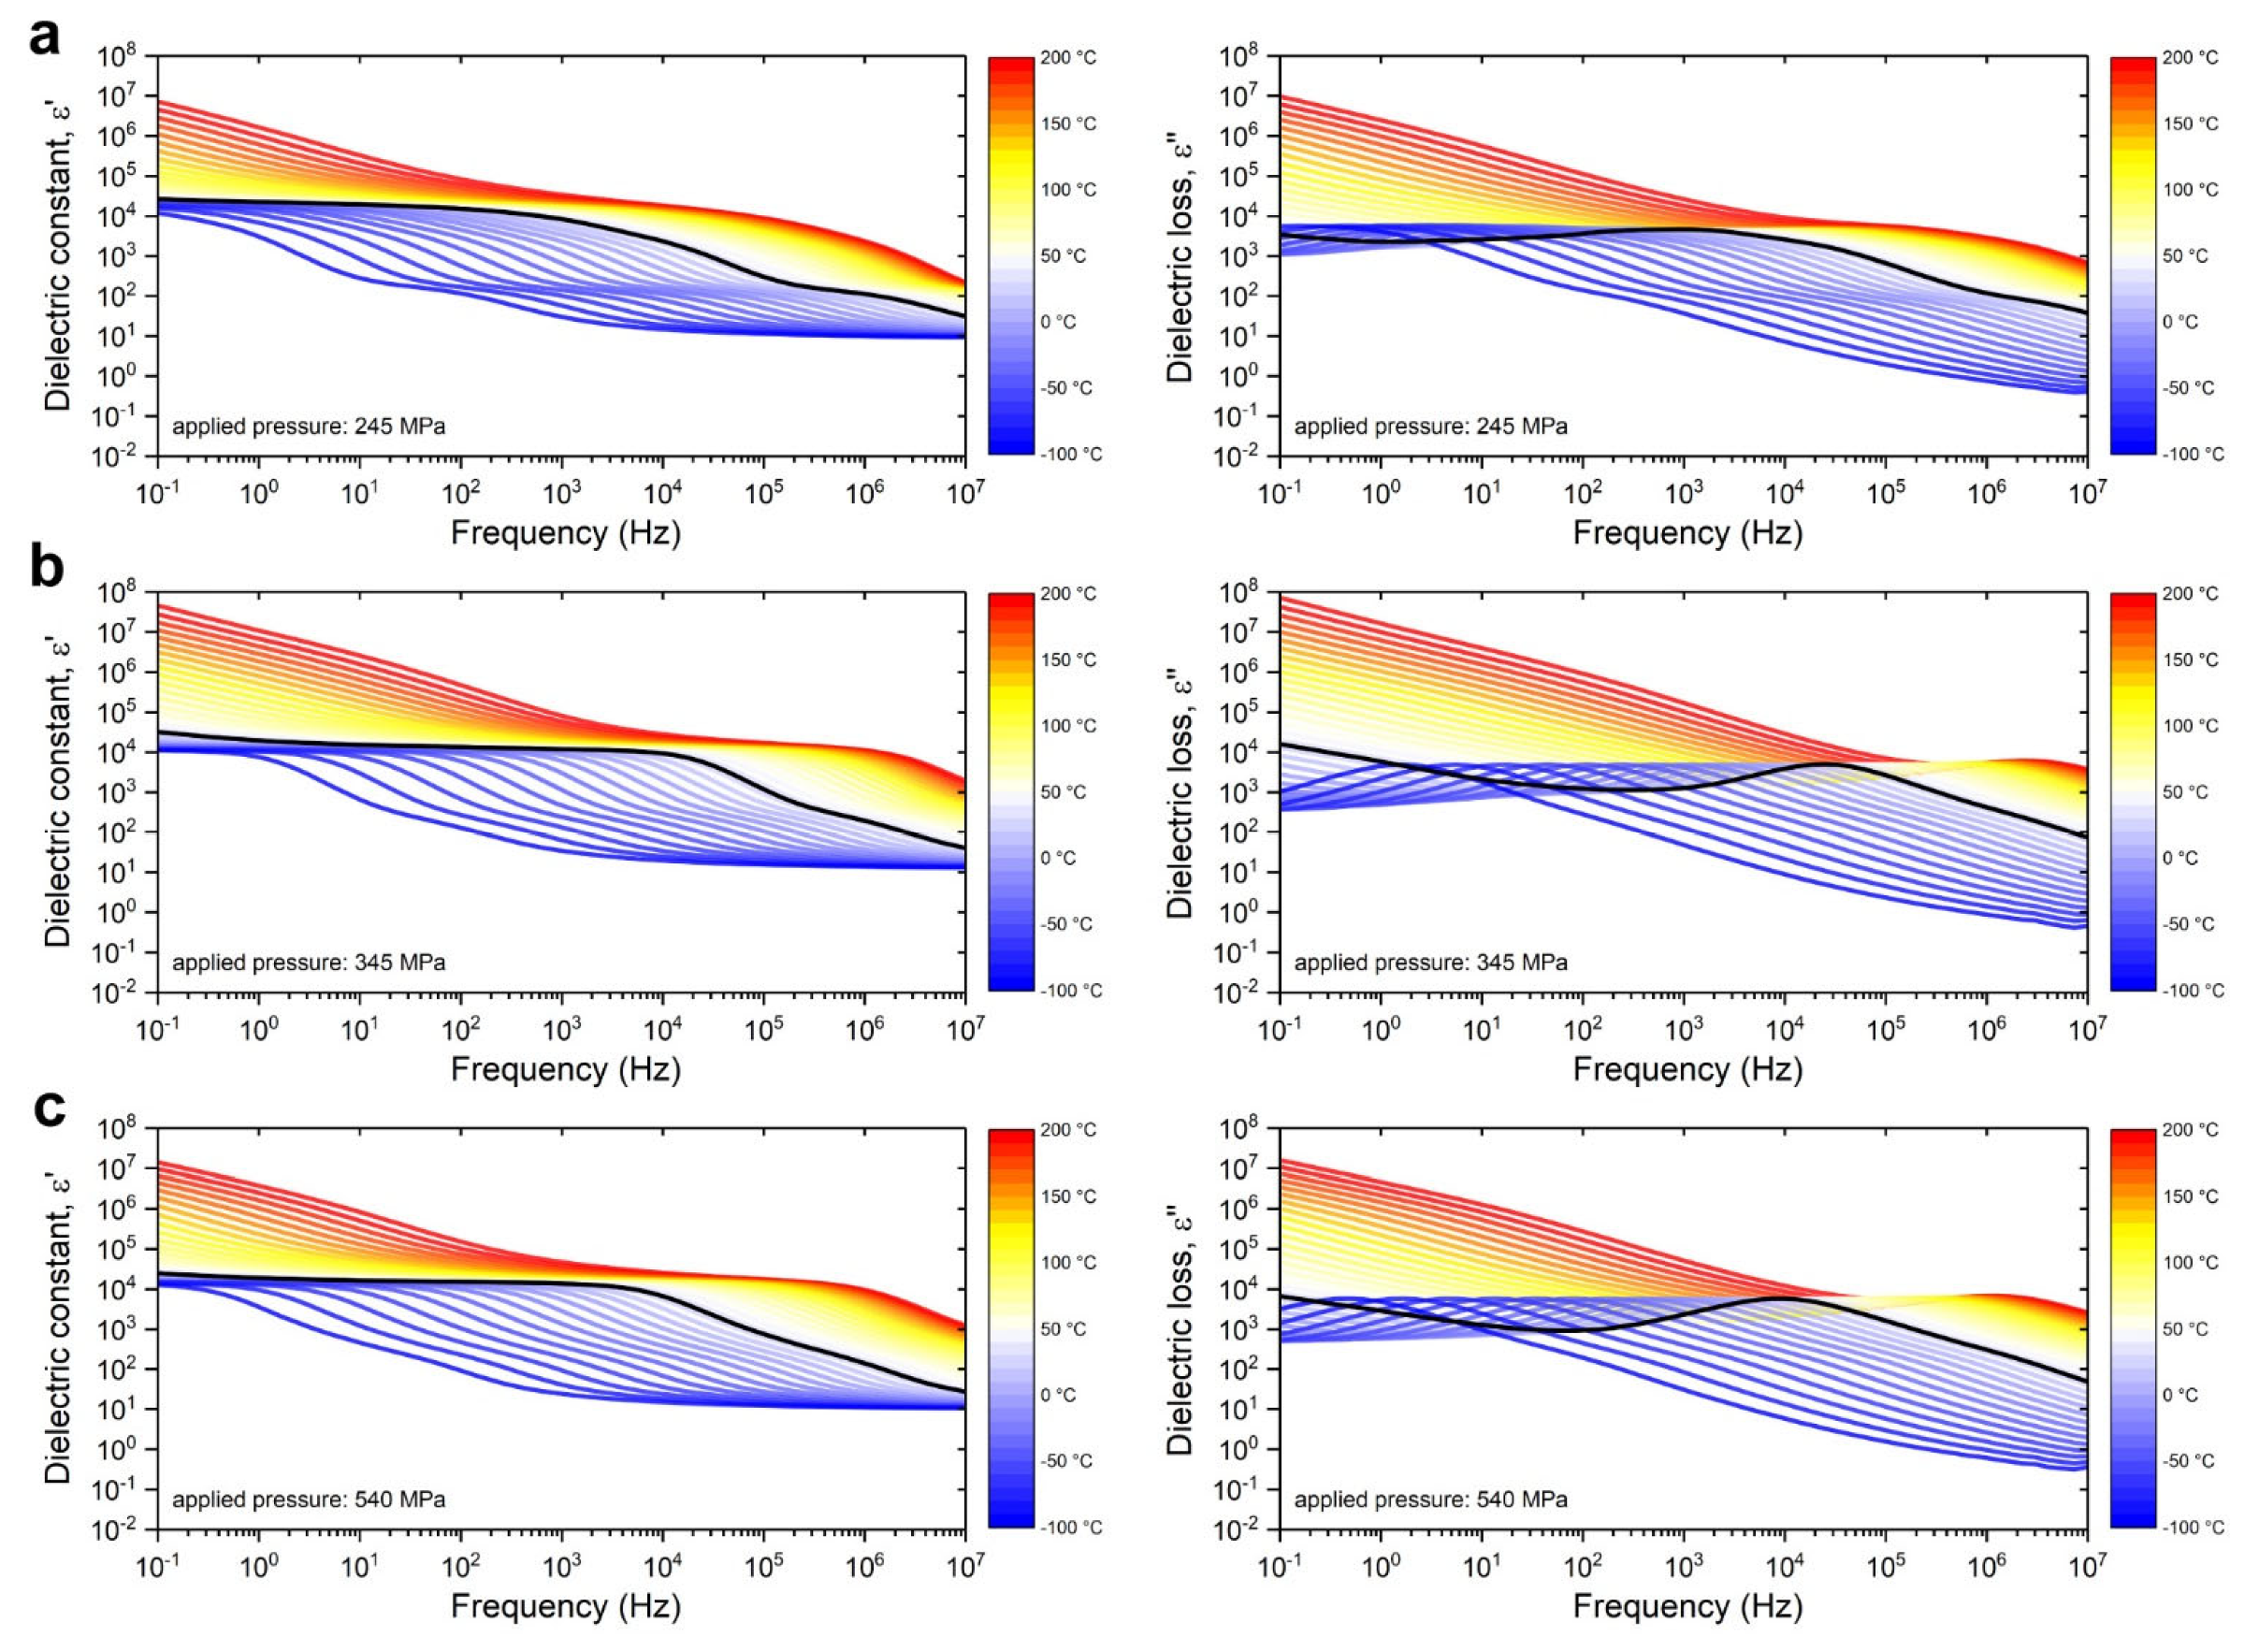
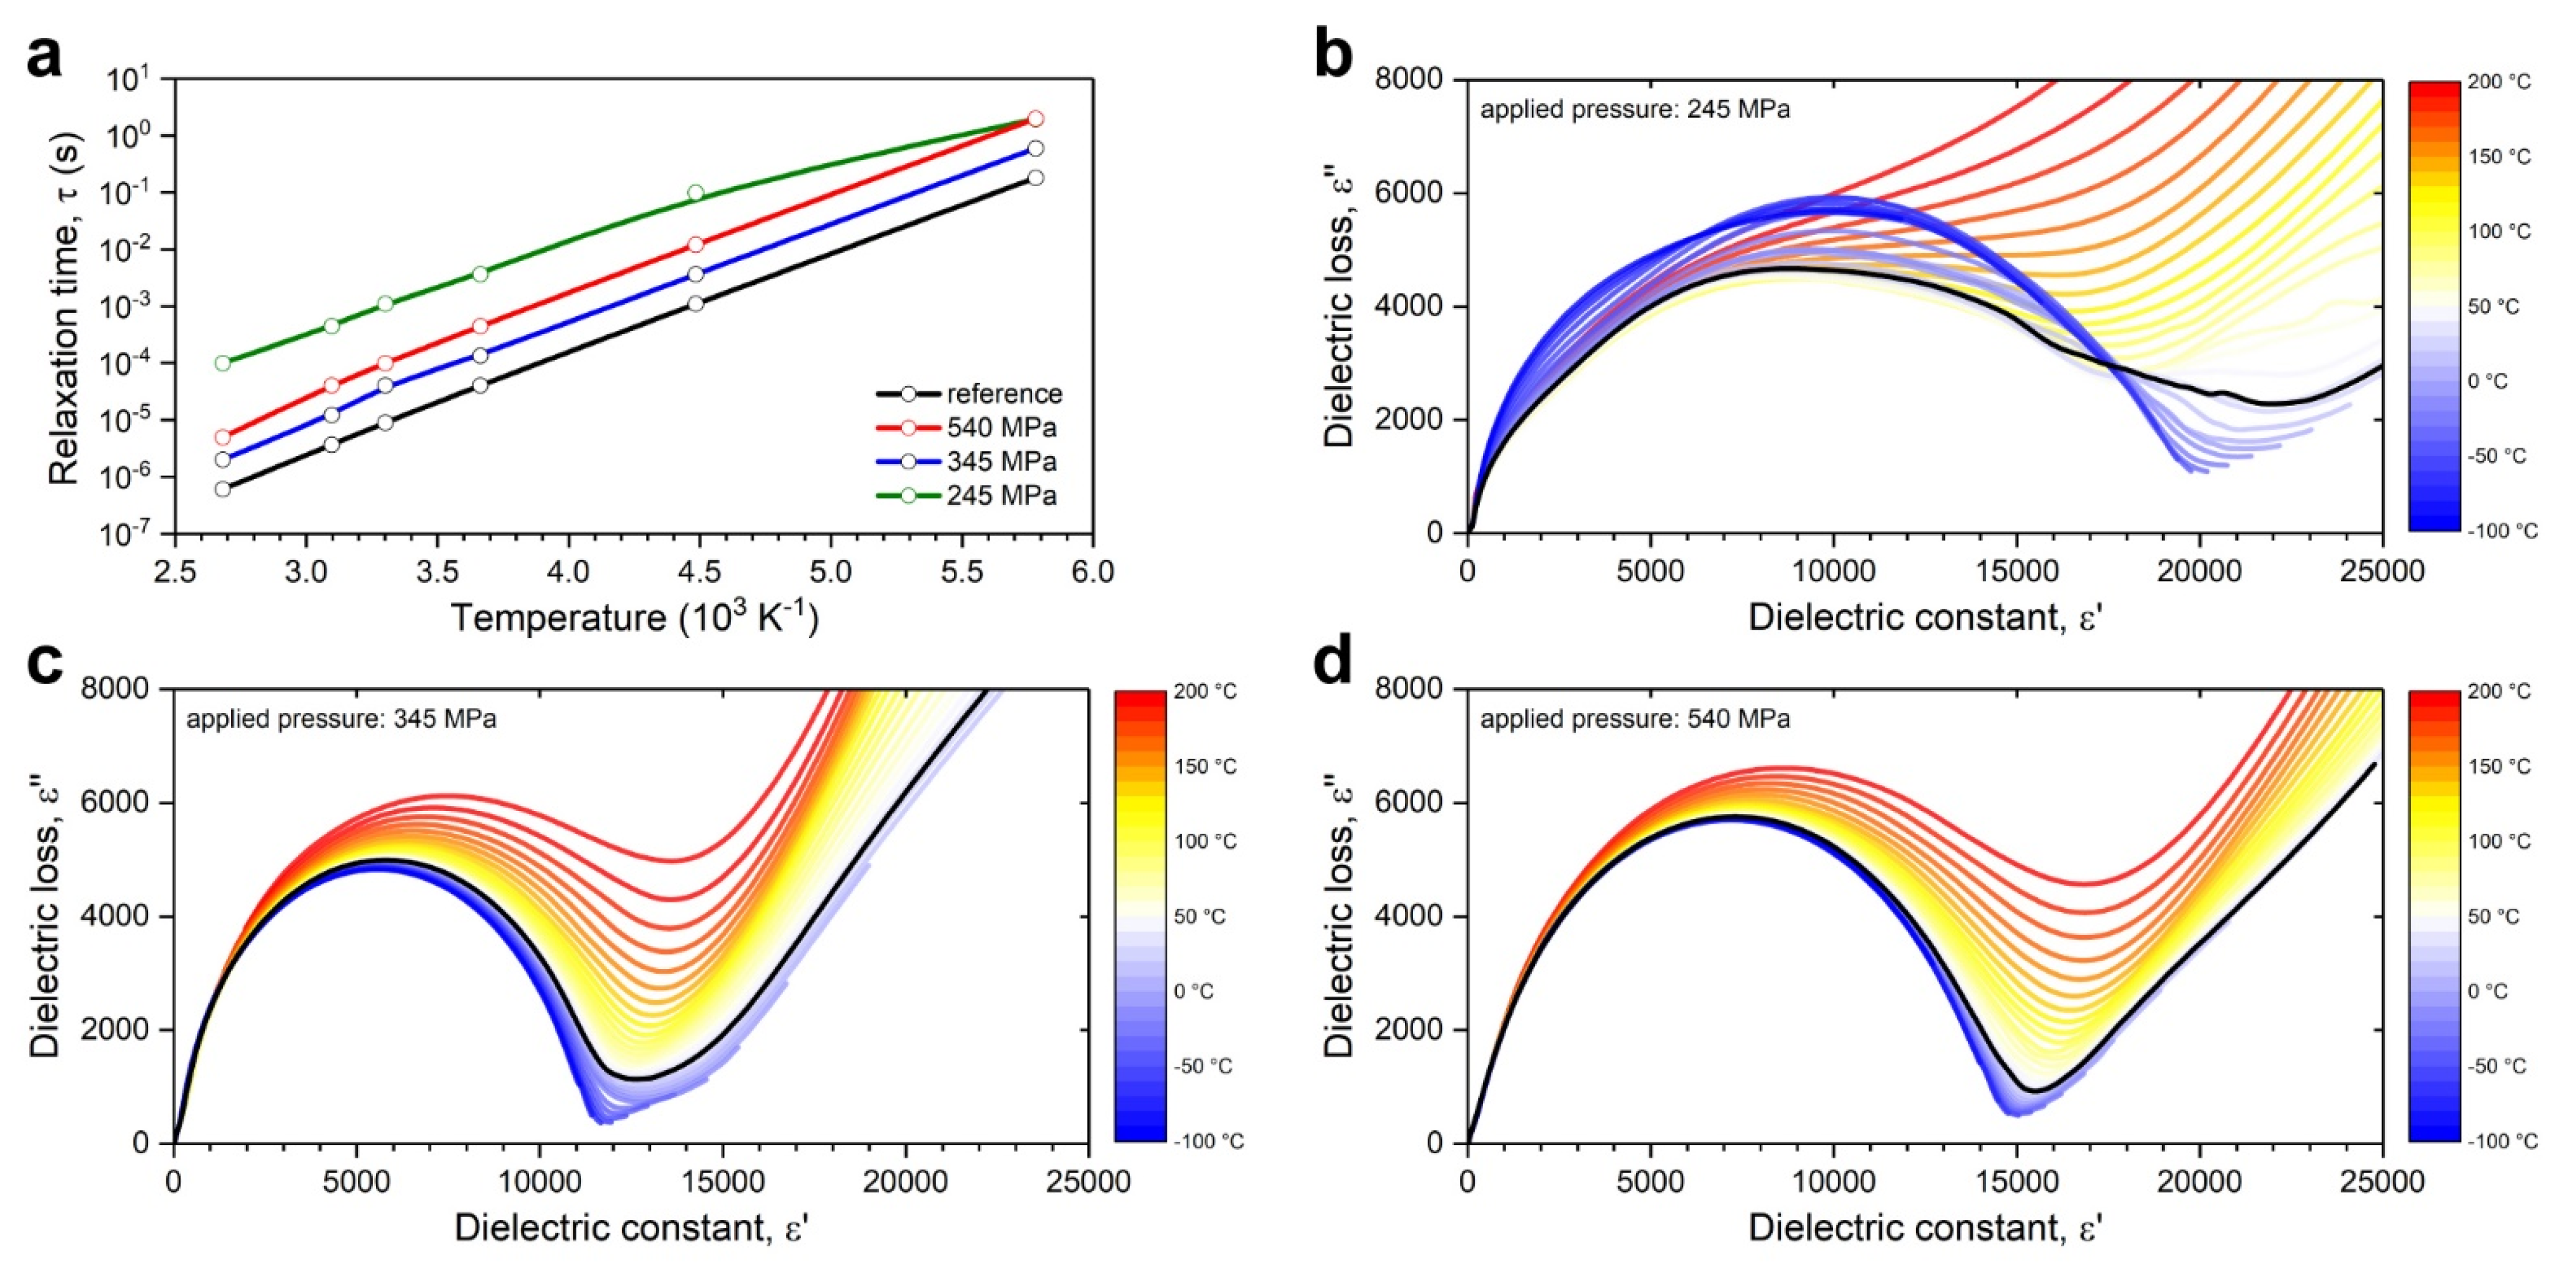
3.2.2. Broadband Dielectric Permittivity Measurements

Following the formalism for conductivity, dielectric permittivity is expressed as a complex phasor ( ε ^ ) comprised of real and imaginary parts:
ε ^ ( ω ) = ( ε ( ω ) ) + ( ε ( ω ) ) ε ( ω ) i ε ( ω ) = | D 0 / E 0 | ( cos δ i sin δ )
where ε′ and ε″ are the dielectric constant and dielectric loss terms, respectively; ω is the angular frequency; D0 and E0 are the amplitudes of the charge displacement and electric fields respectively, and δ is the loss angle, which quantifies the dielectric’s inherent dissipation of electromagnetic energy. The loss tangent (dissipation factor) is then defined by the complex–plane angle between the dissipative and non-dissipative terms:
tan δ = ε / ε
Frequency dependence reflects the material’s causal response to an oscillating electric field, represented by a phase difference; dielectric relaxation is the momentary delay in polarization, analogous to hysteresis in oscillating magnetic fields. Figure 11 shows the variation of the real and imaginary components of permittivity, ε′ and ε″, respectively, against frequency over the full temperature scanning range (from 200 °C to −100 °C) for NASICON pellets assembled over different pressure levels. Initial observations were made for both components regarding the dissipation and relaxation profiles of the material.
The real component of dielectric permittivity, ε′, remained constant at RT throughout the lowest frequencies and up to 10 kHz—this zone of stability was considerably diminished for the 245 MPa sample, which started deteriorating at a much lower frequency of 100 Hz. At higher temperatures, the dielectric constant rose steeply while its stable zone became transposed toward the higher frequencies. At high temperatures and low frequencies, this rise can be attributed to temperature-dependent ionic transport—at high frequencies, thermal vibration instead enhances the loss of dispersion [56]. The reverse holds true for the lower temperature regime, with the dielectric constant receding toward the lower frequencies and diminishing in value, its stable high zone effectively vanishing by −100 °C. The above occur as direct effects of free charge carriers at low frequencies and interfacial polarization at the higher end of the spectrum, where the rapid periodic reversals of the electric field at the interface counteracts and negates the ionic contribution to the dielectric constant [67]. Essentially, over high frequencies, the decrease in orientation polarization and the stabilization of the dielectric constant occurred due to the interruption of long-range ionic migration [70]. This steady-state dielectric constant constitutes the high-frequency permittivity limit and is denoted as ε; its value can be assessed by scans near the cryogenic regime without having to access prohibitively high frequencies (above 107 Hz, which is the limit of the broadband scanner) to negate dipole contributions to polarization.
The imaginary component of permittivity, the dielectric loss ε″, provides information on the dissipative processes within the material under the influence of an applied electric field. In the frequency series of Figure 11, the onset of relaxation peaks was clearly observed over the mid-frequency range (104 to 105 Hz) at RT, the waveform moved toward lower frequencies with decreasing temperature and the reverse for increasing—the amplitude of the relaxation peak remained constant throughout these transposals. This image was unclear for the 245 MPa sample, however, where the relaxation peak had almost vanished, careful observation of the waveform revealed that it had greatly diminished in amplitude, instead spreading out over a much wider FWHM. Aside from that, dielectric loss followed the temperature dependency typical of dielectric materials, increasing in magnitude with rising temperature due to interfacial polarization and thermal vibration losses [56].
By tracking the relaxation peaks on the frequency series, the central relaxation time τ can be determined as the inverse peak frequency (critical frequency) and correlated with temperature (Figure 12a). However, it needs to be noted that the central relaxation time determined from the associated relaxation peaks did not coincide with the inverse of the crossover frequency obtained from the Jonscher power law by nonlinear fitting [69]; this implies that dielectric relaxation does not correspond to a single Debye process [78]. The activation energy of relaxation Ea,R can be evaluated from the slope of relaxation time (in the same manner as activation energy of ionic transport is calculated from dc conductivity), since it follows an exponential relationship based on the formula [69]:
τ = τ 0 exp ( E a , R / k B T )
where τ0 is the pre-exponential factor of relaxation time. Activation energies of relaxation for the commercial reference and the in-lab prepared samples were evaluated at 349 meV (vs. Ea of 322 meV for reference), 354 meV (vs. Ea of 350 meV for 540 MPa), 347 meV (vs. Ea of 349 meV for 345 MPa), and 279 meV (vs. Ea of 330 meV for 245 MPa), respectively. The very close proximity of Ea,R and Ea—with the striking exception of the 245 MPa sample—revealed that Na+ ions within the NASICON lattice have to overcome the same energy barrier for both transport and relaxation. In the case of the 345 MPa and 540 MPa samples, the two processes happen simultaneously—in the commercial reference, without excess zirconia inhibiting ionic transport, relaxation succeeded migration by 27 meV. On the other hand, the 245 MPa sample displayed significant hysteresis between relaxation and ionic transport (~50 meV), with the lower energy barrier for relaxation implying an early dissipation of energy and thus diminishing ionic conductivity.
Furthering the investigation on dissipation processes and polarization, one of the most commonly used phenomenological models, the Cole–Cole model (CCM), was applied to the complex permittivity data [78]:
ε ^ = ε + ε s ε 1 + ( i ω τ ) 1 α
where εs and ε are the low-frequency and the high-frequency permittivity limit values, respectively, and c = 1 α is the CCM exponent ( 0 c 1 ) describing the broadness of distribution of the relaxation time. For c = 1 , the CCM converges to the Debye equation, which assumes a single value of the relaxation time, thus, the CCM can be viewed as a superposition of multiple Debye models [78].
Since the CCM employs the inverse critical frequency (defined as the peak position on the imaginary part of the complex conductivity) to determine relaxation times, the investigation proceeded by constructing Cole–Cole plots of dielectric loss against the dielectric constant for all in-lab prepared samples over the full temperature scanning range from 200 °C to −100 °C. For the 345 MPa and the 540 MPa samples (Figure 12c,d), the semicircle arcs were well-defined and showed symmetric broadening, marking the spread between the low- and high-frequency permittivity limits as in agreement with the frequency series plots. The maxima in the extrapolated arcs were observed at the mid-points, with the presence of linear segments over the low frequency zones implying heterogeneous relaxation processes. In both cases, the arcs diminished mildly until saturation with decreasing temperature, while higher temperatures enhanced dissipation by secondary relaxation processes.
This image was heavily distorted in the case of the 245 MPa sample (Figure 12b), where the semicircle arc did not vary proportionally with temperature. Instead, the primary relaxation process appeared unstable, with its arc maximizing over the low temperature regime, becoming evidently replaced by thermally induced processes that migrate from the lower frequencies to dominate over the higher temperatures. This implies that the 245 MPa sample suffered from inhomogeneity issues (i.e., zirconia phases forming distinct zones that interfere with the NASICON lattice structure), or even mechanical instability issues arising from insufficient applied pressure and the ensuing loose packing order.
In Figure 13, the evolution of the loss tangent tanδ over frequency and temperature is visualized more comprehensibly in high-resolution 2D and 3D phase-space mappings. The primary zone of relaxation coincides with the frequency-dependent dispersion region identified as the narrow diagonal ridge in conductivity phase-space mappings (Figure 8). Likewise, the relaxation zone was transposed toward higher temperatures as frequency increased; dual dependency on both temperature and frequency revealed both thermal and polarization sources of energy dissipation in the NASICON system. The relative width of the relaxation zone appeared diminished for the 245 MPa sample, confining its dissipation over a narrower range of frequencies and temperatures. Relaxation zones for the 345 MPa and 540 MPa samples instead extended over significantly wider zones. Another observation that was not readily made apparent in the conductivity phase-space mappings concerns the presence of a secondary relaxation zone beginning at high temperatures (above 150 °C) and propagating diagonally over increasing frequencies. The initiatory temperature of this zone coincides with the transition temperature of monoclinic-to-rhombohedral lattice structure for NASICON, suggesting dual relaxation processes at elevated temperatures.

4. Conclusions

A series of experiments were designed to investigate the classic Na3Zr2Si2PO12 system based on the solid-state reaction (SSR) synthesis protocol (i.e., without considerations for optimizing electrical properties by controlling either the elemental composition or the grain boundaries in the crystalline lattice). Thus, sintering temperatures were maintained at the highest level of 1250 °C, which does not suppress excess zirconia contamination, and the evolution of the zirconia phase was carefully monitored. The main parameter that was evaluated was the applied isostatic pressure for converting the calcinated NASICON powders into pellet form, right before the final sintering stage. Conductivity and dielectric permittivity measurements were conducted over broadband frequency and temperature scales, reaching near the cryogenic regime at −100 °C. The overall analysis, enhanced by parametric 2D and 3D phase-space mappings, arrived at the following conclusions:
  • Precursor particle size (nano- vs. micron-sized particles) is not necessarily of critical importance, provided that ball-milling has been performed rigorously to arrive at monomodal but polydisperse distributions of NASICON precursors;
  • Excess zirconia contamination can be modestly controlled, but not fully suppressed due to the high sintering temperature, by applying selected isostatic pressure levels during pellet formation in order to minimize the zirconia crystallite size; excessive pressure levels (>345 MPa) reverse this trend by dispersing zirconia particles over a wider phase distribution, although a higher packing order of the material is induced;
  • Low pressure levels (<345 MPa) may cause inhomogeneity and mechanical stability issues due to zirconia accretion and poor packing order, reflecting negatively on the ionic conductivity of the system;
  • Low pressure levels may also result in significant hysteresis between relaxation and ionic transport activation energies, with a lower energy barrier for relaxation causing early dissipation of energy and thus diminishing ionic conductivity;
  • The high-frequency permittivity limit ε may be assessed by dielectric permittivity scans near the cryogenic regime without having to access high frequencies to negate dipole contributions to polarization;
  • Phase-space mappings have identified a correlated high ionic conductivity band with its corresponding relaxation band in the dissipation factor spectra, both propagating diagonally in tandem frequency and temperature dependency; and
  • Phase-space mappings of the dissipation factor revealed a secondary relaxation band that can be associated with the monoclinic-to-rhombohedral lattice transition.
Future research will focus on investigating the optimized parameters for the main SSR synthesis in order to fully suppress zirconia contamination, and on extending the broadband scanning range to the cryogenic threshold at −160 °C.

Author Contributions

Conceptualization, A.T. and A.M.; Methodology, M.I. and A.M.; Software, A.T.; Validation, A.T. and M.I.; Formal analysis, A.T.; Investigation, A.T., M.I. and A.M.; Resources, A.M.; Data curation, A.T. and M.I.; Writing—original draft preparation, A.T.; Writing—review and editing, A.T.; Visualization, A.T.; Supervision, A.M.; Project administration, A.M.; Funding acquisition, A.T. and A.M. All authors have read and agreed to the published version of the manuscript.

Funding

This research was funded by the Ministry of Research, Innovation, and Digitization of Romania through the National Plan of Research and Development, Project PN 19-11-02-01; and by the Romanian Executive Agency for Higher Education, Research, Development & Innovation Funding (UEFISCDI), Project PN-III-P2-2.1-PED-2019-1894, contract No. 460PED/2020.

Institutional Review Board Statement

Not applicable.

Informed Consent Statement

Not applicable.

Data Availability Statement

The data presented in this study are available on request from the corresponding authors. The data are not publicly available due to institutional policies.

Conflicts of Interest

The authors declare no conflict of interest.

References

  1. Anantharamulu, N.; Rao, K.K.; Rambabu, G.; Kumar, B.V.; Radha, V.; Vithal, M. A wide-ranging review on Nasicon type materials. J. Mater. Sci. 2011, 46, 2821–2837. [Google Scholar] [CrossRef]
  2. Whittingham, M.S.; Huggins, R.A. Measurement of sodium ion transport in beta alumina using reversible solid electrodes. J. Chem. Phys. 1971, 54, 414–416. [Google Scholar] [CrossRef]
  3. Goodenough, J.B.; Hong, H.P.; Kafalas, J.A. Fast Na+-ion transport in skeleton structures. Mater. Res. Bull. 1976, 11, 203–220. [Google Scholar] [CrossRef]
  4. Hong, H.P. Crystal structures and crystal chemistry in the system Na1+xZr2SixP3−xO12. Mater. Res. Bull. 1976, 11, 173–182. [Google Scholar] [CrossRef]
  5. Gordon, R.S.; Miller, G.R.; McEntire, B.J.; Beck, E.D.; Rasmussen, J.R. Fabrication and characterization of Nasicon electrolytes. Solid State Ion. 1981, 3, 243–248. [Google Scholar] [CrossRef]
  6. Kohler, H.; Schulz, H. Single crystal investigations on NASICON Na/1 + z/Zr/2− y/Si/x/P/3− x/0/12/; 0 ≤ y ≤ 3/4, 0 ≤ z ≤ 0 comparison of the compounds x = 1.24 and x = 3. Solid State Ion. 1983, 9, 795–798. [Google Scholar] [CrossRef]
  7. Kohler, H.; Schulz, H.; Melnikov, O. Composition and conduction mechanism of the NASICON structure X-ray diffraction study on two crystals at different temperatures. Mater. Res. Bull. 1983, 18, 1143–1152. [Google Scholar] [CrossRef]
  8. Nicholas, V.A.; Johnson, P.J.; Kingon, A.I. Conductivity measurements in the Nasicon system. Solid State Ion. 1985, 17, 351–357. [Google Scholar] [CrossRef]
  9. Kohler, H.; Schulz, H. NASICON solid electrolytes: Part I—The Na+-diffusion path and its relation to the structure. Mater. Res. Bull. 1985, 20, 1461–1471. [Google Scholar] [CrossRef]
  10. Kohler, H.; Schulz, H. NASICON solid electrolytes: Part II—X-ray diffraction experiments on sodium-zirconium-phosphate single crystals at 295K and at 993K. Mater. Res. Bull. 1986, 21, 23–31. [Google Scholar] [CrossRef]
  11. Kreuer, K.D.; Kohler, H.; Warhus, U.; Schulz, H. NASICON solid electrolytes: Part III—Sodium conductivity enhancement along domain and grain boundaries. Mater. Res. Bull. 1986, 21, 149–159. [Google Scholar] [CrossRef]
  12. Kreuer, K.D.; Warhus, U. NASICON solid electrolytes: Part IV—Chemical durability. Mater. Res. Bull. 1986, 21, 357–363. [Google Scholar] [CrossRef]
  13. Didisheim, J.J.; Prince, E.; Wuensch, B.J. Neutron Rietveld analysis of structural changes in NASICON solid solutions Na1+xZr2SixP3−xO12 at elevated temperatures: X = 1.6 and 2.0 at 320 °C. Solid State Ion. 1986, 18, 944–958. [Google Scholar] [CrossRef]
  14. Rudolf, P.; Jorgensen, J.; Clearfield, A. A time-of-flight neutron powder Rietveld refinement study at elevated temperature on a monoclinic near-stoichiometric NASICON. J. Solid State Chem. 1988, 72, 100–112. [Google Scholar] [CrossRef]
  15. Lightfoot, P.; Woodcock, D.A.; Jorgensen, J.D.; Short, S. Low thermal expansion materials: A comparison of the structural behaviour of La0.33Ti2(PO4)3, Sr0.5Ti2(PO4)3 and NaTi2(PO4)3. Int. J. Inorg. Mater. 1999, 1, 53–60. [Google Scholar] [CrossRef]
  16. Saito, Y.; Maruyama, T. Recent developments of the sensors for carbon oxides using solid electrolytes. Solid State Ion. 1988, 28, 1644–1647. [Google Scholar] [CrossRef]
  17. Yao, S.; Shimizu, Y.; Miura, N.; Yamazoe, N. Solid electrolyte CO2 sensor using binary carbonate electrode. Chem. Lett. 1990, 19, 2033–2036. [Google Scholar] [CrossRef]
  18. Scheetz, B.E.; Agrawal, D.K.; Breval, E.; Roy, R. Sodium zirconium phosphate (NZP) as a host structure for nuclear waste immobilization: A review. Waste Manag. 1994, 14, 489–505. [Google Scholar] [CrossRef]
  19. Balagopal, S.; Landro, T.; Zecevic, S.; Sutija, D.; Elangovan, S.; Khandkar, A. Selective sodium removal from aqueous waste streams with NASICON ceramics. Sep. Purif. Technol. 1999, 15, 231–237. [Google Scholar] [CrossRef]
  20. Bragard, M.; Soltau, N.; Thomas, S.; De Doncker, R.W. The balance of renewable sources and user demands in grids: Power electronics for modular battery energy storage systems. IEEE Trans. Power Electron. 2010, 25, 3049–3056. [Google Scholar] [CrossRef]
  21. Dunn, B.; Kamath, H.; Tarascon, J.M. Electrical energy storage for the grid: A battery of choices. Science 2011, 334, 928–935. [Google Scholar] [CrossRef] [Green Version]
  22. Castillo, A.; Gayme, D.F. Grid-scale energy storage applications in renewable energy integration: A survey. Energy Convers. Manag. 2014, 87, 885–894. [Google Scholar] [CrossRef]
  23. Hueso, K.B.; Armand, M.; Rojo, T. High temperature sodium batteries: Status, challenges and future trends. Energy Env. Sci. 2013, 6, 734–749. [Google Scholar] [CrossRef]
  24. Noguchi, Y.; Kobayashi, E.; Plashnitsa, L.S.; Okada, S.; Yamaki, J.I. Fabrication and performances of all solid-state symmetric sodium battery based on NASICON-related compounds. Electrochim. Acta 2013, 101, 59–65. [Google Scholar] [CrossRef]
  25. Lalère, F.; Leriche, J.B.; Courty, M.; Boulineau, S.; Viallet, V.; Masquelier, C.; Seznec, V. An all-solid state NASICON sodium battery operating at 200 °C. J. Power Sources 2014, 247, 975–980. [Google Scholar] [CrossRef]
  26. Crabtree, G.; Kocs, E.; Trahey, L. The energy-storage frontier: Lithium-ion batteries and beyond. MRS Bull. 2015, 40, 1067–1078. [Google Scholar] [CrossRef] [Green Version]
  27. Guin, M.; Tietz, F. Survey of the transport properties of sodium superionic conductor materials for use in sodium batteries. J. Power Sources 2015, 273, 1056–1064. [Google Scholar] [CrossRef]
  28. Guin, M.; Tietz, F.; Guillon, O. New promising NASICON material as solid electrolyte for sodium-ion batteries: Correlation between composition, crystal structure and ionic conductivity of Na3+xSc2SixP3-xO12. Solid State Ion. 2016, 293, 18–26. [Google Scholar] [CrossRef]
  29. Zhao, C.; Liu, L.; Qi, X.; Lu, Y.; Wu, F.; Zhao, J.; Yu, Y.; Hu, Y.S.; Chen, L. Solid-state sodium batteries. Adv. Energy Mater. 2018, 8, 1703012. [Google Scholar] [CrossRef]
  30. Ruan, Y.; Guo, F.; Liu, J.; Song, S.; Jiang, N.; Cheng, B. Optimization of Na3Zr2Si2PO12 ceramic electrolyte and interface for high performance solid-state sodium battery. Ceram. Int. 2019, 45, 1770–1776. [Google Scholar] [CrossRef]
  31. Wang, Y.; Song, S.; Xu, C.; Hu, N.; Molenda, J.; Lu, L. Development of solid-state electrolytes for sodium-ion battery–A short review. Nano Mater. Sci. 2019, 1, 91–100. [Google Scholar] [CrossRef]
  32. Kim, J.K.; Lee, E.; Kim, H.; Johnson, C.; Cho, J.; Kim, Y. Rechargeable seawater battery and its electrochemical mechanism. ChemElectroChem 2015, 2, 328–332. [Google Scholar] [CrossRef] [Green Version]
  33. Kim, Y.; Kim, H.; Park, S.; Seo, I.; Kim, Y. Na ion-conducting ceramic as solid electrolyte for rechargeable seawater batteries. Electrochim. Acta 2016, 191, 1–7. [Google Scholar] [CrossRef]
  34. Bae, H.; Park, J.S.; Senthilkumar, S.T.; Hwang, S.M.; Kim, Y. Hybrid seawater desalination-carbon capture using modified seawater battery system. J. Power Sources 2019, 410, 99–105. [Google Scholar] [CrossRef]
  35. Hwang, S.M.; Park, J.S.; Kim, Y.; Go, W.; Han, J.; Kim, Y.; Kim, Y. Rechargeable seawater batteries—From concept to applications. Adv. Mater. 2019, 31, 1804936. [Google Scholar] [CrossRef]
  36. Lee, C. Understanding Structural Degradation of NASICON Solid Electrolyte for Stable Seawater Batteries. Master’s Thesis, Department of Energy Engineering, Ulsan National Institute of Science and Technology (UNIST), Ulsan, Korea, 2019. [Google Scholar]
  37. Bohnke, O.; Ronchetti, S.; Mazza, D. Conductivity measurements on nasicon and nasicon-modified materials. Solid State Ion. 1999, 122, 127–136. [Google Scholar] [CrossRef]
  38. Fuentes, R.O.; Figueiredo, F.M.; Marques, F.M.B.; Franco, J.I. Influence of microstructure on the electrical properties of NASICON materials. Solid State Ion. 2001, 140, 179. [Google Scholar] [CrossRef]
  39. Fergus, J.W. Ion transport in sodium ion conducting solid electrolytes. Solid State Ion. 2012, 227, 102–112. [Google Scholar] [CrossRef]
  40. Ignaszak, A.; Pasierb, P.; Gajerski, R.; Komornicki, S. Synthesis and properties of Nasicon-type materials. Thermochim. Acta 2005, 426, 7–14. [Google Scholar] [CrossRef]
  41. Naqash, S.; Ma, Q.; Tietz, F.; Guillon, O. Na3Zr2(SiO4)2(PO4) prepared by a solution-assisted solid state reaction. Solid State Ion. 2017, 302, 83–91. [Google Scholar] [CrossRef]
  42. Ejehi, F.; Marashi, S.P.H.; Ghaani, M.R.; Haghshenas, D.F. The synthesis of NASICON-type ZrNb(PO4)3 structure by the use of Pechini method. Ceram. Int. 2012, 38, 6857–6863. [Google Scholar] [CrossRef]
  43. Novikova, S.A.; Larkovich, R.V.; Chekannikov, A.A.; Kulova, T.L.; Skundin, A.M.; Yaroslavtsev, A.B. Electrical conductivity and electrochemical characteristics of Na3V2(PO4)3-based NASICON-type materials. Inorg. Mater. 2018, 54, 794–804. [Google Scholar] [CrossRef]
  44. Meunier, M.; Izquierdo, R.; Hasnaoui, L.; Quenneville, E.; Ivanov, D.; Girard, F.; Morin, F.; Yelon, A.; Paleologou, M. Pulsed laser deposition of superionic ceramic thin films: Deposition and applications in electrochemistry. Appl. Surf. Sci. 1998, 127, 466–470. [Google Scholar] [CrossRef]
  45. Pérez-Estébanez, M.; Isasi-Marín, J.; Rivera-Calzada, A.; León, C.; Nygren, M. Spark plasma versus conventional sintering in the electrical properties of Nasicon-type materials. J. Alloy. Compd. 2015, 651, 636–642. [Google Scholar] [CrossRef]
  46. Bell, N.S.; Edney, C.; Wheeler, J.S.; Ingersoll, D.; Spoerke, E.D. The influences of excess sodium on low-temperature NASICON synthesis. J. Am. Ceram. Soc. 2014, 97, 3744–3748. [Google Scholar] [CrossRef]
  47. Park, H.; Jung, K.; Nezafati, M.; Kim, C.S.; Kang, B. Sodium ion diffusion in NASICON (Na3Zr2Si2PO12) solid electrolytes: Effects of excess sodium. ACS Appl. Mater. Interfaces 2016, 8, 27814–27824. [Google Scholar] [CrossRef]
  48. Park, H.; Kang, M.; Park, Y.C.; Jung, K.; Kang, B. Improving ionic conductivity of Nasicon (Na3Zr2Si2PO12) at intermediate temperatures by modifying phase transition behavior. J. Power Sources 2018, 399, 329–336. [Google Scholar] [CrossRef]
  49. Naqash, S.; Tietz, F.; Yazhenskikh, E.; Müller, M.; Guillon, O. Impact of sodium excess on electrical conductivity of Na3Zr2Si2PO12 + xNa2O ceramics. Solid State Ion. 2019, 336, 57–66. [Google Scholar] [CrossRef]
  50. Narayanan, S.; Reid, S.; Butler, S.; Thangadurai, V. Sintering temperature, excess sodium, and phosphorous dependencies on morphology and ionic conductivity of NASICON Na3Zr2Si2PO12. Solid State Ion. 2019, 331, 22–29. [Google Scholar] [CrossRef]
  51. Samiee, M.; Radhakrishnan, B.; Rice, Z.; Deng, Z.; Meng, Y.S.; Ong, S.P.; Luo, J. Divalent-doped Na3Zr2Si2PO12 natrium superionic conductor: Improving the ionic conductivity via simultaneously optimizing the phase and chemistry of the primary and secondary phases. J. Power Sources 2017, 347, 229–237. [Google Scholar] [CrossRef] [Green Version]
  52. Suzuki, K.; Noi, K.; Hayashi, A.; Tatsumisago, M. Low temperature sintering of Na1+xZr2SixP3−xO12 by the addition of Na3BO3. Scr. Mater. 2018, 145, 67–70. [Google Scholar] [CrossRef]
  53. Oh, J.A.S.; He, L.; Plewa, A.; Morita, M.; Zhao, Y.; Sakamoto, T.; Song, X.; Zhai, W.; Zeng, K.; Lu, L. Composite NASICON (Na3Zr2Si2PO12) solid-state electrolyte with enhanced Na+ ionic conductivity: Effect of liquid phase sintering. ACS Appl. Mater. Interfaces 2019, 11, 40125–40133. [Google Scholar] [CrossRef] [PubMed]
  54. Jalalian-Khakshour, A.; Phillips, C.O.; Jackson, L.; Dunlop, T.O.; Margadonna, S.; Deganello, D. Solid-state synthesis of NASICON (Na3Zr2Si2PO12) using nanoparticle precursors for optimisation of ionic conductivity. J. Mater. Sci. 2020, 55, 2291–2302. [Google Scholar] [CrossRef] [Green Version]
  55. Lee, S.M.; Lee, S.T.; Lee, D.H.; Lee, S.H.; Han, S.S.; Lim, S.K. Effect of particle size on the density and ionic conductivity of Na3Zr2Si2PO12 NASICON. J. Ceram. Process. Res. 2015, 16, 49–53. [Google Scholar]
  56. Zangina, T.; Hassan, J.; Matori, K.A.; Ahmadu, U.; See, A. Sintering behavior, ac conductivity and dielectric relaxation of Li1.3Ti1.7Al0.3(PO4)3 NASICON compound. Results Phys. 2016, 6, 719–725. [Google Scholar] [CrossRef] [Green Version]
  57. Martin, U.; Boysen, H.; Frey, F. Neutron powder investigation of tetragonal and cubic stabilized zirconia, TZP and CSZ, at temperatures up to 1400 K. Acta Crystallogr. B Struct. Sci. Cryst. 1993, 49, 403–413. [Google Scholar] [CrossRef]
  58. Jolley, A.G.; Taylor, D.D.; Schreiber, N.J.; Wachsman, E.D. Structural investigation of monoclinic-rhombohedral phase transition in Na3Zr2Si2PO12 and doped NASICON. J. Am. Ceram. Soc. 2015, 98, 2902–2907. [Google Scholar] [CrossRef]
  59. Donohue, M.D.; Aranovich, G.L. Adsorption hysteresis in porous solids. J. Colloid Interface Sci. 1998, 205, 121–130. [Google Scholar] [CrossRef]
  60. Bottom, R. Thermogravimetric Analysis. In Principles and Applications of Thermal Analysis, 1st ed.; Gabbott, P., Ed.; John Wiley & Sons—Blackwell Publishing: Oxford, UK, 2008; pp. 87–118. ISBN 978-1-4051-3171-1. [Google Scholar] [CrossRef]
  61. Bukun, N. Superionic transitions in NASICON-type solid electrolytes. Ionics 1996, 2, 63–68. [Google Scholar] [CrossRef]
  62. Guerrant, G.O.; Brown, D.E. Thermal stability, thermal decomposition of high-analysis fertilizers based on ammonium phosphate. J. Agric. Food Chem. 1965, 13, 493–497. [Google Scholar] [CrossRef]
  63. Morimoto, T.; Nagao, M.; Imai, J. The adsorption of water on SiO2, Al2O3, and SiO2·Al2O3. The relation between the amounts of physisorbed and chemisorbed water. Bull. Chem. Soc. Jpn. 1971, 44, 1282–1288. [Google Scholar] [CrossRef] [Green Version]
  64. Nogami, M. Glass preparation of the ZrO2-SiO2 system by the sol-gel process from metal alkoxides. J. Non-Cryst. Solids 1985, 69, 415–423. [Google Scholar] [CrossRef]
  65. Leonova, L.S.; Tkacheva, N.S.; Bukun, N.G. Effect of the nature of a sodium-conducting solid electrolyte on the impedance of its interface with the SmCo0.8Ti0.2O3 oxide electrode in an oxygen atmosphere. Russ. J. Electrochem. 2002, 38, 596–601. [Google Scholar] [CrossRef]
  66. Colomban, P.; Mouchon, E. Phase transition in, thermal history and expansion of NASICON, solid solution and lithium derivative ceramics and of SiC (mullite) fibers-NASICON composites. Solid State Ion. 1994, 73, 209–220. [Google Scholar] [CrossRef]
  67. Govindaraj, G.; Mariappan, C.R. Synthesis, characterization and ion dynamic studies of NASICON type glasses. Solid State Ion. 2002, 147, 49–59. [Google Scholar] [CrossRef]
  68. Mariappan, C.R.; Govindaraj, G. Ac conductivity, dielectric studies and conductivity scaling of NASICON materials. Mater. Sci. Eng. B 2002, 94, 82–88. [Google Scholar] [CrossRef]
  69. Mudenda, S.; Kale, G.M. New insight into the electrical properties and ion dynamics of screen printed NASICON thick films. J. Mater. Chem. A 2015, 3, 12268–12275. [Google Scholar] [CrossRef] [Green Version]
  70. Arya, A.; Sharma, A.L. Temperature and salt-dependent dielectric properties of blend solid polymer electrolyte complexed with LiBOB. Macromol. Res. 2019, 27, 334–345. [Google Scholar] [CrossRef]
  71. Greenhoe, B.M.; Hassan, M.K.; Wiggins, J.S.; Mauritz, K.A. Universal power law behavior of the AC conductivity versus frequency of agglomerate morphologies in conductive carbon nanotube-reinforced epoxy networks. J. Polym. Sci. B Polym. Phys. 2016, 54, 1918–1923. [Google Scholar] [CrossRef]
  72. Mauritz, K.A. Dielectric relaxation studies of ion motions in electrolyte-containing perfluorosulfonate ionomers. 4. Long-range ion transport. Macromolecules 1989, 22, 4483–4488. [Google Scholar] [CrossRef]
  73. Anjali; Patial, B.S.; Thakur, N. On the AC-conduction mechanism in Se-Te-Pb amorphous chalcogenide system: A detailed study through frequency-dependent imaginary part of AC conductivity. In AIP Conference Proceedings; AIP Publishing LLC: Melville, NY, USA, 2020; p. 080050. [Google Scholar] [CrossRef]
  74. Almond, D.P.; Duncan, G.K.; West, A.R. The determination of hopping rates and carrier concentrations in ionic conductors by a new analysis of ac conductivity. Solid State Ion. 1983, 8, 159–164. [Google Scholar] [CrossRef]
  75. Bounar, N.; Benabbas, A.; Ropa, P.; Carru, J.C. Synthesis and ionic conductivity of NASICON-structured LiTi2-xSnx(PO4)3 anode material for lithium-ion batteries. Adv. Mater. Process. Technol. 2017, 3, 241–249. [Google Scholar] [CrossRef]
  76. Dyre, J.C.; Schrøder, T.B. Universality of ac conduction in disordered solids. Rev. Mod. Phys. 2000, 72, 873–892. [Google Scholar] [CrossRef] [Green Version]
  77. Schrøder, T.B.; Dyre, J.C. Ac hopping conduction at extreme disorder takes place on the percolating cluster. Phys. Rev. Lett. 2008, 101, 025901. [Google Scholar] [CrossRef] [PubMed] [Green Version]
  78. Tarasov, A.; Titov, K. On the use of the Cole–Cole equations in spectral induced polarization. Geophys. J. Int. 2013, 195, 352–356. [Google Scholar] [CrossRef]
Figure 1. DLS analysis results of the particle size (and cumulative) distributions for NASICON powders (a,b) before; and (c,d) after thermal processing. Bar densities in histograms correspond to numerical frequency statistics; insets display graphical (areal) comparisons of distributions.
Applsci 11 08432 g001
Figure 2. (a) BET adsorption/desorption isotherms, with inlet showing BET surface area calculation; and (b) BJH microporosity for untreated powders. (c) BET adsorption/desorption isotherms, with inlet showing BET surface area calculation; and (d) BJH microporosity for sintered powders. Surface area modestly increased after thermal treatment; porosity was conserved at the mesoporous regime.
Applsci 11 08432 g002
Figure 3. (a) TGA and (b) corresponding DSC with derived differential curves (DTG, DDSC) of untreated NASICON vs. thermally treated powders (shaded curves). Major thermal events and corresponding identifiers marked accordingly.
Applsci 11 08432 g003
Figure 4. Optical micrographs of NASICON pellets (a) with pronounced clustering produced at low compacting pressure (cross-section); (b) with smoother packing produced by high compacting pressure (cross-section); and (c) riddled by random carbonic impurities introduced by improper handling and storage (peripheral surface). Scale bar at 500 μm.
Applsci 11 08432 g004
Figure 5. 3D models of the crystal structure of NASICON, displayed as top views of (a) linked ZrO6 octahedra (gold) and (P/Si)O4 tetrahedra (purple), oxygen atoms (red), and free conduction channels through the structure; (b) sodium ions (cyan) within the channels. (c,d) Corresponding front views of the lattice and the ions within the channels, respectively.
Applsci 11 08432 g005
Figure 6. XRD spectra of NASICON signatures (a) over increasing processing temperatures and (b) over selected levels of isostatic pressure. Miller indices given above their corresponding 2θ ranges; zirconia and other secondary phases marked as black ◊. Side-panels correspond to focused displays of characteristic peaks of interest (scaling not proportional for readability).
Applsci 11 08432 g006
Figure 7. Real and imaginary components, σ′ and σ″ respectively, of conductivity scanned over the broadband frequency range of 10−1 to 1011 Hz and for temperatures ranging from 200 °C to −100 °C. Scans for NASICON pellets assembled by applying isostatic pressure levels of (a) 245 MPa, (b) 345 MPa, and (c) 540 MPa are displayed. Temperature profiles were plotted according to the common colormaps displayed on the right of figures; scans corresponding to RT (25 °C) are highlighted in bold, along with ac conductivity values recorded at the highest frequency levels of the frequency-dependent dispersion zones for RT.
Applsci 11 08432 g007
Figure 8. Parametric 2D and 3D phase-space mappings of the real component σ′ of conductivity scanned over a broadband frequency range of 10−1 to 1011 Hz and for temperatures ranging from 200 °C to −100 °C. Scans for NASICON pellets assembled by applying pressure levels of (a) 245 MPa, (b) 345 MPa, and (c) 540 MPa are displayed. 3D mappings portray the XY plane reflected across the Y-axis bisector, revealing the frequency-dependent dispersion region as a narrow diagonal ridge preceded by the dc plateau. Conductivity scales adhere to the common colormap to the right of the figures.
Applsci 11 08432 g008
Figure 9. Fitting parameters to the frequency series data according to the Jonscher power law, obtained by the nonlinear Levenberg–Marquardt iteration algorithm and transposed over scaled reciprocal temperature, showing the (a) bulk dc electrical conductivity, σdc; (b) ac conductivity coefficient, A; (c) frequency exponent of the mobile ions, n; and (d) derived crossover frequency, ωp. Parameter fittings correspond to R2 values ranging from 0.99 to 0.94. Demarcated values correspond to room temperature (RT) conditions.
Applsci 11 08432 g009
Figure 10. Arrhenius plots of the real component σ′ of conductivity against reciprocal temperature, obtained as Poincaré sections at the frequency domains of (a) 107 Hz; (b) 105 Hz; (c) 103 Hz; and (d) 10 Hz. Comparative scans include all in-lab prepared NASICON pellets over different levels of applied pressure versus the commercial NASICON as the reference. Inlets portray the temperature interval in the vicinity of RT, with displayed conductivity readings for RT at the corresponding scanning frequency. Temperature dependency manifests as linearity in the (a,b) high-frequencies scans. Temperature dependency becomes distorted at the lower (c,d) frequency intervals due to polarization dominance.
Applsci 11 08432 g010
Figure 11. Real and imaginary components of permittivity, ε′ (dielectric constant) and ε″ (dielectric loss), respectively, scanned over the broadband frequency range of 10−1 to 1011 Hz and for temperatures ranging from 200 °C to −100 °C. Scans for NASICON pellets assembled by applying isostatic pressure levels of (a) 245 MPa, (b) 345 MPa, and (c) 540 MPa are displayed. Temperature profiles are plotted according to the common colormaps displayed on the right of figures; scans corresponding to RT (25 °C) are highlighted in bold.
Applsci 11 08432 g011
Figure 12. (a) Relaxation time τ over scaled reciprocal temperature for all in-lab prepared NASICON samples compared with the commercial reference; Cole-–Cole plots of dielectric loss against dielectric constant for temperatures ranging from 200 °C to −100 °C for NASICON pellets assembled by applying pressure levels of (b) 245 MPa, (c) 345 MPa, and (d) 540 MPa. Temperature profiles were plotted according to the common colormaps displayed to the right of the figures; scans corresponding to RT (25 °C) are highlighted in bold.
Applsci 11 08432 g012
Figure 13. Parametric 2D and 3D phase-space mappings of the dissipation factor tanδ of permittivity scanned over a broadband frequency range of 10−1 to 1011 Hz and for temperatures ranging from 200 °C to −100 °C. Scans for NASICON pellets assembled by applying pressure levels of (a) 245 MPa, (b) 345 MPa, and (c) 540 MPa are displayed. Phase-space mappings reveal the primary relaxation band as a diagonal ridge in direct association with the corresponding feature observed in conductivity mappings as well as a second relaxation band initiated at the transition temperature of the monoclinic-to-rhombohedral lattice structure for NASICON. Dissipation scales adhere to the common colormap on the right of figures.
Applsci 11 08432 g013
Table 1. Statistical metrics of particle size distributions obtained by DLS of ball-milled powders, before and after sintering.
Processing StageDmode
[nm]
Daverage
[nm]
D10
[nm]
D50
[nm]
D90
[nm]
CV
[%]
PI
[%]
RMS
[–]
Untreated1563.81636.11262.31591.22002.417.546.50.00249
Sintered1363.21799.9908.91635.92817.342.1116.70.02643
Table 2. XRD parameters of primary NASICON peak signatures for the untreated, calcinated, and sintered powdered materials.
Peak SignatureUntreated (RT|80 °C)Calcinated (600 °C)Sintered (1250 °C)
2θMillerdFWHMSizedFWHMSizedFWHMSize
[deg.](h k l)[Å][deg.][Å][Å][deg.][Å][Å][deg.][Å]
13.80126.3410.2263696.4140.2163876.4530.186448
19.21044.5640.3372504.5720.1445854.6340.185454
19.81104.4480.1944354.4810.1615244.4920.121695
23.01133.8400.3162683.8640.2643203.8720.215393
28.20243.1340.2533383.1470.1356353.1590.105813
30.71162.8960.4421952.9230.3102772.9250.300287
34.12412.6840.3572432.6260.2343712.6270.250347
34.63002.5840.4521932.5970.2044262.5950.160544
38.72082.3140.3572462.3340.092951
Table 3. XRD parameters of deconvoluted peak signatures for zirconia contaminants over different levels of pressure.
Peak SignatureLow Pressure (245 MPa)Medium Pressure (345 MPa)High Pressure (540 MPa)
2θMillerdFWHMSizedFWHMSizedFWHMSize
[deg.](h k l)[Å][deg.][Å][Å][deg.][Å][Å][deg.][Å]
20.14.4250.0929204.4130.1097744.4410.101834
27.03.2990.07810953.2920.0788593.2900.088974
28.33.1590.1058133.1540.1495743.1520.135634
35.72.5160.08410392.5130.0998842.5100.101864
Publisher’s Note: MDPI stays neutral with regard to jurisdictional claims in published maps and institutional affiliations.

