Featured Application
The method described in this study consists of the preparation and analysis of mycelium samples for the identification of Serpula lacrymans by FTIR.
Abstract
The dry rot fungus Serpula lacrymans is the most destructive fungal agent of wood building materials in Europe, Russia, North America, and Japan. The identification of this wood-deteriorating agent and the discrimination of different fungal isolates is very important for the control of buildings in general and for the preservation of cultural heritage in particular. The objective of the study was to develop a Fourier transform infrared (FTIR) method coupled with a partial least square discriminant analysis (PLS-DA) for the sample preparation and identification of S. lacrymans. Five distinct S. lacrymans strains were analysed and compared to two strains of unrelated fungal species. Different methods of mycelial growth, sample preparation, and FTIR spectral data normalisation were compared. FTIR analysis of a harvested mycelium grown on the surface of a polyether sulfone microfiltration membrane deposited on a malt extract agar medium, followed by vector normalization and PLS-DA statistical analysis, resulted in 100% correct attribution at phylum, species, and strain level, regardless of the type of standardization used. This study confirms the applicability of FTIR spectroscopy for the identification of S. lacrymans and the discrimination of different strains belonging to this species.
1. Introduction
Serpula lacrymans is a Basidiomycota of the order Boletales, which is the main agent of brown rot in buildings and historical monuments in Europe, Russia, North America, and Japan [1,2,3,4,5]. S. lacrymans is rarely detected alone in a building; other wood-degrading fungi accompany it which makes its detection difficult [6,7]. The observation of brown rot and the analysis of the mycelium and fruiting bodies can direct the identification of wood-damaging fungi to a presence of S. lacrymans [8]. When the fruiting bodies or microstructures of the mycelial cords (rhizomorph) characteristic of S. lacrymans cannot be found, a sample must be taken. Two identification approaches are then possible: a classical agar culture technique or a molecular biological approach. The cultivation of the fungus on a nutrient agar medium allows for the specification of its macro and microscopic morphological characters. The main advantage of this cultural approach is low cost, but it is time-consuming and tedious, requires strong expertise, and may not be very discriminating for the related species [3,9]. As the cultivation of S. lacrymans from samples is often unsuccessful, a molecular biological approach is of interest. Polymerase chain reaction (PCR) amplification and the sequencing analysis of molecular markers in the internal transcribed spacer (ITS) region can identify fungi with varying degrees of discrimination depending on the taxonomical group considered [10]. The universal primer pair, ITS1 and ITS4, is used generically for fungal identification; the primer pair, ITS1-F and ITS4-B, can be used to specifically highlight Basidiomycota, and the S. lacrymans-specific SL primer can be combined with ITS1 to detect this species [11,12,13]. The advantage of this method is that it allows the identification of a fungus regardless of its developmental stage [14]. However, some published studies using species-specific primers to detect S. lacrymans from environmental samples recorded some failures [6,7,15].
Fourier transform infrared spectroscopy (FTIR) is an alternative technique for the characterization and identification of different types of microorganisms, particularly fungi [16,17,18,19,20]. FTIR is based on the acquisition of a specific spectral signature of each microorganism after cultivation under given conditions. This spectral signature corresponds mainly to the composition of proteins, lipids, nucleic acids and carbohydrates in the biomass. The vibrational spectra of different fungal species have many signals in common and contain a large number of variables requiring the coupling to multivariate statistical analysis methods for their comparison [20]. The reproducibility of FTIR for fungal identification requires the standardization of each step of the analytical protocol: culture conditions, sample preparation and spectral acquisition parameters [21].
Several protocols using FTIR spectroscopy have been described to identify moulds [19,20,22,23,24,25]. Only a few studies have used FTIR to identify wood-decay fungi, but none to identity S. lacrymans [26,27]. In this study, we used different fungal growth conditions and different mycelial harvesting methods to select the best protocol for the identification of S. lacrymans by Attenuated total reflectance (ATR)-FTIR spectroscopy. The goal of this study was to standardize, optimize, and show that FTIR spectroscopy is a suitable method for the identification and discrimination of different strains of S. lacrymans.
2. Materials and Methods
2.1. Fungal Strains and Growth Conditions
Seven fungal strains (5 S. lacrymans, 1 Rhodonia placenta and 1 Trichoderma harzianum) obtained from the Culture Collection of Université de Bretagne Occidentale (UBOCC, Plouzané, France) and the culture collection of the Laboratoire de Recherche des Monuments Historiques (LRMH, Champs-sur-Marne, France), were used (Table 1). S. lacrymans and R. placenta were brown-rot fungi. T. harzianum was phylogenetically distant from S. lacrymans and served as an easily distinguished negative control of this species. Pre-cultures of fungi were performed at 23 °C on Malt Extract Agar (MEA) (Malt extract 20.0 g, Agar 20.0 g per litre distilled water) for R. placenta and T. harzianum, and on Malt Extract Agar with Peptone (MEAP) (Malt extract 20.0 g, Peptone 1.0 g, Glucose 20.0 g, Agar 20.0 g per litre distilled water) for S. lacrymans.

Table 1.
Fungal strains.
One mL of sterile saline solution (NaCl 0.9%) was added to a fungal pre-culture on the surface of a Petri dish. The mycelium was scraped off and the liquid containing the suspended mycelium fragments was collected and used to inoculate broth or agar media. The 100 μL of mycelium suspension was placed in a tube containing 8 mL of malt extract peptone broth (Malt extract 20.0 g, Peptone 1.0 g, Glucose 20.0 g per litre distilled water) or plated onto a polyether sulfone (PES) membrane (Merck, France) placed on the surface of a new MEA plate. Inoculated broth and agar media were incubated for 12 days at 23 °C. Broth cultures were then centrifuged for 1.5 min at 13,000× g. After the supernatant removal, the mycelium was washed with 10 mL of saline and centrifuged as above. The obtained pellet was dried for 48 h at 50 °C. Mycelia cultured on filtration membranes were prepared in two ways. Either the membrane carrying the mycelium was dried directly or the mycelium was harvested by scraping the surface of the membrane before drying. The mycelium collection was performed to exclude possible membrane interference on infrared signals. Drying was carried out for 48 h at 50 °C. For each strain and each culture condition, at least five independent cultures were performed.
2.2. FTIR Analysis
The FTIR analysis was carried out using an ALPHA II spectrometer equipped with an ATR Platinum crystal diamond module (Bruker Optics, Marne la Vallée, France). The analysis was performed between 4000 and 400 cm−1 with 64 accumulations per sample and a spectral resolution of 2 cm−1. The infrared data were cleaned and processed with OPUS (version 6.5, Marne la Vallée, France) software as shown below. The spectrum was first trimmed by removing the values on either side of the interval between 3700 and 600 cm−1, and then normalised. Normalisation of the spectra was conducted according to two models: a minimum–maximum (min–max) normalisation and a vector normalisation. For the min–max normalisation of the spectra, the data were smoothed (25 smoothing points), a straight line was generated between 2800 and 1800 cm−1 and the baseline was corrected before normalisation. All values of the spectra were set between 0 and 2, while keeping the distances between them. For the vector normalisation of the spectra, the data were second-derivative smoothed (25 smoothing points), a straight line was generated between 2800 and 1800 cm−1, and then a vector normalisation was performed. The second derivative allowed for better resolution of the near and small absorption peaks. This was completed by calculating the average absorbance values of each spectrum in the selected spectral range. Each absorbance value in the spectrum was subtracted from this average value. The corrected value was then divided by the root of the sum of the squares of all the absorbances in the spectral range.
2.3. Statistical Analysis
The FTIR data were subjected to statistical analysis using partial least square discriminant analysis (PLS-DA) developed in XLSTAT (version 2018.1, Paris, France) software. This supervised linear analysis method using the algorithm of multivariate PLS regression permitted the classification of samples in the spectral ranges 3700–2800 cm−1 and 1800–600 cm−1, corresponding to the major biochemical functions present in the mycelial samples. Each class was coded by a combination of 0 and 1, depending on whether the sample belonged to a given class or not. The explained data corresponding to the defined variables of the samples were correlated with a matrix of class properties corresponding to the different classes of the samples. A confusion matrix was generated to summarise information about the reclassifications after analysis by the algorithm. The percentage of correct attribution corresponding to the ratio of the number of well-classified observations to the total number of observations was calculated.
3. Results
3.1. Fourier Transformed Infrared (FTIR) Spectroscopy
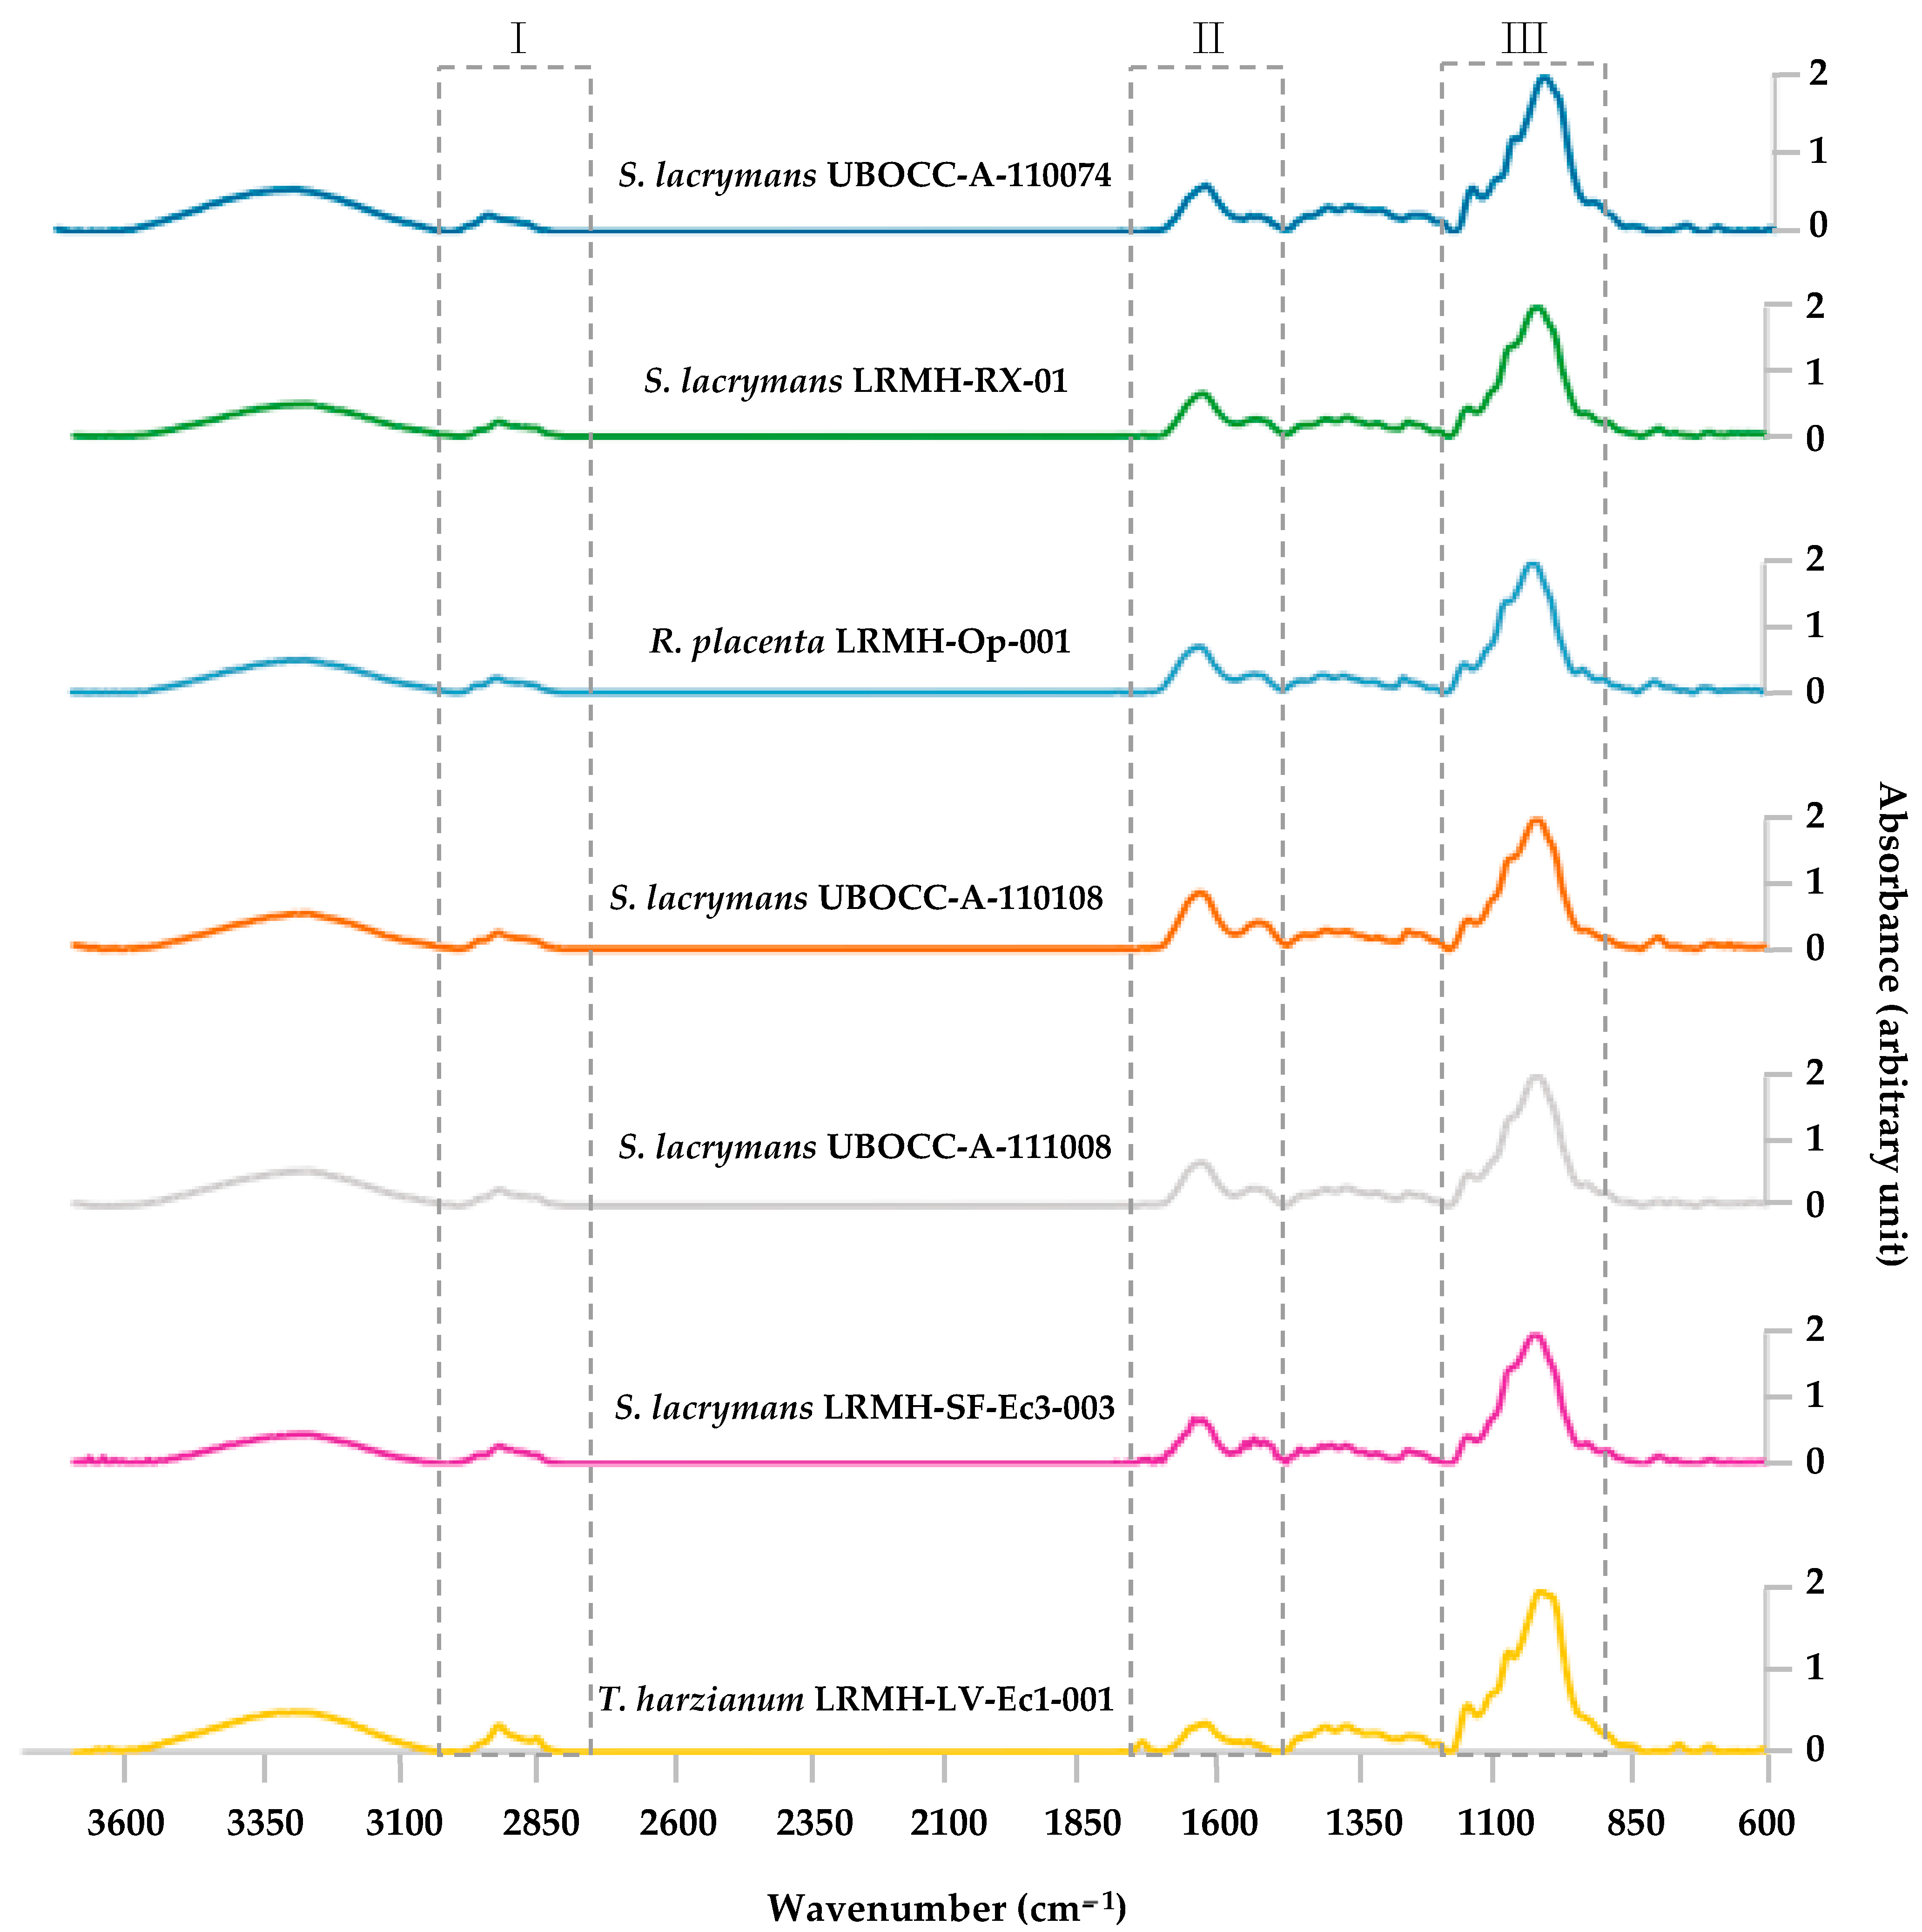
The mycelial biomass obtained after growth and collection under different conditions was analysed by ATR-FTIR. The IR spectra obtained after normalisation of the data are presented in Figure 1, Figures S1 and S2. The two methods of data normalisation allow the visualisation of the signals corresponding to the chemical groups of the main biological macromolecules of the biomass in the spectral ranges 3600–2800 cm−1 and 1800–600 cm−1 (Figure 1 and Figure S1). Two regions dominate the fungal spectra: the signals between 1200 and 900 cm−1 corresponding to saccharides and nucleic acids, and the signals between 1650 and 1550 cm−1 corresponding to proteins. Signals corresponding to fatty acids were also observed between 3100 and 2800 cm−1.
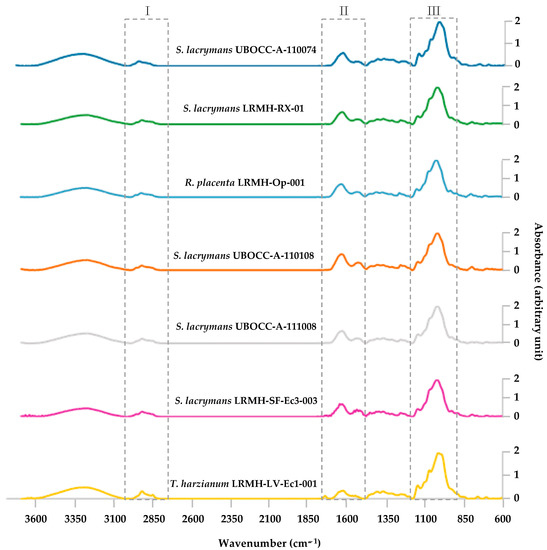
Figure 1.
Fourier transform infrared (FTIR) spectra of fungi obtained after growth in liquid medium and min–max normalisation. Characteristic spectral ranges corresponding to major macromolecules are indicated by dotted boxes (I, fatty acids; II, proteins; III, polysaccharides and nucleic acids). Each spectrum is the average of at least five spectra obtained after repeating independent experiments under identical conditions.
3.2. Partial Least Square Discriminant Analysis
After the acquisition of the FTIR spectra of the different mycelium samples, the data were subjected to min–max and vector normalisation in parallel to determine the most efficient technique. The normalisation data were then processed by the same statistical analysis, PLS-DA.
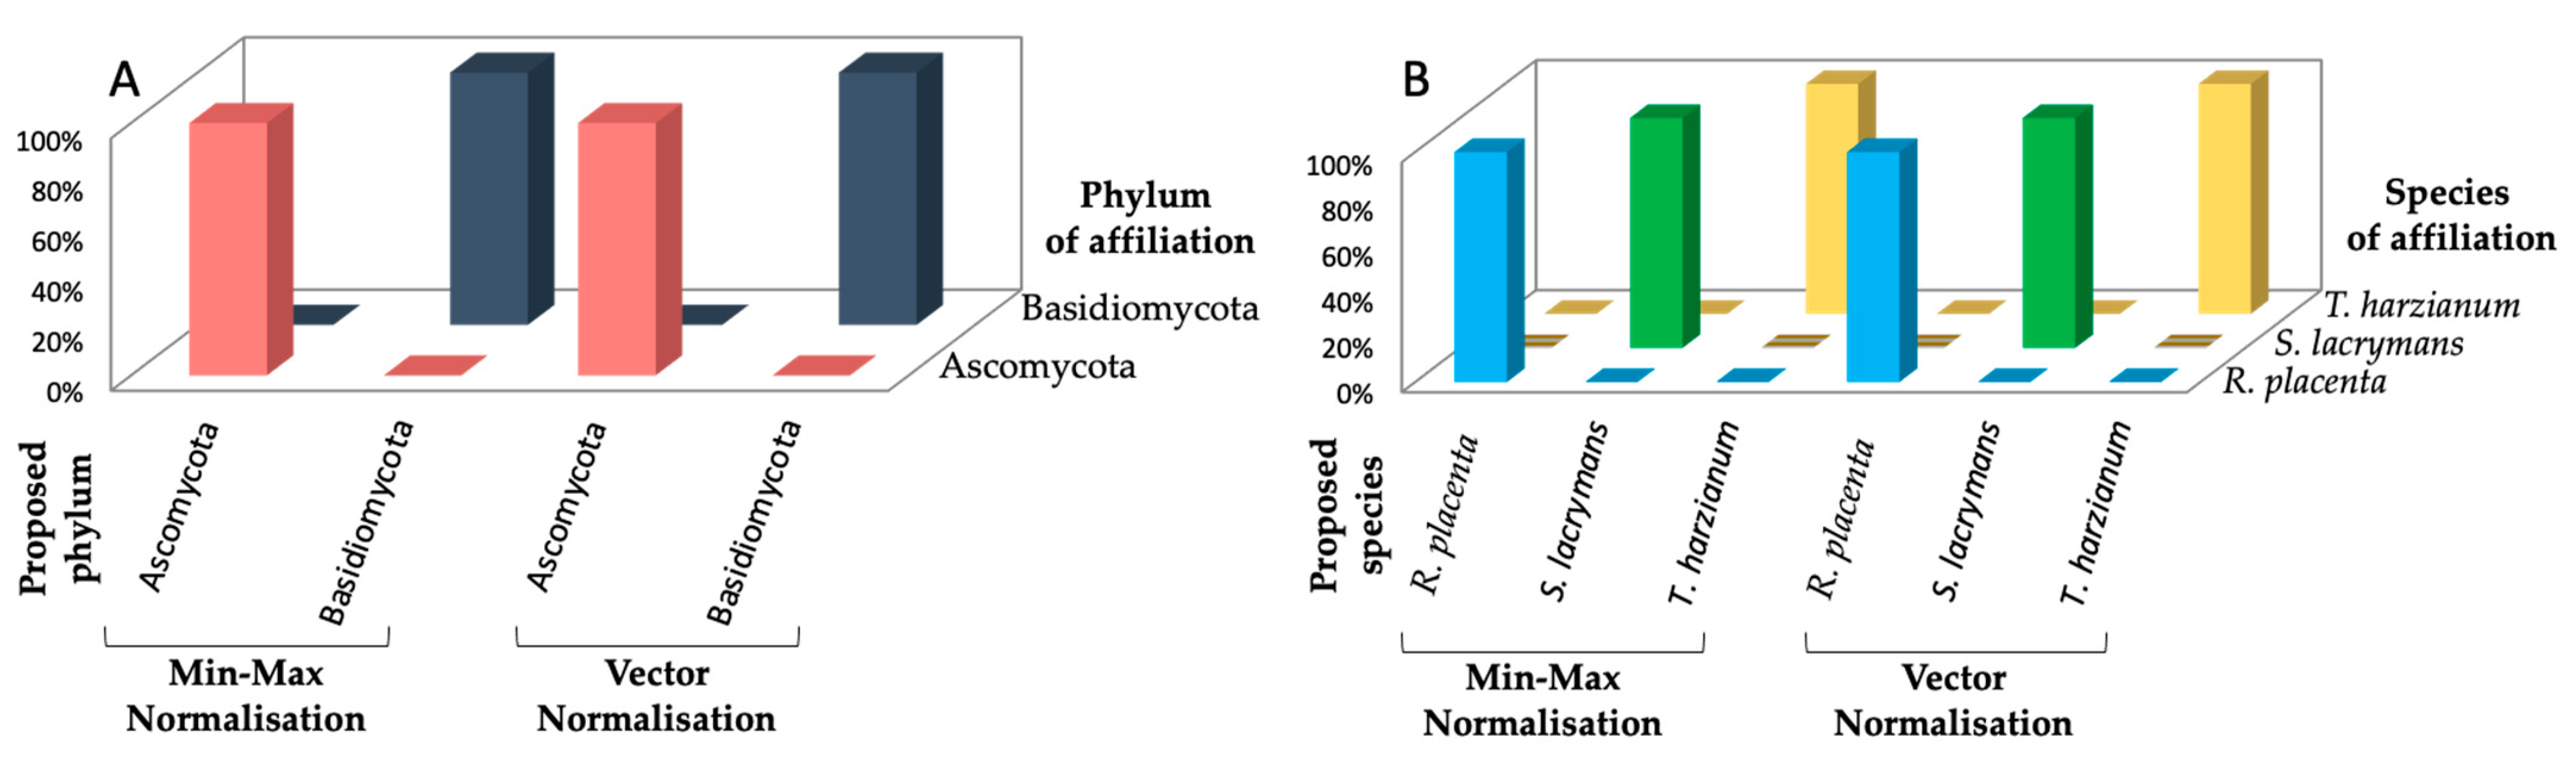
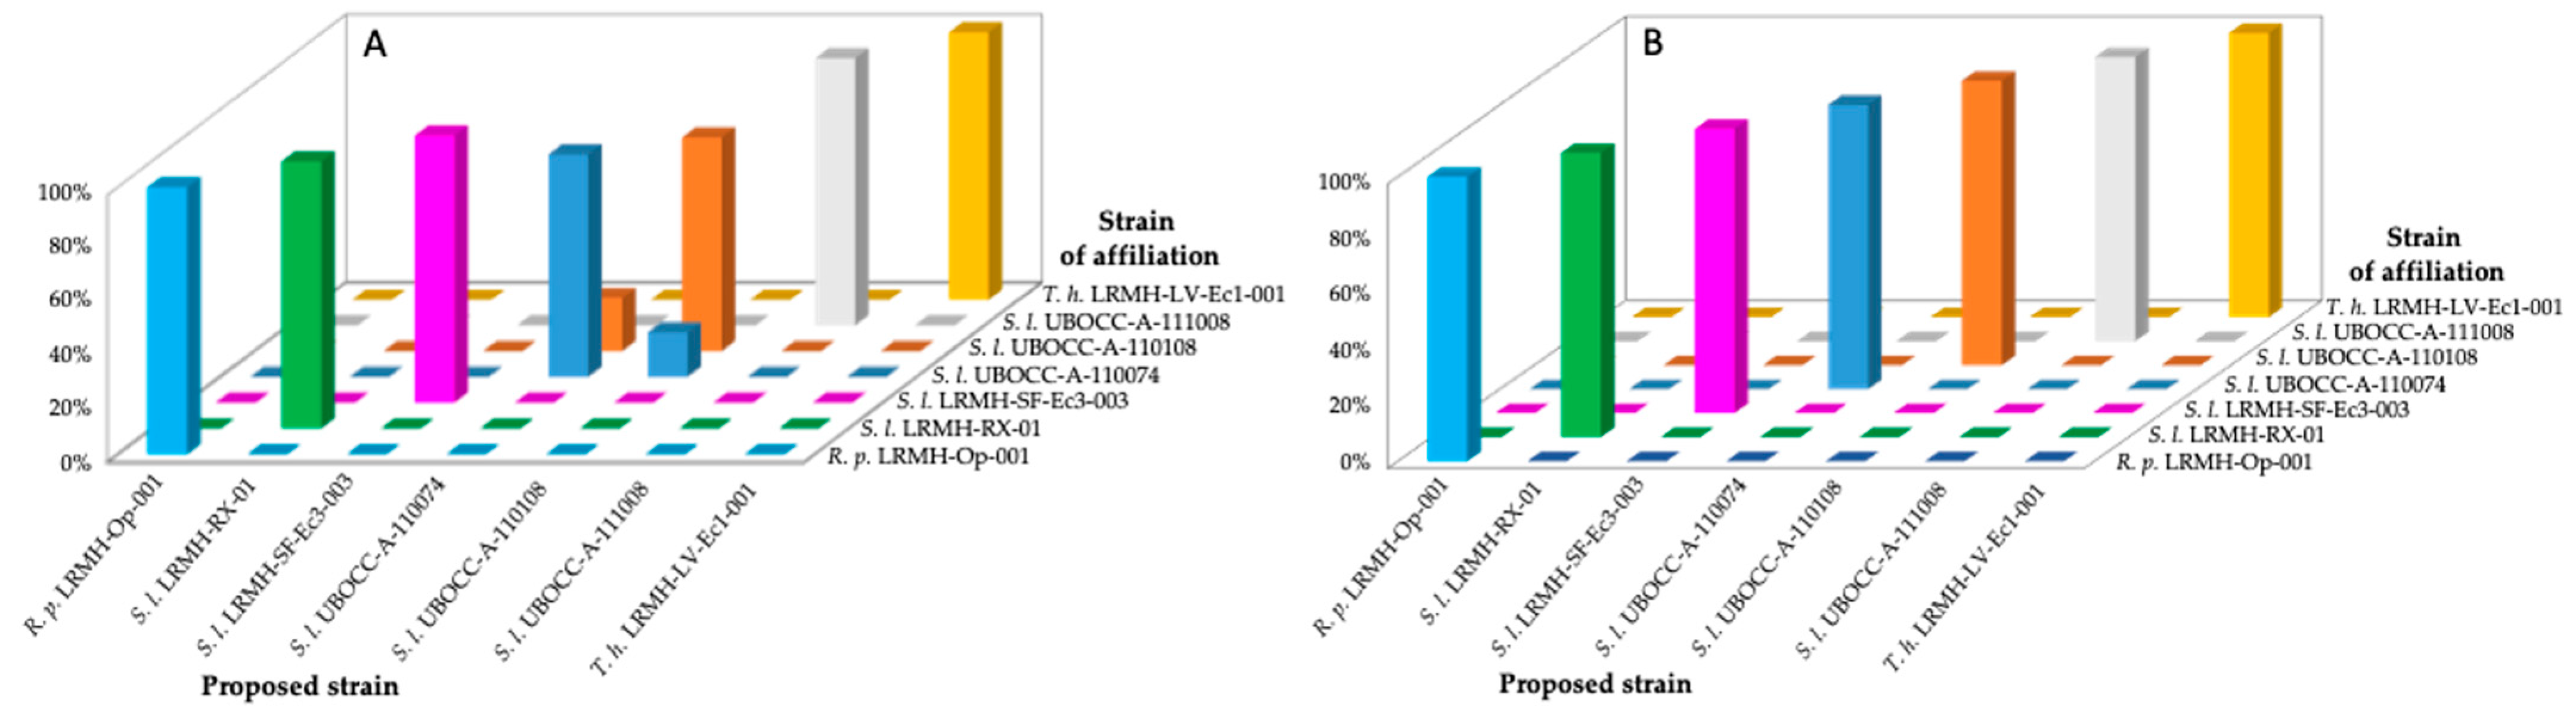
The PLS-DA method carried out on the FTIR spectra of the different fungi after growth on the PES membrane and the harvesting of the mycelium allows the classification of the spectra with a percentage of correct attribution of 100% at the level of the phylum, species, and strain for the two methods of data normalisation (Figure 2 and Figure 3).
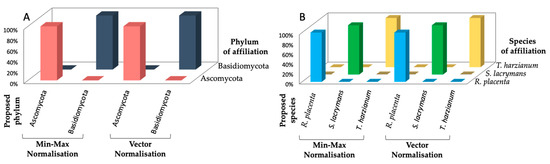
Figure 2.
Confusion matrix obtained for the discrimination of the phylum (A) and the species (B) after growth on the polyether sulfone (PES) membrane and scraping the surface of the membrane to harvest the mycelium.
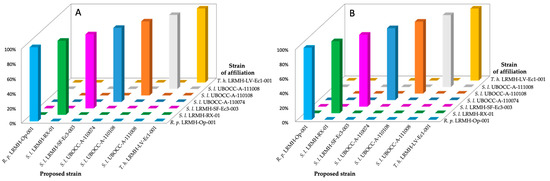
Figure 3.
Confusion matrix obtained for the discrimination of the strains after growth on the PES membrane and scraping the surface of the membrane to harvest the mycelium. Min–max normalization (A), Vector normalization (B). R. p., Rhodonia placenta. S. l., Serpula lacrymans. T. h., Trichoderma harzianum.
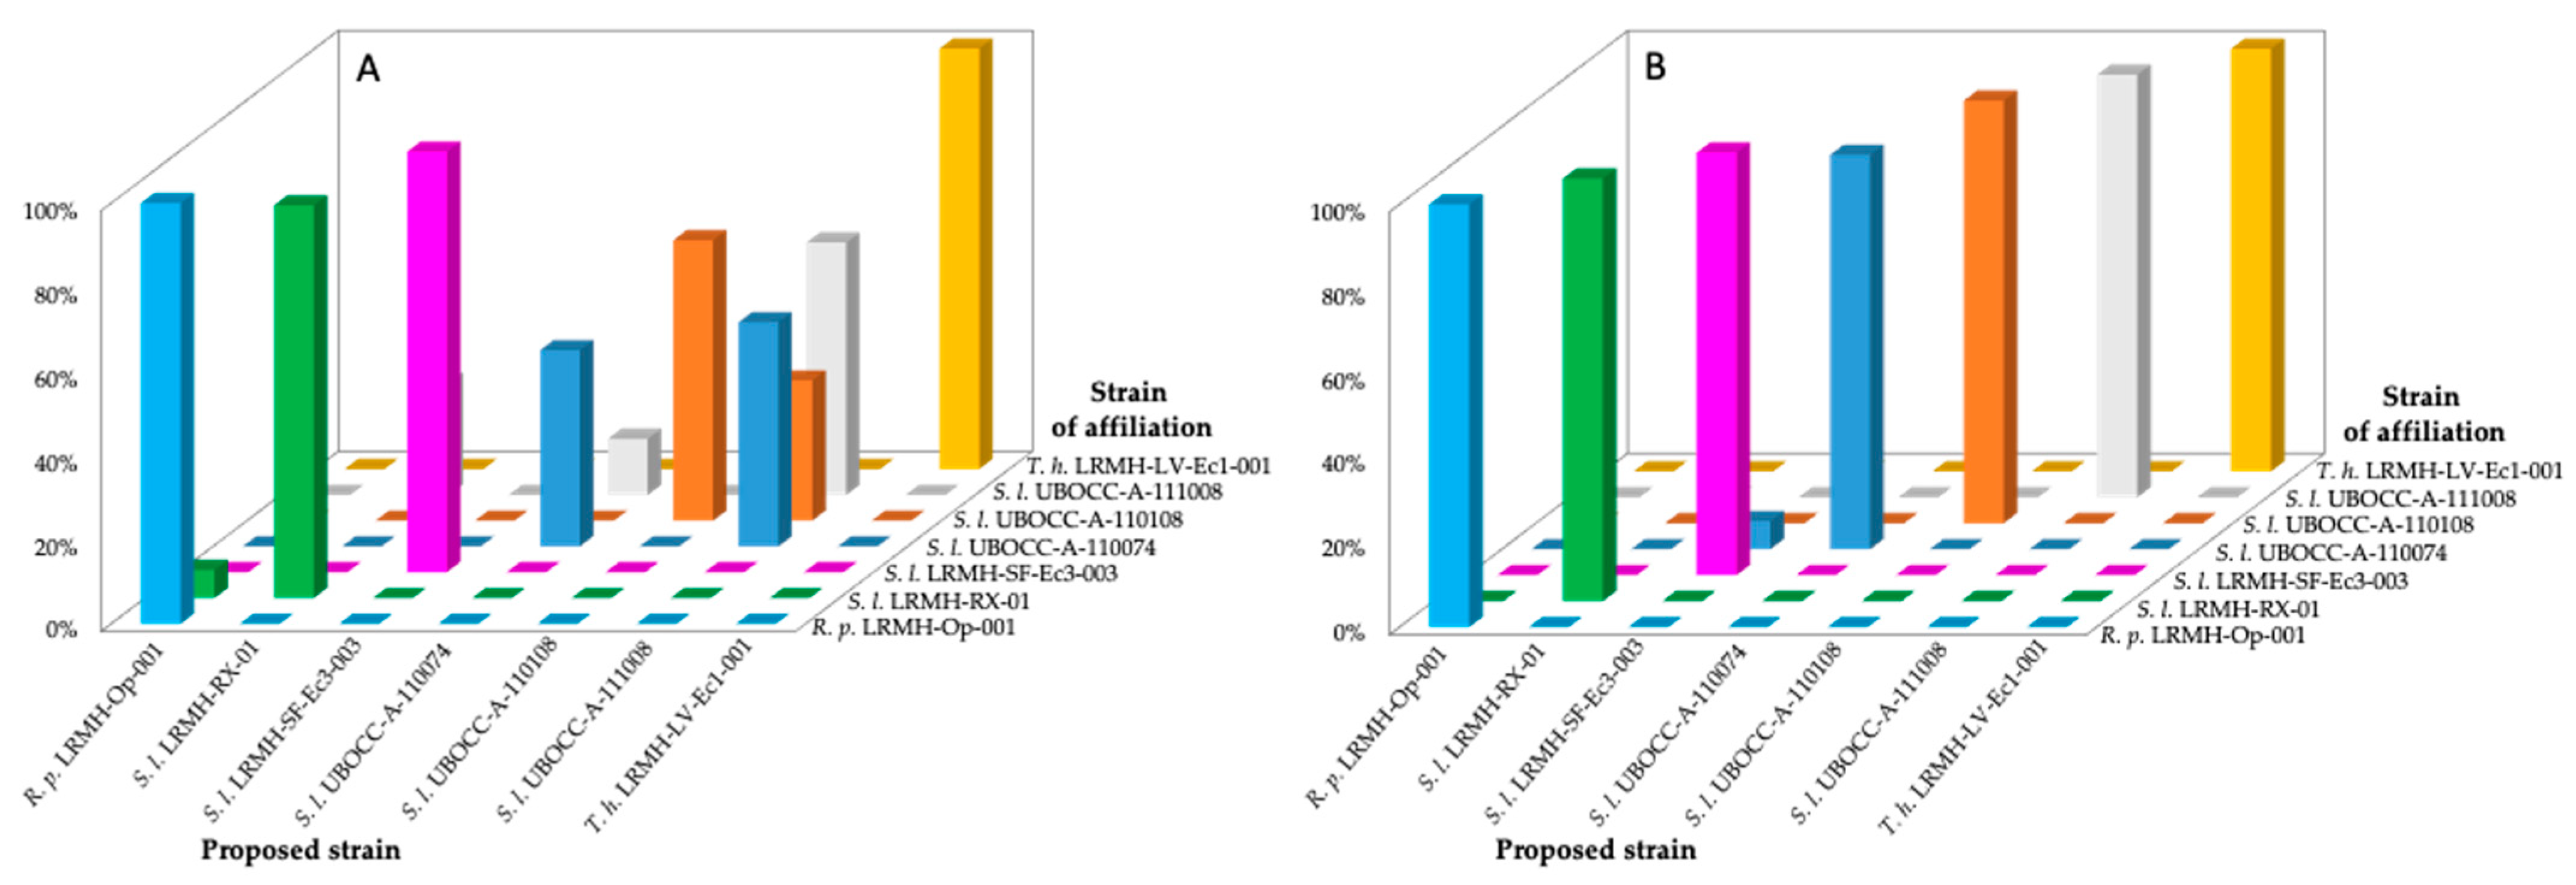
The PLS-DA method performed on the FTIR spectra of mycelia after fungal culture on the PES membrane and direct analysis on the membrane (Figure 4) classifies the spectra with a 100% correct attribution percentage at phylum as well as species level for both data normalisation methods. In the case of min–max normalisation, the percentage of correct attribution is 94.44% at the strain level within the species S. lacrymans. In this case, 16.7% of the spectra of S. lacrymans UBOCC-A-110074 are attributed to strain S. lacrymans UBOCC-A-110108 and 20% of the spectra of S. lacrymans UBOCC-A-110108 are attributed to strain S. lacrymans UBOCC-A-110074. 83.3% of the spectra of S. lacrymans UBOCC-A-110074 and 80% of the spectra of S. lacrymans UBOCC-A-110108 are correctly attributed to each of these two strains, respectively. The percentage of correct attribution is 100% for all strains when vector normalisation is performed, indicating a higher efficiency than min–max normalisation for this sample type (Figure 4).

Figure 4.
Confusion matrix obtained for the discrimination of the strains after growth on the PES membrane, and direct analysis on the membrane. Min–max normalization (A), Vector normalization (B). R. p., Rhodonia placenta. S. l., Serpula lacrymans. T. h., Trichoderma harzianum.
The method is less efficient for identifying fungi when cultured in liquid medium with a variable result according to the type of normalisation (Figure 5). A percentage of the correct attribution at the level of the strain of 80.95% and 99.05% is obtained for min–max and vector normalisation, respectively. After min–max normalisation, 6.7% of the spectra of S. lacrymans LRMH-RX-01 were attributed to R. placenta LRMH-Op-001, which belonged to another species, and the attribution of the spectra of the S. lacrymans strains UBOCC-A-110074, UBOCC-A-110108 and UBOCC-A-111008 were sometimes incorrect, with some spectra being associated with the wrong strain. After vector normalisation, the percentage of correct attribution was 99.05% (Figure 5). In this case, 6.7% of the spectra of S. lacrymans UBOCC-A-110074 were wrongly attributed to S. lacrymans LRMH-SF-EC3-003.
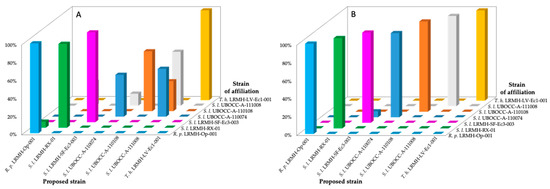
Figure 5.
Confusion matrix obtained for the discrimination of the strains after growth in liquid medium. Min–max normalization (A), or Vector normalization (B). R. p., Rhodonia placenta. S. l., Serpula lacrymans. T. h., Trichoderma harzianum.
4. Discussion
The treatment of fungal growth in a building begins with identifying and eliminating the source of the moisture to stop the growth [1]. Then, it is necessary to determine the extent of the damage by inspecting all areas of the building where the fungus may have spread [7]. This also helps to characterise the type of wood decay (brown rot, white rot, and/or soft rot) and guide the identification of the fungi involved. This identification is essential as the course of action will depend on whether or not S. lacrymans is present. If S. lacrymans is not involved, the damage is minor and the fungal growth is limited to the areas where the wood is degraded. Therefore, treatment can be limited to allowing the building to dry out by ventilating it. However, if the source of the moisture cannot be removed immediately or the building cannot be allowed to dry out, fungicidal treatments are applied and the contaminated woodwork and plasterwork is destroyed. In the case of S. lacrymans, uncontaminated woodwork adjacent to areas where the fungus is present is also destroyed. Furthermore, in France, the occupant or owner of the building affected by S. lacrymans has a legal obligation to declare the presence of the fungus in the building to the city hall [28]. In the case of a historic building which may have valuable woodwork and walls decorated with sculptures or paintings, care should be taken and biocidal treatments with the least possible impact on the materials should be used. In this context, the identification of S. lacrymans in the early stages is essential.
The identification of fungi involved in wood biodegradation through culture and molecular methods could be tedious, time-consuming and/or expensive. FTIR spectroscopy has shown its suitability for the identification of fungi of medical or food interest, but few data exist for wood-rot fungi [19,22,27,29]. This identification method is based on the global analysis of the mycelium or spores of a fungus to determine its spectral profile and to compare it to reference spectra [19,20]. The IR spectrum obtained for a fungus corresponds to all the biomolecules present in the biomass at the time of analysis. The differences in the composition and quantity of these biomolecules between species, genera or strains make it possible to differentiate fungi by FTIR spectroscopy. These parameters vary for the same individual depending on the stage and conditions of growth [30].
In this study, the application of FTIR spectroscopy to the identification and discrimination of S. lacrymans strains was evaluated. Reference FTIR spectra were made from different strains of S. lacrymans, R. placenta and T. harzianum after growth under standardised conditions. The analysis was carried out using a wide spectral range extending from 3700 to 2800 and from 1800 to 600 cm−1, which corresponded to the signals obtained for the main biological macromolecules carbohydrates, proteins, lipids and nucleic acids [16,19,31]. The analysis of FTIR spectra was completed from fungal mycelium and not from fungal spores in order to obtain more complex spectra and a better discrimination [19,20,22,23]. Furthermore, R. placenta and S. lacrymans did not sporulate under the laboratory conditions used.
Several culture protocols have been described for FTIR application. A mycelium can be analysed after liquid culture and harvested by centrifugation, filtration, or freeze-drying, or obtained after growth on the surface of an agar medium or a membrane deposited on an agar medium and harvested from its surface [18,19,23,26,32]. The advantage of liquid culture is that it prevents the sporulation of many fungi [18,33]. In the present study, three conditions for obtaining mycelium were compared: growth in broth and harvesting by centrifugation, growth on a microfiltration membrane deposited on the surface of an agar medium, and direct analysis of the mycelium on the membrane or collection of the mycelium from the surface of the membrane by scraping before analysis. The culture time was set at 12 days to obtain the sufficient biomass for slow-growing fungi such as S. lacrymans. At longer culture times when there is limited or no growth in the study area, the production of biomolecules tends to decrease in the mycelium leading to an increase in the reproducibility of FTIR analyses [18]. After 2, 3, 4 or 5 days’ of growth of moulds on malt extract agar, the highest reproducibility of FTIR spectra was obtained for the longest cultivation time [18].
After the spectral data acquisition from mycelium samples, a pre-processing of the data is necessary before their statistical analysis. In different studies using FTIR spectroscopy for fungal identification, a vector normalisation of the spectral data is performed [19,20,22,26,34]. Vector normalisation brings the spectra back to the same intensity without altering the spectral profile by performing a second derivative which increases the spectral resolution. In the present study, the results obtained after vector normalisation were compared to the results obtained after min–max normalisation. In the case of min–max normalisation, the baseline of the data was corrected and the data for each spectrum were multiplied so that for each spectrum the minimum was 0 and the maximum was 2. After the normalisation of the spectral data by each of the two methods, the identification of the fungi was carried out using PLS-DA analysis of the spectral data. PLS-DA is a supervised statistical analysis method unlike other statistical methods such as Principal Component Analysis or Hierarchical Ascendant Classification (cluster analysis) [23,35,36,37]. In the case of a supervised statistical analysis method, each spectrum is assigned a class so that quantitative spectral data are supplemented by qualitative data. From the annotated reference IR spectra, the algorithm creates a prediction function of the class to which the analysed spectrum belongs.
The results obtained showed that the choice of culture conditions and the type of data normalisation were essential for the identification of S. lacrymans by FTIR spectroscopy. The min–max normalisation was less resolving than the vector normalisation which was widely used for FTIR fungal identification [20,22,37]. Regarding the mode of mycelium culture, although liquid culture may be in some cases the simplest to implement [18,24], it was not relevant for the identification of S. lacrymans by FTIR. Indeed, broth growth was the culture condition that led to the lowest resolution for discriminating different S. lacrymans strains, with even an error at the species level, as a spectrum of the S. lacrymans strain (LRMH-RX-01) was assigned to R. placenta (LRMH-Op-001). In the other mycelium growth conditions tested (on the surface of a microfiltration membrane), only strain affiliation errors within the S. lacrymans species were observed. When the analysis was performed on the IR data obtained after harvesting the mycelium from the membrane, the assignment of IR spectra was consistently correct at the phylum, species and strain level of S. lacrymans. This 100% correct assignment percentage must be put into perspective because the number of references we used was small, as the number of strains analysed was limited. Kümmerle et al. studied 722 unknown yeast isolates with a library of reference spectra based on 332 strains belonging to 18 genera and 74 species and obtained a correct identification rate of 97.5% [38]. In a study analysing 25 mould strains with a reference spectra library based on 106 strains belonging to 14 genera and 32 species, the correct identification rates of 98.97% and 98.77% were obtained at the genus and species level, respectively [19]. In another study of 105 strains, with a reference spectra library based on 288 strains belonging to 26 genera and 68 species, the correct identification rates of 99.17% and 92.3% were obtained at genus and species level, respectively [20].
In the conclusion of the present study, the most efficient fungal sample preparation and analysis protocol to identify an isolate suspected to be S. lacrymans is a culture on the surface of a filtration membrane deposited on a malt extract agar medium; a collection of the mycelium by scraping, followed by drying of the mycelium by heat treatment; FTIR analysis; the processing of the spectral data by vector normalisation, and PLS-DA statistical analysis. The constitution of a library of reference spectra based on a larger number of strains of S. lacrymans and other fungi and the analysis of field isolates of wood-decay fungi (particularly brown-rot fungi such as Gloeophyllum sepiarium, Fibroporia (Antrodia) vaillantii, Coniophora puteana, Serpula himantoides) is necessary to confirm the effectiveness of this protocol. The next step in this study is to adapt the use of FTIR spectroscopy to the identification of S. lacrymans by direct in situ analysis without fungal culture. This will involve performing FTIR spectra of fungi after growth on different native substrates such as wood, and materials found in buildings.
Supplementary Materials
The following are available online at https://www.mdpi.com/article/10.3390/app11188463/s1, Figure S1: FTIR spectra of fungi obtained after growth under different conditions, from different sample preparations, and two normalisations of the spectral data. Figure S2: FTIR spectra of fungi obtained after growth in different conditions illustrating the reproducibility of the method and the heterogeneity of the mycelial matter.
Author Contributions
Conceptualization, P.D.M. and F.B.; methodology, P.D.M.; validation, P.D.M. and F.B.; investigation, R.B.; data curation, R.B.; writing-original draft preparation, P.D.M.; writing-review and editing, R.B. and F.B.; supervision, P.D.M.; project administration, P.D.M.; funding acquisition, P.D.M. and F.B. All authors have read and agreed to the published version of the manuscript.
Funding
This study was part of the project “Biodétérioration du bois dans les bâtiments historiques: biodiversité microbienne et évaluation in vitro de traitements alternatifs” funded by “La Fondation des Sciences du Patrimoine”, LabEx PATRIMA (AAP_2016_01), Agence nationale de la recherche ANR-10-LABX-0094-01.
Conflicts of Interest
The authors declare no conflict of interest.
References
- Krzyzanowski, N.; Oduyemi, K.; Jack, N.; Ross, N.; Palfreyman, J. The management and control of dry rot: A survey of practitioners’ views and experiences. J. Environ. Manag. 1999, 57, 143–154. [Google Scholar] [CrossRef]
- Singh, J. Dry rot and other wood-destroying fungi: Their occurrence, biology, pathology and control. Indoor Built Environ. 1999, 8, 3–20. [Google Scholar] [CrossRef]
- Schmidt, O. Indoor wood-decay basidiomycetes: Damage, causal fungi, physiology, identification and characterization, prevention and control. Mycol. Prog. 2007, 6, 261–279. [Google Scholar] [CrossRef]
- Watkinson, S.; Eastwood, D. Serpula lacrymans, Wood and Buildings. In Advances in Clinical Chemistry; Elsevier BV: Amsterdam, The Netherlands, 2012; Volume 78. [Google Scholar]
- Reinprecht, L. Biological Degradation of Wood, in Wood Deterioration, Protection and Maintenance; John Wiley & Sons, Ltd.: Oxford, UK, 2016; pp. 62–125. [Google Scholar]
- Maurice, S.; Le Floch, G.; Le Bras-Quéré, M.; Barbier, G. Improved molecular methods to characterise Serpula lacrymans and other Basidiomycetes involved in wood decay. J. Microbiol. Methods 2011, 84, 208–215. [Google Scholar] [CrossRef]
- Slimen, A.; Barboux, R.; Mihajlovski, A.; Moularat, S.; Leplat, J.; Bousta, F.; Di Martino, P. High diversity of fungi associated with altered wood materials in the hunting lodge of “La Muette“, Saint-Germain-en-Laye, France. Mycol. Prog. 2020, 19, 139–146. [Google Scholar] [CrossRef]
- Huckfeldt, T.; Schmidt, O. Identification key for European strand-forming house-rot fungi. Mycologist 2006, 20, 42–56. [Google Scholar] [CrossRef]
- Gabriel, J.; Švec, K. Occurrence of indoor wood decay basidiomycetes in Europe. Fungal Biol. Rev. 2017, 31, 212–217. [Google Scholar] [CrossRef]
- Schoch, C.L.; Robbertse, B.; Robert, V.; Vu, D.; Cardinali, G.; Irinyi, L.; Meyer, W.; Nilsson, R.H.; Hughes, K.; Miller, A.N.; et al. Finding needles in haystacks: Linking scientific names, reference specimens and molecular data for Fungi. Database 2014, 2014, bau061. [Google Scholar] [CrossRef] [PubMed]
- Gardes, M.; Bruns, T.D. ITS primers with enhanced specificity for basidiomycetes—Application to the identification of my-corrhizae and rusts. Mol. Ecol. 1993, 2, 113–118. [Google Scholar] [CrossRef]
- Schmidt, O.; Moreth, U. Species-specific PCR primers in the rDNA-ITS region as a diagnostic tool for Serpula lacrymans. Mycol. Res. 2000, 104, 69–72. [Google Scholar] [CrossRef]
- Bellemain, E.; Carlsen, T.; Brochmann, C.; Coissac, E.; Taberlet, P.; Kauserud, H. ITS as an environmental DNA barcode for fungi: An in silico approach reveals potential PCR biases. BMC Microbiol. 2010, 10, 189. [Google Scholar] [CrossRef] [PubMed] [Green Version]
- Manter, D.K.; Vivanco, J.M. Use of the ITS primers, ITS1F and ITS4, to characterize fungal abundance and diversity in mixed-template samples by qPCR and length heterogeneity analysis. J. Microbiol. Methods 2007, 71, 7–14. [Google Scholar] [CrossRef] [PubMed]
- Horisawa, S.; Sakuma, Y.; Doi, S. Qualitative and quantitative PCR methods using species-specific primer for detection and identification of wood rot fungi. J. Wood Sci. 2009, 55, 133–138. [Google Scholar] [CrossRef]
- Naumann, D.; Helm, D.; Labischinski, H. Microbiological characterizations by FT-IR spectroscopy. Nat. Cell Biol. 1991, 351, 81–82. [Google Scholar] [CrossRef] [PubMed]
- Santos, C.; Fraga, M.E.; Kozakiewicz, Z.; Lima, N. Fourier transform infrared as a powerful technique for the identification and characterization of filamentous fungi and yeasts. Res. Microbiol. 2010, 161, 168–175. [Google Scholar] [CrossRef] [Green Version]
- Shapaval, V.; Møretrø, T.; Suso, H.P.; Asli, A.W.; Schmitt, J.; Lillehaug, D.; Martens, H.; Böcker, U.; Kohler, A. A high-throughput microcultivation protocol for FTIR spectroscopic characterization and identification of fungi. J. Biophotonics 2010, 3, 512–521. [Google Scholar] [CrossRef]
- Lecellier, A.; Mounier, J.; Gaydou, V.; Castrec, L.; Barbier, G.; Ablain, W.; Manfait, M.; Toubas, D.; Sockalingum, G.D. Dif-ferentiation and identification of filamentous fungi by high-throughput FTIR spectroscopic analysis of mycelia. Int. J. Food Microbiol. 2014, 168–169, 32–41. [Google Scholar] [CrossRef]
- Lecellier, A.; Gaydou, V.; Mounier, J.; Hermet, A.; Castrec, L.; Barbier, G.; Ablain, W.; Manfait, M.; Toubas, D.; Sockalingum, G. Implementation of an FTIR spectral library of 486 filamentous fungi strains for rapid identification of molds. Food Microbiol. 2015, 45, 126–134. [Google Scholar] [CrossRef]
- Essendoubi, M.; Toubas, D.; Lepouse, C.; Leon, A.; Bourgeade, F.; Pinon, J.M.; Manfait, M.; Sockalingum, G.D. Epidemio-logical investigation and typing of Candida glabrata clinical isolates by FTIR spectroscopy. J. Microbiol. Methods. 2007, 71, 325–331. [Google Scholar] [CrossRef]
- Fischer, G.; Braun, S.; Thissen, R.; Dott, W. FT-IR spectroscopy as a tool for rapid identification and intra-species character-ization of airborne filamentous fungi. J. Microbiol. Methods 2006, 64, 63–77. [Google Scholar] [CrossRef]
- Garon, D.; El Kaddoumi, A.; Carayon, A.; Amiel, C. FT-IR Spectroscopy for Rapid Differentiation of Aspergillus flavus, Aspergillus fumigatus, Aspergillus parasiticus and Characterization of Aflatoxigenic Isolates Collected from Agricultural Environments. Mycopathologia 2010, 170, 131–142. [Google Scholar] [CrossRef]
- Shapaval, V.; Schmitt, J.; Møretrø, T.; Suso, H.P.; Skaar, I.; Åsli, A.W.; Lillehaug, D.; Kohler, A. Characterization of food spoilage fungi by FTIR spectroscopy. J. Appl. Microbiol. 2013, 114, 788–796. [Google Scholar] [CrossRef] [PubMed]
- Kogkaki, E.A.; Sofoulis, M.; Natskoulis, P.; Tarantilis, P.A.; Pappas, C.S.; Panagou, E.Z. Differentiation and identification of grape-associated black aspergilli using Fourier transform infrared (FT-IR) spectroscopic analysis of mycelia. Int. J. Food Microbiol. 2017, 259, 22–28. [Google Scholar] [CrossRef] [PubMed]
- Naumann, A. A novel procedure for strain classification of fungal mycelium by cluster and artificial neural network analysis of Fourier transform infrared (FTIR) spectra. Analyst 2009, 134, 1215–1223. [Google Scholar] [CrossRef]
- Girometta, C.; Dondi, D.; Baiguera, R.M.; Bracco, F.; Branciforti, D.S.; Buratti, S.; Lazzaroni, S.; Savino, E. Characterization of mycelia from wood-decay species by TGA and IR spectroscopy. Cellulose 2020, 27, 6133–6148. [Google Scholar] [CrossRef]
- LOI n° 2014-366 du 24 mars 2014 pour l’accès au Logement et un Urbanisme Rénové. Available online: https://www.cnle.gouv.fr/loi-no-2014-366-du-24-mars-2014-1240.html (accessed on 24 June 2021).
- Bastert, J.; Korting, H.C.; Traenkle, P.; Schmalreck, A.F. Identification of dermatophytes by Fourier transform infrared spectroscopy (FT-IR). Mycoses 1999, 42, 525–528. [Google Scholar] [CrossRef]
- Cantu, D.; Carl Greve, L.; Labavitch, J.M.; Powell, A.L.T. Characterization of the cell wall of the ubiquitous plant patho-gen Botrytis cinerea. Mycol. Res. 2009, 113, 1396–1403. [Google Scholar] [CrossRef]
- Szeghalmi, A.; Kaminskyj, S.; Gough, K.M. A synchrotron FTIR microspectroscopy investigation of fungal hyphae grown under optimal and stressed conditions. Anal. Bioanal. Chem. 2006, 387, 1779–1789. [Google Scholar] [CrossRef]
- Mularczyk-Oliwa, M.; Bombalska, A.; Kaliszewski, M.; Włodarski, M.; Kwaśny, M.; Kopczyński, K.; Szpakowska, M.; Trafny, E.A. Rapid discrimination of several fungus species with FTIR spectroscopy and statistical analysis. Biuletyn W. A. T. 2013, 62, 71–80. [Google Scholar]
- Dahlberg, K.R.; Etten, J.L.V. Physiology and Biochemistry of Fungal Sporulation. Annu. Rev. Phytopathol. 1982, 20, 281–301. [Google Scholar] [CrossRef]
- Salman, A.; Tsror, L.; Pomerantz, A.; Moreh, R.; Mordechai, S.; Huleihel, M. FTIR spectroscopy for detection and identifi-cation of fungal phytopathogenes. Spectroscopy 2010, 24, 261–267. [Google Scholar] [CrossRef]
- Cao, Z.; Wang, Z.; Shang, Z.; Zhao, J. Classification and identification of Rhodobryum roseum Limpr. and its adulterants based on fourier-transform infrared spectroscopy (FTIR) and chemometrics. PLoS ONE 2017, 12, e0172359. [Google Scholar] [CrossRef] [PubMed]
- Mariey, L.; Signolle, J.; Amiel, C.; Travert, J. Discrimination, classification, identification of microorganisms using FTIR spectroscopy and chemometrics. Vib. Spectrosc. 2001, 26, 151–159. [Google Scholar] [CrossRef]
- Pena, R.; Lang, C.; Naumann, A.; Polle, A. Ectomycorrhizal identification in environmental samples of tree roots by Fouri-er-transform infrared (FTIR) spectroscopy. Front. Plant Sci. 2014, 5, 229. [Google Scholar] [CrossRef] [Green Version]
- Kümmerle, M.; Scherer, S.; Seiler, H. Rapid and Reliable Identification of Food-Borne Yeasts by Fourier-Transform Infrared Spectroscopy. Appl. Environ. Microbiol. 1998, 64, 2207–2214. [Google Scholar] [CrossRef] [PubMed] [Green Version]

Publisher’s Note: MDPI stays neutral with regard to jurisdictional claims in published maps and institutional affiliations. |
© 2021 by the authors. Licensee MDPI, Basel, Switzerland. This article is an open access article distributed under the terms and conditions of the Creative Commons Attribution (CC BY) license (https://creativecommons.org/licenses/by/4.0/).