Article

Biomechanical Evaluation Method to Optimize External Fixator Configuration in Long Bone Fractures—Conceptual Model and Experimental Validation Using Pilot Study

by
Thiran Sellahewa
1,*,
Charitha Weerasinghe
2 and
Pujitha Silva
1,3,*
1
Biomechanics Research Group, Department of Electronic and Telecommunication Engineering, University of Moratuwa, Moratuwa 10400, Sri Lanka
2
Department of Vascular and Transplant Surgery, Colombo North Teaching Hospital, Colombo 11010, Sri Lanka
3
Centre for Biomedical Innovation, University of Moratuwa, Moratuwa 10400, Sri Lanka
*
Authors to whom correspondence should be addressed.
Appl. Sci. 2021, 11(18), 8481; https://doi.org/10.3390/app11188481
Submission received: 7 July 2021 / Revised: 30 August 2021 / Accepted: 3 September 2021 / Published: 13 September 2021

Abstract

:
External fixation is a commonly used method in stabilizing fracture sites. The performance of the fixator depends on how it affects the mechanical properties of the fracture site and is governed by parameters like the fixator type and fixator configuration. Identifying ideal configurations prior to surgery will help surgeons in planning the procedure, limiting the possibility of complications such as non-union. In this study, a framework has been proposed as a surgical pre-planning tool, to assist surgeons compare mechanical properties of a fracture site under different fixator configurations, and thereby identify the optimum solution. A computational tool was identified as the best method for this purpose. Cost and time of computation were given special consideration to reduce complexity in clinical settings. A pilot study was conducted on a section of the proposed framework, where the aim was to understand the feasibility of implementation. In the pilot study, a unilateral uni-planar fixator on a simple diaphyseal transverse fracture was analyzed. During the pilot study the selected fixator was tested and a few models were developed to assess system stability. The models were then compared to identify the optimum model that could be used with the proposed framework. The proposed framework provided a suitable solution for the use case and out of the models developed the simplified finite element model was identified as the best option for the use case.

1. Introduction

Long bone fractures are commonly seen throughout the world accounting to almost half of all orthopedic fractures [1]; many due to falls and accidents, out of which road traffic accidents account to a significant segment [2]. Patients are generally inoperative during the time in which the fracture heals, which impacts their functionality and quality of life. Some may even be impacted in the long term, due to long lasting damage caused by the injury [1]. The cost of long bone fractures is relatively high, in terms of direct medical cost and indirect costs resulting from lost productivity. Bonafede et al. placed the value around USD 23,000 per isolated limb fracture in the USA [3].
In addition to the physical discomfort and economic strain caused on the individual, fractures also cause a significant socioeconomic burden to the country. This issue is further aggravated in the developing region. The incidence of fractures is higher in developing countries with over 90% of road accident related incidents reported worldwide [4], while the cost of healthcare per patient is a large component of the country’s GDP [5]. According to the World Health Organization the highest portion of road traffic accident victims are in the age group between 15 to 29 years, and sustain some sort of a long-standing disability [6]; motorcycle accidents being a key reason [7,8,9]. This is an important age group of individuals, especially for a developing country as it contains the bulk of its workforce. In addition to the direct cost of health care and recovery, the loss of productivity during the recovery period incurs a high cost on both the individual and the country [5]. It is estimated that road traffic accidents annually cost between 1% and 1.5% of the Gross National Product of a low-income country [10]. Meling et al. recognized that when comparing high-income and low-income countries, the latter experiences a significantly larger burden, which they attributed to the lack of public health investment [11].
Non-union is a major issue in fracture healing which is defined as the absence of any clinical or radiological evidence of fracture healing for 6 months after the expected time for healing [12]. Studies have shown that approximately 20 out of 100,000 people will have delayed healing or non-union of fractures [13]. Tibial shaft fractures which are the most common long bone fracture type, are more prone to non-union and infection, due to high probability of open fractures, mainly resulted by the lack of soft tissue coverage [14]. In a study conducted in Australia recently, it was identified that approximately 8% of the patients readmitted for complications (non-union, mal-union and delayed union) post long bone fracture treatment [15].
In addition to the impact on the individual’s health and well-being, these complications also have a large economic impact. Studies have shown that the cost of non-union ranges from GBP 7000–79,000 (approximately USD 8500–96,600) in the UK [13], to AUD 15,000 on average (approximately USD 10,000) in Australia, per patient [15]. The median cost of treating non-union in an open tibial fracture is around USD 25,000 [16]. The authors have not come across any studies specific to the developing region, but believe that the impact on the healthcare system will be similar if not far greater.
According to Jahagirdar and Scammell, non-union occurs in 2 ways [17]. Hypertrophic non-union occurs due to poor fracture site stability causing excessive callus to be formed between the bone ends, whereas Atrophic non-union occurs when the bone ends are resorbed and rounded with no attempt to fuse the fracture interfaces together. Immobilizing the fracture site will assist in reducing hypertrophic non-union and a rigid fixation, pushing the bone fragments together and eliminating the fracture gap is required to limit atrophic non-union.
Apart from biological factors, like soft tissue interposition between bone ends, lack of blood supply, and infection, an adverse biomechanical environment at the fracture site is one of the main factors contributing to non-union and mal-union [17]. Mechanical properties at the fracture site have a large impact on healing, and need to be considered when optimizing surgical procedure [18].
There are 2 main pathways through which bones heal: through primary healing or secondary healing [19]. Primary healing occurs when the bone fragments are anatomically reduced and rigidly fixed with a small fracture gap between them (less than 0.01 mm for contact healing and less than 0.8 mm for gap healing), whereas secondary healing occurs when there is relative motion between the bone fragments forming callus tissue [20]. Primary healing requires the strain across the fracture site to be less than 2% [14].
Fixation is one of the main techniques used to stabilize a fracture and assist healing, through either an internal fixation method or an external fixator. Internal fixation utilizes devices like intermedullary nails and bone plates whereas external fixation uses pins or wires to connect an external frame to the bone fragments. The advantages of using external fixation are mainly simplicity of application, adjustability, increased access to the wound for better care and low cost [21,22]. The ability to apply a wide range of forces on the bone is also an advantage and can be managed by selecting the frame configuration, while it is also preferred for high energy poly-trauma patients with open wounds who may suffer from a large amount of soft tissue damage [21]. In addition to these benefits, external fixators are also preferred in developing regions with limited resources especially due to their low cost and ability to be fabricated locally, both for definitive and temporal fixation [23].
Unfortunately, most orthopedic surgeons reach higher levels of expertise in methods of internal fixation than external fixation due to the number of fractures treated with internal fixation [24].
Stability of the external fixation is necessary to maintain alignment at the fracture site. Failure to maintain alignment could cause loss of anatomical reduction, potentially leading to mal-union, non-union, or failure [25]. A large number of studies have shown that changes in the mechanical properties of a fracture site would affect the time taken for a fracture to heal, change the types and proportions of tissue formed and control whether or not healing would occur (mal-union and non-union) [26,27].

Configuration Optimization

The configuration of a selected framework has a large impact on the stability of the ultimate system. As the scope of surgical management guidelines is to provide broader information on the complete healthcare process, they have limited information relating to fixator selection and pin placement (Figure 1) [24]. The AO guideline for fracture management provides extensive information, but does not provide a tool to compare different configurations [28].
Kempson et al. completed one of the first studies in the area of stability comparison by cataloging the stiffness of 6 external fixator frames [29]. Many studies have looked at existing literature and patient data to analyze and validate types of intervention [21,30,31,32]. Keating et al. presented an algorithm for management of bone loss based on fracture properties and soft tissue damage, which helped identify best fixation method [33]. A major shift in fracture fixation biomechanics studies occurred with the implementation of finite element analysis (FEA). Studies in this area ranged from device optimization [34] to performance analysis [35] to comparison between different fixators [36,37] and different configurations [34,38,39]. Roland et al. created a complete workflow, for the optimization of a cancellous bone transplant [40] which was automated [41]. Rosiero et al. developed an optimization model using 1D finite element analysis [22].
Studies have been conducted in trying to understand the biological response of mechanical stimuli and thereby model healing [42], and has been used to predict fracture healing in conjunction with FEA, with studies looking at fracture properties [43] and fixation properties [44]. Even though a large number of studies have been conducted to understand the healing process, not all mechanisms and parameters of interest have been identified [18]. In addition to these methods, analytical models have also been used [45].
The overall scope of this study is to develop a framework for configuration optimization for external fixators, especially to be used in developing countries. In this paper the proposed framework is presented and a simplified workflow of the framework is analyzed under a pilot study. The objective of the pilot study is to understand the feasibility of implementation and validate the proposed method. During the study 4 analytical and computational models were compared to identify the best method for the use case.

2. Methodology

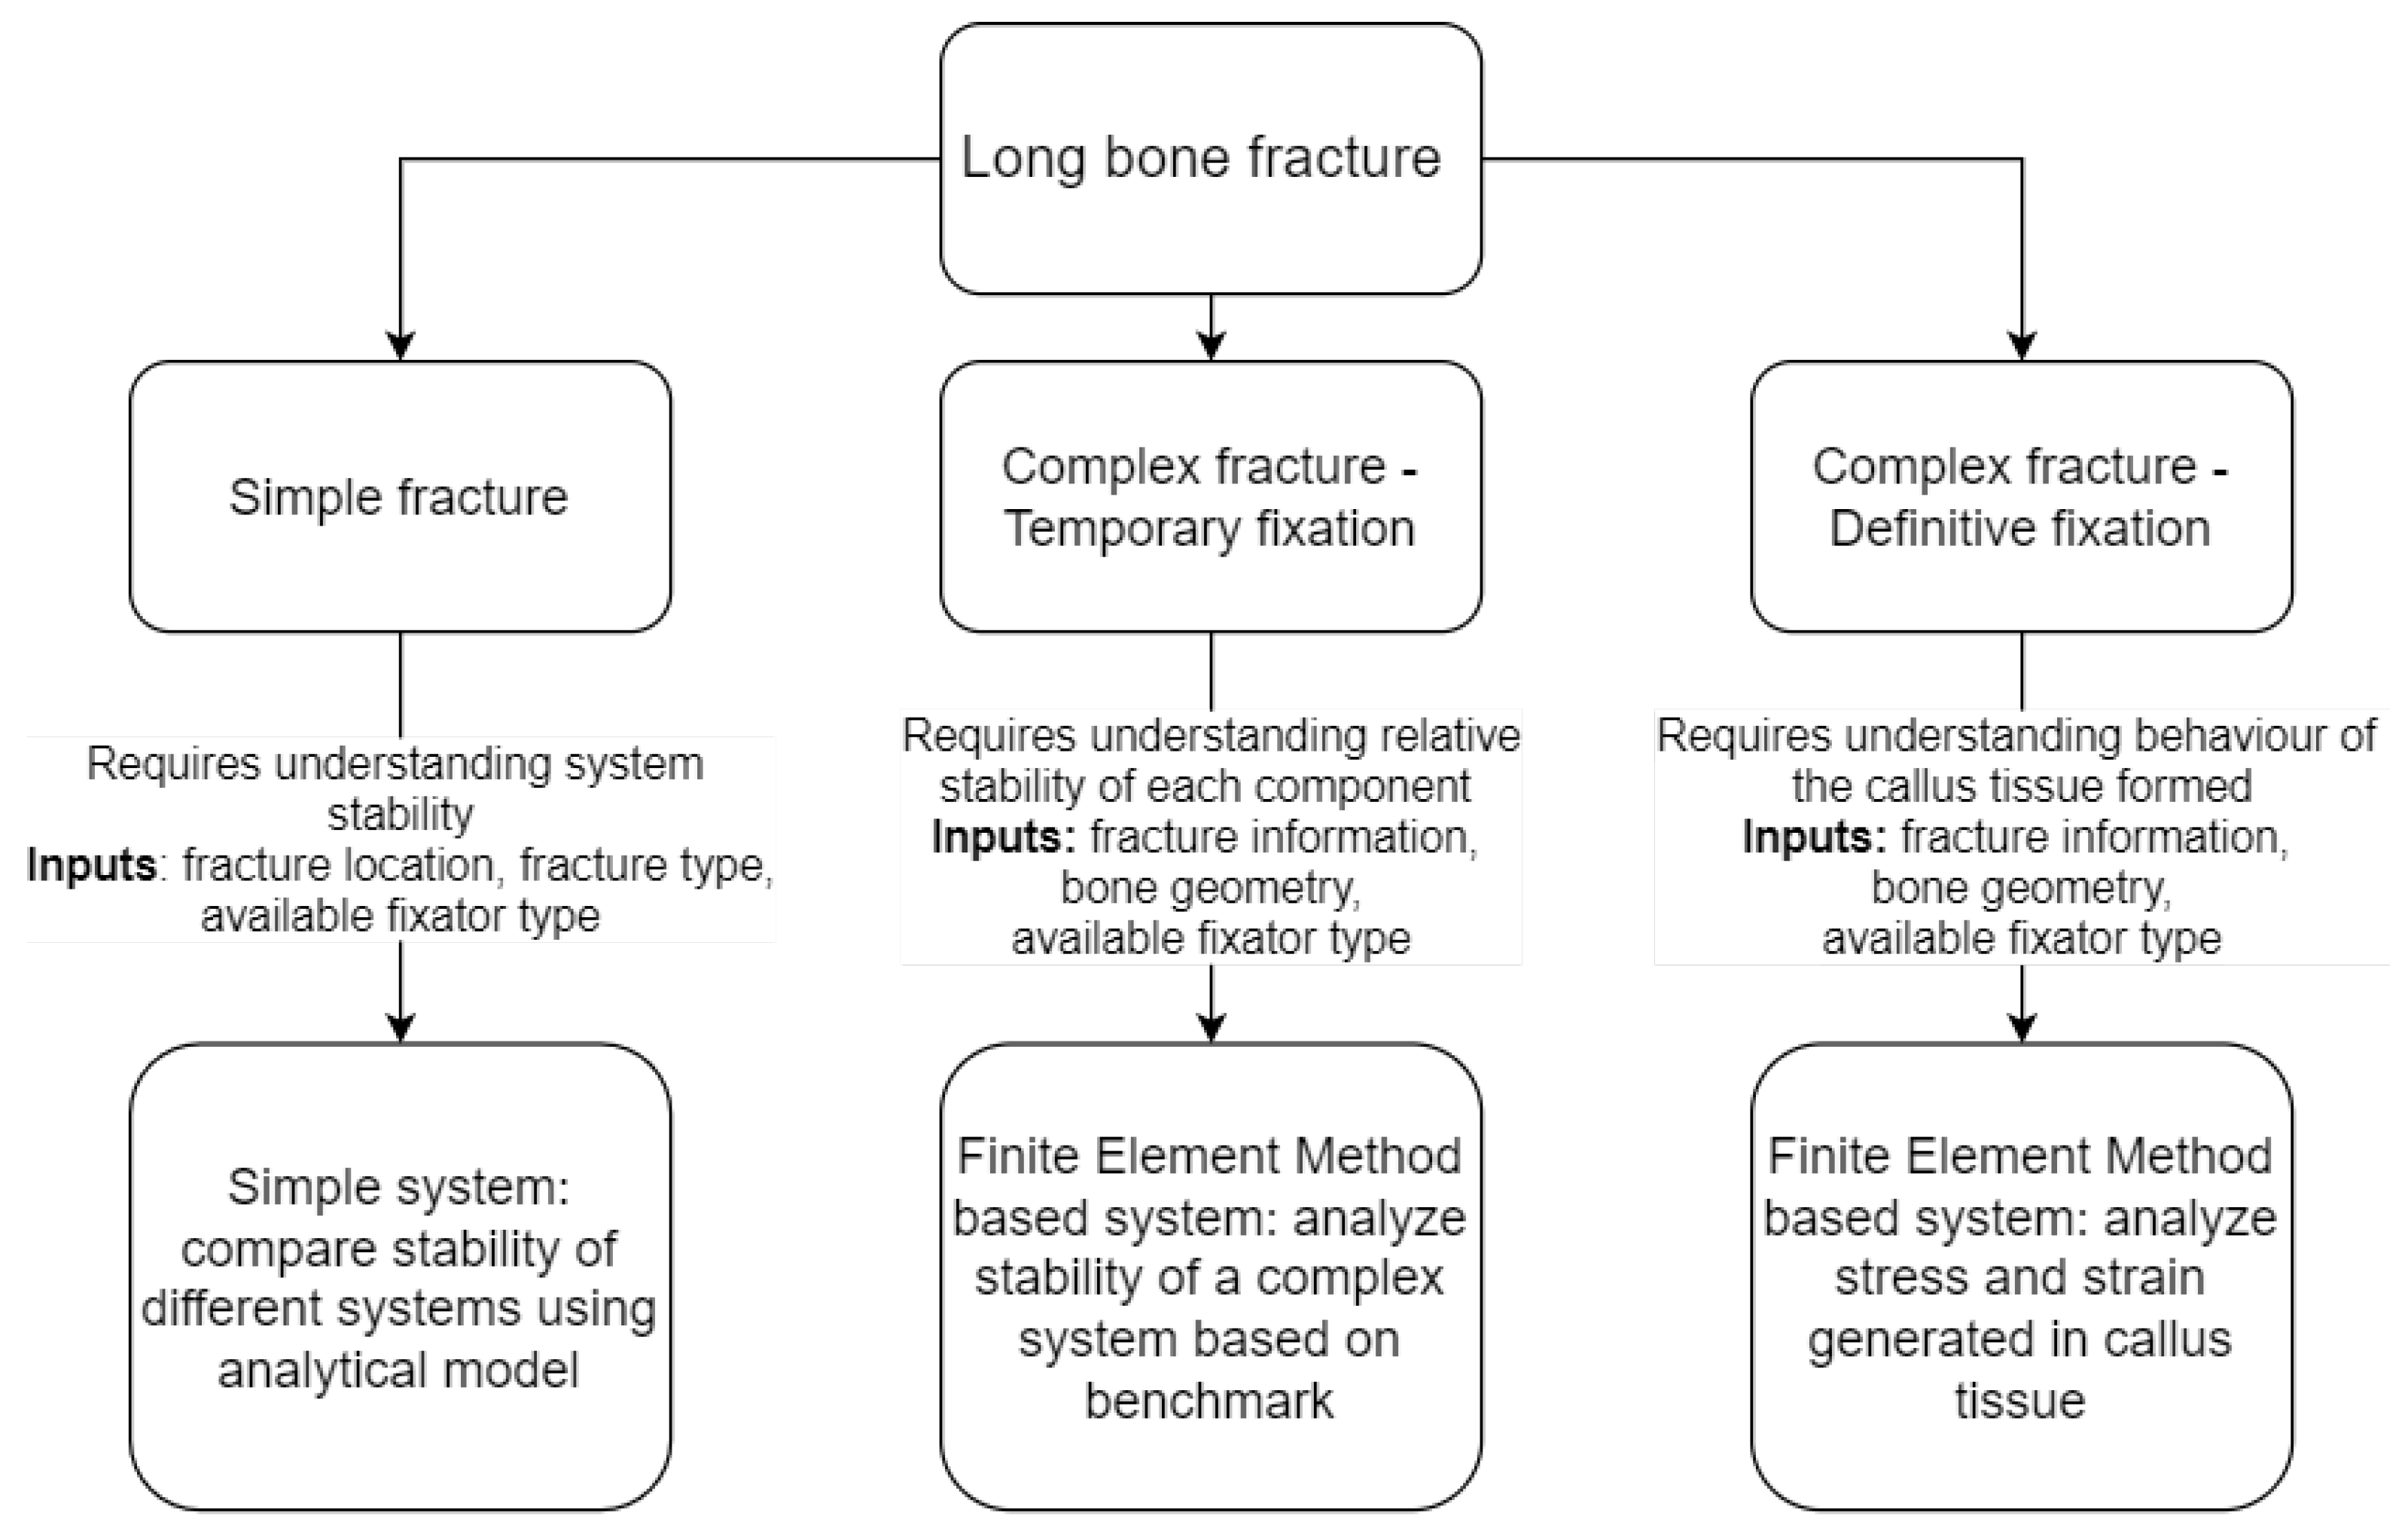
2.1. Framework Development

The framework presented in this paper consists of an integrated workflow which captures patient specific data and fixator parameters, processes the data to predict mechanical behavior of available configurations, and provide feedback to surgeons for preoperative planning. The scope will not include biological parameters and will be an assistive tool for medical practitioners to understand mechanical properties. The framework was developed based on literature and feedback obtained from practising surgeons (Figure 2). Special focus was given to reduce the cost of the solution and complexity, to be suitable for developing regions (Figure 3). As the solution is primarily focused towards developing regions higher priority was given for reducing cost involved. Simpler solution methods which do not require higher computational capacity were identified for solutions where the added accuracy is not required.
Therefore, the solution was perceived under different scenarios based on fracture complexity and specific use of fixator (i.e., temporal or definitive fixation). Improving stability of the bone and fixator system was considered for temporary fixation while improving healing potential was identified for definitive fixation.
The Muller AO/OTA (AO Foundation/Orthopaedic Trauma Association) classification was used for bone classification [46]. Even though fracture conditions vary largely, the classification provided, enables the workflow to be managed so that all scenarios are addressed.
According to the British Orthopedic Association providing stability is the main objective during temporal stabilization to facilitate soft tissue recovery in addition to promoting bone healing. They state that spanning ex-fixes are ideal for this purpose because it also provides surgeons access to perform other surgical procedures, especially to facilitate soft tissue healing [24]. The priority during definitive fixation is to promote secondary healing which requires loading and micro-motions in the callus [47], which requires a comprehensive simulation utilizing mechano-regulation (Figure 4).

2.2. Pilot Study

A pilot study was conducted using a low cost linear external fixator developed as a part of this project on a transverse diaphyseal fracture. The cost of the fixator is reduced by using simple fabrication techniques and easy to find material. The clamp assembly would include schanz pins fixed onto a hollow metal shaft using 2 circular clamps (Figure 5). Each pin clamp assembly is affixed using a nut and bolt, which needs to be tightened manually when completing the assembly. The clamps were fabricated using mild steel rods with the fixator shaft being of mild steel. In this test, a hollow steel tube (AISI 1215, Outer radius 6mm, Inner radius 4.5 mm) was used as the shaft. Standard stainless steel schanz pins were used with a diameter of 5 mm.
A mechanical testing protocol was developed to identify the properties of the fixator components: Pins, clamp system, and shaft. Data gathered from the tests were used for model creation and validation. Both simplified mathematical models and models which use finite element analysis (FEA) were developed and compared for efficacy against test results and against each other.

2.2.1. Mechanical Testing

Mechanical testing was carried out on the external fixator components in 3 stages. Tests were performed on a screw-driven mechanical testing machine (Instron 5565 Universal Testing System, Instron, High Wycombe, UK) with a 5kN load cell (Instron). Compliance test for the system was performed prior to testing with the actuator head loading directly on to the platen, which was used for compliance correction using the Bluehill software (Instron). An easy to manufacture attachment was designed and fabricated using mild steel for the pin bending and interface tests. All tests were performed in accordance with or as close to ‘ASTM F1541–17 Standard Specification and Test Methods for External Skeletal Fixation Devices’ as was possible [48].
Pin Bending Test
The pin bending test was conducted to identify pin mechanical properties. Four pins were selected and pin bending under varying (increasing) transverse loads were measured (Figure 6). The system was pre-loaded with 5 N and loaded till 60 N, at 10 mm/min.
Interface Test
The clamp pin assembly was subjected to the same transverse loading conditions as the pins were, in the pin bending test (Figure 7). Objective of this test was to understand the combined properties of the following interfaces:
  • Pin–Small Clamp;
  • Small Clamp–Large Clamp;
  • Large Clamp–Bar;
  • Nut–Small Clamp.
The tightening torque of the nut and bolt were varied to observe changes in the behavior between the interfaces. Nuts were tightened to 6 Nm, 8 Nm, 10 Nm, and 12 Nm using a torque wrench (Norbar TTi50 Torque Wrench, Banbury, UK) prior to testing. The system was preloaded with 5 N and loaded till 60 N, at 10 mm/min.
System Test
Complete systems with 4 pins fixed to bone analogues, under different configurations were subject to axial compression tests (Figure 8). homopolymer acetal (Delrin (C)) bars were used to represent simplified long bone geometry as they exhibit properties similar to natural bone [49], with measurements in the range similar to that of a tibia. Fractured bone was created by fixing schanz pins in 2 polymer bars (Delrin (c)). Distance between pins and distance between shaft and bone were varied during the tests (Figure 8) (Table 1). Pins were placed in 3 specific positions on each bone analogous shaft with the distance to the center of the fracture site varying between 45 cm, 90 cm, and 135 cm. The system was preloaded with 20 N and loaded till 200 N, at 10 mm/min.

2.2.2. Model Generation

Based on these observations 3 methods were proposed to calculate the stability of the external fixator configuration:

Pin Bending Model

Testing data from the pin bending test and interface test were used to identify the pin and clamp behavior under loading (Figure 9). Test results of pins were observed to remove anomalies. Average curves for each tightening torque were used to curve fit a nominal equation for displacement based on tightening torque and force.
Once pin behavior was modeled simple beam bending theory was applied on to the complete system (Figure 10). Deflection of the system was used to identify relative displacement of the bone interfaces.
Horizontal point on the shaft with respect to the mid-point of the fracture site is taken as the datum and assumed to be the stationary point, instead of the lowest point of the bottom bone analogous, which is attached to the testing machine bed. This was done for the ease of calculation. The displacement due to bone compression was also disregarded to simplify calculation, and number of input parameters. Therefore, total displacement:
x t o t = x s h a f t T o p + f u n c t i o n [ x p i n 1 , x p i n 2 ] + x s h a f t b o t t o m + f u n c t i o n [ x p i n 3 , x p i n 4 ]
where:
x s h a f t / 2 = x 1 1 C o s ( F 1 + F 2 ) x 1 y E I + x 1 C o s F 2 x 1 y E I
F 1 = x 1 x 1 + x 2 F , F 2 = x 2 x 1 + x 2 F
In Equation (1) a function is defined to calculate the bending of the system when 2 pins are fixed on to the same bone segment. When the system is fixed in this manner and tightened at both clamp ends, the pin-clamp system restricts bending as it would individually. This is approximated to be the minimum bending value of each pin.

Spring Model

The system is modeled using a set of parallel and serial springs (Figure 11). Pin stiffness (Kp) and shaft stiffness (Ks) were calculated assuming they were cantilever beams under bending while the axial stiffness of delrin (C) under compression was used as stiffness of the bone analogous (KN). The stiffness depends on the length of the component, while the stiffness of the pins is also a function of the force exerted on them (Figure 3).
As shaft bending occurs in a tangential plane a conversion factor (t) was defined to convert displacement along the shaft axis. A hypothetical, segmented beam was defined in a length corresponding to a length of a shaft component in the system and was subject to varying bending loads. Loss of length due to bending was calculated against bending distance. No of segments were changed to obtain more data points. Linear regression was used to create a linear relationship between these 2 parameters. Even though the relationship is clearly not a linear relationship this method was used to simplify usage in a spring model where the F = kx form is preferred. This method was replicated for all other lengths of shaft segments found in the system test (45 cm, 90 cm, 135 cm, and 180 cm) (Figure 12).
Based on initial calculations it was identified that shaft bending and compression both provided significant input to the overall deformation. Therefore, the shaft spring constant was defined as 2 springs in series with bending and compression.
K = ( K N 3 . K 1 . K S 2 . K 2 . K N 4 ) / ( K N 3 + K 1 + K S 2 + K 2 + K N 4 )
where: K 1 = ( K N 1 . K P 1 ) / ( K N 1 + K P 1 ) + ( K S 1 . K P 3 ) / ( K S 1 + K P 3 )
& K 2 = ( K N 2 . K P 2 ) / ( K N 2 + K P 2 ) + ( K S 3 . K P 4 ) / ( K S 3 + K P 4 )

Simplified FEA Model

The pin and clamp behavior observed was used to create a simplified FEA model. The pin clamp assembly was substituted with a simple pin and block to reduce the time and cost of computation. The material properties of the pin were defined to mimic a new material undergoing bi-linear hardening, to replicate the slippage occurring in the pin clamp assembly. Material properties were obtained via calculations using the interface test results and measurements obtained. These material properties were used to recreate the interface test virtually for validation. The obtained material properties were used in a FEA model of the complete system and compared against test results.
A comprehensive finite element analysis was conducted using a geometry specific model as a benchmark. The model was generated in Solidworks™ using mechanical drawings to obtain necessary geometry (Figure 13). Linear elastic isotropic material properties were applied for the material using literature and test results (Table 2). Boundary conditions provided were based on the testing protocol. Bone-pin interface was provided bonded properties while clamp, shaft, and pin interfaces amongst each other were provided a friction co-efficient of 0.6. Linear static analysis was conducted using the finite element method in the software ANSYS™. The mesh sensitivity study was conducted on the geometry specific model to identify the optimum mesh size for the system. Meshing was done in such a manner that meshes in both methods had similar refinement for the ease of comparison. No methods were used to simplify the computation specifically in one model over the other as comparison was the main objective. Displacement between the edges of the bones were measured to replicate experimental settings.

3. Results

3.1. Experimental Results

The average force deflection curves obtained during the pin bending tests (for 4 pins) and the interface tests (four torque levels, 4 pins, 4 clamp assemblies) show a slight deflection which may be caused by slippage between the interfaces (Figure 14). This is deduced as the point of deflection increases with the increase in the tightening load.
The average force deflection curves for the system tests showed slight changes between each configuration (Figure 15). Distance from clamp to bone surface was 50mm in all 6 tests while the pin placement differed.

3.2. Pin Equation Calculation

The force-deflection values for the 4 interface tests and the pin bending test were used to calculate an equation for displacement of the pin, based on the perpendicular force acting on it. Individual polynomial curve fitting was conducted for each situation to understand the form of the equation and coefficients. Each curve was assumed a polynomial and uni-variate regression was used. Aggregate RMSE values of each tightening torque in each degree of polynomial were plotted against the maximum degree of the polynomial to obtain the elbow point. A polynomial with 4 degrees was identified as optimum. Form of the equation for displacement based on force and tightening torque was postulated based on the assumption that the equations should reduce to a linear equation when torque value tends to infinity, depicting results obtained in the pin bending test: x = ( a e q τ ) F 4 + ( b e r τ ) F 3 + ( c e s τ ) F 2 + ( 0.01945 + d e t τ ) F .
Coefficients obtained during initial uni-variate regression analysis were used as starting values for the fitting to ensure global minima was obtained when fitting. Non-linear least square method was used for fitting. Final equation RMSE value was 0.1425 and adjusted R-square 0.9992. Equation for pin bending and slip in the clamp-pin interfaces (torque in Nm and Force in N):
x 1 = ( 5.33 10 ( 7 ) e 0.2376 τ ) F 4 + ( 0.001742 e 0.6249 τ ) F 3 ( 0.004182 e 0.2307 τ ) F 2 + ( 0.01945 + 0.03022 e 0.0293 τ ) F
Leading term was disregarded based on the value of the coefficient. Displacement values for each combination were calculated using Equations (1)–(3) and (5). Calculations were performed for a set of loading conditions (Figure 16).

3.3. Spring Model

A method similar to the pin equation calculation was used to understand the relationship between bending stiffness of the pin and force using data gathered from the pin bending test and the interface test. A stiffness parameter was defined based on the pin bending behavior and the slippage of the interfaces as a function of the tightening load and the bending force acting on it. Based on the shape of the curve it was decided to use average values stiffness, and disregard the deviation post slippage. Stiffness at each tightening torque was calculated both as an instantaneous value and overall value were calculate for comparison (Figure 17). Average values for stiffness were used to calculate the overall stiffness of the system.
Stiffness values obtained were used with other calculated parameters (Table 2 and Table 3) to calculate the system stiffness using Equation (4) (Figure 18).

3.4. Simplified FEA Model

The simplified model was provided boundary conditions similar to the experimental test and displacement of the top part of the bone analogous was measured against an incremental load (Figure 19).

3.5. Basic FEA Model

The geometry specific model was provided boundary conditions and mesh properties identical to the simplified model for comparison. Displacement of the top part of the bone analogous was measured against an incremental load (Figure 20).

3.6. Model Comparison

All 3 models were compared against the test results obtained for the systems and against finite element analysis results of a comprehensive model. Two aspects were considered when comparing the models:
  • Difference in results provided to the actual test results and the comprehensive FEA model;
  • Difference in the positioning of each configuration against each other against that of the test results and FEA results.
Figure 21 displays all test results plotted in a Force Vs Displacement curve (Figure 21).

4. Discussion

4.1. Computational Models

Out of the 3 proposed models and the standard FEA method used each method provided a suitable method of comparison between configurations. Each method provided a set of advantages which would specifically benefit different conditions.
The pin bending model provided a better understanding of the system identifying points through which slippage may occur. However, this behavior was not seen when 2 pins were fixed on the same bone segment as restrictions to slippage are created through geometric restriction. The proposed model is not able to identify this affect. Therefore, the assumptions made based on the interface test and the pin bending test did not hold in the system tests, creating a different shape in the test result graph and the pin bending model graph. Nevertheless the method was able to amplify the differences in the configurations increasing comparability.
Overall, the spring model provides a more robust solution that will be easy to implement in the clinical setting. The issues with the accuracy could be accounted to measurement errors and material properties used. In addition, assumptions made for simplification also play a part in the accuracy of the result. This method could provide an advantage when comparing complex constructs as extending would be easier, but would also not be able to distinguish between constructs with similar components but have different planes of loading.
The simplified FEA model reduced the computational cost greatly when compared to the comprehensive FEA model, but still did require more computation time than the previous 2 models. Accuracy was much higher, and would provide a better solution for complex geometries and other types of fixators. This also showed higher accuracy than a geometric specific FEA model. This could be mainly due to the mesh properties being optimized for the simplified model and those properties being used for the other model as well. This was done to create similar conditions to compare computational time, which showed the simplified model with a lower time.
Out of the proposed models all 3 have potential for use with the simplified FEA model being extended to complex configurations. A comparison of the different models used in this study is shown in Table 4.
Even though the study was focused towards modeling and simulating the dynamic load of a specific fixator, the procedure followed by Amaro et al. is similar to what has been followed in this study, which showcases how the study could be extended into definitive fixation with dynamic loading [49]. The differences in spring models in both studies are based on whether the callus loading is considered or not. In a definitive fixation, the fixator system undergoes loading, whereas in a temporal system focus is given to ensure system stiffness assuming there will not be any weight bearing happening through the fracture site.
Roseiro et al. suggested a different approach of comparing fixator configurations where they simplify the model into a 1D finite element model for the fixator and bone system. the authors demonstrate that the 1D approximation of a uni-planar-unilateral fixator is suitable for configuration optimization [22]. A similar model was not used in this study due to limitations in extending towards multi-planar configurations.

4.2. Workflow for Surgical Assistance

The objective of the study was to present a model for external fixator configuration optimization and test its feasibility. The pilot study, even though limited in its scope provided valuable information on the proposed method.
As the focus was on creating a low-cost solution suitable for developing regions, external fixators were considered. Linear fixators are generally used for temporary fixation to stabilize the fracture site during initial surgical care and for simple fractures. For complex fractures and fractures with significant bone loss, circular external fixation is considered a better option than a linear fixator [24].
Fracture categorization was used to reduce cost of computation where possible. Simple fractures (e.g., diaphyseal transverse fractures) would not require extensive analysis and would also be fixable using simple fixation techniques.
The framework was broken down into several steps in order to create a methodology to add external fixator information. Initially, a testing protocol was developed to identify mechanical properties of the fixator, while limiting the complexity and volume of testing. Two tests were developed to understand the main components with varying geometry and properties when comparing different fixator types. The main drawback of the developed procedure is that separate rigs were needed to be fabricated to complete testing. This issue was mitigated to a certain extent by using low cost material and simple machining techniques. Testing for standard parts like the shaft were not conducted, to reduce the number of tests. Pin testing was conducted as modeling the clamp system required understanding pin behavior. For system development pin length variation was not done: objective was to reduce the number of steps used in the testing process to ease implementation. The 2 tests were thought to be sufficient per pin and clamp type.
Simplifying testing also provided a fair share of drawbacks when modeling the system as the test results had a larger range of deviation. Multiple tests were carried out to reduce the deviation. Improving testing accuracy for tests like the system test will be required when modeling complex systems.
The test results on the low cost MK02 fixator provided valuable input on the fixator behavior. Interface tests displayed slippage during testing, which is a result of the design including 2 clamps for each pin clamp assembly, kept in place with one fixture. The results showed significant improvement of stability when tightening torque was increased. When complimented by more pins in an assembly, the fixator showed very good performance comparable with other commercially available systems. It should be noted that for a fixator of this type, tightening torque plays a very important role, especially due to the higher number of interfaces between parts. Changes in the MK02 fixator stiffness with configuration changes are similar to those seen with other linear fixators.
The pin behavior changing substantially when in a system provided an issue when modeling which required less assumptions to be made. Even though computationally the cost was not increased significantly, the model development required extensive work.
The usage of such a method in the clinical setting would provide surgeons with a better way to understand stability of a fixator configuration, but the time and effort expended from the surgeons side should be minimum in the case of temporal fixation as the main objective of temporal fixation is to stabilize the fracture immediately.
Currently surgeons in countries with developing health care systems would benefit largely from the tool proposed. Even though basic understanding of stability of a linear fixator is common knowledge, variations that could occur due to patient specific properties would require the surgeons expertise and experience. The use of a tool like the one proposed would further assist surgeons with new types of fixators with different material and system properties being developed.
When compared to other similar studies, a framework similar to this was proposed by Avsar et al. for ring fixation. In this study the framework focuses more towards generating 3D bone models for simulation and visualizing scenarios like bone lengthening, but as mentioned in the paper can be extended as a pre-planning tool, similar to that proposed in our study [50].
A similar framework was proposed for internal fixation by Varga et al. where the objective was to create an automated simulation test kit to optimize fixator design and configurations using finite element analysis [34]. In areas comparable to our study the main difference is the model simplification proposed, mainly to reduce computational cost and time.

4.3. Limitations

The main limitation of the proposed framework, identified during the study is the time taken for computation, which may not be suitable for some clinical scenarios which require immediate care. A method to deliver a solution in situations similar to that need to be identified when moving into the clinical space. Suggested options include using one of the analytical methods presented instead of the simplified FEA method and using a library of pre-simulated scenarios.
Regarding the models developed and analyzed, one of the main limitations seen in the analytical models are the assumptions and simplifications made for the ease of calculations. Another limitation of the models used is that only one main loading scenario was considered. The models developed can be updated to include loading conditions like bending and axial torsion. Difficulties faced when including other loading conditions is the requirement for additional testing and method of optimizing. Additional testing will be required for constructions made of an-isotropic material like composites, even though it could be overlooked for a majority of constructs, which are made using isotropic material like metals. Optimizing will also need to be rethought which could be solved by calculating a combined system stiffness as done by Elmedin et al. [35].

5. Conclusions

The study focused on developing a fixator configuration optimization model in a manner that would be subject specific, easy to implement, especially in a developing region, while also providing valuable information for surgeons. Such a framework to compare fixator performance would provide surgeons with a tool to understand the mechanical behavior of a fixator configuration prior to surgery. It would also provide a method for them to find different options for fixation while considering any patient specific biological factors, which may present itself. An optimized fixation configuration will provide the patient with the opportunity to reduce healing time and reduce probability of non-union, based on the available and affordable resources. Increasing efficiency of the treatment process will be economically beneficial for a developing country.
The pilot study provided valuable insight into the process which included creating a mathematical model based on 2 tests, a pin bending test, and an interface test, using a universal testing machine. The tests conducted also provided insight on the low cost MK2 fixator and its capabilities. Extending the work to include other sections identified in the model will be followed by this research.

6. Future Work

The pilot study showed the feasibility of such a system, using minimal testing. Although the system can be used to identify feasible solutions for simple fractures, the model needs to be extended for complex fractures. This would include finite element analysis and mechano-regulation of tissue. Complex configurations will need to be analyzed for the model while other fixator designs will also need to be analyzed, including ring fixators.
Another path of work would include creating a tool for surgeons to understand other features they may require for preoperative planning. Implementation policy and development of such a tool will also be needed to be looked into.

Author Contributions

Conceptualization, T.S.; Data curation, T.S.; Formal analysis, T.S.; Funding acquisition, P.S.; Methodology, T.S.; Supervision, P.S. and C.W.; Validation, T.S.; Writing—original draft, T.S.; Writing—review & editing, P.S. All authors have read and agreed to the published version of the manuscript.

Funding

This research was funded by the National Institute for Health Research (NIHR) (GHR 16/137/45) using UK aid from the UK Government to support global health research.

Data Availability Statement

The data that support the findings of this study are available from the corresponding author, upon request.

Acknowledgments

This research was funded by the National Institute for Health Research (NIHR) (GHR 16/137/45) using UK aid from the UK Government to support global health research. The views expressed in this publication are those of the author(s) and not necessarily those of the NIHR or the UK Department of Health and Social Care. The authors acknowledge Imperial College London for being a co-investigator of the project. Thiran Sellahewa wishes to thank Spencer Barnes and Michael Berthaume for designing the fixator and Spencer for assisting in mechanical testing and for Figure 8.

Conflicts of Interest

The authors declare that they have no conflict of interest. All funding sources have been disclosed in the acknowledgements.

References

  1. Amer, K.M.; Congiusta, D.V.; Suri, P.; Merchant, A.M.; Vosbikian, M.M.; Ahmed, I.H. Patient frailty as a risk assessment tool in surgical management of long bone fractures. J. Clin. Orthop. Trauma 2020, 11, S591–S595. [Google Scholar] [CrossRef]
  2. Court-Brown, C.; Rimmer, S.; Prakash, U.; McQueen, M. The epidemiology of open long bone fractures. Injury 1998, 29, 529–534. [Google Scholar] [CrossRef]
  3. Bonafede, M.; Espindle, D.; Bower, A.G. The direct and indirect costs of long bone fractures in a working age US population. J. Med. Econ. 2013, 16, 169–178. [Google Scholar] [CrossRef]
  4. ITF. Road Safety Annual Report 2017; OECD Publishing: Paris, France, 2017. [Google Scholar]
  5. Sapkota, D.; Bista, B.; Adhikari, S.R. Economic Costs Associated with Motorbike Accidents in Kathmandu, Nepal. Front. Public Health 2016, 4, 273. [Google Scholar] [CrossRef] [PubMed] [Green Version]
  6. León, A.L.; Ascuntar-Tello, J.; Valderrama-Molina, C.O.; Giraldo, N.D.; Constaín, A.; Puerta, A.; Restrepo, C.; Jaimes, F. Grouping of body areas affected in traffic accidents. A cohort study. J. Clin. Orthop. Trauma 2018, 9, S49–S55. [Google Scholar] [CrossRef] [PubMed]
  7. Oluwadiya, K.S.; Oginni, L.M.; Olasinde, A.A.; Fadiora, S.O. Motorcycle limb injuries in a developing country. West Afr. J. Med. 2004, 23, 42–47. [Google Scholar] [CrossRef] [Green Version]
  8. Aslam, M.; Taj, T.M.; Ali, S.A.; Mirza, W.A.; Badar, N. Non-fatal limb injuries in motorbike accidents. J. Coll. Physicians-Surg.-Pak. JCPSP 2008, 18, 635–638. [Google Scholar] [PubMed]
  9. Lateef, F. Riding motorcycles: Is it a lower limb hazard? Singap. Med. J. 2002, 43, 566–569. [Google Scholar]
  10. Mcgee, M.; Sharma, G. The Injury Chart Book: A Graphical Overview of the Global Burden of Injuries; World Health Organization: Geneva, Switzerland, 2002. [Google Scholar]
  11. Meling, T.; Harboe, K.; Søreide, K. Incidence of traumatic long-bone fractures requiring in-hospital management: A prospective age- and gender-specific analysis of 4890 fractures. Injury 2009, 40, 1212–1219. [Google Scholar] [CrossRef]
  12. Mirhadi, S.; Ashwood, N.; Karagkevrekis, B. Factors influencing fracture healing. Trauma 2013, 15, 140–155. [Google Scholar] [CrossRef]
  13. Mills, L.A.; Simpson, A.H.R.W. The relative incidence of fracture non-union in the Scottish population (5.17 million): A 5-year epidemiological study. BMJ Open 2013, 3, e002276. [Google Scholar] [CrossRef] [Green Version]
  14. Jones, M.S.; Waterson, B. Principles of management of long bone fractures and fracture healing. Surgery 2020, 38, 91–99. [Google Scholar] [CrossRef]
  15. Ekegren, C.L.; Edwards, E.R.; de Steiger, R.; Gabbe, B.J. Incidence, Costs and Predictors of Non-Union, Delayed Union and Mal-Union Following Long Bone Fracture. Int. J. Environ. Res. Public Health 2018, 15, 2845. [Google Scholar] [CrossRef] [Green Version]
  16. Antonova, E.; Le, T.K.; Burge, R.; Mershon, J. Tibia shaft fractures: Costly burden of nonunions. BMC Musculoskelet. Disord. 2013, 14, 42. [Google Scholar] [CrossRef] [PubMed] [Green Version]
  17. Jahagirdar, R.; Scammell, B.E. Principles of fracture healing and disorders of bone union. Surgery 2009, 27, 63–69. [Google Scholar] [CrossRef]
  18. Wang, M.; Yang, N. A review of bioregulatory and coupled mechanobioregulatory mathematical models for secondary fracture healing. Med. Eng. Phys. 2017, 48, 90–102. [Google Scholar] [CrossRef] [PubMed]
  19. Betts, D.C.; Müller, R. Mechanical regulation of bone regeneration: Theories, models, and experiments. Front. Endocrinol. 2014, 5, 211. [Google Scholar] [CrossRef] [Green Version]
  20. Marsell, R.; Einhorn, T.A. The biology of fracture healing. Injury 2011, 42, 551–555. [Google Scholar] [CrossRef] [PubMed] [Green Version]
  21. Gordon, J.E.; O’Donnell, J.C. Tibia fractures: What should be fixed? J. Pediatr. Orthop. 2012, 32, 52–61. [Google Scholar] [CrossRef] [PubMed]
  22. Roseiro, L.M.; Neto, M.A.; Amaro, A.; Leal, R.P.; Samarra, M.C. External fixator configurations in tibia fractures : 1D optimization and 3D analysis comparison. Comput. Methods Programs Biomed. 2013, 113, 360–370. [Google Scholar] [CrossRef]
  23. Padhi, N.R.; Padhi, P. Use of external fixators for open tibial injuries in the rural third world: Panacea of the poor? Injury 2007, 38, 150–159. [Google Scholar] [CrossRef]
  24. Nanchahal, J.; Nayagam, S.; Khan, U.; Moran, C.; Barrett, S.; Sanderson, F.; Pallister, I. Standards for the Management of Open Fractures of the Lower Limb; Royal Society of Medicine Press Ltd.: London, UK, 2009. [Google Scholar]
  25. Moss, D.P.; Tejwani, N.C. Biomechanics of External Fixation: A Review of the literature. Bull. Nyu Hosp. Jt. Dis. 2007, 65, 294–299. [Google Scholar]
  26. Palomares, K.T.S.; Gleason, R.E.; Mason, Z.D.; Cullinane, D.M.; Einhorn, T.A.; Gerstenfeld, L.C.; Morgan, E.F. Mechanical stimulation alters tissue differentiation and molecular expression during bone healing. J. Orthop. Res. Off. Publ. Orthop. Res. Soc. 2009, 27, 1123–1132. [Google Scholar] [CrossRef] [Green Version]
  27. Carter, D.R. Mechanical loading history and skeletal biology. J. Biomech. 1987, 20, 1095–1109. [Google Scholar] [CrossRef]
  28. Dell’Oca, A.F. External Fixation. In AO Principles of Fracture Management; Rüedi, T.P., Murphy, W.M., Eds.; Thieme: New York, NY, USA, 2000; Chapter 3.3.3; pp. 233–248. [Google Scholar]
  29. Kempson, G.E.; Campbell, D. The comparative stiffness of external fixation frames. Injury 1981, 12, 297–304. [Google Scholar] [CrossRef]
  30. Rigal, S.; Merloz, P.; Le Nen, D.; Mathevon, H.; Masquelet, A.C. Bone transport techniques in posttraumatic bone defects. Orthop. Traumatol. Surg. Res. 2012, 98, 103–108. [Google Scholar] [CrossRef] [PubMed] [Green Version]
  31. Salai, M.; Horoszowski, H.; Pritsch, M.; Amit, Y. Primary reconstruction of traumatic bony defects using allografts. Arch. Orthop. Trauma Surg. 1999, 119, 435–439. [Google Scholar] [CrossRef]
  32. Robinson, C.M.; McLauchlan, G.; Christie, J.; McQueen, M.M.; Court-Brown, C.M. Tibial fractures with bone loss treated by primary reamed intramedullary nailing. J. Bone Jt. Surgery. Br. Vol. 1995, 77, 906–913. [Google Scholar] [CrossRef] [Green Version]
  33. Keating, J.F. The management of fractures with bone loss. J. Bone Jt.-Surg.-Br. Vol. 2005, 87-B, 142–150. [Google Scholar] [CrossRef] [PubMed] [Green Version]
  34. Varga, P.; Inzana, J.A.; Gueorguiev, B.; Südkamp, N.P.; Windolf, M. Validated computational framework for efficient systematic evaluation of osteoporotic fracture fixation in the proximal humerus. Med. Eng. Phys. 2018, 57, 29–39. [Google Scholar] [CrossRef]
  35. Elmedin, M.; Vahid, A.; Nedim, P.; Nedžad, R. Finite Element Analysis and Experimental Testing of Stiffness of the Sarafix External Fixator. Procedia Eng. 2015, 100, 1598–1607. [Google Scholar] [CrossRef] [Green Version]
  36. Oken, O.F.; Yildirim, A.O.; Asilturk, M. Finite element analysis of the stability of AO/OTA 43-C1 type distal tibial fractures treated with distal tibia medial anatomic plate versus anterolateral anatomic plate. Acta Orthop. Traumatol. Turc. 2017, 51, 404–408. [Google Scholar] [CrossRef]
  37. Meng, L.; Zhang, Y.; Lu, Y. Three-dimensional finite element analysis of mini-external fixation and Kirschner wire internal fixation in Bennett fracture treatment. Orthop. Traumatol. Surg. Res. 2013, 99, 21–29. [Google Scholar] [CrossRef] [PubMed] [Green Version]
  38. Sternick, M.B.; Dallacosta, D. Relationship between rigidity of external fixator and number of pins: Computer analysis using finite elements. Rev. Bras. Ortop. 2012, 47, 646–650. [Google Scholar] [CrossRef] [PubMed] [Green Version]
  39. Toumanidou, T.; Spyrou, L.A.; Aravas, N. A Finite Element Model of the Ilizarov Fixator System. In Proceedings of the 10th International Workshop on Biomedical Engineering, Kos, Greece, 5–7 October 2011; pp. 11–14. [Google Scholar]
  40. Roland, M.; Tjardes, T.; Otchwemah, R.; Bouillon, B.; Diebels, S. An optimization algorithm for individualized biomechanical analysis and simulation of tibia fractures. J. Biomech. 2015, 48, 1119–1124. [Google Scholar] [CrossRef]
  41. Dahmen, T.; Roland, M.; Tjardes, T.; Bouillon, B.; Slusallek, P.; Diebels, S. An automated workflow for the biomechanical simulation of a tibia with implant using computed tomography and the finite element method. Comput. Math. Appl. 2015, 70, 903–916. [Google Scholar] [CrossRef]
  42. Anderson, D.D.; Thomas, T.P.; Campos Marin, A.; Elkins, J.M.; Lack, W.D.; Lacroix, D. Computational techniques for the assessment of fracture repair. Injury 2014, 45, S23–S31. [Google Scholar] [CrossRef] [PubMed] [Green Version]
  43. Gómez-Benito, M.J.; García-Aznar, J.M.; Kuiper, J.H.; Doblaré, M. Influence of fracture gap size on the pattern of long bone healing: A computational study. J. Theor. Biol. 2005, 235, 105–119. [Google Scholar] [CrossRef] [PubMed]
  44. Kim, S.H.; Chang, S.H.; Jung, H.J. The finite element analysis of a fractured tibia applied by composite bone plates considering contact conditions and time-varying properties of curing tissues. Compos. Struct. 2010, 92, 2109–2118. [Google Scholar] [CrossRef]
  45. Zamani, A.R.; Oyadiji, S.O. Theoretical and Finite Element Modeling of Fine Kirschner Wires in Ilizarov External Fixator. J. Med. Devices 2010, 4, 031001. [Google Scholar] [CrossRef] [Green Version]
  46. Kellam, J. Fracture Classification. In Techniques and Principles for the Operating Room; Porteous, M., Susanne, B., Eds.; Principles of Trauma Care; AO Publishing: Davos, Switzerland, 2010; Chapter 2; pp. 114–121. [Google Scholar]
  47. Ghiasi, M.S.; Chen, J.; Vaziri, A.; Rodriguez, E.K.; Nazarian, A. Bone fracture healing in mechanobiological modeling: A review of principles and methods. Bone Rep. 2017, 6, 87–100. [Google Scholar] [CrossRef] [PubMed]
  48. ASTM Standard F1541. Specification and Test Methods for External Skeletal Fixation Devices; ASTM International: West Conshohocken, PA, USA, 2003; Available online: https://www.astm.org/Standards/F1541.htm (accessed on 11 September 2021).
  49. Martins, A.A.; FÃtima, P.M.; Manuel, R.L.; Augusta, N.M. The Effect of External Fixator Configurations on the Dynamic Compression Load: An Experimental and Numerical Study. Appl. Sci. 2020, 10, 3. [Google Scholar] [CrossRef] [Green Version]
  50. AvÅŸar, E.; Ãœn, K. Automatic 3D modeling and simulation of bone-fixator system in a novel graphical user interface. Inform. Med. Unlocked 2016, 2, 78–91. [Google Scholar] [CrossRef] [Green Version]
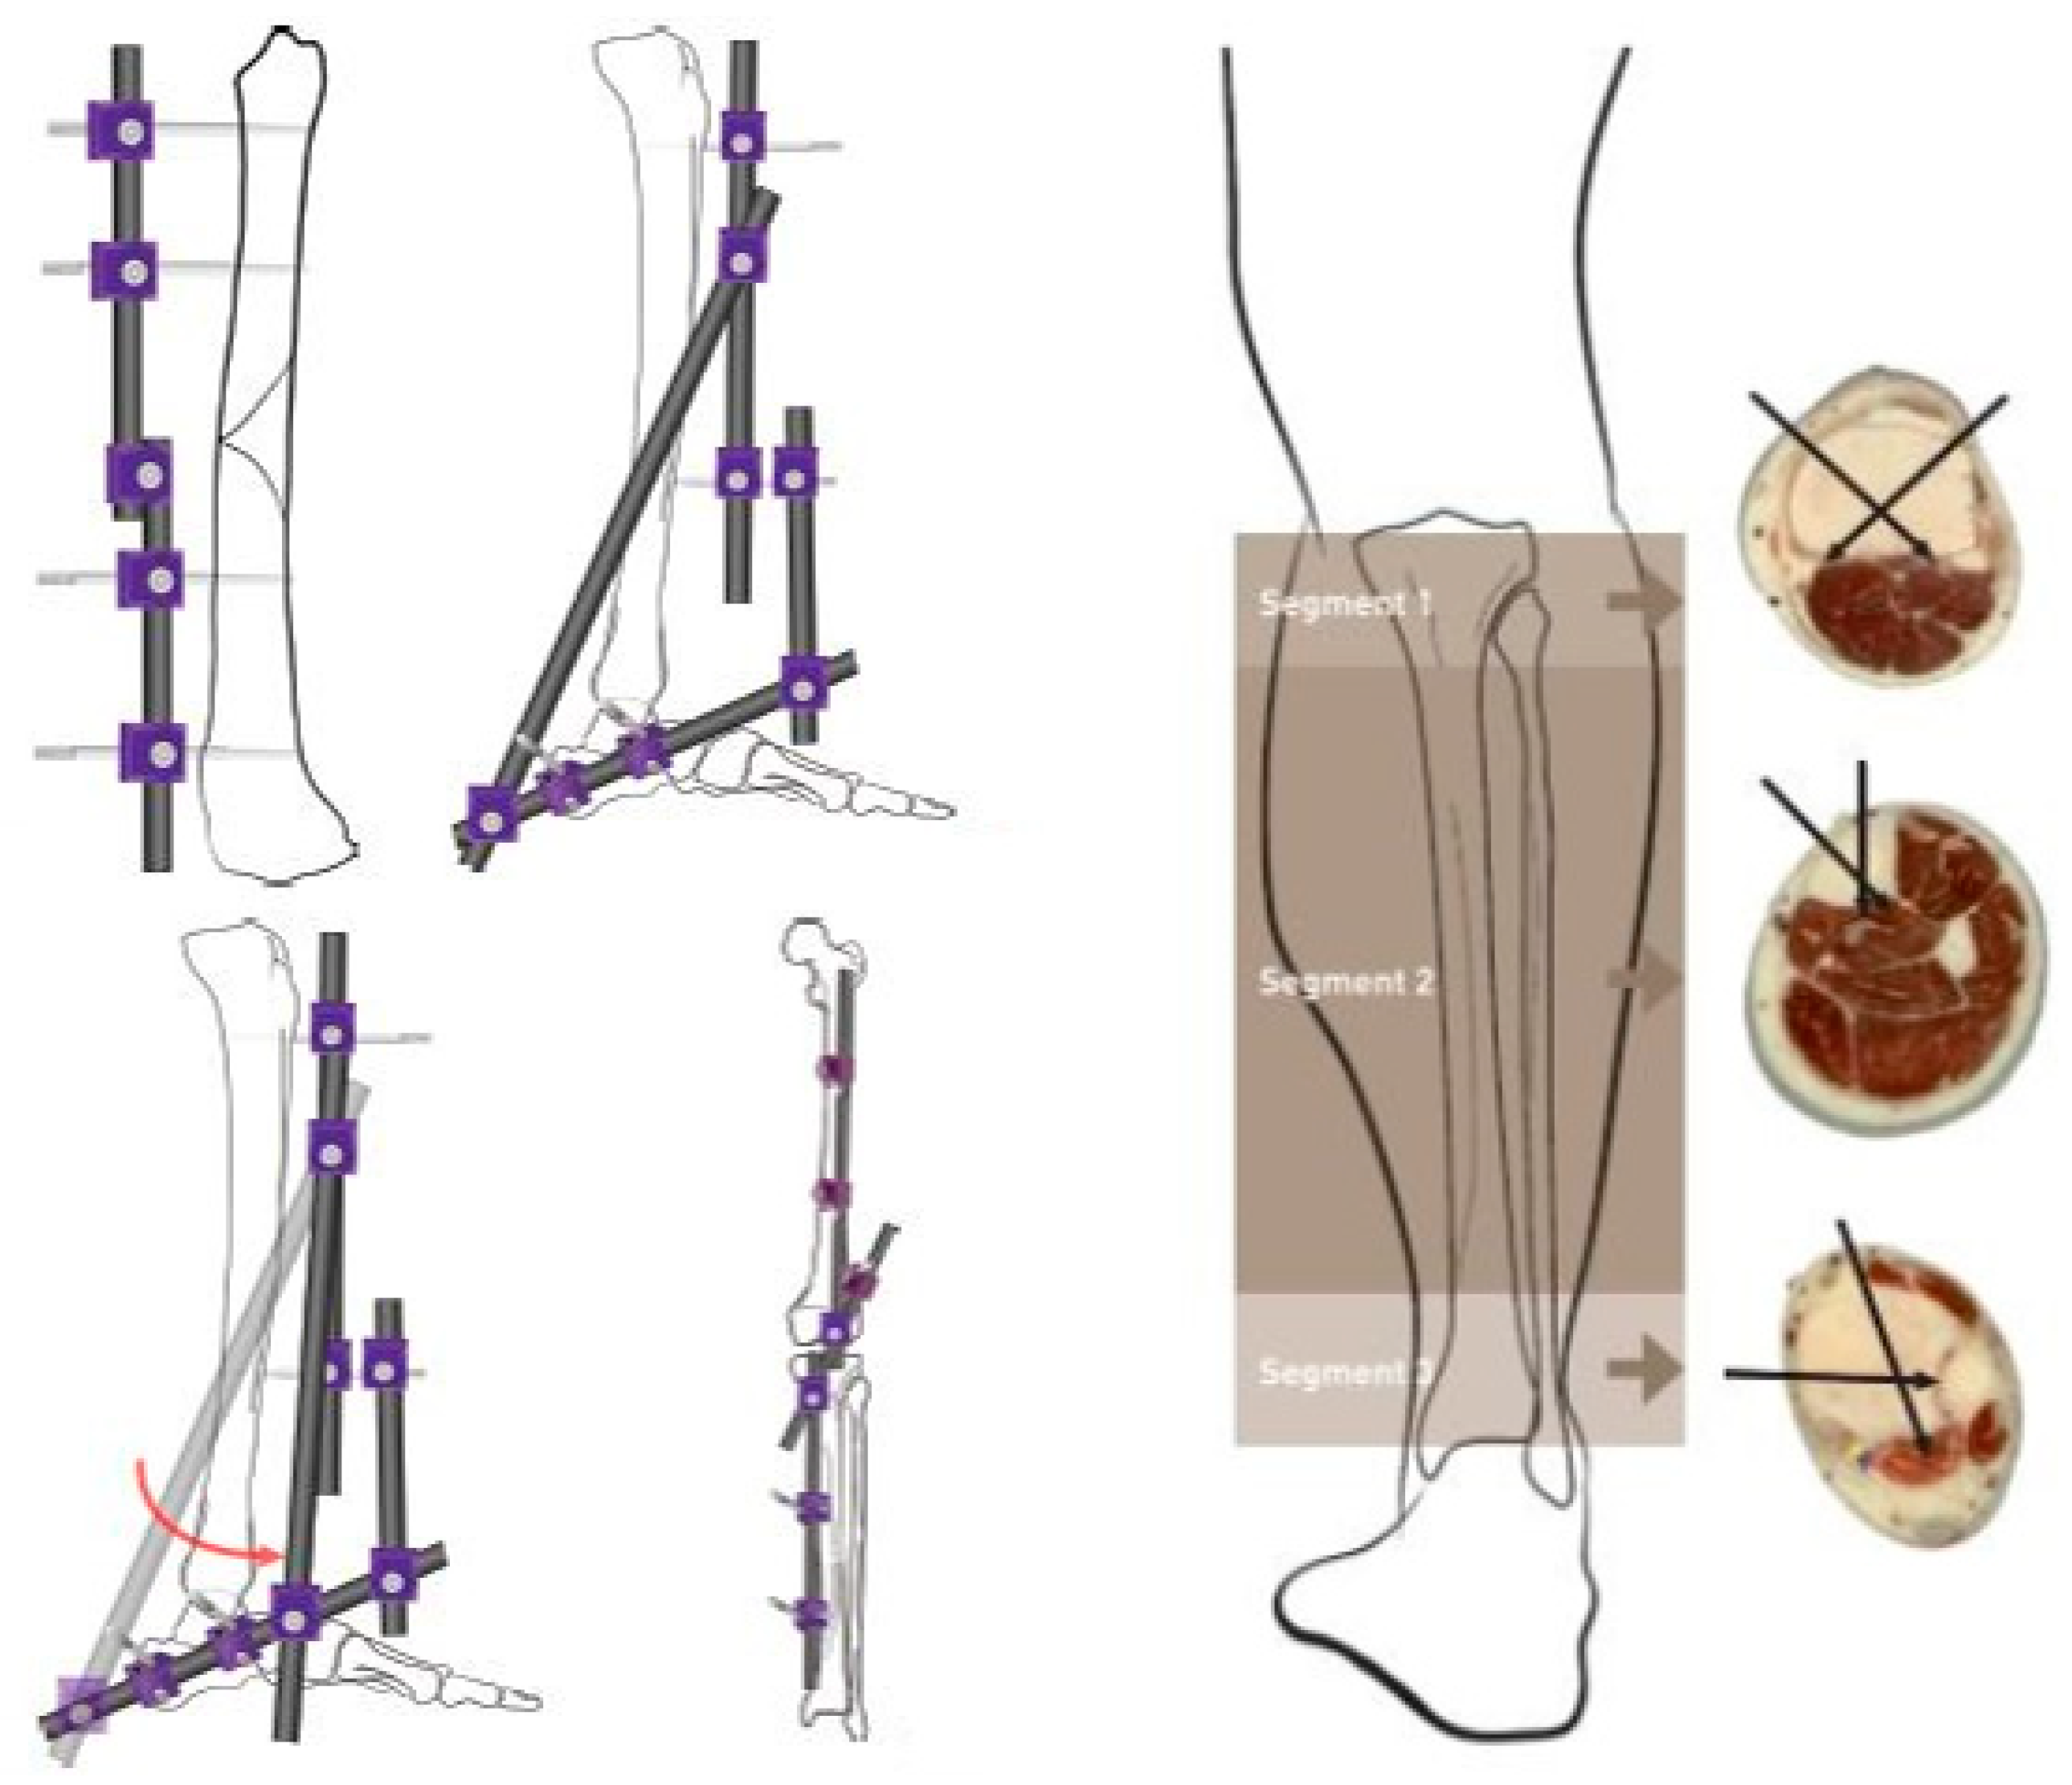
Figure 1. Left-Several types of linear fixation configurations used in tibial fractures. Right-Safe corridor for pin placement on the Tibia [24]. The image is from the Standards for the management of open fractures of the lower limb (2009) by the British Association of Plastic Reconstructive and Aesthetic surgeons and the British Orthopaedic Association and is reproduced with permission from the lead author and publisher.
Applsci 11 08481 g001
Figure 2. Integrated workflow of the proposed framework.
Applsci 11 08481 g002
Figure 3. Optimized framework for developing regions, reducing complexity in instances where simplification is possible.
Applsci 11 08481 g003
Figure 4. Solution breakdown based on fracture type and fixation requirement.
Applsci 11 08481 g004
Figure 5. Low cost fixator used for study.
Applsci 11 08481 g005
Figure 6. Diagram of pin bending test. The schanz pin is fixed on to the instron base using a testing block and the actuator provides a loading perpendicular to the pin axis.
Applsci 11 08481 g006
Figure 7. Diagram of interface test. The schanz pin is fixed on to the instron base using the 2 clamps used in the pin clamp assembly. The actuator provides a loading perpendicular to the pin axis.
Applsci 11 08481 g007
Figure 8. Top: Diagram of system test. Bottom: Pin placement options used in the system test. positions 1, 2, 3 are 45, 90 and 135 mm from the fracture site, respectively.
Applsci 11 08481 g008
Figure 9. Simplified model for pin and clamp assembly behaviour under normal load, based on the results of both pin bending and interface tests.
Applsci 11 08481 g009
Figure 10. Simplification of system. System is divided into 2 sections from the mid-point of the fracture. x1-vertical distance from mid-point of fracture site to center of pin 1. x2-vertical distance from mid-point of fracture site to center of pin 2. F1, F2-vertical force acting on each pin.
Applsci 11 08481 g010
Figure 11. Simplified system. Spring constants of each segment calculated based on their material properties and type of deformation. N-Bone analogous, P-Pin, and S-Shaft.
Applsci 11 08481 g011
Figure 12. Top: Segmented model with each segment considered a stiff shaft with no deformation and 2D simulation. Bottom: scatter plot of vertical displacement due to bending(y) and length reduction horizontally (x). Regression lines: Beam length 180 cm (Red), 135 cm (Magenta), 90 cm (Blue), and 45 cm (Black).
Applsci 11 08481 g012
Figure 13. Meshed models for finite element analysis using the simplified model and geometry specific model.
Applsci 11 08481 g013
Figure 14. Results of the pin bending (Blue) and interface tests. Tightening load 6 Nm (Green), 8 Nm (Red), 10 Nm (Dark Blue), and 12 Nm (Black).
Applsci 11 08481 g014
Figure 15. System test behavior for each configuration. Configuration 1—Magenta, Configuration 2—Red, Configuration 3—Blue, Configuration 4—Green, Configuration 5—Cyan, Configuration 6—Black.
Applsci 11 08481 g015
Figure 16. Simulated behavior of configurations, using pin bending model. Configuration 1—Magenta, Configuration 2—Red, Configuration 3—Blue, Configuration 4—Green, Configuration 5—Cyan, Configuration 6—Black.
Applsci 11 08481 g016
Figure 17. Variation of stiffness coefficient with load for different tightening loads (6 Nm—Magenta, 8 Nm—Blue, 10 Nm—Red, 12 Nm—Black) and for test when pin is fixed to testing block. Dashed lines—Actual values, Solid lines—Approximated values.
Applsci 11 08481 g017
Figure 18. Force displacement graph generated using calculated spring coefficients. Configuration 1—Magenta, Configuration 2—Red, Configuration 3—Blue, Configuration 4—Green, Configuration 5—Cyan, Configuration 6—Black.
Applsci 11 08481 g018
Figure 19. Force displacement graph based on FEA results of simplified model. Configuration 1—Magenta, Configuration 2—Red, Configuration 3—Blue, Configuration 4—Green, Configuration 5—Cyan, Configuration 6—Black.
Applsci 11 08481 g019
Figure 20. Force displacement graph based on FEA results. Configuration 1—Magenta, Configuration 2—Red, Configuration 3—Blue, Configuration 4—Green, Configuration 5—Cyan, Configuration 6—Black.
Applsci 11 08481 g020
Figure 21. Predictive models versus test results. Spring Model (*-) , Simplified FEA (– ), Pin Bending Model (–), FEA (*–) and Test Results (**). Configuration 1—Magenta, Configuration 2—Red, Configuration 3—Blue, Configuration 4—Green, Configuration 5—Cyan, Configuration 6—Black.
Applsci 11 08481 g021
Table 1. List of configurations tested and pin placement position in each configuration.
ConfigurationBone Segment 1Bone Segment 2Representation
Configuration 1Near-Mid (1 and 2)Near-Mid (1 and 2)2-1–1-2
Configuration 2Near-Far (1 and 3)Near-Far (1 and 3)3-1–1-3
Configuration 3Mid-Far (2 and 3)Mid-Far (2 and 3)3-2–2-3
Configuration 4Near-Mid (1 and 2)Near-Far (1 and 3)2-1–1-3
Configuration 5Near-Mid (1 and 2)Mid-Far (2 and 3)2-1–2-3
Configuration 6Near-Far (1 and 3)Mid-Far (2 and 3)3-1–2-3
Table 2. Material properties of each component, used for simulations and calculations.
ComponentMaterial TypeMaterial Properties Used
ClampsAISI 1215 SteelE = 210 GPa , G = 80 GPa , ν = 0.3
ShaftAISI 1215 SteelE = 210 GPa , G = 80 GPa , ν = 0.33
PinsAISI 316L Stainless SteelE = 200 GPa , G = 79.05 GPa , ν = 0.265
Bone analogousHomopolymer Acetal (Delrin ©)E = 3.1 GPa , G = 2.9 GPa , ν = 0.32
Pin + Clamp simplification (for simplified model)Defined bi-linear isotropic hardening metalE1 = 96.88 GPa , Yield Strength = 134 MPa, E2 = 52 GPa , ν = 0.3
Table 3. Spring constants for each component segment.
Spring ConstantSegmentDeformation Type ConsideredFunction ofCalculation
KN1, KN2, KN3, KN4Bone analogousCompressionMaterial type (compression modulus-B), Cross sectional area-A, Length of segment – lK = (B*A)/l
KP1, KP2, KP3, KP4Pin + ClampBendingPin clamp assembly behavior is modeled to a function of load based on the experimental resultsK = F(f)
KS1, KS2, KS3ShaftBending and compressionMaterial type (Young’s modulus-E), Second moment of area across the cross-section-I, Length of segment – l, conversion coefficient-t K s A = ( 3 E I t ) / l 3
K s B = ( B A ) / l
Table 4. Model comparison.
MethodComputational Cost and Computation TimeDevelopment ComplexityAccuracySimplicity in Being Extended to Other Fixator Forms
Pin bending modelLowHighLowComplex
Spring modelLowMediumMediumSimple
Simplified FEA ModelMediumMediumHighComplex
FEA ModelHighLowHighMedium
Publisher’s Note: MDPI stays neutral with regard to jurisdictional claims in published maps and institutional affiliations.

