Article

Moisture-Induced Pattern of Gases and Physicochemical Indices in Corn Straw and Cow Manure Composting

1
College of Resources and Environmental Sciences, Gansu Agricultural University, Lanzhou 730070, China
2
Gansu Provincial Key Laboratory of Aridland Crop Science, Gansu Agricultural University, Lanzhou 730070, China
3
Department of Soil Science, Faculty of Agriculture, University for Development Studies, Tamale 03720, Ghana
*
Author to whom correspondence should be addressed.
Appl. Sci. 2021, 11(18), 8493; https://doi.org/10.3390/app11188493
Submission received: 19 August 2021 / Revised: 8 September 2021 / Accepted: 9 September 2021 / Published: 13 September 2021

Abstract

:
This study investigated the altering effect of moisture on the emission pattern of gases and the evolutionary dynamics of physicochemical indices in corn straw and cow manure composting. Exploring this effect was reasonable to unravel the use of moisture as a cheap alternative to control gaseous emissions and improve the final properties of compost. The nutrient dynamics of the compost showed 21.6% losses in total organic carbon content, with a 33.3% increase in total nitrogen content at the end of composting. All the gases (CH4, CO2, N2O and NH3) yielded a common emission pattern despite the differences in moisture content. Except for CH4, the peak and stable emission periods of all the gases were observed on the 5th day (thermophilic phase) and after the 27th day (late mesophilic phase) of composting, respectively. Emission reductions of 89%, 91%, 95% and 100% were recorded for CH4, CO2, N2O and NH3, respectively, during the late mesophilic phase of composting. From the study, the 65% moisture content was efficient in reducing the loss rate of the gasses and nutrient contents of the compost. This study would enable farmers to channel organic residues generated into compost while minimizing pollution and nutrient losses associated with the composting process.

1. Introduction

Agricultural development through crop and animal intensification increases the huge problem of bio-waste production in China. Most importantly, the livestock industry, combined with the resilience of grain production enterprises, are dominant forces behind the extensively generated waste in the region [1]. Recent exploratory studies on waste development have identified cattle manure (900 million tons) and straw yield (551 million tons) as contributors to over 50% of the agriculturally solicited waste [2]. In addition to these surpassing volumes, cattle manure is anticipated to reach two-thirds (63–88 Mt/y) of all animal excrements generated by 2030 [3], with a 4% yearly aggravation in straw yield [4,5]. Composting remains an economical and effective transformation technique for this enormous generation of organic wastes [6]. Organic materials that are efficiently transformed into compost are devoid of odor, accumulated leachates and pathogens, and they can serve as soil conditioners and nutrient sources for plant growth [7,8]. Value addition, coupled with nutrient stability of the end product, is ensured through composting [9]. Despite the attributed importance and effectiveness of composting, this technique is adversely impacted by gaseous (CH4, CO2, NH3 and N2O) emissions under improper management systems [10]. The gases discharged have often been the cause of exponential losses of carbon (70–90%) and nitrogen (80–88%) that affect the stability of the compost [11].
Many factors, including moisture, oxygen, temperature, pH, particle size, C/N ratio and bulk density, affect the process of composting and the compost product [12]. However, moisture remains the proxy on which the effect of all other factors hinges. Metabolic and physiological activities that influence substrate decomposition and nutrient mineralization revolve around moisture [13,14]. Water at its adequacy level in decomposing materials ensures a good balance between oxygen production and oxidation processes [15]. Nonetheless, insufficient moisture content influences pile dehydration and slows down biological processes [16]. Labile and anoxic conditions established during composting also result from insufficient and excess moisture utilization [17,18]. Although these instances seemingly affect the composting process, a comprehensive mechanism surrounding the dynamics of moisture on the emission patterns of gases is less understood due to the diversified range of moisture regimes that have been reported from one study to another [19,20]. This has created inconsistencies and uncertainties in the adoption and use of moisture as a tool in emission control. Relatively, every organic material has unique physical, chemical and biological characteristics that make its relationship with water possible [21]. However, this aspect has generally been ignored, and hence the discrepancies identified in various reports.
In addition, attempts have been made to reduce gaseous emissions through the use of acidic materials other than alkaline and neutral materials like water [10,22]. Although some acidic materials used in composting have been found to be effective in reducing emissions, most tend to compete with microorganisms that are involved in the decomposition process, thereby rendering them inactive and ensuring their death [22,23]. Moreover, the materials that are used in pile acidification are expensive and often not employed under resource-poor conditions. With huge capital costs incurred in composting, participation of resource-poor parties may decline, leading to the abandonment of waste in the open environment and resulting in detrimental ecological effects [24]. Water, by contrast, is widely available, inexpensive and could have a high reduction effect on the emission rate of gasses as well as on nutrient losses under well-managed composting conditions [19,21].
Northeast China is an important grain growing area (about 19.3%) in China [25]. However, post-harvest burning of crop straw (maize straw, rice straw, wheat straw and potato straw) is commonly practiced by farmers despite its importance in compost production and livestock management [25,26]. Most farmers in the region prepare their land for the next cropping season by burning, which influences seasonal air pollution and causes hazy weather through the release of particulate matter (PM2.5) and other gaseous precursors (soot, nitrogen oxides, sulfur dioxide and polycyclic aromatic hydrocarbons) [27]. Composting with an appropriate moisture content would be a promising technique to reduce post-harvest burning while improving the air quality in the ecological zone. The knowledge gained from the study would enable farmers to consider organic residues as important resources for composting and minimize gaseous emissions and nutrient losses that often beset the composting process.

2. Materials and Methods

2.1. Study Area and Test Materials

The pilot-scale research was conducted at Gansu Agricultural University in China during the winter season with nine bioreactors of the same dimensions. The ambient temperature and relative humidity were maintained at an average of 16.2 ± 0.23 °C and 60%, respectively. Organic materials involving dairy cattle manure and corn straw formed the heap composition for the study (Table 1). The dairy-bedded waste was from the fecal heap site of Lanzhou Yili Dairy Company Limited in China, whereas the corn straw was acquired from a local maize cropping field in Yuzhong County, China. Natural air drying until reaching a constant mass was provided to the raw materials before assessing the physicochemical indices of each and their mixtures. The key constituents of the stockpile, based on the dry weight of the raw materials, have been summarized in Table 1.

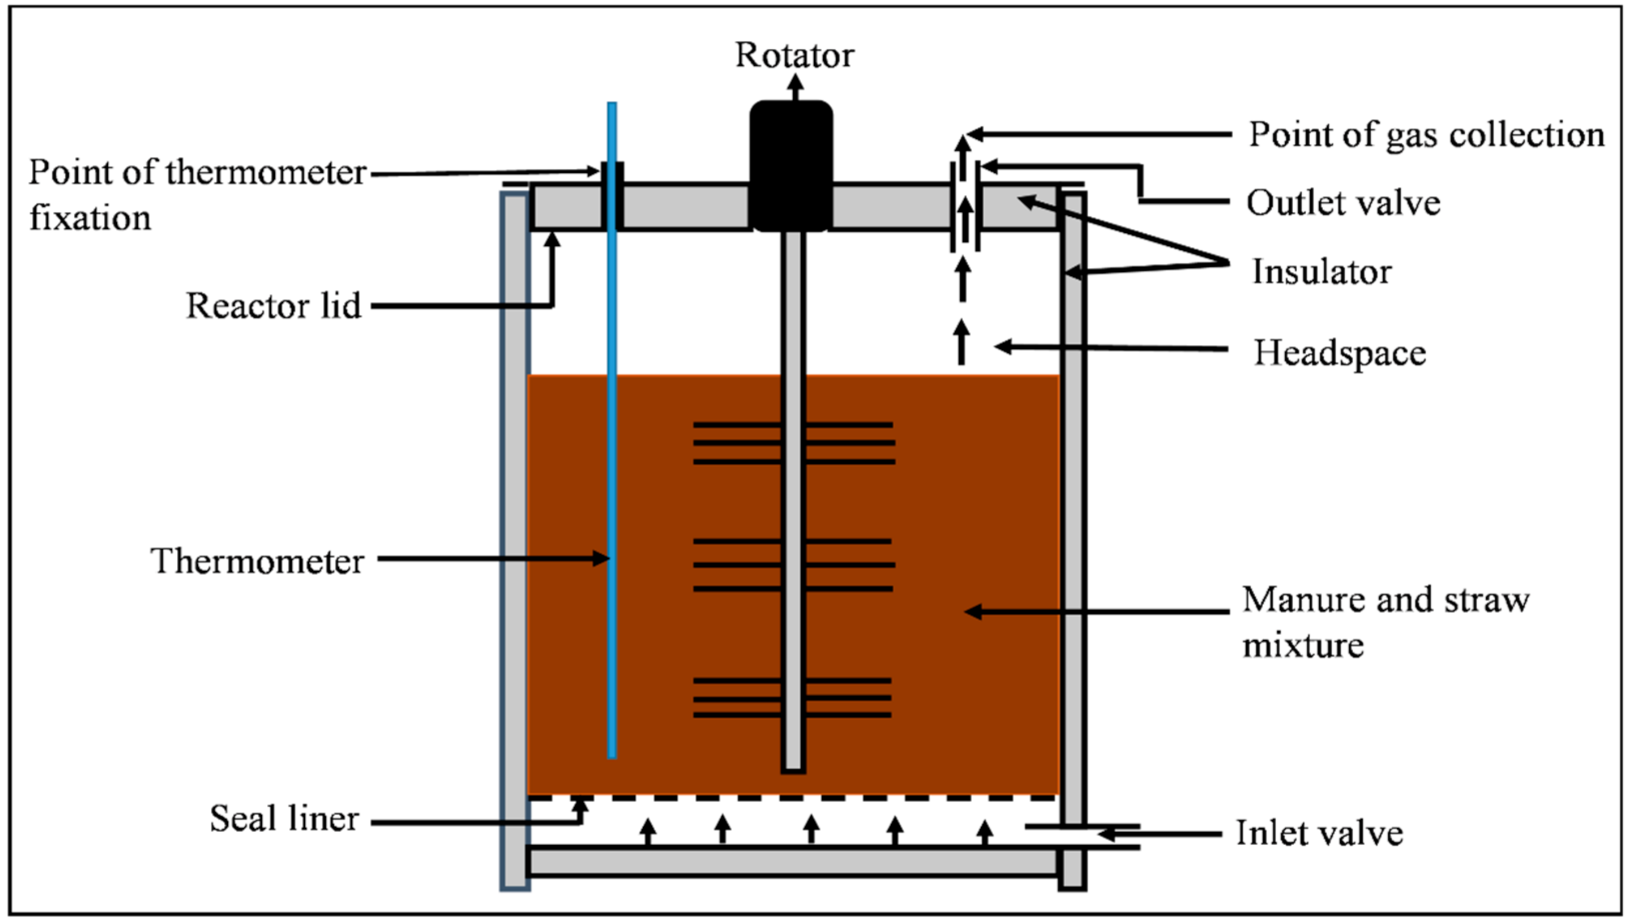
2.2. Composting Vessels and Processes

This study explicitly followed the procedures highlighted by Zang et al. [30]. The composting experiment was conducted in nine installed bioreactors, each with a design volume of 60 L (0.36 m internal diameter and 0.60 m internal height). The reactors were cylindrical vessels coated on the outside with double-layer stainless steel to prevent heat loss. An inlet valve fixed at the base of each reactor served as the recipient route of oxygen into the decomposing materials. Two outlets embedded in the lid of the reactors served as the collection point of the gasses and the area for affixing the thermometer. A 5-mm thick seal liner, placed about 5 cm above the inlet valve, ensured the delivery and homogenization of the air pumped into the reactor systems. Figure 1 illustrates the schematic diagram of the composting reactor.
To begin the formulation and composting processes, the corn straw was milled to 120.0 ± 6.21 mm in length, whereas the cow manure was hand-pressed into smaller units (20.0 ± 2.21 mm). The raw materials were exposed to the natural air while monitoring the moisture content of each material. After attaining a constant mass, the corn straw (bulking material) and cow manure were loaded into a commercial mixing machine and rotated to homogenize and ensure a uniform mixture. Distilled water was added to adjust the initial moisture values of the feedstock to 45% (MC1), 55% (MC2) and 65% (MC3). The mixing machine was stopped during the application of water and switched on after application. The formulated piles were then served into the reactors to begin the digestion process. An airflow rate of 0.4 Lmin−1 (10 min on and 10 min off) was supplied to the reactors, and manual turnings were performed to enhance pile mixing and good oxygenation during the period of composting. The substrate temperature was recorded directly from the programmable control unit (PCU), which controlled the operations of the reactor. The composting process was considered physically complete when the temperature values of the decomposing piles were almost identical to the ambient temperature (16.2 ± 0.23 °C).

2.3. Experimental Sampling and Sampling Protocol

The three moisture treatments (45%, 55% and 65%) were laid out in a completely randomized design with three replicates. The moisture levels were designated as MC1, MC2 and MC3 for 45%, 55% and 65%, respectively. Sampling was carried out daily to obtain a broad and comprehensive picture of the influence of moisture on the measured parameters. Fresh solid samples and gasses (CH4, CO2, N2O and NH3) were collected during the sampling period. On average, 100 g of fresh solid samples were collected from different locations in each reactor and grouped according to the treatments. Each treatment sample was then homogenized and divided into two parts: one part for natural air drying and the other part, refrigerated at 4 °C. The air-dried samples were then ground and sieved through a 0.25-mm mesh for nutrient component analysis.
Greenhouse gasses (CH4, CO2 and N2O) and ammonia (NH3) were also sampled daily from the headspace of the reactor. A period of 20 min (0, 5, 10, 15 and 20) was used for the collection of greenhouse gasses, but for ammonia, that depended on the time of the color change of the boric acid solution. A polypropylene syringe device (200 mL) was fitted to a three-way valve via rubber tubes for the collection of GHGs. The collected GHGs were immediately transferred into a 300-mL aluminum foil gas bag (Ningbo Hongpu Technology Co., Ltd., Hangzhou, China) for quantification. The NH3 gas was trapped with a boric acid solution (2%) and titrated with sulfuric acid (0.1 molL−1).

2.4. Analytical Methods and Calculation

The samples collected during the composting process were analyzed for their ammonium-nitrogen (NH4+-N) and nitrate-nitrogen (NO3-N) concentrations, pH, organic matter (OM), total nitrogen (TN) and total organic carbon (TOC). The air-dried samples were evaluated for TN, TOC, matrix pH and EC, while the fresh samples were evaluated for their NH4+-N and NO3-N concentrations. These parameters were measured according to the Chinese national standard for organic fertilizer testing (NY525-2002) [28,29]. An elemental analyzer (Vario Macro Cube, Germany) was used for the determination of the TN and TOC. The values obtained for TOC determination were multiplied by 1.724 to obtain the OM content. Extracts were prepared for the determination of the matrix pH, EC, NH4+-N and NO3-N. The pH and EC of the dry samples were determined by mixing with deionized water at a ratio of 1:10 (w/v). The mixture was spun on a shaker for 30 min, allowed to settle and then analyzed using an MP521 pH/EC meter (Shanghai, China) [31]. The same procedure was followed for NH4+-N and NO3-N, but in this case, fresh solids and 2 M potassium chloride (KCl) solution were used. The extracts obtained were analyzed using a segmented flow analyzer (Technicon Autoanalyser System, Germany) [32]. The concentration of the GHGs was quantified using a gas chromatograph (Agilent 7890A, Agilent Technologies, Palo Alto, CA, USA) equipped with a flame ionization detector (FID) and an electron capture detector (ECD) [33]. Gases with detection volumes of 15 mL were injected and detected within a time frame of 10 min [34]. The injector and column conditions under which the chromatograph device was operated were 250 °C and 350 °C, respectively. The electron capture detector (ECD) was used for the analysis of N2O-N, while the flame ionization detector (FID) was used for the analysis of CH4-C and CO2-C. Purified N2 was the carrier gas for the chromatograph machine. Emissions were calculated using the ideal gas law equation [35], expressed as
E m i s s i o n   r a t e = d C d t P 0 P 1 273 T + 273 M M 22.41 V O M 60   min
where d C d t is the concentration of the gas over the development of time (ppm min−1), P 0 is the air pressure supplied during composting (hPa), P 1 is the air pressure at sea level (1013 hPa), T is the temperature in the reactor at the time of sampling (°C), MM is the molar mass of the compounds (CH4-C = 16.04 g mol−1, CO2-C = 44.01 g mol−1, N2O-N = 44.02 g mol−1 and NH3-N = 17.03 g mol−1), 22.41 L mol−1 is the ideal gas volume, V is the total volume of the reactor (L) and OM is the initial organic matter content (kg). Cumulative emissions were calculated by adding the daily emission rates of the gases (CH4, CO2, N2O and NH3) over the entire composting period. The daily emission rates and cumulative emission rates were expressed as per unit initial mass of organic matter (g CH4-C or g CO2-C kg−1 initial OM and g N2O-N or g NH3-N kg−1 initial OM).
All measurements were performed in triplicate, and the results were processed using Microsoft Excel (version 2016). To analyze variations within treatments and between treatment means, analysis of variance (ANOVA) was used with the help of the IBM Statistical Package for Social Sciences (version 22). The means between treatments were separated at probability values less than 5%. Figures were generated using GraphPad Prism (version 8.0), and the mean errors were presented as ± standard error (n = 3).

3. Results

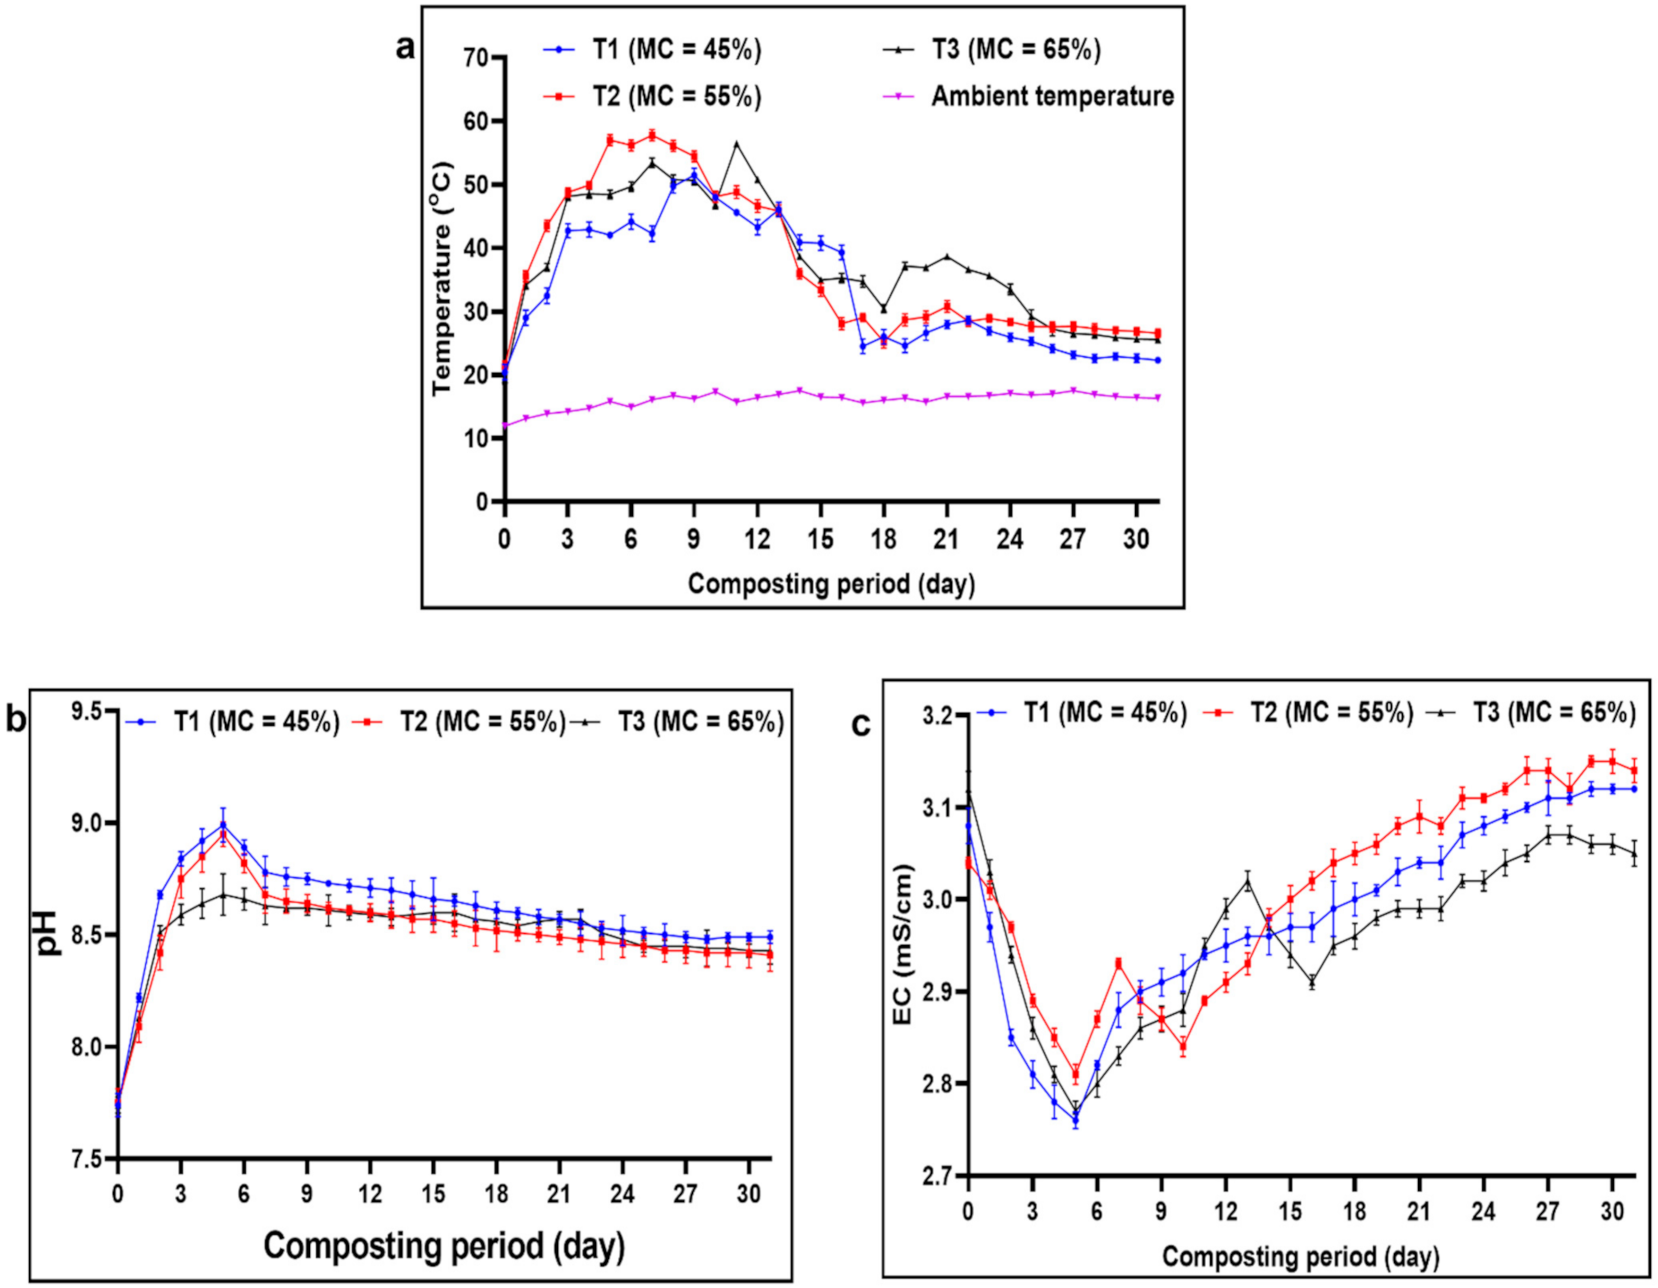
3.1. Temperature, Matrix pH and EC Variations

The daily temperatures varied significantly (p < 0.01) between moisture regimes. The thermal profile of the piles increased gradually within the first 8 days and then decreased with increasing duration. As shown in Figure 2a, the ambient temperatures ranged between 11.9 and 17.5 °C throughout the decomposition process. All treatments, except MC1 (45%), adopted an active thermophilic (>50 °C) phase on day 3 with varying inclination peaks: day 7 for MC2 (57.8 °C), day 9 for MC1 (51.5 °C) and day 11 for MC3 (56.7 °C). The thermophilic and initial mesophilic phase temperatures were higher for MC at 55% and 65% than at 45%. The piles that were formulated at a 55% moisture content maintained temperatures above 50 °C for 7 days. In general, the performance of the wettest (MC = 65%) treatment provided the greatest temperature increase throughout the composting period.
The results for the matrix pH differed significantly (p < 0.01) with the moisture levels, despite the similarity in the pattern of evolution (Figure 2b). The pH of the compost piles gradually increased from a minimum of 7.7 to a maximum of 8.5 within the first 5 days. All treatments decreased in pH after reaching their peak values. The peak pH on day 5 coincided with the peak in temperature. The difference in pH between day 5 (9.0, 8.9 and 8.6) and day 31 (8.5, 8.4 and 8.4) was 0.5 for MC1, 0.5 for MC2 and 0.2 for MC3. An average pH value of 8.6 was obtained from the combined treatments after composting.
As shown in Figure 2c, all treatments showed a significant difference (p < 0.02) in response to EC. The EC values were generally high during the initial (3.0 mS/cm) and late (3.1 mS/cm) periods of composting. Although the EC values were high, those observed on day 5 were comparatively low (2.8 mS/cm). The differences in EC between day 5 (2.8 mS/cm, 2.8 mS/cm and 2.8 mS/cm) and day 31 (3.1 mS/cm, 3.1 mS/cm and 3.0 mS/cm) were 0.3 mS/cm, 0.3 mS/cm and 0.2 mS/cm for MC1, MC2 and MC3, respectively. An alternating pattern was observed between the pH and EC during the composting process (Figure 2b,c).

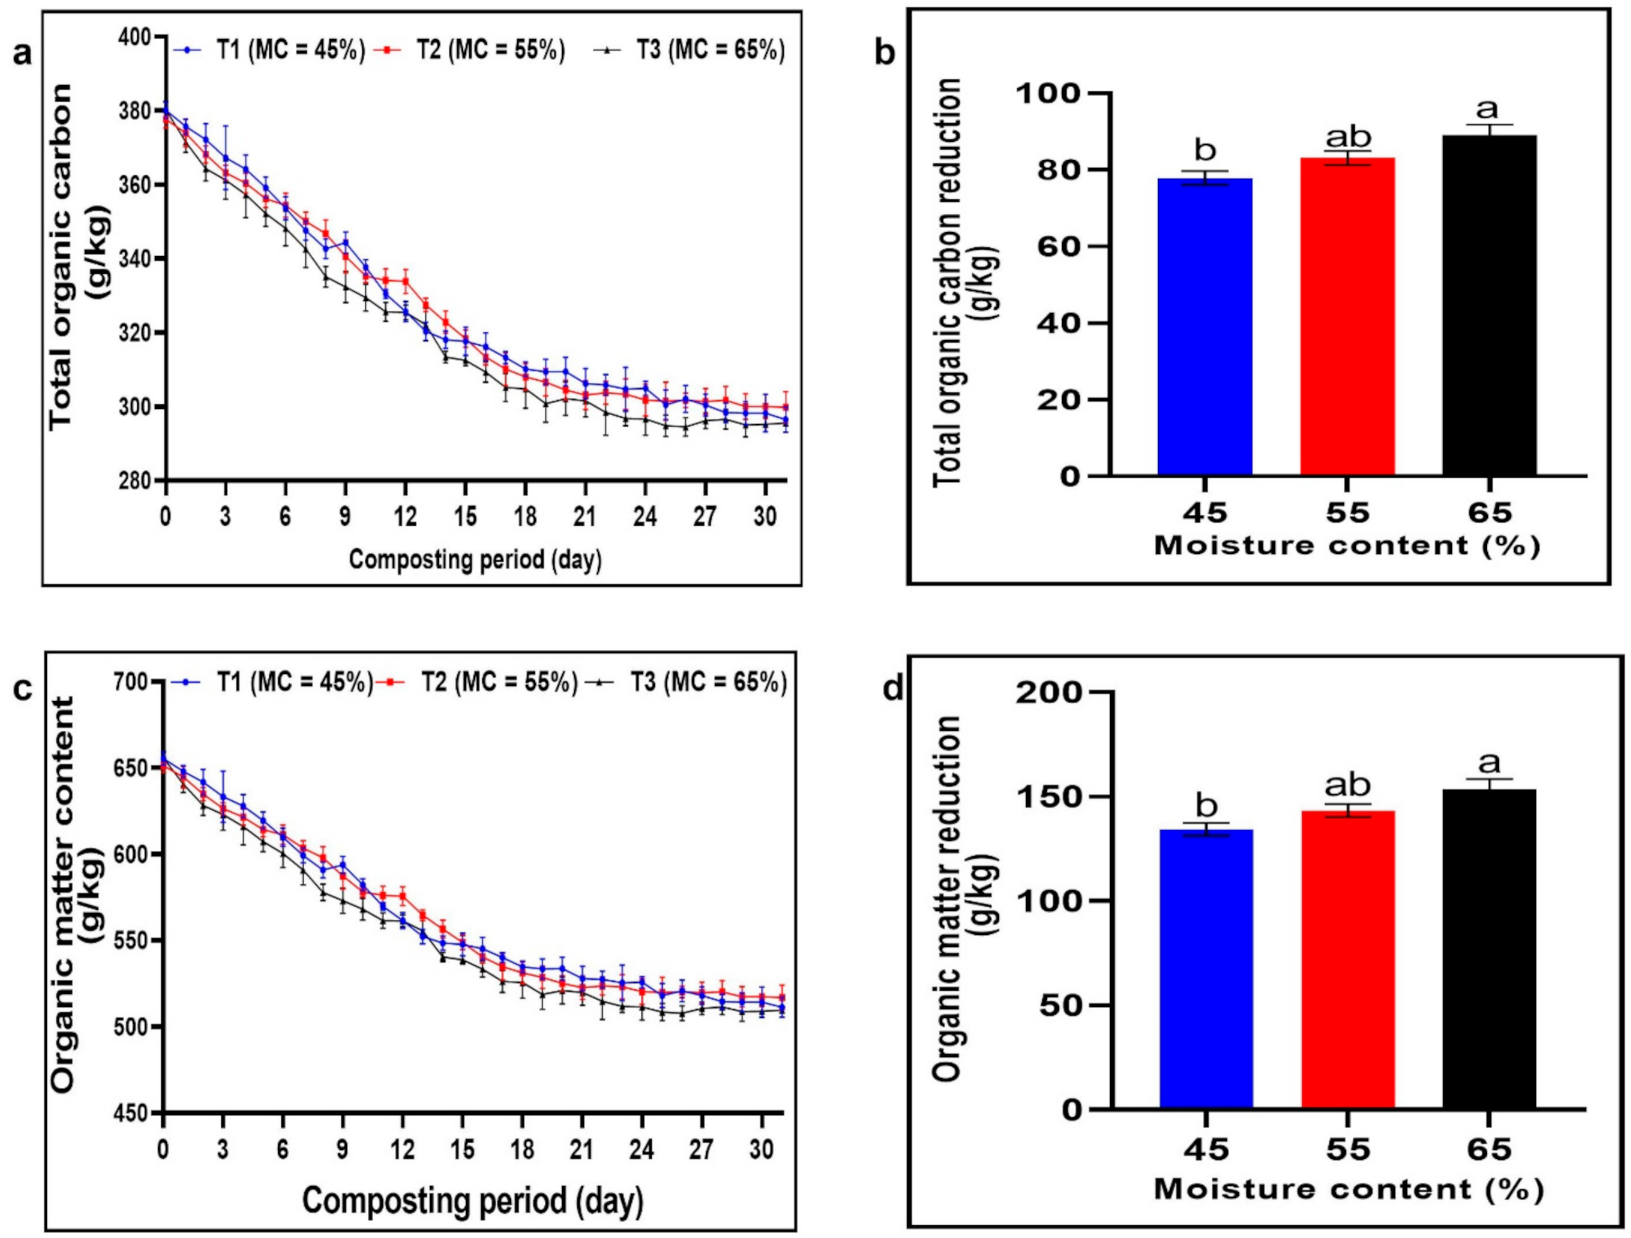
3.2. Total Organic Carbon and Organic Matter Variations

Similar evolution patterns were recorded for the total organic carbon (Figure 3a,b) and organic matter (Figure 3c,d). There was a continuous decrease in total organic carbon (TOC) from the initial composting period (379.3 g/kg) to the final period (297.3 g/kg). On average, 82.0 g/kg of TOC was lost, representing a 21.6% reduction from the initial value. However, despite the continuous decrease, the TOC differed significantly (p < 0.03) between the moisture levels. Compost piles with 45% moisture content (329 g/kg) recorded the highest mineralization in TOC, while piles with 65% MC (325.7 g/kg) recorded the least. In general, decreases in TOC content corresponded to increases in moisture content.
Temporally, through the decomposition process, the organic matter (Figure 3c,d) content of the stockpile tended to decrease, manifesting a similar profile as the TOC (Figure 3a,b). The organic matter content initially decreased from 654.0 g/kg to a minimum of 513.0 g/kg during the maturation period. The organic matter content varied significantly (p < 0.03) between moisture treatments, with large differences occurring between the 45% and 65% moisture contents. The loss in organic matter content was high for the moisture content of 65% (153.5 g/kg), but less in the moisture content of 45% (134.3 g/kg).

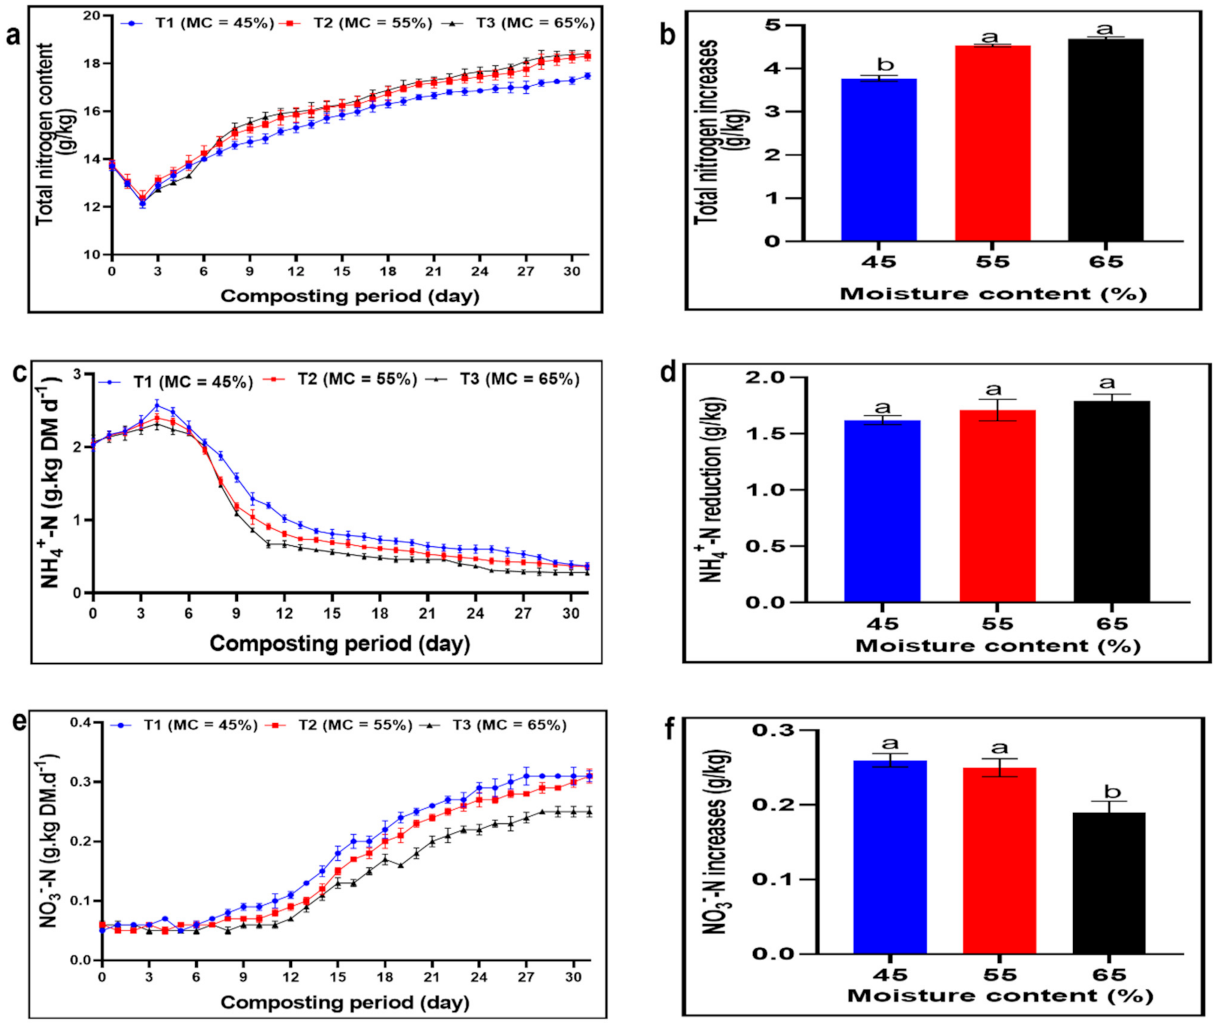
3.3. Variations in Total Nitrogen, Ammonium and Nitrate

The total nitrogen content of the digesting piles varied significantly (p < 0.04) in response to the moisture treatments. As shown in Figure 4a,b, the TN content was initially low but increased with increases in composting period and moisture content. Subjecting the piles to a 65% moisture regime retained more total nitrogen (5.7 g/kg (35.6%)) than the piles provided with 55% and 45% moisture. The total N content displayed at the end of the composting process increased by 33.3% (5.3 g/kg) from the initial value.
The ammonium nitrogen (NH4+-N) concentrations of all the treatments showed an increasing trend within the first 4 days. However, a decreasing trend began on the fifth day and continued as the decomposition period progressed (Figure 4c,d). The peak values were recorded on the 4th day and ranged between 2.2 g/kg and 2.5 g/kg. On the contrary, low NH4+-N values were observed on the 31st day and ranged between 0.2 g/kg and 0.3 g/kg. After the entire digestion process, piles formulated at a 65% moisture content had the lowest NH4+-N concentration and the highest reduction rate. In general, the NH4+-N concentration reduced by 83% (1.7 g/kg) at the end of composting.
Relative to the declining profile of NH4+-N (Figure 4c), the content of NO3-N (Figure 4e,f) increased during the decomposition process, corresponding to progress in the composting period. The peak NO3-N concentration was 66.7% (0.3 g/kg) greater than it was in the primary stage (0.1 g/kg) of composting. All the treatments showed a gradual increase in NO3-N on day 6, but that for the MC at 45% was slightly higher than the MC at 55% and 65%. The NO3-N concentration displayed an increasing trend of 0.2 g/kg > 0.2 g/kg > 0.3 g/kg for moisture regimes at 65%, 55% and 45%, respectively. At the end of composting, the NO3-N concentration increased by 79.3% (0.2 g/kg) between the three moisture levels.

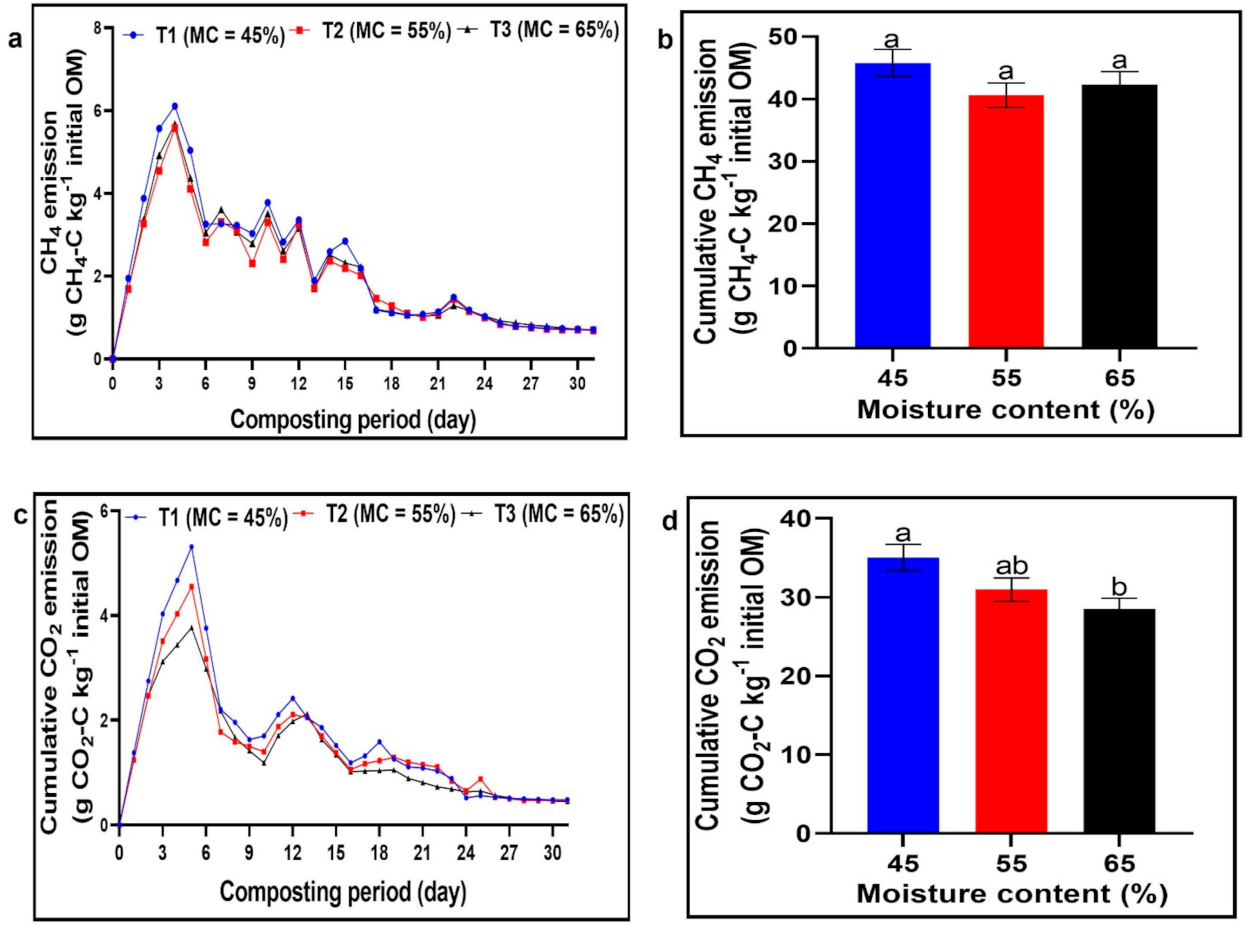
3.4. Emission Dynamics of Methane and Carbon Dioxide

All moisture levels showed similar emission patterns for CH4, with high emissions observed on day 4 (Figure 5a,b). There was a gradual increase in CH4 emissions from the start of composting to day 4 (peak) and a gradual decrease after this period until the end of the composting process. Emission rates of 6.1 g/kg, 5.7 g/kg and 5.6 g/kg were observed as the peak values for MC1, MC2 and MC3, respectively. The combined treatments showed an emission reduction of 89.0% at the end of the decomposition process (Figure 5b). Although CH4 losses occurred in all treatments, the observed loss rate was much higher in the treatment with the lowest moisture content (MC = 45%). Between the GHGs, the emission rate and cumulative emissions were high for CH4.
CO2 fluxes varied significantly (p < 0.01) with time and by moisture regime during the assessment period (Figure 5c,d). All moisture levels displayed sharp increases in CO2 on day 5 and then remained low for the rest of the composting period. The 45% MC resulted in the highest emission rate (5.3 g/kg), followed by 55% (4.6 g/kg) and 65% (3.8 g/kg). Relative to the composting periods, the rate of CO2 emission was low between day 7–10 and day 24–31. The combined effect of the moisture treatments showed a reduction rate of 91% (≈4.1 g/kg) during the maturation period.

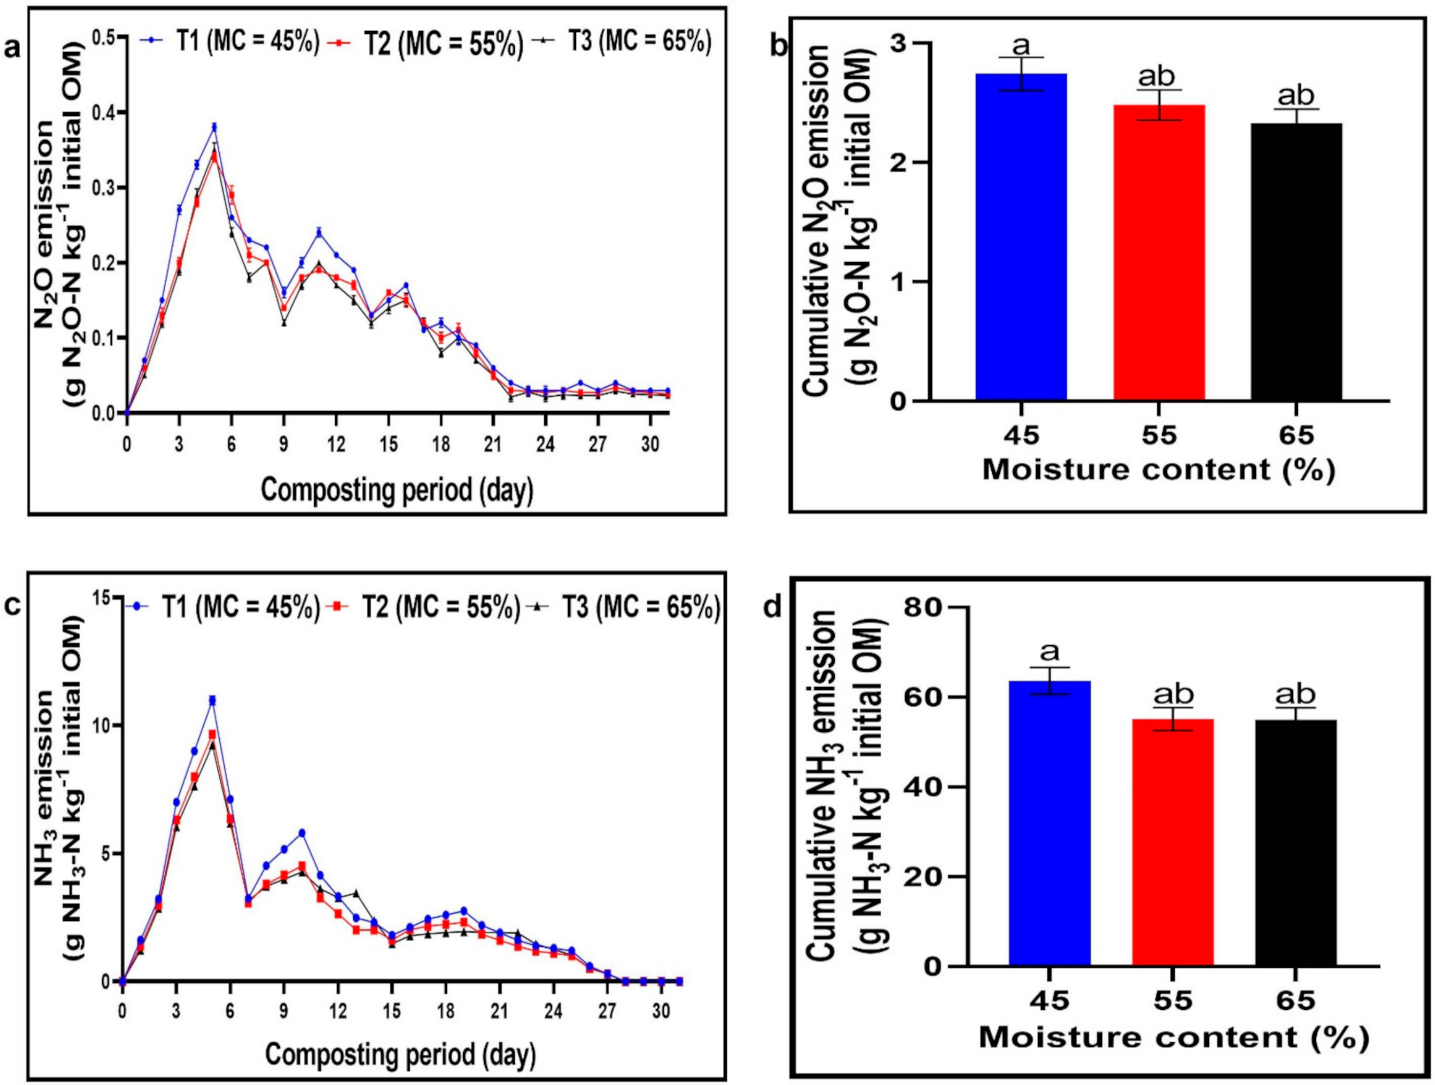
3.5. Emission Dynamics of Nitrous Oxide and Ammonia Gas

Figure 6 illustrates the changes in the emission pattern of nitrous oxide and ammonia gas. The emission of both gases peaked on the fifth day but remained low as the composting time increased. An emission reduction value of near zero (<0.03 g/kg (95%)) was observed at the maturation phase of composting. In general, the values obtained during periods of peak emission differed significantly (p < 0.01) among the moisture levels. The average emission value recorded on day 5 was 9.4% greater with the 45% MC than it was for the 55% and 65% MCs. Relatively, the wettest moisture regime had greater reduction in the emission of nitrous oxide (Figure 6a,b).
A varied and significant (p < 0.01) response to NH3 was demonstrated by the moisture regime treatments on the fifth day of composting (Figure 6c,d). However, the temporal emission pattern of NH3 was similar across the moisture levels. NH3 emission decreased in relation to increases in the moisture content. The peak emission values of the three moisture levels decreased from a maximum of 11.0 g/kg to a minimum of 9.2 g/kg, with the 65% MC having the lowest emission rate. A zero emission rate (100% reduction) was observed for all the moisture levels during the maturation period (from day 27 to day 31) of composting.

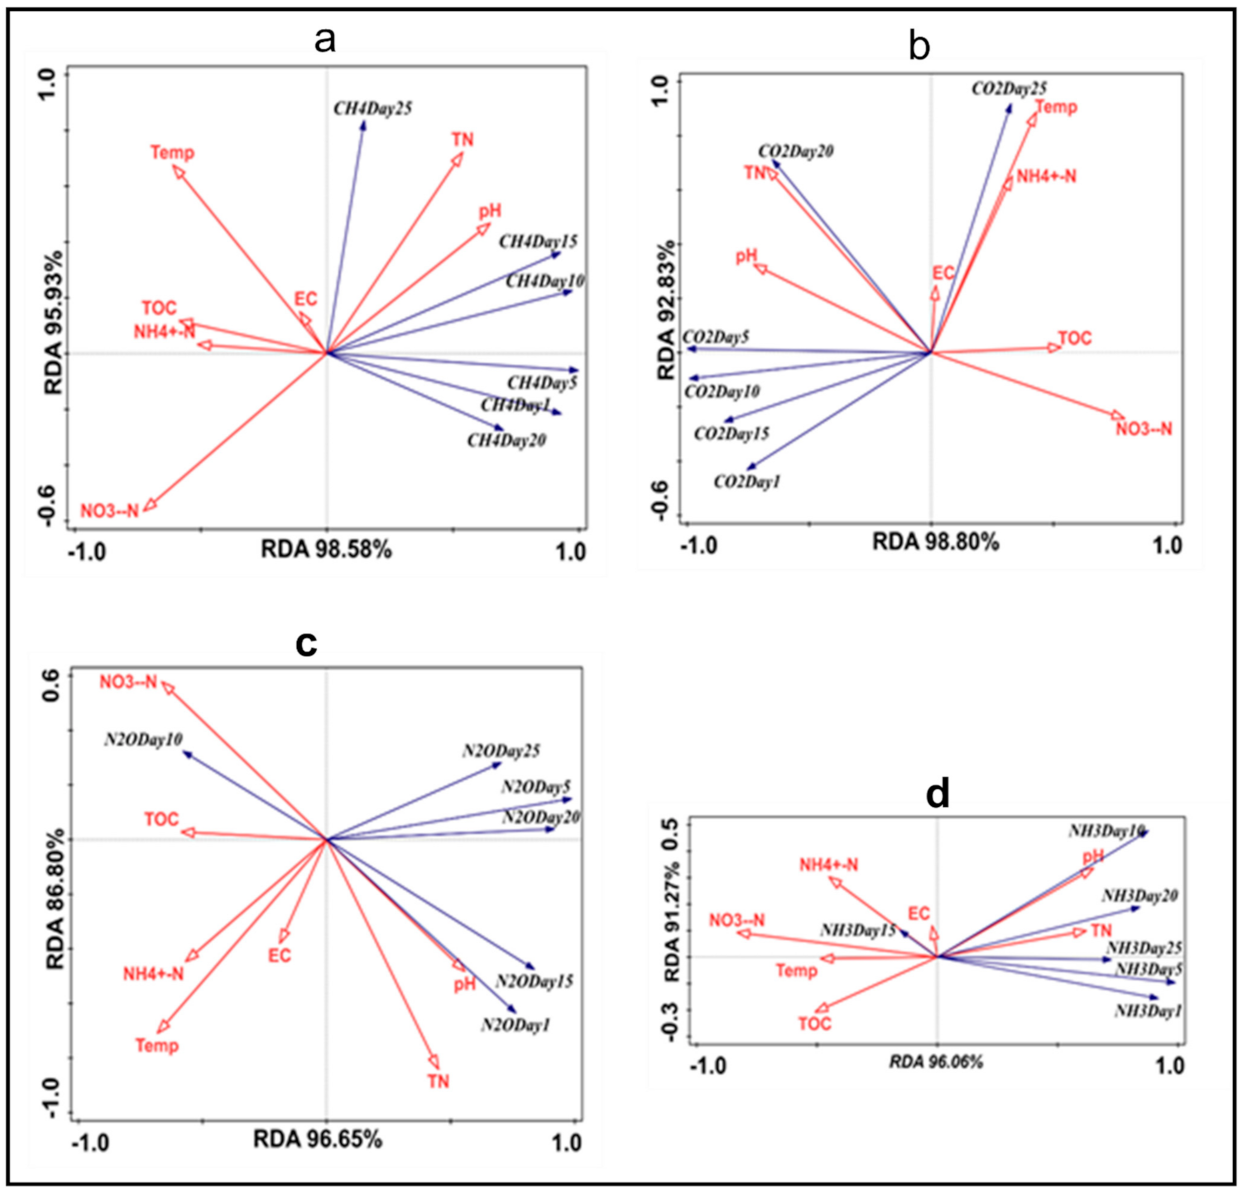
3.6. Redundancy Analysis (RDA) of Gases and Matrix Physicochemical Properties

Redundancy analysis (RDA) was used to investigate the relationship between the emission rate of the gases and the physicochemical properties of the compost (Figure 7). The physicochemical indices variously affected the emission dynamics of the gases. The first two axes of Figure 7a–d produced averages of 97.3%, 95.3%, 91.7% and 93.7% variance between the gases and the physicochemical indices. The temperature and total nitrogen were identified as the main contributors to CH4, CO2, N2O and NH3 emissions. The permutation test for NO3-N correlated positively with the CH4, CO2 and NH3 emissions (Table 2). While NH4+-N correlated positively with the CH4 and CO2 emissions, that of the TOC correlated positively with CO2 and negatively with N2O gas emissions. In contrast, the EC and pH negatively correlated with the emission of CH4, CO2, N2O and NH3 gases.

4. Discussion

4.1. Temperature, Matrix pH and EC Variations

Temperature affects the biological activities that take place during composting. The gradual heat development at the beginning of composting is an indication of a slow biodegradation process and could be attributed to the manual aeration procedure, which lasted continuously for a week. According to Li et al. [36], organic materials, together with microbial communities and the activities of biodegradation, are activated upon pile turning. However, manual turning also disorganizes microorganisms, requiring extra time to build up new communities for heat mobilization and reactivation [37]. Heat production was low in the MC at 45%, suggesting an unstable biological process by the treatment. With an insufficient moisture content, pile dehydration easily occurs, which inhibits biological processes [38]. Optimizing the moisture content of the piles improves the matrix structure of organic materials for microbial degradation [39]. According to Makan et al. [40], microorganisms have high preference for compost piles that are sufficiently moisturized and thus promote and retain high temperatures over a longer period.
The mineralization of organic matter and the emission of NH3 (results shown) were responsible for the rapid increase in pH during composting [41]. Aside from that, the large emission of CO2, decomposition of organic matter and the nitrification process (results shown) which converted NH4+-N to NO3-N were also key in the decline in matrix pH [42]. During organic matter degradation, organic acids are inevitably produced, which decreases the pH of the compost pile [14]. From the study, the matrix pH was lower in the 65% moisture content because of the high biodegradation of organic matter by the treatment. Microorganisms use compost carbon (30–40%) as an energy source for cell mass maintenance and development, and in return, excrete a significant amount of stock carbon as waste during the process [43,44]. As carbon is excreted, the pH of the decomposing materials also decreases [45].
The electrical conductivity reflects the degree of compost salinity and the phytotoxicity effect on plants [45]. The observed increase in EC with composting time was attributed to the decomposition of organic matter (results shown) that released mineral salts in the form of ammonium and phosphate ions during composting [46]. Subsequently, the initial decline in EC was attributed to the emission of NH3 (results shown) in the early stages of composting [47]. The substrate EC generally decreases with increases in moisture content [48]. High compost moisture influences higher neutralization of soluble salts than compost with low moisture. This phenomenon may explain the low EC observed at 65% moisture and the high EC observed at a MC of 45%. Producing compost with EC values between 2.8 and 3.0 mS/cm means that each moisture level was effective in diluting the soluble salts associated with compost heaps for microbial consumption [49]. The alternating pattern between the EC and pH could be due to the characteristic difference in ions between the indexes. Electrical conductivity is dependent on negatively and positively charged ions, while that of pH is dependent on specific ions (i.e., hydrogen) in the solution [50].

4.2. Total Organic Carbon and Organic Matter Variations

The similarity in the temporal trend in TOC by the moisture levels can be attributed to the initial mass and C/N ratio of the piles, which were proportionately similar across the treatments (results shown). The moderate losses in TOC (21.6%) were an indication that the compost mixtures sufficiently decomposed, despite the variations in the moisture content. According to Ros et al. [51] and Santos et al. [52], piles that undergo incomplete degradation processes express little or no losses in TOC. The final TOC was lower in the 55% and 65% moisture contents but higher in the 45% moisture. Ideally, water is a universal solvent that promotes the hydrolysis of organic materials and other compounds during composting [40]. Water regulates pile temperatures and ensures the digestion of unstable organic materials [33]. However, an insufficient moisture content leads to dehydration of the heap, limiting microbial activities on organic materials. Meanwhile, a sufficient water content in the compost pile ensures that organic materials become softer and easier for microorganisms to digest. These processes may explain the observed increase in TOC by the MC at 45% and the decrease in TOC by the MC at 65%.
The decrease in the organic matter (OM) content with time is attributed to the emission of carbon dioxide and methane (results shown) in the early stages of composting [53]. Microorganisms use organic matter as a carbon source for their metabolic and physiological activities, which in turn reduces the organic matter content [54]. An increase in the organic matter content with 65% moisture implies that the treatment improved humification and mineralization of the compost piles [51]. Humification and mineralization are microbially mediated processes that influence the biodegradation of OM [55]. The rise in temperature for the 65% moisture treatment shows high microbial activity and explains the observed increase in OM degradation. Studies have shown 55–70% moisture contents as effective for promoting high temperatures in the process of composting waste foods [56]. Nonetheless, a moisture content at low levels inhibits microbial activities and hinders nutrient mobility, leading to reduced temperatures during composting [56]. Therefore, the observed decline in temperature by the MC at 45% also explains the high loss in OM by the treatment.

4.3. Evolution of Total Nitrogen, Ammonium and Nitrate during Composting

The temporal emission trend of NH3 gas (results shown) followed an inverse pattern to that of the total nitrogen (results shown). Nitrogen is a predominant compound whose losses and stability originate from the dynamics of ammonia volatilization [14]. Hence, the greater the loss in NH3, the lesser the nitrogen content that would be preserved, and vice versa. Aside from that, the length of the decomposition period was the cause for the progressive development of TN. This observation relates to the findings of Santos et al. [52], who attributed N content increases to the progressive increases in composting time. The authors referred to the increase in the period as progressive moments for N mineralization. The environment created by the optimum moisture content (65%) might have favored more nitrifiers during the nitrification process to lessen the TN losses. With adequate levels of moisture, nitrifiers convert compost nitrogen and ammonia into nitrate. The nitrate then serves as an enhancement mechanism for denitrification control and methane oxidation improvement [57]. Similarly, the optimum moisture content (MC = 65%) might have retained more NH3 gas within the composting heap, leading to the possible increase in total N. Moisture adequacy has been proven to be effective for reducing NH3 losses above 30%, making it a replacement alternative to acidic additives, which often affect microbial activities and increase the capital cost of composting [58,59].
The reduction in NH4+-N concentration is attributed to nitrogen mineralization under the conditions of high temperature and optimum moisture [29,60]. Water in compost piles provides a thin film for nutrient mobility during composting [13]. At an optimum moisture (50–70%), a high temperature is promoted and maintained for a longer period [40,49]. However, as the temperature increases (>40 °C), the growth and activities of nitrifying bacteria cease, resulting in the reduction of NH4+-N [61]. In addition, a high temperature leads to the rapid evaporation of water from the compost piles, which limits the activities of nitrifiers in severe cases.
The decomposition time frame and emission of NH3 (results shown) at high temperatures also enhanced the reduction in NH4+-N. According to Kim et al. [19] and Rashad et al. [62], an increase in the decomposition period stimulates nitrification process, which thereby influences the conversion of ammonium to nitrate and nitrite. As this occurs, decomposers such as bacteria and fungi tend to feed on the nitrogen-containing compounds (such as amino acids, nucleic acids and proteins) in the substrate to release ammonia. The final NH4+-N concentrations indicated by the moisture levels were below the recommended limit (0.4 g/kg), indicating a good composting process by the treatments [13].
Pile initiation into the thermophilic phase (results shown) reduced the concentration of NO3-N. Pile decomposition goes through four phases of composting, specifically the mesophilic, thermophilic, cooling and maturation phases. However, the thermophilic phase (>50 °C) produces temperatures that are higher than the other phases. According to Qiao et al. [63], temperatures above 40 °C exert an inhibitory effect on the development of nitrifying bacteria, making them redundant in nitrate development and improvement. In this regard, the low NO3-N concentration exhibited by the wettest treatment (MC = 65%) was as a result of the high temperature exhibited by the treatment. The increase in NO3-N concentration was due to the conversion of NH4+-N to NO3-N and ultimately the losses incurred from the emission of N2O and NH3 (results shown) during composting. This observation is in agreement with the findings of Tiquia [64] and Li et al. [65], who discovered increases in NO3-N as a result of NH4+-N conversion to NO3-N.

4.4. Emission Dynamics of Methane and Carbon Dioxide

The dynamics of methane and carbon dioxide (results shown) are a reflection of the decomposition of organic matter and microbial activities during composting [66]. The reduction of CH4 under the influence of OM decomposition resulted from the increase in moisture [67]. From the study, increasing the MC of the compost pile to 55% and 65% improved the rate of organic matter decomposition, while composting at a 45% level slowed down the decomposition of organic matter. The moisture content serves as a reactant during the decomposition of organic matter [40]. However, MCs below or above the optimal range inhibit aeration and microbial oxygenation, resulting in poor biodegradation of organic matter and compounds [68]. The temporally low emission trend of CH4 (results shown) is attributed to the continual aeration which was practiced [69]. In this study, an airflow rate of 0.4 Lmin−1 (10 min on and 10 min off) was supplied to the reactors throughout the composting process. The aeration rate, which was maintained throughout the composting process, might have reduced the buildup of CH4 in the system and caused the microorganisms to discharge CH4 at a low rate. According to Ermolaev et al. [20], microorganisms have a lower demand for oxygen when the rate of organic matter decomposition decreases, causing them to excrete a lesser amount of CH4. Nevertheless, the initial high carbon content of the corn straw (results shown) contributed to the high rate of CH4 generation, as composting microorganisms waste more energy from high-carbon materials than from low-carbon materials [70].
The dynamics of CO2 is an important measure for evaluating organic matter decomposition during composting. All treatments showed a sharp increase in CO2 on day 5 due to the high heat generated during the period [71]. The temperatures generated during the period may have been suitable to attract heat-tolerant microorganisms for organic matter biodegradation. The high level of CO2 losses in the lowest treatment (MC = 45%) could be explained by the insufficient water content in the compost pile which affected humification and mineralization processes. Composting is an amalgamated process that involves humification and mineralization [71]. Hence, insufficiently humified and mineralized piles cause composting activity to emit more CO2 as a result of OM losses [72].

4.5. Emission Dynamics of Nitrous Oxide and Ammonia Gas

Changes in N2O emissions were mainly driven by nitrification and denitrification processes [73]. Following the temperature dynamics, high and low N2O emissions resulted from high and low temperatures, respectively. A high temperature ensures rapid bio-oxidative activities, which result in high N2O emissions, but low temperatures slow down bio-oxidative activities, which reduce N2O emissions [8]. The slight increases in N2O emissions observed at certain periods of the composting process can be attributed to incomplete denitrification processes that convert NH4+-N into N2O [67]. However, the emission of N2O remained high for the MC at 45% due to the high NO3-N production by the treatment. Compost mixtures with high NO3-N concentrations release more N2O through denitrification process [29]. Likewise, the temporal reduction in pH might have inhibited the activities of N2O reductase, giving rise to the discharge of N2O [20,74].
Nitrogen transformation, which involves the processes of mineralization of organic nitrogen compounds, nitrification and denitrification, is an important benchmark for evaluating NH3 emission during composting [47]. The varying influence of moisture, temperature, organic matter content and pH contributed to the emission of NH3 [75]. As expected, high and low emissions were observed at the initial thermophilic period and the maturation phase, respectively. High temperatures are responsible for converting NH4+-N to NH3 [31], while low temperatures slow the decomposition of organic matter, promoting its stabilization [76]. These findings may have explained the observed correspondence of NH3 losses with increasing temperatures (>60 °C). In the present study, moisture contents of 55% and 65% retained more total nitrogen than the MC of 45%, which could be the reason for the low reduction in NH3 by the treatments. Losses in total nitrogen have been shown to promote NH3 emission during composting [67].

4.6. Relationships between Gases and Physicochemical Indices

The emission of CH4 showed a positive correlation between TN and NH4+-N (results shown). The indicated correlation was due to nutrient degradation of TN and NH4+-N by microorganisms [29]. CH4 was the most emitted greenhouse gas during the composting process. The RDA results confirmed a negative correlation between N2O and TOC. This relationship can be explained in part that denitrifying bacteria uses nitrate as a substrate for the denitrification process [76] and carbon sources as compounds for rapid propagation and reduction of nitric oxide to nitrous oxide [29,57]. The negative correlation between CH4 and EC indicates that microorganisms were influenced by the dynamics of the EC. The negative correlation between pH and N2O and the positive correlation between temperature and N2O reflected the denitrification and nitrification processes. According to Akunna and Clark [77] and Xia et al. [78], denitrification occurs in piles with pH levels between 7.0 and 8.0, while nitrification occurs in piles with a pH range 6.6–8.0. Therefore, increasing the pH can disrupt the activities of nitrifiers and denitrifiers, resulting in lower N2O emissions [29,79].

5. Conclusions

The emission pattern of gases during composting and the evolutionary dynamics of the physicochemical properties of compost were influenced by the duration of composting and the moisture regime of the pile. This study showed that TOC, OM and NH4+-N decreased with an increasing compost age, while TN and NO3-N increased with an increasing compost age. The nutrient dynamics of the compost showed 21.6% losses in total organic carbon content, with a 33.3% increase in total nitrogen content within a 31-day composting period. The concentration of NH4+-N showed an evolutionary trend which was alternative to that of NO3-N. While the NH4+-N concentration decreased by 83% (1.7 g/kg), that for NO3-N increased by 79.3% (0.2 g/kg). The rates of emission for CH4, CO2, N2O and NH3 were generally high during the initial thermophilic period of composting and low during the maturation period. The temperature and total nitrogen were the main contributors to CH4, CO2, N2O and NH3 emissions. CH4 was the most emitted greenhouse gas during the composting process. Emission reductions of 89%, 91%, 95% and 100% were observed for CH4, CO2, N2O and NH3, respectively, at the end of the composting process. In general, the moisture content of 65% effectively reduced gaseous emissions and improved the nutrient content of the compost. Future research can be directed toward the use of the photoacoustic method in assessing the rate of gaseous emissions. The results of this study can be used as a guide in medium- and commercial-scale composting to reduce gaseous emissions and nutrient losses.

Author Contributions

Conceptualization, P.G., H.Q., D.K.A., H.Y., Y.W. and J.X.K.; investigation, P.G., D.K.A., H.Y. and Y.W.; methodology, P.G., H.Q., D.K.A., H.Y., Y.W. and J.X.K.; draft of manuscript, P.G., H.Q. and J.X.K.; writing—review and editing, P.G., H.Q. and J.X.K.; software, P.G., D.K.A., H.Y. and Y.W.; supervision, H.Q.; funding acquisition, H.Q. All authors have read and agreed to the published version of the manuscript.

Funding

This research was funded by the National Key Research and Development Program of China, grant number 2017YFD0800200.

Institutional Review Board Statement

Not applicable.

Informed Consent Statement

Not applicable.

Data Availability Statement

Not applicable.

Conflicts of Interest

The authors declare no conflict of interest.

References

  1. Jia, W.; Qin, W.; Zhang, Q.; Wang, X.; Ma, Y.; Chen, Q. Evaluation of crop residues and manure production and their geographical distribution in China. J. Clean. Prod. 2018, 188, 954–965. [Google Scholar] [CrossRef]
  2. Scarlat, N.; Fahl, F.; Dallemand, J.F.; Monforti, F.; Motola, V. A spatial analysis of biogas potential from manure in Europe. Renew. Sustain. Energy Rev. 2018, 94, 915–930. [Google Scholar] [CrossRef]
  3. Meyer, A.K.P.; Ehimen, E.A.; Holm-Nielsen, J.B. Future European biogas: Animal manure, straw and grass potentials for a sustainable European biogas production. Biomass Bioenergy 2018, 111, 154–164. [Google Scholar] [CrossRef]
  4. Hong, J.; Ren, L.; Hong, J.; Xu, C. Environmental impact assessment of corn straw utilization in China. J. Clean. Prod. 2016, 112, 1700–1708. [Google Scholar] [CrossRef]
  5. Yin, H.; Zhao, W.; Li, T.; Cheng, X.; Liu, Q. Balancing straw returning and chemical fertilizers in China: Role of straw nutrient resources. Renew. Sustain. Energy Rev. 2018, 81, 2695–2702. [Google Scholar] [CrossRef]
  6. Bi, S.; Hong, X.; Yang, H.; Yu, X.; Fang, S.; Bai, Y.; Liu, J.; Gao, Y.; Yan, L.W.; Wang, Y. Effect of hydraulic retention time on anaerobic co-digestion of cattle manure and food waste. Renew. Energy 2020, 150, 213–220. [Google Scholar] [CrossRef]
  7. Turan, N.G. Nitrogen availability in composted poultry litter using natural amendments. Waste Manag. Res. 2009, 27, 19–24. [Google Scholar] [CrossRef]
  8. Onwosi, C.O.; Igbokwe, V.C.; Odimba, J.N.; Eke, I.E.; Nwankwoala, M.O.; Iroh, I.N.; Ezeogu, L.I. Composting technology in waste stabilization: On the methods, challenges and future prospects. J. Environ. Manag. 2017, 190, 140–157. [Google Scholar] [CrossRef] [PubMed]
  9. Ba, S.; Qu, Q.; Zhang, K.; Groot, J.C.J. Meta-analysis of greenhouse gas and ammonia emissions from dairy manure composting. Biosyst. Eng. 2020, 193, 126–137. [Google Scholar] [CrossRef]
  10. Cao, Y.; Wang, X.; Liu, L.; Velthof, G.L.; Misselbrook, T.; Bai, Z.; Ma, L. Acidification of manure reduces gaseous emissions and nutrient losses from subsequent composting process. J. Environ. Manag. 2020, 264, 110454. [Google Scholar] [CrossRef] [PubMed]
  11. Ravindran, B.; Nguyen, D.D.; Chaudhary, D.K.; Chang, S.W.; Kim, J.; Lee, S.R.; Shin, J.; Jeon, B.; Chung, S.; Lee, J. Influence of biochar on physico-chemical and microbial community during swine manure composting process. J. Environ. Manag. 2019, 232, 592–599. [Google Scholar] [CrossRef]
  12. Oazana, S.; Naor, M.; Grinshpun, J.; Halachmi, I.; Raviv, M.; Saadi, I.; Avidov, R.; Varma, V.S.; Rosenfeld, L.; Gross, A.; et al. A flexible control system designed for lab-scale simulations and optimization of composting processes. Waste Manag. 2018, 72, 150–160. [Google Scholar] [CrossRef]
  13. Guo, R.; Li, G.; Jiang, T.; Schuchardt, F.; Chen, T.; Zhao, Y.; Shen, Y. Effect of aeration rate, C/N ratio and moisture content on the stability and maturity of compost. Bioresour. Technol. 2012, 112, 171–178. [Google Scholar] [CrossRef]
  14. Li, M.X.; He, X.S.; Tang, J.; Li, X.; Zhao, R.; Tao, Y.Q.; Wang, C.; Qiu, Z.P. Influence of moisture content on chicken manure stabilization during microbial agent-enhanced composting. Chemosphere 2020, 264, 128549. [Google Scholar] [CrossRef]
  15. Vergara, S.E.; Silver, W.L. Greenhouse gas emissions from windrow composting of organic wastes: Patterns and emissions factors. Environ. Res. Lett. 2019, 14, 124027. [Google Scholar] [CrossRef]
  16. De Bertoldi, M.; Vallini, G.; Pera, A. The biology of composting: A review. Waste Manag. Res. 1983, 1, 157–176. [Google Scholar] [CrossRef]
  17. Wei, L.; Shutao, W.; Jin, Z.; Tong, X. Biochar influences the microbial community structure during tomato stalk composting with chicken manure. Bioresour. Technol. 2014, 154, 148–154. [Google Scholar] [CrossRef] [PubMed]
  18. Luangwilai, T.; Sidhu, H.S.; Nelson, M.I. One-dimensional spatial model for self-heating in compost piles: Investigating effects of moisture and air flow. Food Bioprod. Process. 2018, 108, 18–26. [Google Scholar] [CrossRef]
  19. Kim, E.; Lee, D.H.; Won, S.; Ahn, H. Evaluation of Optimum Moisture Content for Composting of Beef Manure and Bedding Material Mixtures Using Oxygen Uptake Measurement. Asian-Australas. J. Anim. Sci. 2015, 29, 753–758. [Google Scholar] [CrossRef] [PubMed] [Green Version]
  20. Ermolaev, E.; Sundberg, C.; Pell, M.; Smårs, S.; Jönsson, H. Effects of moisture on emissions of methane, nitrous oxide and carbon dioxide from food and garden waste composting. J. Clean. Prod. 2019, 240, 118165. [Google Scholar] [CrossRef]
  21. Ahn, H.K.; Richard, T.L.; Glanville, T.D. Optimum moisture levels for biodegradation of mortality composting envelope materials. Waste Manag. 2008, 28, 1411–1416. [Google Scholar] [CrossRef]
  22. Tran, Q.N.M.; Mimoto, H.; Nakasaki, K. Inoculation of lactic acid bacterium accelerates organic matter degradation during composting. Int. Biodeterior. Biodegrad. 2015, 104, 377–383. [Google Scholar] [CrossRef]
  23. Wu, J.; Zhang, A.; Li, G.; Wei, Y.; He, S.; Lin, Z.; Shen, X.; Wang, Q. Effect of different components of single superphosphate on organic matter degradation and maturity during pig manure composting. Sci. Total Environ. 2019, 646, 587–594. [Google Scholar] [CrossRef] [PubMed]
  24. Ayilara, M.; Olanrewaju, O.; Babalola, O.; Odeyemi, O. Waste Management through Composting: Challenges and Potentials. Sustainability 2020, 12, 4456. [Google Scholar] [CrossRef]
  25. Cui, S.; Song, Z.; Zhang, L.; Shen, Z.; Hough, R.; Zhang, Z.; An, L.; Fu, Q.; Zhao, Y.; Jia, Z. Spatial and temporal variations of open straw burning based on fire spots in northeast China from 2013 to 2017. Atmos. Environ. 2021, 244, 117962. [Google Scholar] [CrossRef]
  26. He, G.; Liu, T.; Zhou, M. Straw burning, PM2.5, and death: Evidence from China. J. Dev. Econ. 2020, 145, 102468. [Google Scholar] [CrossRef] [Green Version]
  27. Tao, J.; Zhang, L.; Cao, J.; Zhang, R. A review of current knowledge concerning PM2.5 chemical composition, aerosol optical properties and their relationships across China. Atmos. Chem. Phys. 2017, 17, 9485–9518. [Google Scholar] [CrossRef] [Green Version]
  28. Wang, Q.; Li, R.; Cai, H.; Awasthi, M.K.; Zhang, Z.; Wang, J.J.; Ali, A.; Amanullah, M. Improving pig manure composting efficiency employing Ca-bentonite. Ecol. Eng. 2016, 87, 157–161. [Google Scholar] [CrossRef]
  29. Chen, M.; Huang, Y.; Liu, H.; Xie, S.; Abbas, F. Impact of Different Nitrogen Source on the Compost Quality and Greenhouse Gas Emissions during Composting of Garden Waste. Process Saf. Environ. Prot. 2019, 124, 326–335. [Google Scholar] [CrossRef]
  30. Zang, B.; Li, S.; Michel, F.C.; Li, G.; Zhang, D.; Li, Y. Control of dimethyl sulfide and dimethyl disulfide odors during pig manure composting using nitrogen amendment. Bioresour. Technol. 2017, 224, 419–427. [Google Scholar] [CrossRef] [PubMed]
  31. Ren, X.; Wang, Q.; Awasthi, M.K.; Zhao, J.; Wang, J.; Liu, T.; Li, R.; Zhang, Z. Improvement of cleaner composting production by adding Diatomite: From the nitrogen conservation and greenhouse gas emission. Bioresour. Technol. 2019, 286, 121377. [Google Scholar] [CrossRef]
  32. Jiang, T.; Schuchardt, F.; Li, G.X.; Guo, R.; Luo, Y.M. Gaseous emission during the composting of pig feces from Chinese Ganqinfen system. Chemosphere 2013, 90, 1545–1551. [Google Scholar] [CrossRef]
  33. Chen, J.; Hou, D.; Pang, W.; Nowar, E.E.; Tomberlin, J.K.; Hu, R.; Chen, H.; Xie, J.; Zhang, J.; Yu, Z.; et al. Effect of moisture content on greenhouse gas and NH3 emissions from pig manure converted by black soldier fly. Sci. Total Environ. 2019, 133840. [Google Scholar] [CrossRef] [PubMed]
  34. Zheng, J.; Liu, J.; Han, S.; Wang, Y.; Wei, Y. N2O emission factors of full-scale animal manure windrow composting in cold and warm seasons. Bioresour. Technol. 2020, 316, 123905. [Google Scholar] [CrossRef]
  35. Leitner, S.; Ring, D.; Wanyama, G.N.; Korir, D.; Pelster, D.E.; Goopy, J.P.; Butterbach-Bahl, K.; Merbold, L. Effect of feeding practices and manure quality on CH4 and N2O emissions from uncovered cattle manure heaps in Kenya. Waste Manag. 2021, 126, 209–220. [Google Scholar] [CrossRef]
  36. Li, Y.; Luo, W.; Li, G.; Wang, K.; Gong, X. Performance of phosphogypsum and calcium magnesium phosphate fertilizer for nitrogen conservation in pig manure composting. Bioresour. Technol. 2018, 250, 53–59. [Google Scholar] [CrossRef]
  37. Cook, K.L.; Ritchey, E.L.; Loughrin, J.H.; Haley, M.; Sistani, K.R.; Bolster, C.H. Effect of turning frequency and season on composting materials from swine high-rise facilities. Waste Manag. 2015, 39, 86–95. [Google Scholar] [CrossRef] [Green Version]
  38. Yang, F.; Li, Y.; Han, Y.; Qian, W.; Li, G.; Luo, W. Performance of mature compost to control gaseous emissions in kitchen waste composting. Sci. Total Environ. 2019, 657, 262–269. [Google Scholar] [CrossRef] [PubMed]
  39. Zhang, B.; Xu, Z.; Jiang, T.; Huda, N.; Li, G.; Luo, W. Gaseous emission and maturity in composting of livestock manure and tobacco wastes: Effects of aeration intensities and mitigation by physiochemical additives. Environ. Technol. Innov. 2020, 19, 100899. [Google Scholar] [CrossRef]
  40. Makan, A.; Assobhei, O.; Mountadar, M. Effect of initial moisture content on the in-vessel composting under air pressure of organic fraction of municipal solid waste in Morocco. Iran. J. Environ. Health Sci. Eng. 2013, 10, 3. [Google Scholar] [CrossRef] [Green Version]
  41. Bai, M.; Impraim, R.; Coates, T.; Flesch, T.; Trouvé, R.; van Grinsven, H.; Cao, Y.; Hill, J.; Chen, D. Lignite effects on NH3, N2O, CO2 and CH4 emissions during composting of manure. J. Environ. Manag. 2020, 271, 110960. [Google Scholar] [CrossRef]
  42. Zhang, L.; Sun, X.Y. Influence of bulking agents on physical, chemical, and microbiological properties during the two-stage composting of green waste. Waste Manag. 2016, 48, 115–126. [Google Scholar] [CrossRef]
  43. Barrington, S.; Choinière, D.; Trigui, M.; Knight, W. Effect of carbon source on compost nitrogen and carbon losses. Bioresour. Technol. 2002, 83, 189–194. [Google Scholar] [CrossRef]
  44. Zhang, L.; Dong, H.; Zhang, J.; Chen, Y.; Zeng, G.; Yuan, Y.; Cao, W.; Fang, W.; Hou, K.; Wang, B.; et al. Influence of FeONPs amendment on nitrogen conservation and microbial community succession during composting of agricultural waste: Relative contributions of ammonia-oxidizing bacteria and archaea to nitrogen conservation. Bioresour. Technol. 2019, 287, 121463. [Google Scholar] [CrossRef] [PubMed]
  45. Gao, M.; Liang, F.; Yu, A.; Li, B.; Yang, L. Evaluation of stability and maturity during forced-aeration composting of chicken manure and sawdust at different C/N ratios. Chemosphere 2010, 78, 614–619. [Google Scholar] [CrossRef]
  46. Gómez-Brandón, M.; Lazcano, C.; Domínguez, J. The evaluation of stability and maturity during the composting of cattle manure. Chemosphere 2008, 70, 436–444. [Google Scholar] [CrossRef]
  47. Awasthi, M.K.; Pandey, A.K.; Bundela, P.S.; Wong, J.W.; Li, R.; Zhang, Z. Co-composting of gelatin industry sludge combined with organic fraction of municipal solid waste and poultry waste employing zeolite mixed with enriched nitrifying bacterial consortium. Bioresour. Technol. 2016, 213, 181–189. [Google Scholar] [CrossRef] [PubMed]
  48. Shin, J.H.; Son, J.E. Changes in electrical conductivity and moisture content of substrate and their subsequent effects on transpiration rate, water use efficiency, and plant growth in the soilless culture of paprika (Capsicum annuum L.). Hortic. Environ. Biotechnol. 2015, 56, 178–185. [Google Scholar] [CrossRef]
  49. Gondek, M.; Weindorf, D.C.; Thiel, C.; Kleinheinz, G. Soluble Salts in Compost and Their Effects on Soil and Plants: A Review. Compost Sci. Util. 2020, 28, 59–75. [Google Scholar] [CrossRef]
  50. Leveling, T. The Relationship between pH and Conductivity in a Lithium Contaminated, De-Ionized Water System; Pbar Note 675: The Relationship between pH and Conductivity; Academia: San Francisco, CA, USA, 2002. [Google Scholar]
  51. Ros, M.; García, C.; Hernández, T. A full-scale study of treatment of pig slurry by composting: Kinetic changes in chemical and microbial properties. Waste Manag. 2006, 26, 1108–1118. [Google Scholar] [CrossRef]
  52. Santos, A.; Bustamante, M.A.; Tortosa, G.; Moral, R.; Bernal, M.P. Gaseous emissions and process development during composting of pig slurry: The influence of the proportion of cotton gin waste. J. Clean. Prod. 2016, 112, 81–90. [Google Scholar] [CrossRef]
  53. Guo, H.; Gu, J.; Wang, X.; Song, Z.; Yu, J.; Lei, L. Microbial mechanisms related to the effects of bamboo charcoal and bamboo vinegar on the degradation of organic matter and methane emissions during composting. Environ. Pollut. 2020, 272, 116013. [Google Scholar] [CrossRef]
  54. Chan, M.T.; Selvam, A.; Wong, J.W.C. Reducing nitrogen loss and salinity during “struvite” food waste composting by zeolite amendment. Bioresour. Technol. 2016, 200, 838–844. [Google Scholar] [CrossRef]
  55. Kumar, M.; Ou, Y.L.; Lin, J.G. Co-composting of green waste and food waste at low C/N ratio. Waste Manag. 2010, 30, 602–609. [Google Scholar] [CrossRef] [PubMed]
  56. Yeh, C.K.; Lin, C.; Shen, H.C.; Cheruiyot, N.K.; Camarillo, M.E.; Wang, C.L. Optimizing Food Waste Composting Parameters and Evaluating Heat Generation. Appl. Sci. 2020, 10, 2284. [Google Scholar] [CrossRef] [Green Version]
  57. Huang, G.F.; Wong, J.W.C.; Wu, Q.T.; Nagar, B.B. Effect of C/N on composting of pig manure with sawdust. Waste Manag. 2004, 24, 805–813. [Google Scholar] [CrossRef] [PubMed]
  58. Chadwick, D. Emissions of ammonia, nitrous oxide and methane from cattle manure heaps: Effect of compaction and covering. Atmos. Environ. 2005, 39, 787–799. [Google Scholar] [CrossRef]
  59. Elkader, N.; Robin, P.; Paillat, J.; Leterme, P. Turning, compacting and the addition of water as factors affecting gaseous emissions in farm manure composting. Bioresour. Technol. 2007, 98, 2619–2628. [Google Scholar] [CrossRef]
  60. Ren, X.; Wang, Q.; Zhang, Y.; Awasthi, M.K.; He, Y.; Li, R.; Zhang, Z. Improvement of humification and mechanism of nitrogen transformation during pig manure composting with Black Tourmaline. Bioresour. Technol. 2020, 307, 123236. [Google Scholar] [CrossRef]
  61. Ren, G.; Xu, X.; Qu, J.; Zhu, L.; Wang, T. Evaluation of microbial population dynamics in the co-composting of cow manure and rice straw using high throughput sequencing analysis. World J. Microbiol. Biotechnol. 2016, 32, 101. [Google Scholar] [CrossRef]
  62. Rashad, F.M.; Saleh, W.D.; Moselhy, M.A. Bioconversion of rice straw and certain agro-industrial wastes to amendments for organic farming systems: 1. Composting, quality, stability and maturity indices. Bioresour. Technol. 2010, 101, 5952–5960. [Google Scholar] [CrossRef]
  63. Qiao, C.; Liu, L.; Hu, S.; Compton, J.E.; Greaver, T.L.; Li, Q. How inhibiting nitrification affects nitrogen cycle and reduces environmental impacts of anthropogenic nitrogen input. Glob. Chang. Biol. 2015, 21, 1249–1257. [Google Scholar] [CrossRef]
  64. Tiquia, S.M. Microbial Transformation of Nitrogen During Composting. Microbiol. Compost. 2002, 237–245. [Google Scholar] [CrossRef]
  65. Li, Q.; Guo, X.; Lu, Y.; Shan, G.; Huang, J. Impacts of adding FGDG on the abundance of nitrification and denitrification functional genes during dairy manure and sugarcane pressmud co-composting. Waste Manag. 2016, 56, 63–70. [Google Scholar] [CrossRef]
  66. Wang, M.; Awasthi, M.K.; Wang, Q.; Chen, H.; Ren, X.; Zhao, J.; Li, R.; Zhang, Z. Comparison of additives amendment for mitigation of greenhouse gases and ammonia emission during sewage sludge co-composting based on correlation analysis. Bioresour. Technol. 2017, 243, 520–527. [Google Scholar] [CrossRef]
  67. Awasthi, M.K.; Wang, Q.; Huang, H.; Ren, X.; Lahori, A.H.; Mahar, A.; Ali, A.; Shen, F.; Li, R.; Zhang, Z. Influence of zeolite and lime as additives on greenhouse gas emissions and maturity evolution during sewage sludge composting. Bioresour. Technol. 2016, 216, 172–181. [Google Scholar] [CrossRef]
  68. Trémier, A.; Teglia, C.; Barrington, S. Effect of initial physical characteristics on sludge compost performance. Bioresour. Technol. 2009, 100, 3751–3758. [Google Scholar] [CrossRef] [PubMed] [Green Version]
  69. Fukumoto, Y.; Osada, T.; Hanajima, D.; Haga, K. Patterns and quantities of NH3, N2O and CH4 emissions during swine manure composting without forced aeration-effect of compost pile scale. Bioresour. Technol. 2003, 89, 109–114. [Google Scholar] [CrossRef]
  70. Cao, Y.; Wang, X.; Bai, Z.; Chadwick, D.; Misselbrook, T.; Sommer, S.G.; Qin, W.; Ma, L. Mitigation of ammonia, nitrous oxide and methane emissions during solid waste composting with different additives: A meta-analysis. J. Clean. Prod. 2019, 235, 626–635. [Google Scholar] [CrossRef]
  71. Zhang, S.; Wei, Z.; Zhao, M.; Chen, X.; Wu, J.; Kang, K.; Wu, Y. Influence of malonic acid and manganese dioxide on humic substance formation and inhibition of CO2 release during composting. Bioresour. Technol. 2020, 318, 124075. [Google Scholar] [CrossRef] [PubMed]
  72. López, M.; Huerta-Pujol, O.; Martínez-Farré, F.X.; Soliva, M. Approaching compost stability from Klason lignin modified method: Chemical stability degree for OM and N quality assessment. Resour. Conserv. Recycl. 2010, 55, 171–181. [Google Scholar] [CrossRef]
  73. Chen, M.; Wang, C.; Wang, B.; Bai, X.; Gao, H.; Huang, Y. Enzymatic mechanism of organic nitrogen conversion and ammonia formation during vegetable waste composting using two amendments. Waste Manag. 2019, 95, 306–315. [Google Scholar] [CrossRef] [PubMed]
  74. Jones, C.M.; Welsh, A.; Throbäck, I.N.; Dörsch, P.; Bakken, L.R.; Hallin, S. Phenotypic and genotypic heterogeneity among closely related soil-borne N2- and N2O-producing Bacillus isolates harboring the nosZ gene. Fed. Eur. Microbiol. Soc.-Microbiol. Ecol. 2011, 76, 541–552. [Google Scholar] [CrossRef] [PubMed] [Green Version]
  75. Sun, Y.; Ren, X.; Pan, J.; Zhang, Z.; Tsui, T.H.; Luo, L.; Wang, Q. Effect of microplastics on greenhouse gas and ammonia emissions during aerobic composting. Sci. Total Environ. 2020, 737, 139856. [Google Scholar] [CrossRef]
  76. Sigman, D.M.; Casciotti, K.L.; Andreani, M.; Barford, C.; Galanter, M.; Böhlke, J.K. A Bacterial Method for the Nitrogen Isotopic Analysis of Nitrate in Seawater and Freshwater. Anal. Chem. 2001, 73, 4145–4153. [Google Scholar] [CrossRef] [PubMed]
  77. Akunna, J.; Clark, M. Performance of a granular-bed anaerobic baffled reactor (GRABBR) treating whisky distillery wastewater. Bioresour. Technol. 2000, 74, 257–261. [Google Scholar] [CrossRef]
  78. Xia, W.; Zhang, C.; Zeng, X.; Feng, Y.; Weng, J.; Lin, X.; Zhu, J.; Xiong, Z.; Xu, J.; Cai, Z.; et al. Autotrophic growth of nitrifying community in an agricultural soil. ISME Int. Soc. Microb. Ecol. J. 2011, 5, 1226–1236. [Google Scholar] [CrossRef] [PubMed] [Green Version]
  79. Tiquia, S.M.; Tam, N.F.Y. Elimination of phytotoxicity during co-composting of spent pig-manure sawdust litter and pig sludge. Bioresour. Technol. 1998, 65, 43–49. [Google Scholar] [CrossRef]
Figure 1. Schematic diagram of the composting reactor.
Applsci 11 08493 g001
Figure 2. Evolutionary dynamics of temperature (a), pH (b) and EC (c) during composting under different moisture levels.
Applsci 11 08493 g002
Figure 3. Temporal evolution of total organic carbon (a,b) and organic matter (c,d) content during composting under different moisture regimes.
Applsci 11 08493 g003
Figure 4. Temporal evolution of total nitrogen (a,b), ammonium nitrogen (c,d) and nitrate nitrogen (e,f) during composting under different moisture levels.
Applsci 11 08493 g004
Figure 5. Temporal emission of methane (a,b) and carbon dioxide (c,d) gas during composting under different moisture levels.
Applsci 11 08493 g005
Figure 6. Temporal emission of ammonia (a,b) and nitrous oxide (c,d) gas during composting under different moisture levels.
Applsci 11 08493 g006
Figure 7. Redundancy analysis (RDA) between gaseous emissions and physicochemical indices of compost (a), methane (b), carbon dioxide (c) nitrous oxide and (d) ammonia.
Applsci 11 08493 g007
Table 1. Initial physicochemical constituents of cow manure, corn straw and a mixture of cow manure and corn straw used to assess the effect of the moisture regime on the emission pattern of gases and the evolutionary dynamics of physicochemical indices during composting.
ParameterCow ManureCorn StrawMixture
Moisture content (%)50.90 ± 0.816.33 ± 0.2228.62 ± 0.52
Total organic carbon (%)31.26 ± 0.6543.05 ± 0.7837.95 ± 2.01
Total nitrogen content (%)1.74 ± 0.100.73 ± 0.0413.82 ± 0.02
Carbon/nitrogen (C/N) ratio17.97 ± 1.1858.97 ± 1.5427.50 ± 0.57
pH 7.71 ± 0.327.23 ± 0.917.79 ± 0.09
Electrical conductivity (mS/cm)2.90 ± 0.043.02 ± 0.103.04 ± 0.13
Particle size (mm)20.0 ± 2.21120.0 ± 6.2198.0 ± 9.71
Cow manure/corn straw ratio (kg)mm 15.0 ms 3.8≈15:4
mm = mass of cow manure (not a ratio). ms = mass of corn straw (not a ratio). These parameters were measured according to the Chinese national standard for organic resource testing (NY525-2002) [28,29].
Table 2. Permutation results between gaseous emissions and physicochemical indices of compost.
Propertiesp-Value
CH4CO2N2ONH3
Nitrate nitrogen 0.026 *0.020 *0.068NS0.008 **
pH0.350NS0.366NS0.082NS0.552NS
Temperature0.008 **0.044 *0.032 *0.024 *
Total organic carbon0.302NS0.040 *0.352NS0.616NS
Total nitrogen0.004 **0.012 *0.002 **0.024 *
Ammonium nitrogen 0.006 **0.008 **0.304NS0.258NS
Electrical conductivity 0.124NS0.312NS0.394NS0.152NS
* Significant correlations at p < 0.05. ** Significant correlations at p < 0.01. *** Significant correlations at p < 0.001.
Publisher’s Note: MDPI stays neutral with regard to jurisdictional claims in published maps and institutional affiliations.

