1. Introduction
Based on the nature of the optical source (i.e., coherent versus incoherent), the detection configuration scheme (i.e., coherent versus incoherent) and coding techniques (i.e., time/wavelength or amplitude/phase), optical code division multiplexing access (OCDMA) systems are either coherent or incoherent [
1]. On the one hand, CDMA coherent systems use bipolar codes {−1,1} such as Maximum Length (ML) sequences and Walsh codes which are employed in wireless CDMA systems. On the other hand, CDMA incoherent systems employ unipolar codes {0,1} such as optical orthogonal codes (OOC) and prime codes [
2]. Additionally, OCDMA systems are divided into three families; direct sequence OCDMA (DS-OCDMA) [
3], time hopping OCDMA (TH-OCDMA) [
4] and frequency hopping OCDMA (FH-OCDMA) [
5]. OCDMA systems are also classified into two categories: synchronous and asynchronous [
6]. Synchronous systems provide a high user capacity that makes them more complex, whereas asynchronous systems are less complex [
7]. Moreover, OCDMA synchronous system provides a secure data transmission [
8].
In literature, several works dealing with synchronous OCDMA systems are investigated based on one dimensional (1D) code and satisfying the zero cross-correlation (ZCC) feature. The ZCC feature is promising by improving system cardinality, while limiting interference [
9,
10]. However, a specific coding family based on two-dimensional (2D) code namely multi-diagonal code (2D-MD) for spectral amplitude coding OCDMA (SAC-OCDMA), offers additional improvement to the system cardinality without the constraint of increasing the length of the 1D code [
11]. Whereas, the previous 2D-MD proposed systems, using incoherent source and operating at low bit rates equal to 622 Mb/s, 1 Gb/s and 2.5 Gb/s, are studied in [
12,
13,
14], respectively. Unfortunately, these bit rates do not satisfy the required user needs for different emergent applications and for the increasing demand in access network. In [
14], authors developed the SNR expression of SAC-OCDMA system based on 2D-MD code while using LED source. However, in this work, we investigate a numerical analysis and a feasibility demonstration via simulation for SAC-OCDMA system utilizing the unique combination of a 2D-MD code and coherent light source. Laser sources are characterized by a narrowband spectral width and produce less chromatic dispersion compared to LED sources. Moreover, laser sources allow various types of modulation schemes, such as Frequency Shift Keying (FSK), Phase Shift Keying (PSK) and Quadrature Phase Shift Keying (QPSK) for high distance and data rate. Additionally, LED source is known as a cost-effective device. For instance, Sharma and al. [
15] proposed a simulation model for SAC-OCDMA system based on two-dimensional Balanced Incomplete Block Design (2D-BIBD) codes for six users operating at 1 Gb/s and LED source. Additionally, authors in [
16] demonstrated the feasibility of two-dimensional permutation vector codes (2D-PV) based on LED source and providing a BER less than 10
−9 for eight users operating at 2 Gb/s. However, due to the non-coherency of its broadband source, the Phase-Induced Intensity Noise (PIIN) is a dominant factor which limits the system performance and the maximum achievable bit rate [
17]. Furthermore, laser can allow other optimizations such as dispersion tolerance for high-speed transmission links and can be employed for high data rates up to 10 Gb/s [
18]. The choice of the LED against laser source depends on the application, target performance and reliability requirement. For instance, LED is used mainly in fiber to the home (FTTH) and Local Area Network (LAN) [
14], whereas laser source is employed in long-haul applications such as Metropolitan Area Network (MAN) [
18]. In the state-of-the-art, many authors consider coherent source for SAC-OCDMA systems for various applications such as Passive Optical Network (PON) [
18,
19,
20,
21], Free Space Optical (FSO) [
22] and wireless optical networks [
23].
This paper aims to employ coherent source in a PON context to improve the SAC-OCDMA system performance in terms of allowed user bit rate and maximum system reach. A novel architecture based on 2D-MD SAC-OCDMA codes for LR-PON is proposed with a coherent optical source, an external Mach-Zehnder modulator, spectral/temporal coding and spectral direct detection (SDD). In addition, we investigate the system performance in terms of the maximum achievable bit rate, Q-factor and eye diagram analysis using a computer simulator tool. Firstly, we study the feasibility of a SAC-OCDMA system based on 2D-MD in LR-PON. Secondly, we determine the maximum reachability of the system in terms of fiber length. Finally, we investigate the impact of linear effects (i.e., fiber loss, group velocity dispersion and differential group delay) and non-linear effects (i.e., Kerr effect, self-phase modulation and stimulated Raman scattering) of the optical channel on the system performance when increasing the bit rate. Recall that the bit rate is correlated to the nonlinear effects in optical communication systems. Therefore, when the bit rate increases, the nonlinear effects caused by the optical channel will increase as well leading to a degradation of the system performance [
24]. On the one hand, in this paper we focus on determining the maximum bit rate that results in a Q-factor higher than the limit corresponding to a bit error rate (BER) of 10
−9, when nonlinear effects due to optical channel are considered. On the other hand, a simulation setup is proposed to study the impact of Multiple Access Interference (MAI) and nonlinear effects while increasing the number of network subscribers. For a single user, we demonstrate that the proposed system can reach up to 55 Gb/s and 40 Gb/s when first, and second (as well as third) order dispersion are considered as frequency parameters, respectively. In addition, the simulation setup shows four connected users operating at an aggregate bit rate of 20 Gb/s over 50 km of single-mode fiber (SMF) link while considering linear and nonlinear effects. Furthermore, the nonlinear effects are considered by enabling the Kerr effect (i.e., γ) in the simulator, the self-phase modulation (SPM) and the stimulated Raman scattering (SRS) at a bit rate of 5 Gb/s per user. To the best of our knowledge, this is the first time to demonstrate the feasibility of a 2D-MD SAC-OCDMA system in LR-PON context by considering optical coherent source noise, group velocity dispersion (GVD), differential group delay (DGD), SPM, SRS effects and photo detector noise. The received electrical eye diagrams reveal an aggregate bit rate of 20 Gb/s dispatched equally among four users over 50 km of SMF length that had never been reached before compared to similar systems in PON configuration.
This paper is organized as follows.
Section 2 presents the system description for LR-PON.
Section 3 deals with the SAC-OCDMA encoder and decoder model in which 2D-MD codes are exhibited.
Section 4 discusses the system performance analysis in terms of SNR, BER and Q-Factor. Simulation results and discussion are investigated, in
Section 5, as function of bit rate, optical channel nonlinear coefficient and fiber length. Finally, some conclusions are drawn in
Section 6.
3. SAC-OCDMA System Description
The 2D-MD code is designed using two 1D-MD code sequences, where the code length
L is defined by [
14]:
where
w is the code weight and
K is the number of users.
Due to the ZCC proprieties (i.e., cross correlation between two adjacent codes is equal to zero), MAI effects are totally canceled for 1D-MD code. Therefore, 1D-MD code can be designed using the following steps [
25]:
Step 1: Depending on several diagonal matrices by choosing the corresponding weight and user number “w” and “K”, both “m” and “n” can be configured where and refer to the rows number and the diagonal matrices number in each matrix, respectively.
Step 2: Each diagonal matrix in MD code can be expressed by:
Each one of the above elements refers to column in
square matrices with
order.
can be expressed as:
Step 3: Combining different
matrices conducts to obtain 1D-MD matrix as follows:
Table 1 represents an example of 1D-MD code for
w = 3,
K = 4 and L = 12 [
11].
In SAC-OCDMA system, a code is described with 5-tuplet (
K,
L,
w, λ
a, λ
c) where
K,
L,
w, λ
a and λ
c are defined as the number of simultaneous users, the code length, the code weight, the auto-correlation and the cross-correlation of the code.
Table 1 exhibits the SAC-OCDMA 1D-MD codes description for (
K = 4,
L = 12,
w = 3, λc = 0) while performing the time and wavelength spreading, respectively [
14].
Table 2 presents an example of 2D-MD code time spreading description generated from two 1D-MD codes X = [100110] and Y = [011001] with (
= 3,
= 2,
= 3 and
= 3). Where
,
,
represent X and Y codes weight and size. In addition, we define
and
as the code length of X and Y used to build the 2D-MD code.
Table 3 describes the 2D-MD spectral code. In this table, we show that:
λ1 = 1550 nm, λ8 = 1555.6 nm and λ9 = 1556.4 nm are assigned to user 1.
λ2 = 1550.8 nm, λ7 = 1554.8 nm and λ10 = 1557.2 nm are assigned to user 2.
λ3 = 1551.6 nm, λ6 = 1554 nm and λ11 = 1558 nm are assigned to user 3.
λ4 = 1552.4 nm, λ5 = 1553.2 nm and λ12 = 1558.8 nm are assigned to user 4.
Note that the 2D-MD codes are selected thanks to the ZCC propriety leading to limit the MAI. Recall that the MAI is considered as the most important OCDMA system performance limitation [
14]. In fact, MAI is due to the overlap between the common chips of the user’s code in time or spectral axis in the combined signal when it is transferred through the optical channel. According to
Table 2 that describes the 2D-MD time spreading, the overlap chips are represented with red color. However, to reduce the MAI we suggested 12 wavelengths for the spectral spreading as depicted in
Table 3 to serve four users. Furthermore, to minimize the overlap between the different wavelengths, we select a bandwidth equal to 0.8 nm between the 12 selected wavelengths.
Figure 2a shows the SAC-OCDMA encoder used to generate the 2D-MD codes in which a time delay (
) is used for time spreading and wavelength division multiplexing (WDM) multiplexer is employed to assign different wavelength for different generated chip. On the other side, a Bessel optical filter followed by a time delay in the SAC-OCDMA decoder for user 1 is used to extract the user signature from the multiplexed received signal as depicted in
Figure 2b. Moreover, Fibre Bragg Grating (FBG) and Arrayed Waveguide Grating (AWG) are demonstrated for spectral encoder/decoder that can be a potential solution for physical implementation very suitable in SAC-OCDMA systems. However, in our work only an Optical Tapped-Delay Line (OTDL) is required for the corresponding proposed time delay components for physical implementation since the spectral component of the 2D-MD codes are provided by the CW laser array.
Due to the inclusion of 2D-MD code in the ZCC code families, the detection technique that can be applied is SDD which is characterized by a simple structure where it is enough to filter a single clean wavelength to obtain the desired data [
26]. On the other hand, there are two utilized functions that show the importance of code properties, which are auto-correlation and cross-correlation. The algorithm used in MAI cancellation which also matches with SDD technique [
14] can be expressed as follows:
We note that when two codes in both sides (transmitter and receiver) are matched, this gives auto-correlation value whereas the opposition gives cross-correlation value. Moreover, there is a relationship between MAI, auto-correlation and cross correlation: as long as auto-correlation increases, cross correlation decreases leading to cancel MAI with higher value [
27].
4. SAC-OCDMA System Performance Analysis
In order to study the performance analysis of 2D-MD SAC-OCDMA system in LR-PON context, we present in this section the SNR, BER and Q-factor expressions. SNR is described as function of detected current at the photo-detector receiver divided by the current noise. It is computed as follows:
The
term corresponds to the addition of the variance of the shot noise, the variance of the thermal noise, the variance of the PIIN noise and the variance of the amplifier noise given as follows:
The variance of the shot noise and the variance of the thermal noise are given in Equations (7) and (8), respectively.
By checking the 2D-MD codes generated in
Table 2, we have referred the overlapped chip, shown in red color. Moreover, it is known that MAI is overall generated when two ones at least have the same phase. As a result, this accompanies PIIN at receiver level. To support the above mentioned result, a lot of works have been considered PIIN effect in 2D-OCDMA system [
13,
14]. The PIIN variance can be calculated as follows [
14]:
where
The variance of the amplifier noise is given as follows:
where
is defined as the spectral density of the amplified spontaneous emission of the EFDA amplifier [
28]. Likewise,
is the optical frequency,
is the gain of the amplifier,
is Planck’s constant and
is referred to as the spontaneous emission factor.
where
,
R,
Kb,
Tn,
RL,
and
are the PIN bandwidth, PIN Responsivity, Boltzmann constant, PIN temperature, load charge resistance, laser optical power and wavelength bandwidth.
The BER is described as function of SNR as follows:
Q-factor is described as function of BER as follows [
29]:
The effect of the nonlinear impairment to the SAC-OCDMA system performance is studied through the generalized nonlinear Schrödinger (GNLS) equation, defined as follows [
30]:
where
z is the propagation distance and
A is the scalar version of the optical field.
In Equation (14), the linear terms are the attenuation coefficient α, the group delay term, the second order dispersion coefficient and the third order dispersion coefficient whereas γ is the nonlinear coefficient (i.e., Kerr).
The nonlinear coefficient is defined as [
30]:
where
and
are defined as the nonlinear index fiber (2.6 ×10
−20 m
2/W) and the fiber mode effective area, respectively. The effective area is defined as a quantitative measure of the area which a fiber mode effectively covers in the transverse dimensions. The fiber mode effective area is mathematically described as [
31]:
where
A(
x,
y) is defined as the distribution of the optical field on
x and
y axis.
The group delay term
is defined as follows:
where
and
defined as group velocity and group index.
In the wavelength domain, the GVD parameters
D and
S are defined as follows:
However, in the frequency domain, the GVD parameters
and
are defined as follows:
where
is defined as the angular frequency of the optical field.
5. Results and Discussion
Table 4 exhibits the simulation parameters deployed for the numerical simulation results of the Q-Factor calculation performed using a computer simulator tool, in particular for continuous wave (CW) Laser Array transmitter, Standard SMF (SSMF) specification G.652 [
32] and PIN specification [
33], respectively.
5.1. First Scenario: Without Considering MAI Effects
In order to focus on the other system limitations (i.e., nonlinear effects, increasing of bit rate and increasing of fiber length), we consider the system performance with a single user and without considering the MAI effects.
5.1.1. Q-Factor versus Bit Rate
Figure 3 presents the SAC-OCDMA system performance in terms of Q-factor versus bit rate (10–100) Gb/s, while taking into account the case of GVD in wavelength domain (i.e.,
only) and GVD in frequency domain (i.e., β2 and β3). The total distance simulated is 250 km of SMF. As shown in
Figure 3, the degradation in system performance is observed at bit rates above 55 Gb/s per network user corresponding to Q-factor below the Q limit (i.e., Q limit equal to 15.5 dB required to obtain a BER less than 10
−9), when the GVD in wavelength domain is considered (i.e., D = 16 ps/nm/km and S = 0.08 ps/nm
2/km). We also note that when the second and the third order dispersion are considered in the frequency domain (i.e., β2 = −20 ps
2/km and β3 = 0 ps
3/km, respectively), a degradation in system performance of 1 dB, 5.9 dB and 10.6 dB are observed at 30 Gb/s, 40 Gb/s and 50 Gb/s, respectively. Finally, the Q-factor limit of 15.5 dB is maintained at a total bit rate of 55 Gb/s, when the effects of GVD is manifested in the wavelength domain. Furthermore, when the GVD is simulated with frequency domain parameters (β2, β3), the system performance at a bit rate of 40 Gb/s results, to a certain extent, in a Q-factor within the vicinity of the Q-factor limit of 15.5 dB. The results in
Figure 3 illustrate the potential of utilizing Forward Error Correction (FEC) to mitigate the performance penalty due to the frequency domain parameters (β2, β3). For example, a hard decision FEC limit at a BER threshold of 3.8 × 10
−3 corresponding to a Q limit of 8.5 dB [
34] can be applied with a 7% overhead. As such, the results in
Figure 3, can be used in principle to estimate the potential gain from applying FEC encoding/decoding. By way of an example, a bit rate of 42.8 Gb/s which accounts for the 7% overhead and the target data bit rate of 40 Gb/s maintains a Q-factor above the FEC limit of 8.5 dB, resulting in error free transmission for the target data bit rate of 40 Gb/s.
5.1.2. Q-Factor versus Effective Area
Figure 4 presents the SAC-OCDMA system performance versus the effective area (Aeff) in the range of (13–93)
while increasing the bit rate and taking into account the second order dispersion (β2), the third order dispersion (β3) and the nonlinear coefficient (γ). The optical launch power was fixed to −3.4 dBm per user to facilitate isolating the effect of changing the effective area of the optical fiber. The numerical simulations can tolerate a maximum nonlinear phase shift of 10 mrad prior to updating the step-size of the fiber propagator.
As depicted in
Figure 4, at 30 Gb/s per user, the SAC-OCDMA system based on 2D-MD codes can tolerate the effects of second and third order dispersion and results in a Q-factor above the Q-limit with an average of 7 dB margin across all values of Aeff. However, above 40 Gb/s the second and third order dispersion become dominant leading to a degradation of the system performance while increasing the effective area. From Equation (16), the effective area of the SMF is inversely proportional to the nonlinear coefficient. Since the effective area decreases the nonlinear effect increases leading to the degradation of the system performance. When the effective area is considered and through increasing the bit rate from 30 Gb/s to 40 Gb/s, a degradation of the system performance of 5.3 dB, 5.2 dB and 5.1 dB is observed in terms of Q-factor at 93
63
and 33
, respectively. In addition, while increasing the bit rate from 40 Gb/s to 50 Gb/s a degradation of system performance of 7.2 dB, 7.2 dB and 7.1 dB is observed at 93
63
and 33
, respectively. As a result, the nonlinear effects with a high bit rate above 40 Gb/s led to a marginal performance degradation in the proposed SAC-OCDMA system. Therefore, the nonlinear effects seem to have insignificant effects on the Q-factor values unless the bit rate is relatively low (i.e., 30 Gb/s). This in fact can be explained in terms of the interplay between fiber dispersion and nonlinearity. At higher bit rates, pulse durations are shorter and thus experience the onset of fiber dispersion more rapidly resulting in pulse broadening and overlapping in time. Consequently, the induced nonlinear phase noise is largest when the signal is slow to evolve during propagation in dispersion managed systems. Furthermore, the results in
Figure 4, show that the use of Large Effective Area Fibers (LEAF) in dispersion managed systems offer marginal improvement in system performance. It is worth noting that our computer simulator tool utilizes the so called “total field model”, which merges all channels into a single optical field and propagated it through a single scaler version of Equation (14). Inherently, the effects of four wave mixing (FWM) is also modelled through this approach. The effect of FWM is reduced with the presence of chromatic dispersion as the propagating user channels become decoherent with reduced phase matching. As FWM does not depend on bit rate, the results in
Figure 4 illustrate that SPM is indeed the predominant nonlinear distortion.
5.1.3. Q-Factor versus Fiber Length
Figure 5 shows a comparison between the system performance with nonlinear effects (i.e., SPM and SRS) and without nonlinear effects (i.e., without NLE) versus the distance (i.e., fiber length) at a bit rate equal to 10 Gb/s per user and an effective area equal to 23
. One can see that the system limitation in terms of distance at the Q-limit is observed around 600 km and 480 km with linear and with nonlinear effects, respectively. In addition, when nonlinear effects are considered a degradation of system performance of 1.6 dB, 2.7 dB and 11.4 dB is observed at 300 km, 400 km and 500 km, respectively. In fact, SPM is related to the degradation of system performance due to the optical shift phase during the propagation through the core of the fiber [
35]. The optical launch power was optimized for each transmission distance. The effect of SPM can be reduced through allowing a certain amount of residual dispersion in the design of the dispersion map.
5.2. Second Scenario: With Considering MAI Effect
In this section, we consider all the effects including the MAI on SAC-OCDMA system performance.
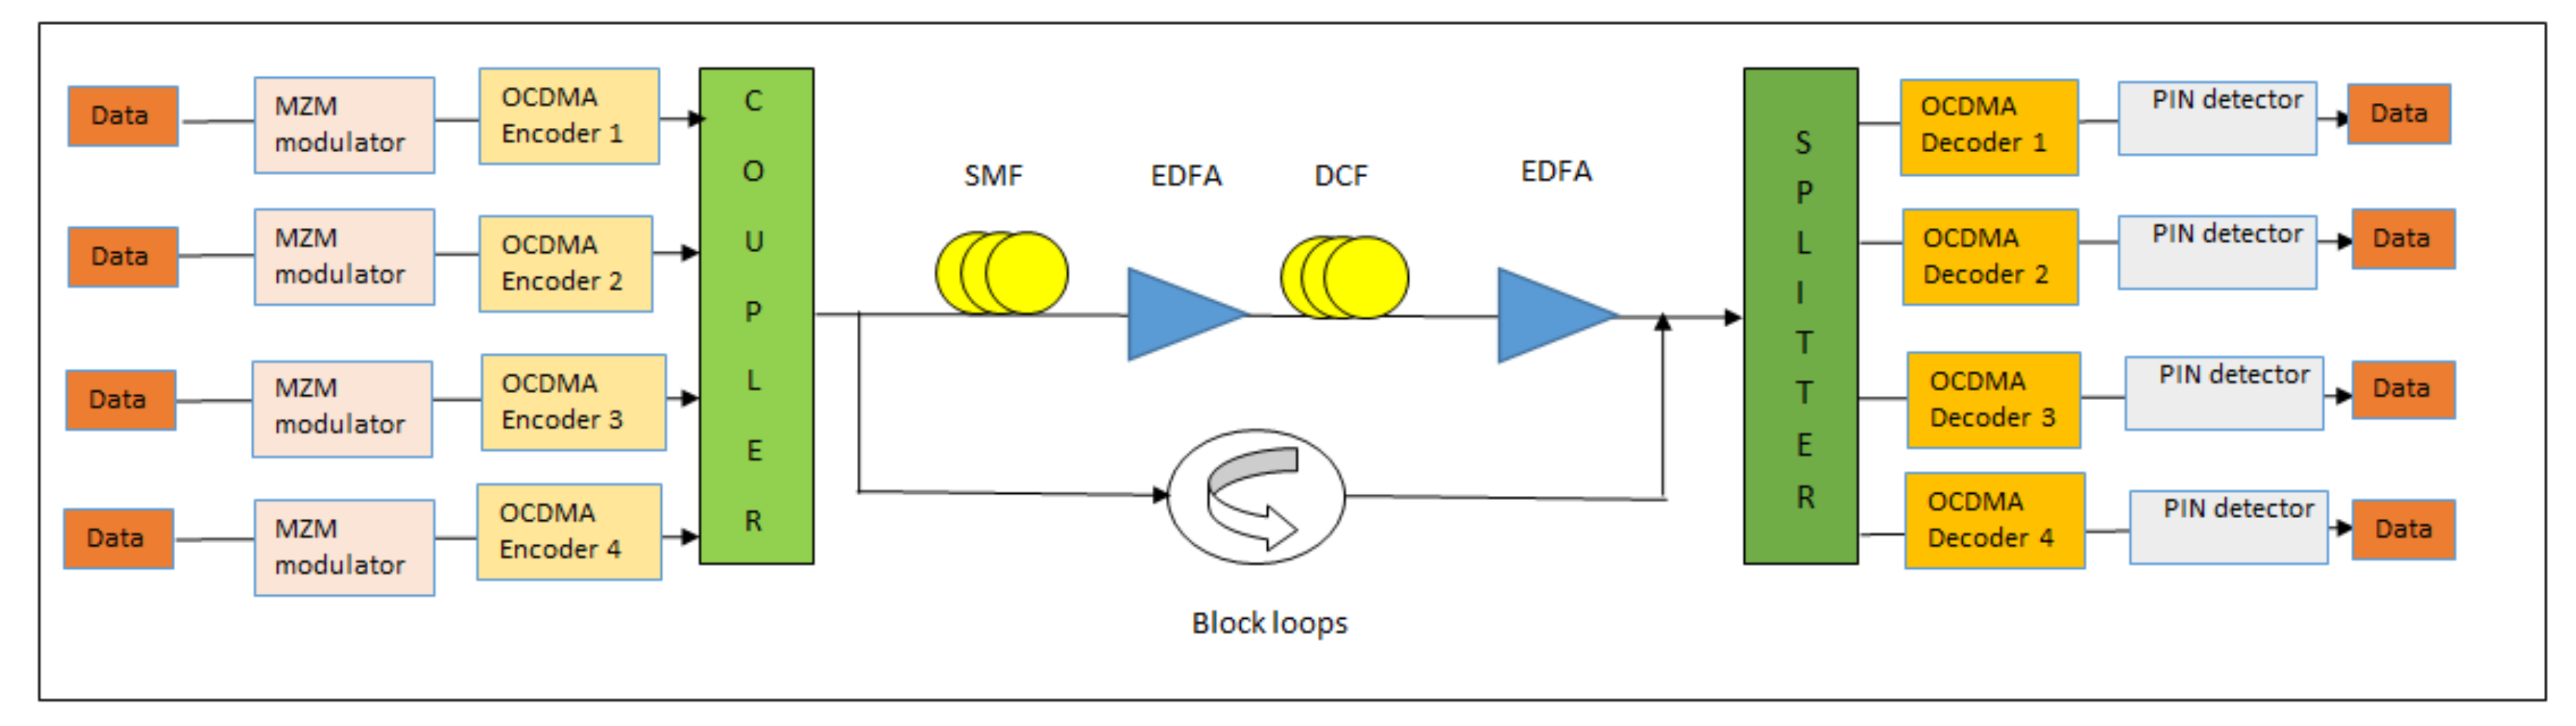
Figure 6, presents the system setup for four users. This system is composed of a CW laser array used to generate the three wavelengths required by the SAC-OCDMA encoder to produce the user signature for each network subscriber. Furthermore, user bits are generated by a pseudo-random bit sequence (PRBS) with a sequence length of 2
14−1 followed by an NRZ block to produce a line code. Then, a MZM external modulator is used to modulate the electrical user signal using the optical carrier generated by the CW laser. A SAC-OCDMA encoder is employed to multiply the generated ‘1′ user bit by the 2D-MD signature. Then, all user contributions are combined in one composite signal transferred into the optical channel. At the reception side, a SAC-OCDMA decoder is employed to extract the desired user signal from the received signal. Then, a photo-detector PIN is used to convert the optical desired signal into the electrical one. Furthermore, a Bessel filter, with a cutoff frequency equal to
is employed to limit the signal into the desired frequency band. Finally, a BER analyzer is used to measure the quality of the received user signal in terms of Q-factor and eye diagram. According to
Figure 4 (i.e., Q-factor versus effective area), we have to choose an aggregate bit rate less than 30 Gb/s to obtain a Q-factor higher than 15.5 dB. Indeed, we select a bit rate equal to 5 Gb/s per user to fulfill the high-quality transmission and to respect the user requirement for access network in terms of QoS.
Figure 7 shows the received electrical eye diagram for the different simultaneous users at 5 Gb/s per user and over 50 km of fiber transmission, while considering the optical coherent source noise, the linear effects (fiber loss, GVD, DGD), the nonlinear effects (SPM, SRS and γ) and the photodetector noise (i.e., thermal and shot noises).According to
Figure 7, the system can accommodate four users leading to a total aggregate bit rate of 20 Gb/s with an open eye diagram. Additionally, the open eye diagram of the four simultaneous users indicates a high transmission quality at an aggregate bit rate of 20 Gb/s.
Furthermore,
Table 5 illustrates a Q-factor greater than 15.5 dB for all users considering linear and nonlinear effects for two effective area values (
= 93
). In this simulation, the optical launch power was fixed to −3.4 dBm per user.
However, a degradation of the Q-factor is observed while increasing the number of users. Indeed, this degradation is due to the fact that increasing the number of users leads to the increasing of MAI and as a consequence the system performance decreases significantly. For one user (i.e., example user 1) the difference in Q-factor when nonlinear effect is counted (column 3 compared to column 4) is equal to (31.7 − 29.9) = 1.8 dB. So, in this scenario the nonlinear effect is a dominant factor compared to MAI. On the other hand, above one user (i.e., example user 2, user 3 and user 4 are considered) the difference in Q-factor when nonlinear effects is counted becomes limited and less than 1 dB. So, in this case MAI is more dominant compared to the nonlinear effects.
In addition, when the effective area decreases from 93 to 23, the nonlinear effects increase proportionally. As a conclusion, the raising of the bit rate and the increasing of the number of users (i.e., increasing the MAI) and the nonlinear effects (by decreasing the fiber mode effective area) are the most important causes of 2D-MD SAC-OCDMA system performance degradation.
To show the maximum number of allowed users permitted by the system as function of the bit rate,
Figure 8 represents the variation of the bit rate per user versus the number of users. According to
Figure 8, the maximum number of the allowed users is equal to 16, 8 and 4 at a BER value equal to 10
−9 and operating at 1.25 Gb/s, 2.5 Gb/s and 5 Gb/s per user, respectively. Furthermore, a trade-off is observed between the raising of the bit rate and the decreasing of the number of the allowed users.
In order to show the add value of our proposed system compared to the literature,
Table 6 makes a fair comparison of the different SAC-OCDMA systems in PON configuration in terms of coding scheme, cardinality (i.e., number of users supported in the system setup), performance measured metrics, supported bit rate per user and transmission reach.
As shown from
Table 6, various OCDMA coding schemes are proposed by researchers for SAC-OCDMA based on coherent sources such as 1D random diagonal (1D-RD) codes [
18], 1D-BIBD codes [
19] and 1D-MD codes [
20,
21].
As depicted in
Table 6, the proposed 2D-MD SAC-OCDMA system for LR-PON outperforms alternate proposals in literature in terms of the aggregate bit rate (i.e., 20 Gb/s) and transmission reach up to 50 km over SMF link, while maintaining a high-performance measured metrics via a Q-factor greater than 15.5 dB. As a conclusion, our proposed 2D-MD SAC-OCDMA system is well suited for LR-PON and can be a potential candidate for granting access network with high system performance and high security. In addition, it is known that SAC-OCDMA system provides the integrity security component inherited from the OCDMA features. In fact, without knowing the 2D-MD coding scheme it is impossible for any eavesdropper to decode the user’s signal and make any unauthorized change.


 ,
, 


