Article

Battery High Temperature Sensitive Optimization-Based Calibration of Energy and Thermal Management for a Parallel-through-the-Road Plug-in Hybrid Electric Vehicle

by
Pier Giuseppe Anselma
1,2,*,
Marco Del Prete
1 and
Giovanni Belingardi
1,2
1
Department of Mechanical and Aerospace Engineering (DIMEAS), Politecnico di Torino, 10129 Torino, Italy
2
Center for Automotive Research and Sustainable Mobility (CARS), Politecnico di Torino, 10129 Torino, Italy
*
Author to whom correspondence should be addressed.
Appl. Sci. 2021, 11(18), 8593; https://doi.org/10.3390/app11188593
Submission received: 30 June 2021 / Revised: 10 September 2021 / Accepted: 11 September 2021 / Published: 16 September 2021
(This article belongs to the Special Issue Frontiers in Hybrid Vehicles Powertrain)

Abstract

:
Preserving high-voltage battery pack lifetime represents a key issue in hybrid electric vehicles (HEVs). Temperature has remarkably major impacts on battery lifetime and implementing HEV thermal and energy management approaches to enhance fuel economy while preserving battery lifetime at various temperatures still represents an open challenge. This paper introduces an optimization driven methodology to tune the parameters of thermal and energy on-board rule-based control approaches of a parallel through-the-road plug-in HEV. Particle swarm optimization is implemented to this end and the calibration objective involves minimizing HEV operative costs concerning energy consumption and battery degradation over the entire vehicle lifetime for various ambient temperatures, driving conditions, payload conditions, and cabin conditioning system states. Numerical models are implemented that can estimate the evolution over time of the state of charge, state of health, and temperature of HEV high-voltage battery packs. Obtained results suggest that the calibrated thermal and energy management strategy tends to reduce pure electric operation as the ambient temperature progressively increases beyond 30 °C. The consequent longer internal combustion engine operation entails a gradual increase in the overall vehicle energy demand. At a 36 °C ambient temperature, the HEV consumes 2.3 times more energy compared with the 15 °C reference value. Moreover, activating the cabin conditioning system seems beneficial for overall plug-in HEV energy consumption at high ambient temperatures. The presented methodology can contribute to easing and accelerating the development process for energy and thermal management systems of HEVs.

1. Introduction

Lithium-ion batteries currently represent the most commonly employed energy storage systems on-board hybrid electric vehicles (HEVs) and pure electric vehicles [1,2]. They allow the storage of electrical energy for subsequent use as vehicle propelling energy. However, they present some critical issues that currently contribute to restricting the widespread diffusion of electrified powertrains. As an example, the current high cost of Li-ion battery packs (250–2500 $/kWh [3]) is a major factor in making the retail price of electrified vehicles considerably higher compared with vehicles equipped with traditional propulsion systems, i.e., based solely on internal combustion engines (ICEs) [4]. Moreover, Li-ion battery packs notably suffer from degradation of performance throughout their lifetime: their internal resistance increases, their capacity reduces, and their charge and discharge power capabilities consequently decrease [5]. Battery degradation worsens the performance of the electrified vehicle both in terms of fuel economy and acceleration capability [6]. Cyclic ageing that occurs during effective battery operation is normally considered the most critical ageing aspect [7]. The rate of cyclic ageing depends on given battery operating factors such as the C-rate, state-of-charge (SOC), and battery temperature as examples [8,9,10].
In general, the more critical the battery operating conditions, the more rapidly the battery approaches its end-of-life (EOL). However, defining the battery EOL is not a trivial operation. Indeed, the battery EOL is not simply related to the effective maximum number of charging and discharging cycles that a battery can supply, but rather to a more subtle concept of battery charge throughput (often expressed as Ah-throughput). The total number of allowed battery cycles loses relevance as the nominal capacity decreases below a certain value. The progression of the battery towards its EOL is normally monitored by the battery state-of-health (SOH) and it ends when the effective battery capacity is reduced to 80% of its initial nominal value [11].
Progressive capacity loss in Li-ion energy storage systems involves specific chemical processes that take place within the cells. For example, a solid electrolyte interface (SEI) layer gradually grows on the anode with a rate that particularly accelerates at high temperatures above 35 °C [12]. Battery ageing is also due to lithium plating at the anode, which principally occurs at low temperatures below 15 °C [13]. However, battery ageing also occurs when the temperature of the battery is between 15 °C and 35 °C at a rate that depends on the battery C-rate, SOC swing, and battery temperature itself [14].
Developing battery SOH sensitive EMSs for HEVs has become a topic of growing interest in the literature. In 2012, Ebbesen et al. first adopted the concept of SOH for controlling battery ageing using a throughput-based capacity fading model. They simulated different driving missions by means of a quasi-static HEV model controlled by an equivalent consumption minimization strategy (ECMS) [15]. Similar considerations were made by Onori et al. in the same year, who introduced a severity factor in place of the battery SOH [16]. Further battery SOH sensitive energy management approaches were then introduced in the following years. The concept of dual-objective ECMS for controlling fuel consumption and battery ageing was further extended in 2015 [17] and in 2019 [18]. These investigations demonstrated that considerable economic saving can be achieved by preserving the same battery pack for the entire vehicle lifetime. Different battery SOH sensitive HEV energy management approaches were developed, including convex optimization [19], model-predictive control [20], and dynamic programming [21,22].
The above studies assumed that battery temperature was kept constant by the conditioning system throughout the entire simulated driving missions. However, guaranteeing a constant battery temperature over time can represent a difficult task for the thermal regulation system, and slight temperature oscillations can occur even in best case scenarios. A number of studies have currently begun to assess this issue. The authors of this paper conducted a one-year long experimental campaign to validate the battery lifetime predicted by a SOH sensitive HEV EMS and found that an increase in the average cell surface temperature of only 1 °C can culminate in as much as a 15,000 km or 7% decrease in the cell lifetime [23]. Du et al. recently considered energy management for a parallel plug-in hybrid electric bus sensitive to both battery temperature and SOH. They suggested that noticeable equivalent cost savings might be attained by limiting the overall battery temperature increase while driving [24]. Although these works represent steps in the right direction, extensive research is still needed to develop a battery thermal management system whose calibration can guarantee a satisfactory high-voltage battery kilometrical lifetime. The present work introduces an optimization-driven calibration method for the on-board energy and thermal management of a plug-in HEV. The aim is to minimize operative costs of fuel and electrical energy consumption and battery degradation over the entire vehicle lifetime. The optimization-driven calibration workflow considers different ambient temperatures, driving conditions, payload conditions, and cabin conditioning system states. The developed HEV energy and thermal management strategy proved to flexibly adapt to different ambient temperatures. Moreover, the strategy limits the increase in the overall HEV energy demand that may be expected when ambient temperature rises above 30 °C.
The paper is organized as follows: the retained HEV powertrain model and baseline on-board EMS are presented first. Section 3 then describes the numerical models implemented to reproduce the electrical, thermal, and ageing behavior of the high-voltage HEV battery. The battery cooling system and its numerical model are also described. The optimization-driven calibration of the HEV EMS is discussed in Section 4. Results are presented in Section 5, with conclusions drawn in Section 6.

2. HEV Modeling and Baseline Energy Management

Figure 1 illustrates a schematic diagram of the parallel-through-the-road plug-in HEV powertrain retained in this study. The vehicle configuration has been inspired by the commercially available Jeep Renegade 4xe® [25]. This HEV is equipped with a 1.3-L, four-cylinder, turbocharged spark-ignition internal combustion engine (ICE) on the front axle. Moreover, two permanent magnet electric motor/generators are embedded, one in configuration P4 (at the rear axle) and one in configuration P0 as a belt starter-generator. These are respectively indicated as MGP4 and MGP0 in the paper. It should be noted that the high-voltage battery has been considered made of A123 26650 cells instead of LiNiMnCoO2 (NMC) cells, as in the commercially available Renegade 4xe®. This choice stems from the availability of both a widely accepted battery cyclic ageing model and open-source data for A123 26650 cells [14,26]. The number of cells has been selected targeting overall pack parameters as close as possible to the ones of the commercially available plug-in HEV (e.g., 11.4 kWh nominal capacity and 400 V nominal voltage). Retained vehicle data are reported in Table 1, while the follow-up of this section discusses further details concerning the on-board HEV energy management logic and the considered powertrain modeling approach.

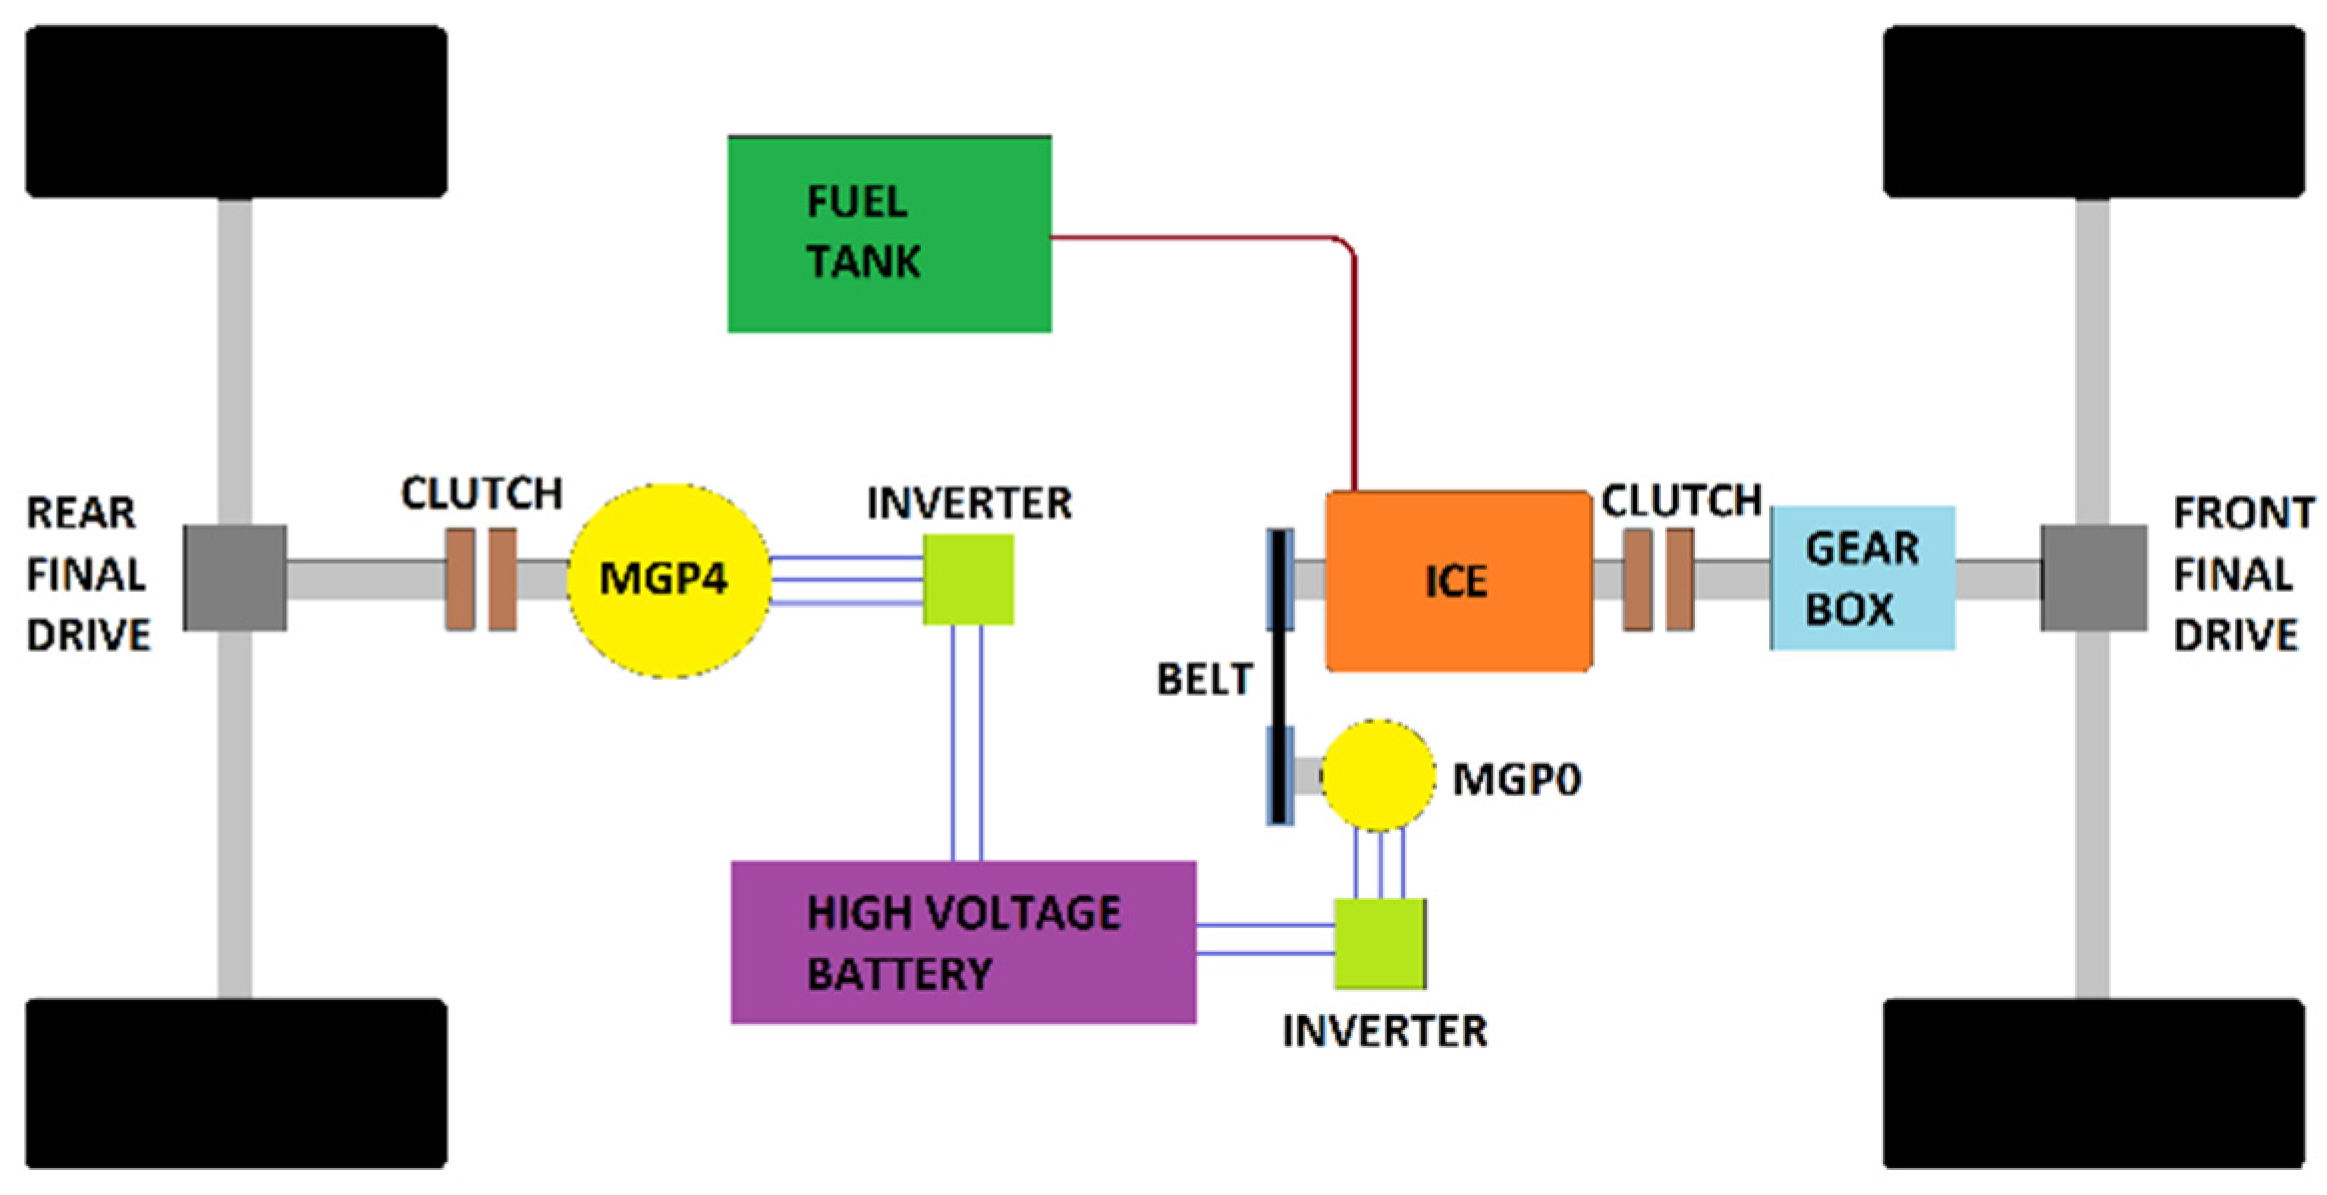
2.1. HEV on-Board Energy Management Strategy

The considered HEV embeds an ICE, a MGP0, and a MGP4. These three power components allow the HEV to choose between the three following operating modes while driving [25]:
  • Electric mode, in which the traction is provided by the MGP4 alone;
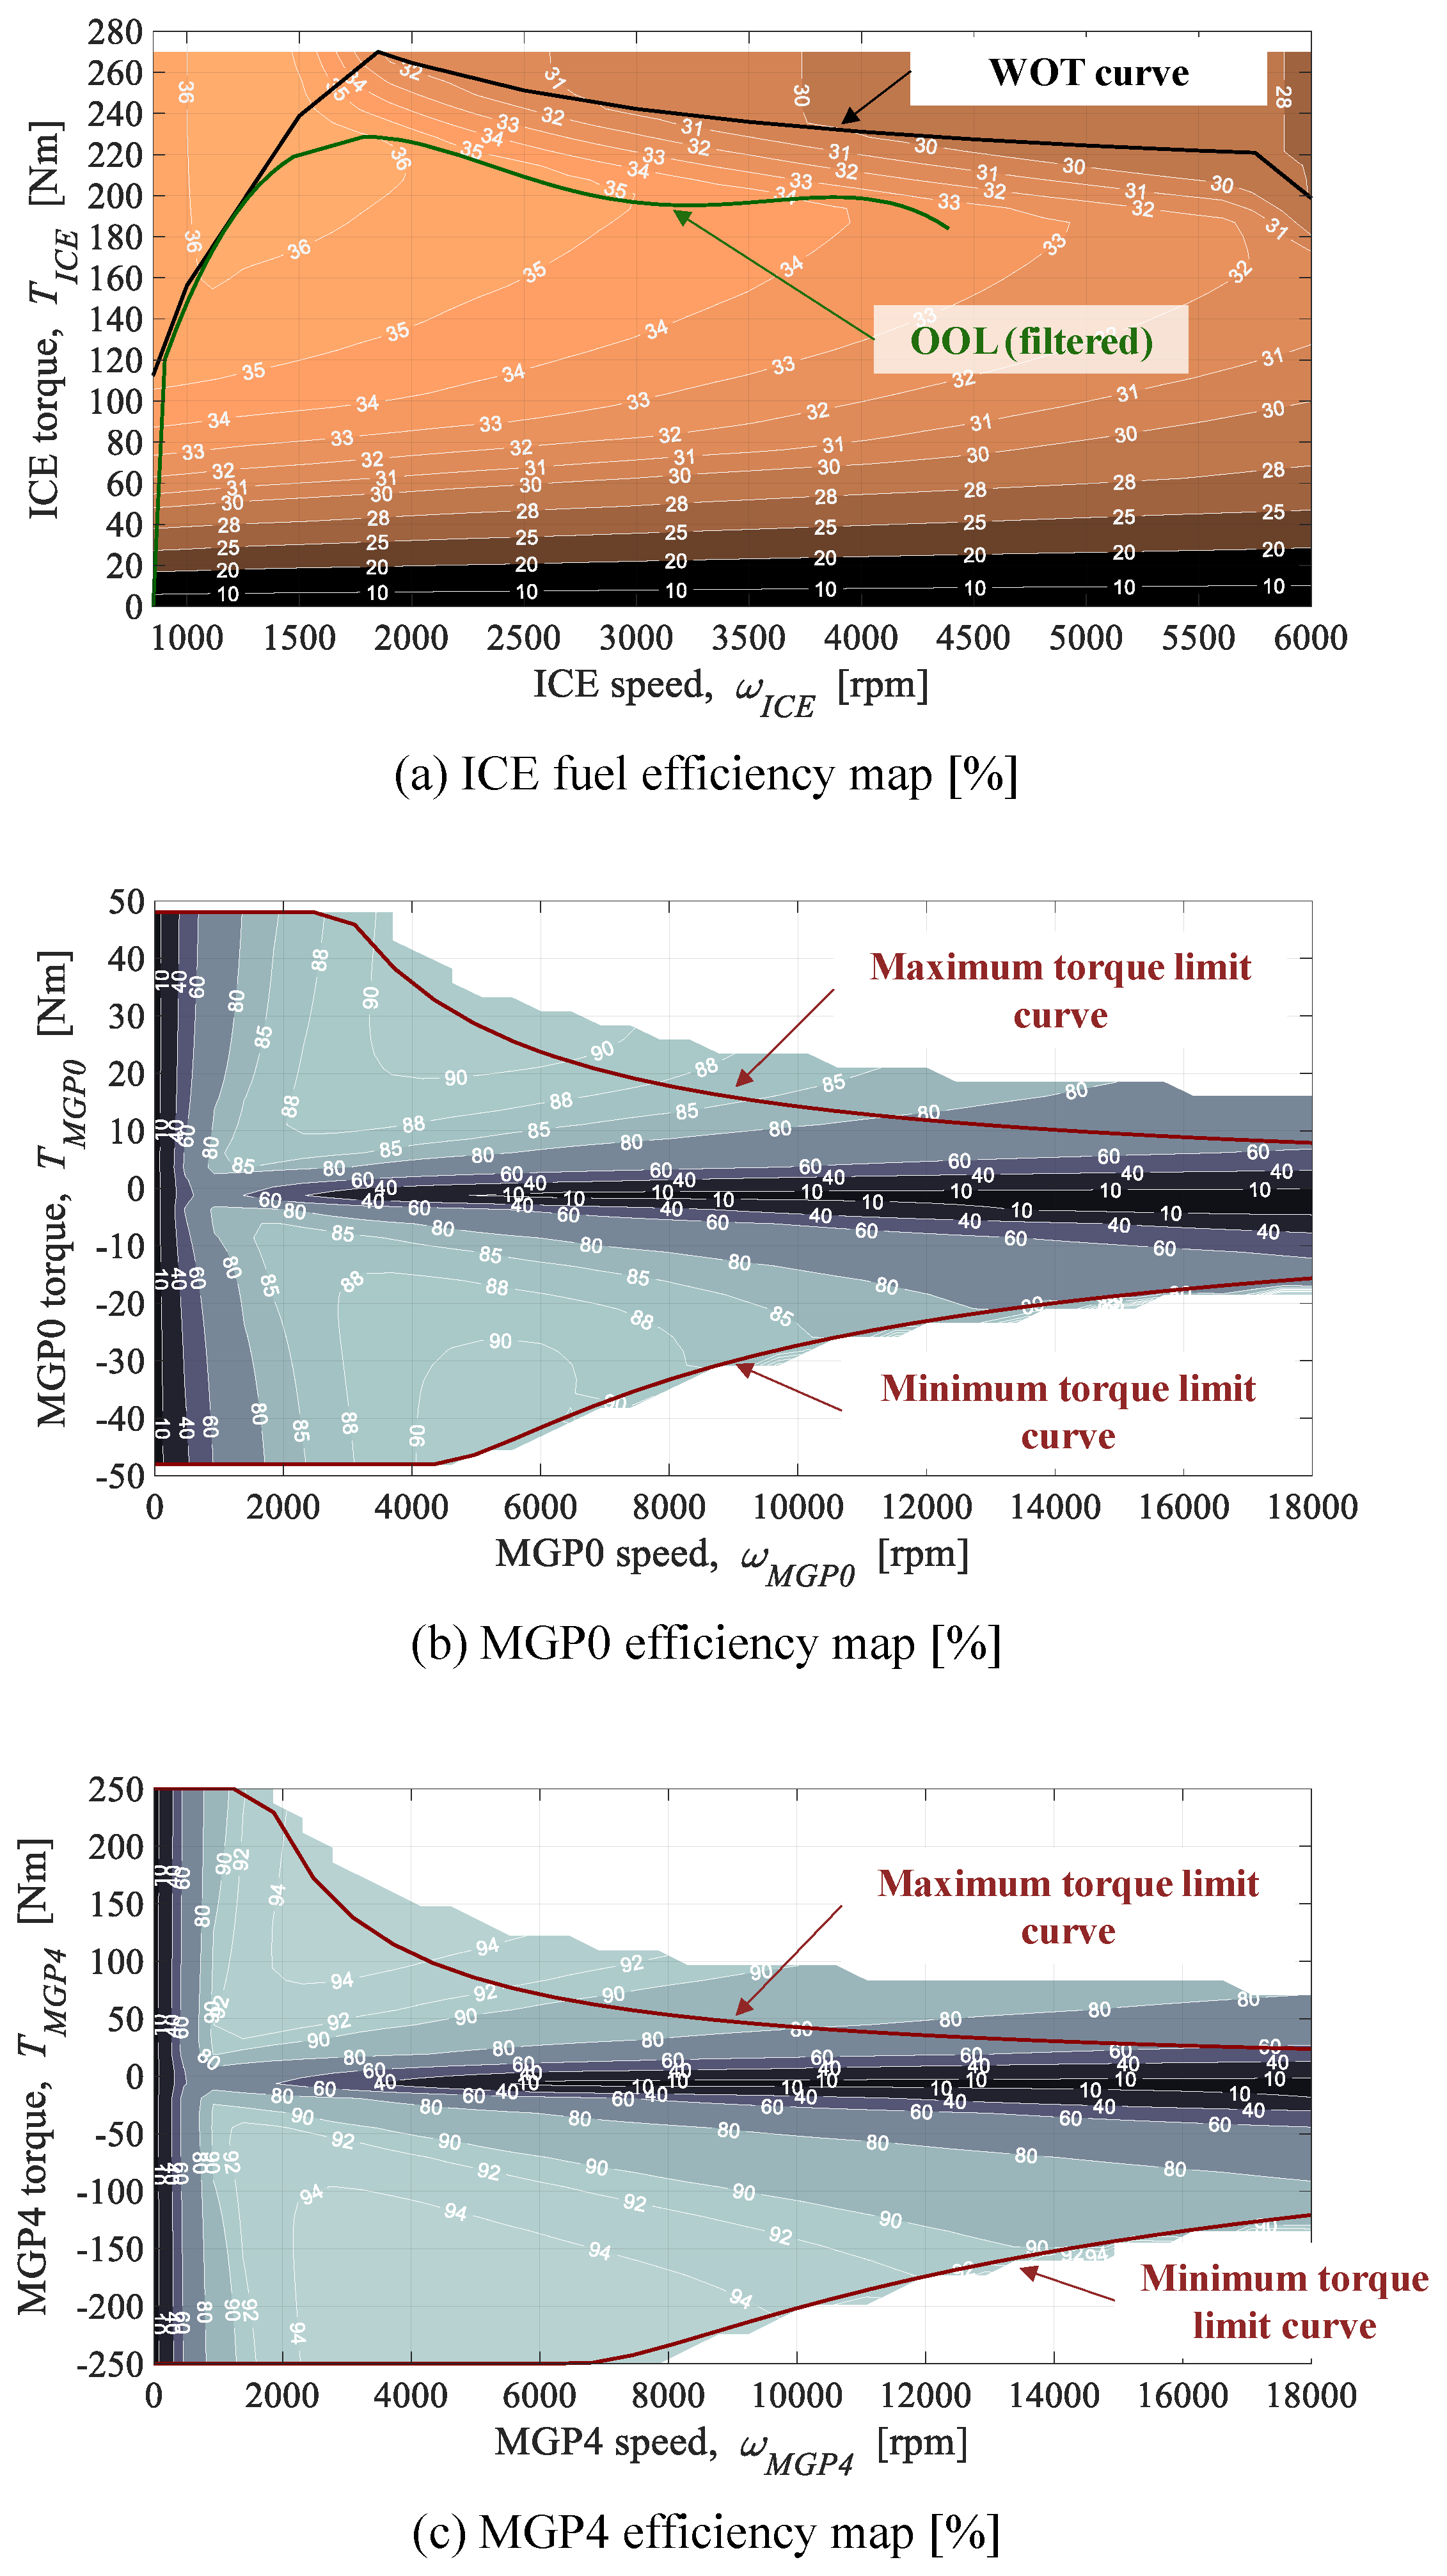
  • Hybrid mode, which is characterized by the three power components being controlled in order to have the ICE working close to its optimal operating line (OOL). The OOL is particularly defined by the values of ICE torque that maximize the engine efficiency for each given value of rotational speed;
  • E-save mode, where the ICE can be simultaneously employed for propelling the HEV and charging the battery by means of MGP0 and MGP4 working as generators. In particular, the instantaneous ICE power is controlled to be the maximum value between the one corresponding to its OOL and the one required to propel the HEV alone.
All the operating modes allow performing regenerative braking, while the baseline HEV controller implemented in this study is assumed to operate as follows:
  • As the HEV starts a given driving mission, pure electric operation is selected if the battery is sufficiently charged. Then, an automatic shift to Hybrid mode is performed if the SOC goes below 0.30 in order to preserve battery charge sustenance. Moreover, if the driver’s power demand exceeds the value that can be provided by the MGP4 alone in Electric mode, then the powertrain temporarily operates in Hybrid mode.
  • In case the value of battery SOC falls below 0.25, the rule-based HEV controller switches to the E-save mode to charge the battery until SOC reaches 0.30. Hybrid mode is subsequently set as the operating mode.
  • Regenerative braking is disabled when the battery SOC exceeds the upper limit, which is set to 0.8 here. This is performed as Li-Ion cells significantly degrades when being charged at high SOC values [27].

2.2. HEV Modeling Approach

A quasi-static approach was adopted for modeling the HEV in Matlab/Simulink® software (Mathworks Inc., Natick, MA, US). This approach is largely used in design and analysis activities for HEV powertrains thanks to its high computational efficiency [28]. A proportional–integral–derivative (PID) controller is introduced here to model the driver following the speed profile over time for given drive cycles. Lookup tables of power components employed in this paper are illustrated in Figure 2 and they have been generated using dedicated tools in Simcenter Amesim® software (Siemens PLM, Camberley, UK). The mathematical procedures implemented in the software to generate the lookup tables are available in the literature [29,30].
The total vehicle resistive force F r e s can be easily computed from the vehicle free body diagram using Equation (1):
F r e s = F a e r o + F r o l l + F m i s c + F g r a d
where F a e r o is the aerodynamic drag,   F r o l l represents the rolling resistance,   F m i s c incorporates some miscellaneous terms, whereas F g r a d   is the grading resistance related to road slope angle ϑ . Specifically, the above resistive terms were evaluated as follows:
F a e r o + F r o l l + F m i s c = A + B v + C v 2
F g r a d = m v e h g s i n ϑ
where A , B ,   and C   are the vehicle road load coefficients [31], v is the longitudinal speed of the vehicle, g   represents the gravitational acceleration, and m v e h is the total mass of the vehicle in kilograms that was assumed to be related to the number of passengers n p a s s :
m v e h = 1768 + 100 · n p a s s .
The tractive or braking force F p w t that is provided at the wheels by the powertrain was introduced. Then, the equilibrium equation at the vehicle level could be written as follows:
m v e h a = F p w t F r e s , t o t
where a indicates the longitudinal acceleration of the vehicle. The powertrain torque T p w t requested at the wheels could thus be computed as follows:
T p w t = F p w t r w h e e l
where r w h e e l is the radius of the wheels. All possible terms contributing to T p w t were considered, and Equation (7) could thus be obtained:
T p w t = T I C E , w h e e l + T M G P 4 , w h e e l + T M G P 0 , w h e e l T b r a k e s
where the terms T I C E , w h e e l ,   T M G P 4 , w h e e l ,   and T M G P 0 , w h e e l represent the values of torque provided at the wheels by the respective power components, while T b r a k e s is the braking torque supplied by the brake system.
The torques of power components T I C E ,     T M G P 4 , and T M G P 0 were evaluated backwardly from the respective torques outputted at the wheels by means of relations using the transmission ratios reported in Table 1 and appropriate efficiencies [32]. The wheel angular speed ω w h e e l   could be defined as follows:
ω w h e e l = v r w h e e l .
ω M G P 4 , ω I C E , and ω M G P 0 that respectively represent angular speeds of MGP4, ICE, and MGP0 can be evaluated by multiplying times transmission ratios. Once the operating conditions (i.e., torque and speed) are known for each power component, evaluating the fuel consumed by the ICE and the electric power requested to the high-voltage battery by the electric motors is possible through considering the following equations:
M f u e l = 0 t m ˙ f u e l d t + n c r a n k m c r a n k
P b a t , M G P 4 = ω M G P 4 T M G P 4 + P l o s s , M G P 4
P b a t , M G P 0 = ω M G P 0 T M G P 0 + P l o s s , M G P 0
where M f u e l is the total amount of fuel in grams consumed by the ICE up to time instant t , m ˙ f u e l is the fuel consumption rate in grams per second, m c r a n k is the mass of fuel required to crank the ICE (equal to 0.5 g here [33]), n c r a n k takes into account the number of activations over time, P b a t , M G P 4 and P b a t , M G P 0 are respectively the powers requested or supplied by the electric motors to the battery, whereas P l o s s , M G P 4 and P l o s s , M G P 0 indicate the power losses that characterize the two electric motors. These were evaluated by means of the lookup tables reported in Figure 2. The electrical, thermal, and ageing behavior of the battery could then be modeled as described in the following section.

3. High-Voltage Battery and Air Cooling System Modeling

The following methodologies were adopted here for modeling the plug-in HEV high-voltage battery pack from electrical, thermal, and ageing perspectives:
  • An equivalent circuit model for battery electrical modeling;
  • A single temperature lumped-parameter model that evaluates battery temperature evolution during HEV operation, which is coupled with the air cooling system model;
  • A throughput-based battery capacity fade model that evaluates battery cyclic ageing.
  • Each of the listed modeling methodologies is illustrated in the follow-up of this section.

3.1. Equivalent Circuit Model

Following a common approach from literature, the battery pack was modeled with an equivalent circuit [34]. To this end, Thevenin’s theorem was applied to the pack configuration illustrated in Table 1 and constituted by A123 cells. In particular, the following equations hold:
O C V b a t = N s O C V c e l l
R b a t = N s N p R c e l l
where N s and N p are respectively the number of cells in series per branch and the number of branches in parallel, O C V c e l l and O C V b a t represent open circuit voltages of one single cell and of the high-voltage battery pack, whereas R c e l l and R b a t are the internal resistances of the cell and pack, respectively.
Similarly, cell and battery pack capacities C c e l l and C b a t were linked as in Equation (14):
C b a t = N p C c e l l .
Battery current I b a t can be computed by means of Equation (15) by applying the power conservation law to the battery equivalent circuit model and by introducing battery power P b a t , which is detailed in Equations (22)–(25) in Section 4:
I b a t = O C V b a t O C V 2 b a t 4 P b a t R b a t 2 R b a t .
The instantaneous battery C-rate c could then be evaluated using Equation (16):
c = | I b a t |   C b a t   .
Battery state-of-charge S O C could consequently be evaluated by knowing its value at the beginning of the driving mission ( S O C 0 ) and using the current integration method:
S O C = S O C 0 0 t I b a t C b a t d t .
It should be noted that cell parameters are not constant, but rather their values change during HEV operation. With respect to O C V c e l l , its value varies with S O C , whereas R c e l l depends on more factors, namely S O C , C-rate, battery temperature, and charging/discharging conditions [14]. O C V c e l l is sensitive to temperature variation as well, but its variation normally has less impact.

3.2. Single Temperature Lumped-Parameter Model and Battery Cooling System

Temperature has an extremely major impact on battery lifetime, which is especially holds when it falls beyond the ideal thermal thresholds that are currently estimated within 15 °C and 35 °C [12]. The high-voltage battery pack is an extended body characterized by a spatial distribution of temperature values, which is rather complex to model [35,36]. A wide range of battery thermal modeling options is available in the literature. Among these, lumped-parameter thermal models can be suggested as a good trade-off between model accuracy and ease of implementation in Matlab/Simulink® software. A single temperature lumped-parameter model of the battery has been implemented here by taking inspiration from the works by Han et al. [37] and Jaguemont et al. [38].
The battery pack considered in this paper is constituted by a total of 1440 cylindrical cells of type A123 26650. As reported by the manufacturer [26], each cell is shaped in a cylinder of Ø26 × 65 mm and weights of 76 g. Reasonable values for battery and air thermal parameters were obtained by combining cell manufacturer data with data extracted from the work presented by Kim et al. in 2013 [39]. These values have been reported in Table 2. In particular, they refer to the battery pack mass m b a t , to its specific heat c b a t and to its sizes: length l b a t , height H b a t , and width w b a t . S b a t represent the exchange surface with the surrounding air, which characterizes for a specific heat c p , a i r . Despite being modeled using a thermal lumped approach, the battery pack was not assumed to be lumped from a spatial point of view, as displayed in Figure 3. Notably, 40, 3, and 12 cells were particularly aligned along l b a t , H b a t , and w b a t , respectively. The assembly of the battery pack was conceived to leave sufficient space for the channels in which the air flows when the cooling system is in operation. These channels were assumed to be 15 mm wide, and they constitute the overall cooling exchange surface between air and cells S c o o l i n g whose value is reported in Table 2. h s i d e , a i r and h c o o l i n g , a i r are convective coefficients for the air surrounding the battery and the air forced to circulate in the cooling channels, respectively.
The rest of this sub-section is structured as follows: the air cooling system for cabin and battery is described first. The numerical thermal modeling approach adopted for the battery pack is then illustrated, and the implemented HEV battery thermal management strategy is finally described.

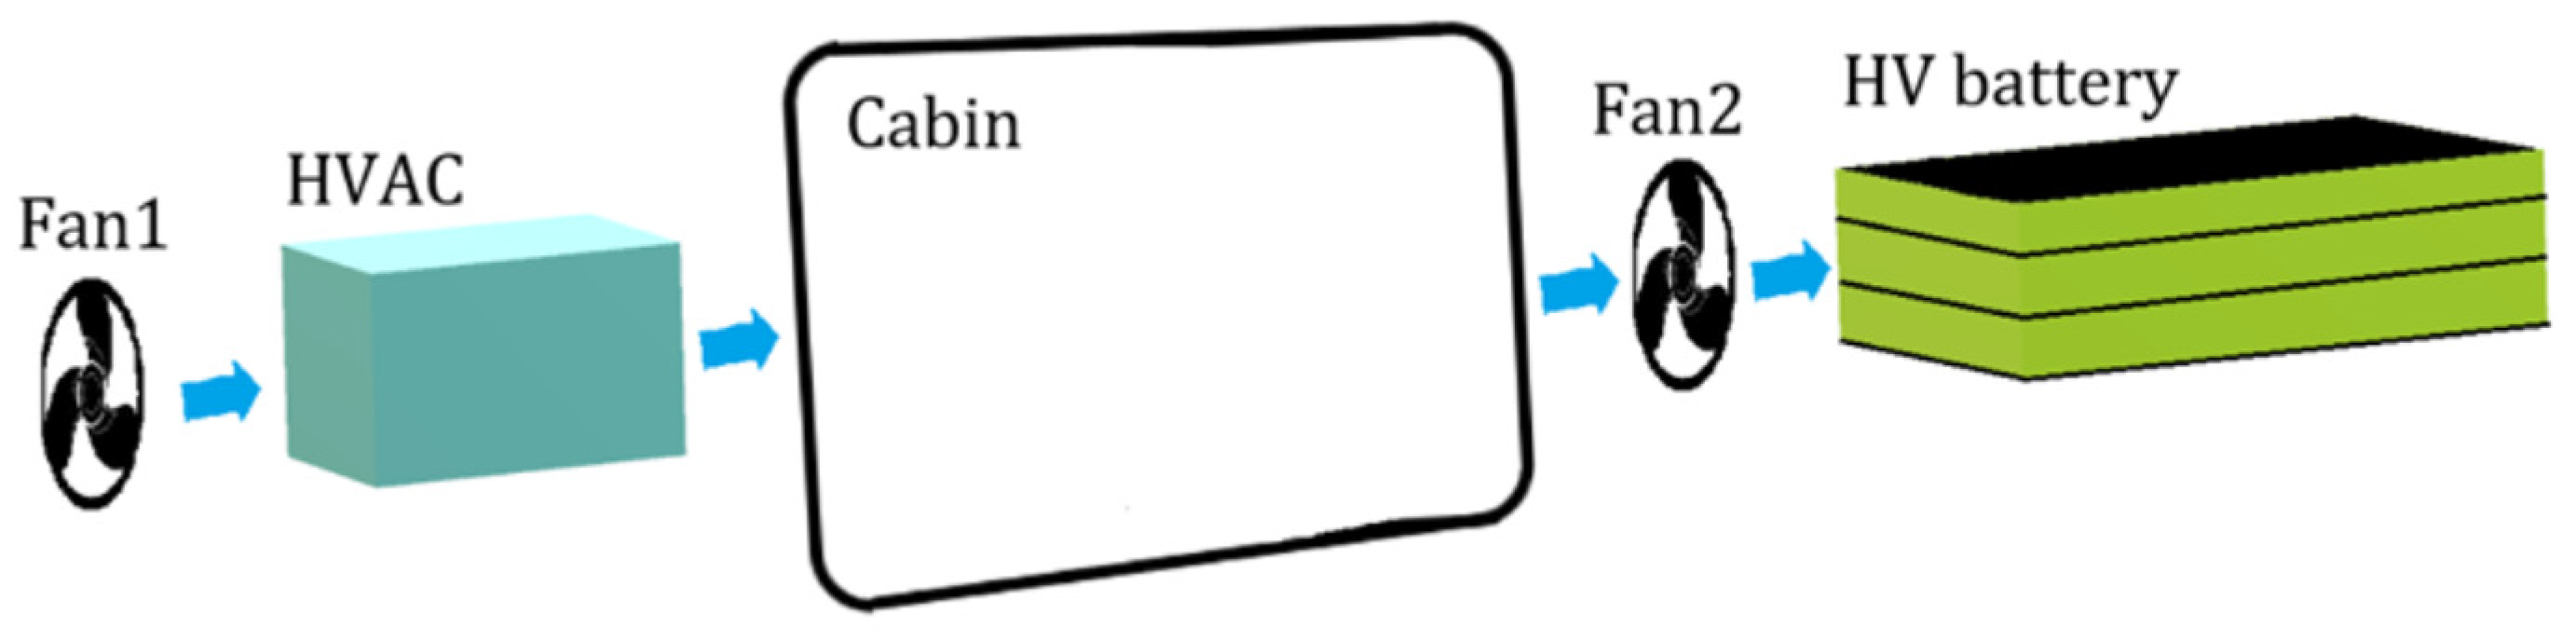
3.2.1. Air Cooling System

The battery air cooling system has been assumed here to be capable of exploiting the cabin conditioned air, as suggested for example in the paper by Han et al. [37]. Air cooling is less effective than liquid cooling, however this approach is still widely used thanks to its limited cost and its ease of installation [40]. Moreover, several examples of its application can be found in the literature when aiming to evaluate the thermal behavior of cylindrical Li-ion cells [41,42]. Furthermore, the objective of this work does not relate to identifying the most suitable cooling system, but rather to analyze how the operation of a realistic cooling system impacts on the effective electrical power consumption during a given driving mission. A scheme of the cabin and battery air cooling system implemented here is reported in Figure 4.
When the battery cooling system is activated, air flow is enabled between vehicle cabin and high-voltage battery thanks to Fan2 in Figure 4. In this case, air flows through the battery in the dedicated channels between the cells. A forced convection heat exchange occurs in this framework through the surface S c o o l i n g . Cabin climate comfort of the passengers might be slightly affected by such air flow circulation between the cabin and high-voltage battery [40]. If cabin air conditioning is not activated by the HEV passengers, the air flow enabled by Fan2 to cool the battery will be at ambient temperature, thus considerably limiting the cooling effect. On the other hand, if cabin air conditioning is activated by the passengers, air flow will be enabled by Fan1 in Figure 4 from the HVAC (Heating, Ventilation, and Air Conditioning) system to the cabin. The air flow coming from the HVAC system will be at the temperature set by the HEV passengers for the air conditioning system. When the battery cooling system is not activated, the battery pack only dissipates heat with the surrounding air at cabin temperature by means of natural convection and passive cooling through its side surface S b a t .

3.2.2. Battery Thermal Model

The heat generated by the battery due to Joule effect ( Q j o u l e ) can take three different paths: a portion Q b a t , h e a t remains stored in the battery and contributes to increasing its temperature, while a quantity Q c o n v , n a t is dissipated by means of natural convective phenomena with the surrounding air. This latter is expected to remain at a constant temperature whose values refer to the cabin temperature T c a b . The final heat path Q c o n v ,   A C is different from zero only when the battery cooling system is in operation. This represents the portion of heat transferred from the battery pack to the air flowing at cabin temperature T c a b thanks to Fan2 being activated. When the HVAC system is not in operation, the cabin temperature T c a b has been considered as equal to the ambient temperature. On the other hand, when the HEV passengers activate the air conditioning, cabin temperature has been assumed to be constantly at 20 °C. The thermal balance for the battery pack can thus be obtained as in Equation (18):
Q j o u l e = Q b a t , h e a t + Q c o n v , n a t + Q c o n v ,   A C
which in turn can be written by detailing each term as follows:
R b a t · I b a t 2 = m b a t · c b a t · d T b a t d t + h s i d e , a i r · S b a t · ( T b a t T c a b ) + h c o o l i n g , a i r · S c o o l i n g · ( T b a t T c a b ) · ( B a t c o o l i n g > 0 )
where m b a t   , c b a t , T b a t , and S b a t refer respectively to battery mass, specific heat, temperature, and exchange surface with the surrounding air. B a t c o o l i n g is a binary flag and its value is set to 1 when the battery air cooling system is in operation (i.e., Fan2 is activated). All the thermal parameters have been reported in Table 2. It should be noted that Q j o u l e in Equation (19) has been considered to be related to Joule’s heating only. Battery temperature variation due to entropy changes was not considered here in the same way as normally assumed in the literature [43].
It should be admitted that a few assumptions were made for the illustrated battery thermal model. First, the formulation for Q c o n v ,   A C used in Equation (19) assumes that the air flow remains at a constant temperature equal to T c a b during the heat exchange with the battery pack. Moreover, assuming a constant value for the convective coefficient h c o o l i n g , a i r is not rigorous. Indeed, the convective coefficient is not an intrinsic property of the considered fluid, rather it also depends on the geometry of the object immersed in the fluid flow and on the flow rate magnitude [35]. As consequence, the evaluation of h c o o l i n g , a i r is rather complex and it is normally obtained by means of empirical correlations available in the literature. These correlations relate to forced convection and they consider the a-dimensional coefficients of Reynolds, Prandtl, and Nusselt [42]. However, these correlations normally refer to very simple cases and they might lead to important errors if applied to more complicate configurations. Although these approximations are not realistic, they aim to avoid introducing further modeling inaccuracy and they could therefore be retained for the purposes of this paper.

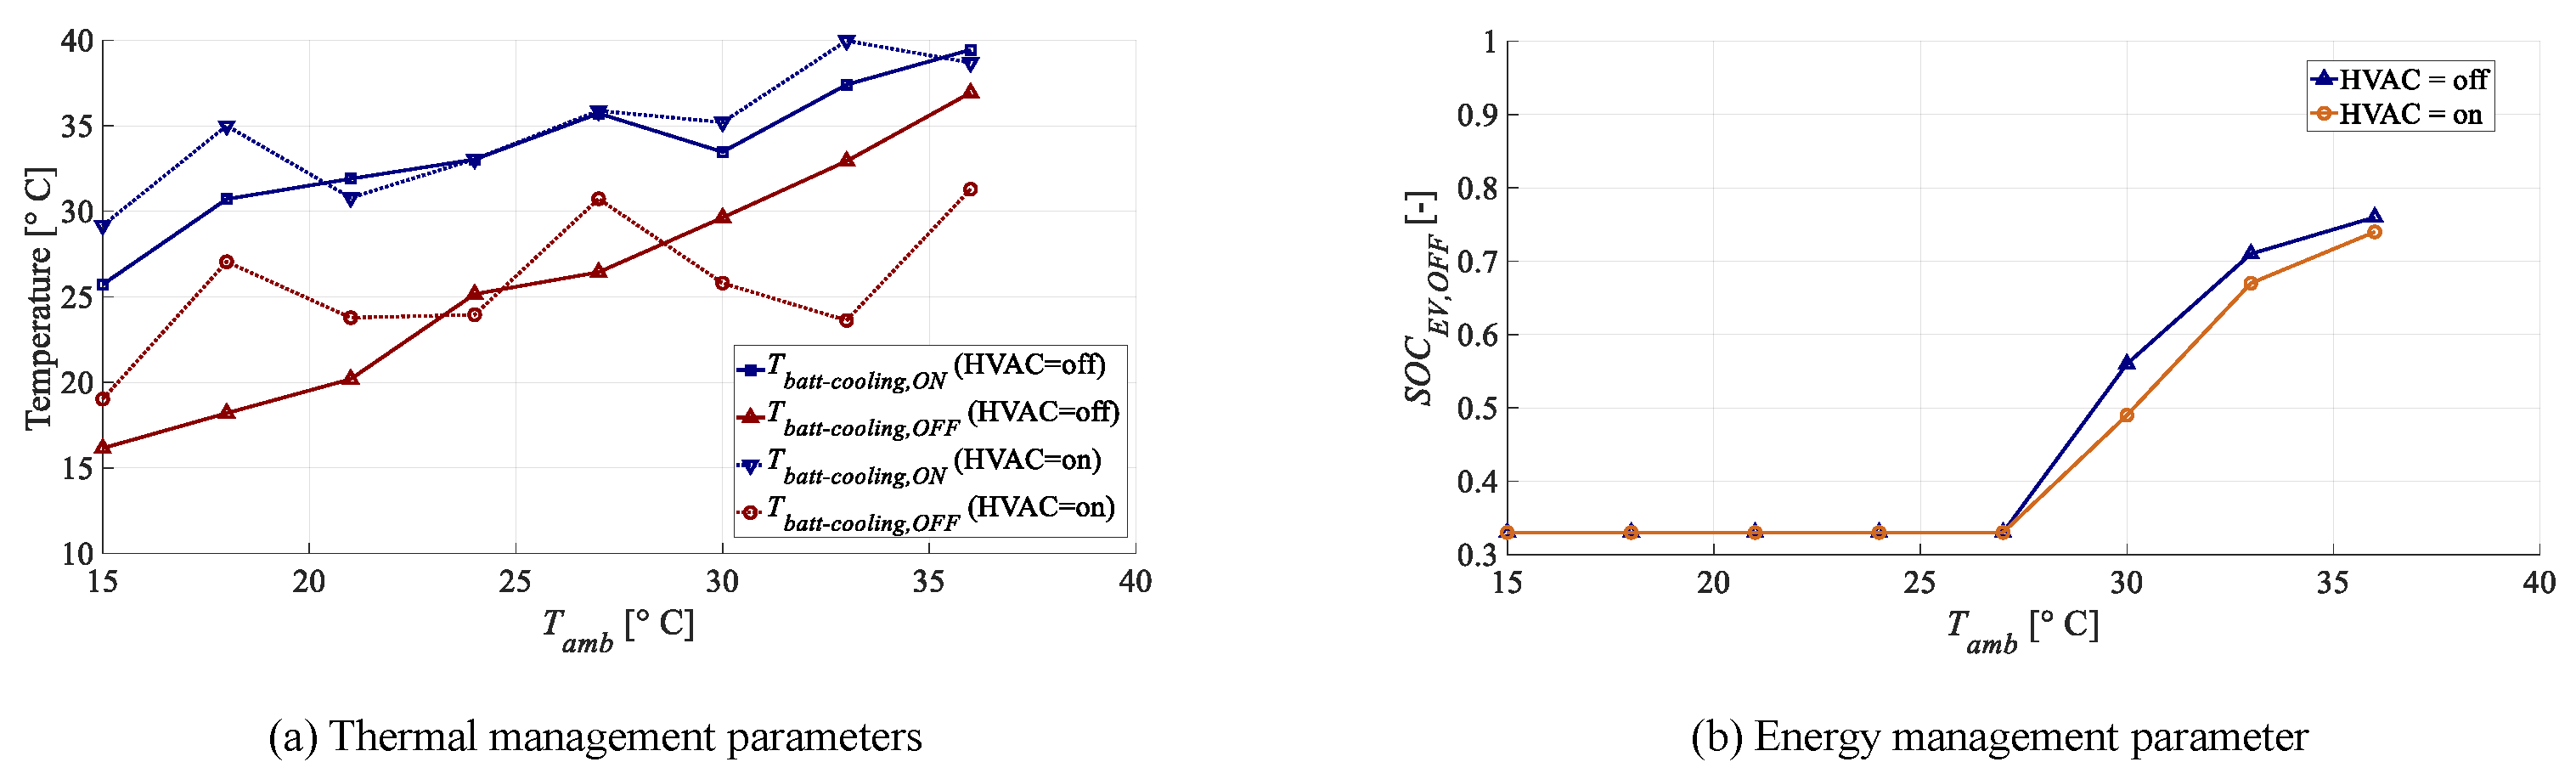
3.2.3. Battery Thermal Management Strategy

In this paper, a reactive battery thermal management strategy is considered. Inputs for the retained strategy include current values for battery temperature T b a t and battery air cooling system state B a t c o o l i n g . Two threshold vales of battery temperature for the battery thermal management strategy were defined as respectively being related to T b a t c o o l i n g , O N and T b a t c o o l i n g , O F F . The battery air cooling system was activated when the battery temperature increases above T b a t c o o l i n g , O N . B a t c o o l i n g switches from 0 to 1 in this case. The battery air cooling system was set to operate until the battery temperature falls below T b a t c o o l i n g , O F F . As is shown in Section 4, choosing the values for these two temperatures as function of the ambient temperature is not trivial and requires fine tuning.

3.3. Throughput-Based Battery Capacity Fade Model

A largely employed throughput-based capacity fade model was used to evaluate the high-voltage battery cyclic ageing. This model was calibrated for A123 26650 cells and it is based on the concept of battery charge throughput (Ah-throughput) [14]. Here, the Ah-throughput ( Q E O L ) processed throughout the battery lifetime included the energy charged from the grid [16]. Q E O L was associated to the overall quantity of charge (in ampere-hours) that a battery is able to process before reaching its end of life and it is calculable as:
Q E O L = 0 t E O L | I b a t | d t
where t E O L is the time instant in which EOL occurs, which depends on the battery operating conditions. The EOL is considered to happen when the percentage value of battery nominal capacity faded (indicated by C f a d e , % ) equals 20% (i.e., C f a d e , % = 20 ). When the battery operates under constant conditions, Q E O L and C f a d e , % could be evaluated using the equation proposed in [14] for A123 26650 cells. This formulation was inspired by the Arrhenius’ gas equation [7] and it can only be employed for battery temperature ranging between 15 °C and 60 °C:
C f a d e , % = B · e x p ( A f T b a t ) ( Q E O L , c o n s t N p · 1   Ah ) z
where battery Ah-throughput was indicated as Q E O L , c o n s t to specify that it refers to constant operating conditions. B , A f , and z   respectively indicate the pre-exponential, the activation, and the power-law factors. Both B and A f are a function of the cell C-rate c [31]. Since these parameters refer to a single cell,   Q E O L , c o n s t was divided by the number of parallel branches N p in order to scale to the whole battery pack. Table 3 reports the values of parameters used in the considered battery ageing model. The values of pre-exponential factor B as function of the C-rate were determined by conducting an ageing experimental campaign [23].
As B and A f vary according to the battery C-rate, Q E O L , c o n s t depends on both the operating conditions T b a t and C-rate, as illustrated in Figure 5. The range of the battery pack C-rate allowed as function of the considered plug-in HEV characteristics (i.e., battery pack capacity, MGP0 maximum power, and MGP4 maximum power) is highlighted in Figure 5. The larger capacity of a plug-in HEV battery slightly reduces the overall values of the C-rate, and this implies that the variation in Q E O L , c o n s t might largely relate to thermal characteristics. Looking again at Figure 5, thermal phenomena are forecasted to have a remarkable influence, even when the battery temperature is contained within the ideal range of 15 °C to 35 °C.
After calculating Q E O L , c o n s t using Equation (21), the overall quantity of charge Q c o n s t supplied by the battery under fixed values of C-rate and temperature became known. Then, it became possible to evaluate the current battery ageing state by comparing Q c o n s t with Q E O L , c o n s t . However, since batteries employed in HEVs are characterized by varying operation over time, the contribution of each combination of the C-rate and T b a t towards the achievement of Q E O L over time could be evaluated by integrating the instantaneous SOH variation:
S O H = S O H 0 0 t | I b a t | Q E O L , c o n s t ( c , T b a t ) d t
where S O H 0 is the initial state-of-health of the battery and it is equal to 1 at the beginning of battery life. Predicting the battery SOH variation over time as a function of C-rate and temperature is possible in this way thanks to the implemented numerical ageing model.

4. Battery High Temperature Sensitive Optimization Based HEV Energy and Thermal Management Calibration

The optimization-driven calibration of the HEV on-line energy and thermal management strategies will be discussed in this section. Indeed, an adaptation of HEV energy and thermal management according to the ambient temperature value may allow finding the optimal trade-off between an enhanced fuel economy and satisfactory high-voltage battery lifetime. Table 4 summarizes variables and the calibration objective function for the optimization-based calibration of the HEV energy and thermal management. The calibration of HEV energy and thermal management is desired to be optimal and it must bring into play both T b a t c o o l i n g , O N and T b a t c o o l i n g , O F F . Values for these parameters will depend both on the ambient temperature T a m b and on whether the HVAC system is in operation or not. Moreover, adapting the rule-based HEV EMS according to the battery temperature and predicted ageing rate may improve the accuracy and effectiveness of the vehicle control system. This work particularly considers varying the battery SOC which determines the transition from the charge depleting in pure electric (EV) mode to blended charge-depleting (HEV) hybrid as a function of T a m b . This value of battery SOC threshold was initially set to 0.30 for the baseline HEV energy management approach described in Section 2.1 and now it is indicated as S O C E V , O F F .
Figure 6 illustrates the flowchart for simulating the HEV in a given driving mission according to the implemented energy and thermal management approaches. The three parameters that need calibration in this framework ( T b a t c o o l i n g , O N , T b a t c o o l i n g , O F F , S O C E V , O F F ) are highlighted in Figure 6. When the HEV driver starts the driving mission, the battery temperature was assumed to be equal to the ambient temperature. The HVAC system state was selected at the beginning of the driving mission, and it was considered to be constant throughout the journey. When the HVAC system was set to be in operation, the cabin temperature was assumed to be 20 °C from the first instant of the driving mission while neglecting transient thermal phenomena in the cabin.
At each time instant, the terms impacting on the instantaneous battery power P b a t used in Equation (15) were updated. The HVAC system state, the battery air conditioning system state, and the ambient temperature were considered to this end as in Equations (23)–(25):
P b a t = P b a t , M G P 0 + P b a t , M G P 4 + P a u x + P H V A C ( T a m b , H V A C s t a t e ) + P b a t c o o l i n g ( B a t c o o l i n g )
P H V A C ( T a m b , H V A C s t a t e ) = 1000 + ( T a m b 20 ) 2 · ( H V A C s t a t e > 0 )
P b a t c o o l i n g ( B a t c o o l i n g ) = 200 · ( B a t c o o l i n g > 0 )
where P a u x , P H V A C , and P b a t c o o l i n g stand for the power demand of the auxiliaries (e.g., lubrication, ICE cooling, lighting), the HVAC system electrical power, and the battery air conditioning system electrical power, respectively. A constant value of 400 W was set here for P a u x , while a value of the electrical load of the HVAC system was assumed in Equation (24) as a function of the ambient temperature by analyzing data presented in [44]. H V A C s t a t e represents a binary variable detecting HVAC system activation at the beginning of the driving mission. The power consumed by the battery air conditioning system ( P b a t c o o l i n g ) mainly relates to Fan2 in Figure 4 and it was assumed here to be equal to 200 W [45].

4.1. HEV Fuel Economy and Battery Lifetime over Retained Driving Mix

An appropriate objective function needs definition to guide the optimization-based calibration of the HEV energy and thermal management parameters, i.e., T b a t c o o l i n g , O N , T b a t c o o l i n g , O F F , and S O C E V , O F F . The minimization of HEV operative costs was considered in this work by simulating a realistic driving mix. Eight driving missions were retained including four standard drive cycles such as the worldwide harmonized light-vehicle test procedure (WLTP), the federal test procedure (FTP75), the RTS aggressive cycle (RTS95), and the highway federal test procedure (HWFET). Moreover, four real-world driving missions recorded by the authors by means of the global positioning system (GPS) were considered including up-hill (RWC01), 2.7-h highway (RWC02), down-mountain (RWC03), and downhill (RWC04) driving conditions. Time series for vehicle speed and net road altitude over time for all the eight driving missions retained are illustrated in Figure A1 in Appendix A, while Table 5 reports driving statistics. The overall vehicle lifetime in terms of mileage was divided while considering the eight driving missions steadily repeated. Each journey was associated with a coefficient α f r e q in Table 5 that represents the percentage of vehicle lifetime which was assumed to be traveled in the corresponding driving mission.
The predicted HEV fuel economy, HEV electrical energy economy, and battery lifetime over the entire vehicle lifetime considering the introduced driving mix could be expressed as:
F u e l a v g = k = 1 8 F u e l k · α f r e q , k
E l e c t r i c i t y a v g = k = 1 8 E l e c t r i c i t y k · α f r e q , k
b a t t l i f e , a v g = k = 1 8 L c y c l e , k S O H 0 S O H e n d , k · α f r e q , k
where F u e l k and F u e l a v g are the HEV fuel economy values expressed in liters per 100 km related to the given driving mission k and the entire vehicle lifetime, respectively. E l e c t r i c i t y k and E l e c t r i c i t y a v g are the plug-in HEV electrical energy economy values expressed in kilowatt-hours per 100 km related to the given driving mission k and the entire vehicle lifetime, respectively. L c y c l e , k stand for the mileage in kilometers of the given driving mission k, while S O H e n d , k is the battery SOH at the end of the driving mission k according to the HEV simulated following the discussed energy and thermal management strategies.

4.2. Workflow for Optimization-Based HEV Thermal and Energy Management Calibration

This sub-section aims at introducing the flowchart of the optimization-based calibration of T b a t c o o l i n g , O N , T b a t c o o l i n g , O F F , and S O C E V , O F F as function of the ambient temperature. When establishing the energy and thermal management calibration objective, minimizing the operative cost related to the entire lifetime of the plug-in HEV was considered. Retained vehicle cost contributions particularly include:
  • The HEV fuel consumption;
  • The electrical energy consumed by the plug-in HEV coming from the grid;
  • The monetary cost associated with the battery pack degradation.
In this work, particle swarm optimization (PSO) was selected as an algorithm for exploring the identified three-dimensional calibration space with T b a t c o o l i n g , O N , T b a t c o o l i n g , O F F , and S O C E V , O F F as independent variables. PSO is an iterative stochastic optimization algorithm that relies on a numerical model capturing the social behavior of fishes and birds proposed by Kennedy and Eberhart in 1995 [46]. The flowchart of the PSO approach implemented in this work is illustrated in Figure 7 and detailed as follows. During step 1, a population of N particles was initialized aiming at the subsequent exploration of the calibration space searching for the minimum of the PSO cost function J c a l i b r a t i o n . For each value of the selected ambient temperature T a m b and HVAC system state, at each iteration of the PSO algorithm, step 2 aims at assessing the value of J c a l i b r a t i o n for each particle of the swarm. This was performed by simulating the HEV traveling through all the eight retained driving missions constantly in Simulink®® software at the selected value of ambient temperature and considering both the selected HVAC system state being constant and the battery being fully charged at the beginning of the driving mission (i.e., the SOC was set to 95% as the maximum value assumed). For the sake of an exhaustive analysis, two different vehicle loading conditions were considered when simulating each driving mission. These relate to consider either the vehicle lightly loaded (i.e., n p a s s = 1 ) or fully loaded (i.e., n p a s s = 5 ), respectively. As all the simulations of the driving missions were completed, the fuel economy, electrical energy economy and battery lifetime weighted according to both driving mix and vehicle payload conditions could be computed as:
F u e l a v g , t o t a l = α p a y l o a d · F u e l a v g , L L V + ( 1 α p a y l o a d ) · F u e l a v g , F L V
E l e c t r i c i t y a v g , t o t a l = α p a y l o a d · E l e c t r i c i t y a v g , L L V + ( 1 α p a y l o a d ) · E l e c t r i c i t y a v g , F L V
b a t t l i f e , t o t a l = α p a y l o a d · b a t t l i f e , a v g , L L V + ( 1 α p a y l o a d ) · b a t t l i f e , a v g , F L V
where F u e l a v g , t o t a l , E l e c t r i c i t y a v g , t o t a l , and b a t t l i f e , t o t a l respectively represent HEV fuel economy in litres per 100 km, electrical energy economy in kilowatt-hours per 100 km, and kilometrical battery lifetime weighted according to both driving mix and payload conditions. Subscripts LLV and FLV were associated with lightly loaded and fully loaded vehicle conditions, respectively. Finally, α p a y l o a d represents a weighting coefficient for the two loading conditions. Its value was set here to 0.0825 following a press release by the association Anci suggesting that, in Italy, the average number of passengers per car is equal to 1.33 [47].
The cost function J c a l i b r a t i o n associated to the particle under analysis could then be evaluated including monetary costs associated with fuel consumption, electrical energy consumption, and battery degradation for the target plug-in HEV lifetime in kilometres v e h l i f e , t a r g e t , which was assumed to be 300 thousand km here [48]. The resulting mathematical formulation for J c a l i b r a t i o n was as follows:
J c a l i b r a t i o n = c f u e l · F u e l a v g , t o t a l 100 · v e h l i f e , t a r g e t + c e l e c · E l e c t r i c i t y a v g , t o t a l 100 · v e h l i f e , t a r g e t + c b a t t · v e h l i f e , t a r g e t b a t t l i f e , t o t a l
where c f u e l , c e l e c , and c b a t t respectively represent the fuel refuelling cost, the cost of the electricity coming from the grid, and the battery pack replacement cost. Values of c f u e l and c e l e c retained here correspond to 1.41 euros per liter and 0.22 euros per kilowatt-hour, which relate to average prices observed in Italy in the first half of 2020 [49,50]. Concerning c b a t t , its value was assumed here to be around 6130 euros, considering the current estimated battery pack specific production cost of 280 euros per kilowatt-hour and multiplying it by the HEV battery pack capacity and a factor of 2, which accounts for manpower and other costs associated with the battery pack replacement process [51]. The battery pack replacement cost term was not considered here in case b a t t l i f e , t o t a l exceeded the target value for the entire vehicle lifetime v e h l i f e , t a r g e t . J c a l i b r a t i o n thus considers the operative costs in euros associated with the entire plug-in HEV lifetime involving fuel consumption, electricity consumption, and battery pack degradation. Once J c a l i b r a t i o n was evaluated for all the particles of the swarm, step 3 in Figure 7 aims to update the local and global minima for the swarm. Position and velocity of each particle in the three-dimensional calibration space considered were then updated in step 4 based on the local and global optima previously identified. Three main PSO parameters were involved in this procedure, namely the inertia parameter, the cognitive parameter, and the social parameter [52]. More details regarding this step can be found in [53].
Once the maximum number of iterations was reached for the PSO algorithm, the obtained results included the calibrated values of T b a t c o o l i n g , O N , T b a t c o o l i n g , O F F , and S O C E V , O F F for the selected value of ambient temperature and HVAC system state. Compared with other popular stochastic optimization algorithms (e.g., genetic algorithm—GA), PSO distinguished itself by the ease of its management and parameter tuning [54,55]. This corroborates the likelihood of effectively finding a global optimum for the considered calibration problem and it represents the main motivation behind the use of PSO in this work. The version of the PSO algorithm considered in this paper refers to the corresponding toolbox provided by the Yarpiz project and it was implemented in MATLAB© software [56].
In the next section, results are provided for the energy and thermal HEV management strategies calibrated according to the illustrated methodology.

5. Results

In this work, the HEV energy and thermal management strategies discussed earlier find calibration in terms of T b a t c o o l i n g , O N , T b a t c o o l i n g , O F F , and S O C E V , O F F according to eight different values of ambient temperature corresponding to 15, 18, 21, 24, 27, 30, 33, and 36 °C. Retained parameters for the PSO-based calibration flowchart are reported in Table 6 [56].
Considering a desktop computer with Intel Core i7-8700 (3.2 GHz) and 32 GB of RAM, around 320 min were required to complete step 1 to step 5 of Figure 7. In total, 16 iterations of the workflow from step 1 to step 5 were then required when considering eight values of ambient temperature and two HVAC system states (i.e., on or off). This led to around 43 h of computational time being required for completing the entire HEV energy and thermal management calibration procedure illustrated. Figure 8 illustrates the values of T b a t c o o l i n g , O N , T b a t c o o l i n g , O F F , and S O C E V , O F F obtained after the completion of the overall PSO based calibration workflow illustrated in Figure 7. Concerning the thermal management parameters shown in Figure 8a, a large gap between T b a t c o o l i n g , O N and T b a t c o o l i n g , O F F meant that the battery air conditioning system could be kept operating for longer after being activated. On the other hand, a narrower difference between the values of T b a t c o o l i n g , O N and T b a t c o o l i n g , O F F entailed more frequent activations and deactivations of the battery air conditioning system. When the HVAC system was off, a larger gap between T b a t c o o l i n g , O N and T b a t c o o l i n g , O F F was observed below 30 °C, which involves more usage of the battery air conditioning system. However, this correlated to a substantial increase in the calibrated values for S O C E V , O F F in Figure 8b from around 0.33 to around 0.58 and progressively above as the ambient temperature overcomes 30 °C, especially for the HVAC system being de-activated. This means that, as the ambient temperature gradually increases, the PSO based calibration procedure prefers switching from pure electric operation to hybrid electric operation much earlier in a driving mission rather than retaining a pure electric operation while keeping the battery air conditioning system in operation for a shorter time when the HVAC system is off. The trend of S O C E V , O F F as function of the ambient temperature when the HVAC system was in operation showed a similar trend, yet slightly shifted downwards, with respect to the HVAC system being off in Figure 8b. As a consequence, the HVAC system being activated seemed to enable exploiting pure electric charge-depleting operation for longer at high ambient temperatures thanks to the availability of the cooled cabin air to cool down the battery pack. This correlates with a calibrated larger gap between T b a t c o o l i n g , O N and T b a t c o o l i n g , O F F for high ambient temperatures when the HVAC system is in operation in Figure 8a, which entails longer usage of the battery cooling system.
Table 7 reports numerical values for the calibrated thermal and energy management parameters as a function of the ambient temperature and the HVAC system state. Values of F u e l a v g , t o t a l , E l e c t r i c i t y a v g , t o t a l , and b a t t l i f e , t o t a l are included along with the corresponding value of J c a l i b r a t i o n . Moreover, a graphical representation of the considered plug-in HEV energy consumption as function of the ambient temperature is shown in Figure 9. As can be seen in Figure 9, fuel consumption and battery energy consumption are quite stable within the ambient temperature range of 15 °C to 30 °C thanks to the implemented calibration process for the HEV energy and thermal management strategy. As the value of S O C E V , O F F shown in Figure 8b was increased to preserve battery lifetime at around 33 °C, the corresponding battery energy consumption lowered by 11.2% and the corresponding fuel consumption increased by around two times compared to the 15 °C reference values in Figure 9a. The overall plug-in HEV energy consumption shown in Figure 9b considers the sum of battery electrical energy and fuel chemical energy in kilowatt-hours per 100 km. The fuel chemical energy could be obtained by considering values of fuel density and a lower heating value corresponding to 744 g per liter and 43.74 kilojoules/gram, respectively. In this case, a 33 °C ambient temperature might lead to 1.4 times the overall plug-in HEV energy consumption compared with 15 °C. As the ambient temperature further increased, the average fuel consumption increased, and the battery energy consumption reduced to prevent accelerated lifetime consumption. From the overall energy consumption perspective, 36 °C involved more than two times the energy consumption estimated at 15 °C in Figure 9b. This reflects operative costs in the increased values for the overall plug-in HEV at high ambient temperatures as well.
The activation of the HVAC system impacted on the cabin temperature and, in turn, allowed cooling the battery pack with air at lower temperature compared with the ambient temperature. Nevertheless, a considerable amount of additional auxiliary power consumption was associated to the HVAC system activation. In this framework, Figure 9b suggests that, from the overall vehicle perspective, the beneficial effect of lowering the temperature of the battery air conditioning system overcame the increased power consumption when the HVAC system was activated. As a result, the HVAC system being in operation entailed a lower overall plug-in HEV energy consumption by 16.5% and 13.6% for ambient temperature equal to 33 °C and 36 °C, respectively.
Finally, it should be noted that values of b a t t l i f e , t o t a l reported in Table 7 are always equal to or are higher than the set vehicle lifetime target of 300,000 km. The calibration performed by PSO thus suggests that, from the point of view of the plug-in HEV operative cost, slightly increasing the usage of ICE might be advised at high ambient temperatures in order to preserve battery lifetime and thus avoid the costs required for replacing the battery pack within the vehicle lifetime.

6. Conclusions

This paper proposes the calibration of the thermal and energy management strategies of a plug-in HEV to minimize the operative costs associated to fuel consumption, electricity consumption, and battery pack degradation for the overall vehicle lifetime at various ambient temperatures. A parallel though-the-road plug-in HEV powertrain architecture was modeled in Matlab/Simulink® software. Moreover, the battery pack was modeled from electrical, ageing, and thermal perspectives. A methodology based on PSO was proposed to calibrate three parameters of the HEV thermal and energy management aiming at minimizing overall vehicle operative cost. The exhaustiveness of the calibration procedure was improved by considering different ambient temperature, vehicle payload conditions, and HVAC system states.
Obtained results suggest that, as the ambient temperature increases, different settings of the battery air conditioning system should be implemented in the on-board HEV controller. Moreover, switching from a pure electric to hybrid electric operation below a certain value of the battery SOC can be advised to preserve battery lifetime and to avoid replacing the battery pack within the vehicle lifetime. High ambient temperatures impact on the overall plug-in HEV energy consumption to the point that at 36 °C, the HEV depletes 2.3 times the corresponding energy depleted at 15 °C. Results also suggested that the activation of the HVAC system for cabin conditioning at high ambient temperatures might have a beneficial impact on cooling the battery, which overcomes the increase in auxiliary power consumption due to the HVAC system.
Implementing the methodology introduced here can decrease time and engineering effort required to calibrate energy and thermal management strategies of HEVs. The satisfaction of conflicting calibration objectives can be enhanced in this way, including fuel economy and electrical energy economy enhancement, high-voltage battery lifetime safeguarding, and temperature control. Related future work might involve improving the fidelity level of both the HEV powertrain model, the battery pack thermal model, and the battery ageing model. Moreover, different design solutions in terms of cell chemistry and battery pack conditioning system could be investigated. Developing more sophisticated and accurate thermal and energy management might lead to further enhancing the overall energy economy of the HEV. Finally, performing experimental tests might prove fundamental to validate the proposed numerical methodology and the calibrated HEV thermal and energy management strategy.

Author Contributions

Conceptualization, P.G.A.; methodology, P.G.A. and M.D.P.; software, M.D.P.; validation, M.D.P. and P.G.A.; formal analysis, M.D.P., P.G.A., and G.B.; investigation, M.D.P. and P.G.A.; resources, G.B.; data curation, M.D.P. and P.G.A.; writing—original draft preparation, M.D.P. and P.G.A.; writing—review and editing, G.B.; visualization, M.D.P. and P.G.A.; supervision, P.G.A. and G.B.; project administration, P.G.A. and G.B.; funding acquisition, G.B. All authors have read and agreed to the published version of the manuscript.

Funding

This research received no external funding.

Data Availability Statement

No applicable.

Conflicts of Interest

The authors declare no conflict of interest.

Abbreviations

ECMSEquivalent consumption minimization strategy
EMSEnergy management strategy
EOLEnd-of-life
FTP75Federal test procedure 75
HEVHybrid electric vehicle
HVACHeating, Ventilation, and Air Conditioning
HWFETHighway federal test procedure
ICEInternal combustion engine
MGP0Motor/generator P0
MGP4Motor/generator P4
OOLOptimal operating line
PIDProportional–integral–derivative
PSOParticle swarm optimization
SEISolid electrolyte interface
SOCState of charge
SOHState of health
WLTPWorldwide harmonized light-vehicle test procedure

Appendix A. Time Series of Retained Driving Missions

Figure A1. Vehicle speed and net road altitude profiles over time for the retained driving missions.
Applsci 11 08593 g0a1

References

  1. Bilgin, B.; Magne, P.; Malysz, P.; Yang, Y.; Pantelic, V.; Preindl, M.; Korobkine, A.; Jiang, W.; Lawford, M.; Emadi, A. Making the Case for Electrified Transportation. IEEE Trans. Transp. Electrif. 2015, 1, 4–17. [Google Scholar] [CrossRef]
  2. Tran, M.-K.; Akinsanya, M.; Panchal, S.; Fraser, R.; Fowler, M. Design of a Hybrid Electric Vehicle Powertrain for Performance Optimization Considering Various Powertrain Components and Configurations. Vehicles 2020, 3, 20–32. [Google Scholar] [CrossRef]
  3. Emadi, A. Advanced Electric Drive Vehicles; CRC Press: Boca Raton, FL, USA, 2014. [Google Scholar]
  4. Anselma, P.G.; Belingardi, G. Next Generation HEV Powertrain Design Tools: Roadmap and Challenges; SAE Technical Paper 2019-01-2602; SAE International: Warrendale, PA, USA, 2019. [Google Scholar]
  5. Kollmeyer, P.J.; Jahns, T.M. Aging and performance comparison of absorbed glass matte, enhanced flooded, PbC, NiZn, and LiFePO4 12V start stop vehicle batteries. J. Power Sources 2019, 441, 227139. [Google Scholar] [CrossRef]
  6. Anselma, P.G.; Kollmeyer, P.J.; Feraco, S.; Bonfitto, A.; Belingardi, G.; Emadi, A.; Amati, N.; Tonoli, A. Assessing Impact of Heavily Aged Batteries on Hybrid Electric Vehicle Fuel Economy and Drivability. In Proceedings of the 2021 IEEE Transportation Electrification Conference and Expo, Chicago, IL, USA, 21–25 June 2021. [Google Scholar]
  7. Bloom, I.; Cole, B.; Sohn, J.; Jones, S.; Polzin, E.; Battaglia, V.; Henriksen, G.; Motloch, C.; Richardson, R.; Unkelhaeuser, T.; et al. An accelerated calendar and cycle life study of Li-ion cells. J. Power Sources 2001, 101, 238–247. [Google Scholar] [CrossRef]
  8. Bonfitto, A. A Method for the Combined Estimation of Battery State of Charge and State of Health Based on Artificial Neural Networks. Energies 2020, 13, 2548. [Google Scholar] [CrossRef]
  9. Vidal, C.; Kollmeyer, P.; Naguib, M.; Malysz, P.; Gross, O.; Emadi, A. Robust xEV Battery State-of-Charge Estimator Design Using a Feed-forward Deep Neural Network. SAE Int. J. Adv. Curr. Prac. Mobil. 2020, 2, 2872–2880. [Google Scholar]
  10. Bonfitto, A.; Feraco, S.; Tonoli, A.; Amati, N.; Monti, F. Estimation Accuracy and Computational Cost Analysis of Artificial Neural Networks for State of Charge Estimation in Lithium Batteries. Batteries 2019, 5, 47. [Google Scholar] [CrossRef] [Green Version]
  11. Bonfitto, A.; Ezemobi, E.; Amati, N.; Feraco, S.; Tonoli, A.; Hegde, S. State of Health Estimation of Lithium Batteries for Automotive Applications with Artificial Neural Networks. In Proceedings of the 2019 AEIT International Conference of Electrical and Electronic Technologies for Automotive (AEIT AUTOMOTIVE), Turin, Italy, 2–4 July 2019; pp. 1–5. [Google Scholar]
  12. Vidal, C.; Gross, O.; Gu, R.; Kollmeyer, P.; Emadi, A. xEV Li-Ion Battery Low-Temperature Effects—Review. IEEE Trans. Veh. Technol. 2019, 68, 4560–4572. [Google Scholar] [CrossRef]
  13. Rauhala, T.; Jalkanen, K.; Romann, T.; Lust, E.; Omar, N.; Kallio, T. Low-temperature aging mechanisms of commercial graphite/LiFePO4 cells cycled with a simulated electric vehicle load profile—A post-mortem study. J. Energy Storage 2018, 20, 344–356. [Google Scholar] [CrossRef]
  14. Wang, J.; Liu, P.; Hicks-Garner, J.; Sherman, E.; Soukiazian, S.; Verbrugge, M.; Tataria, H.; Musser, J.; Finamore, P. Cycle-life model for graphite- LiFePO4 cells. J. Power Sources 2011, 196, 3942–3948. [Google Scholar] [CrossRef]
  15. Ebbesen, S.; Elbert, P.; Guzzella, L. Battery State-of-Health Perceptive Energy Management for Hybrid Electric Vehicles. IEEE Trans. Veh. Technol. 2012, 61, 2893–2900. [Google Scholar] [CrossRef]
  16. Onori, S.; Spagnol, P.; Marano, V.; Guezennec, Y.; Rizzoni, G. A new life estimation method for lithium-ion batteries in plug-in hybrid electric vehicles applications. Int. J. Power Electron. 2012, 4, 302. [Google Scholar] [CrossRef]
  17. Tang, L.; Rizzoni, G.; Onori, S. Energy Management Strategy for HEVs Including Battery Life Optimization. IEEE Trans. Transp. Electrif. 2015, 1, 211–222. [Google Scholar] [CrossRef]
  18. Zhang, S.; Hu, X.; Xie, S.; Song, Z.; Hu, L.; Hou, C. Adaptively coordinated optimization of battery aging and energy management in plug-in hybrid electric buses. Appl. Energy 2019, 256, 113891. [Google Scholar] [CrossRef]
  19. Xie, S.; Hu, X.; Zhang, Q.; Lin, X.; Mu, B.; Ji, H. Aging-aware co-optimization of battery size, depth of discharge, and energy management for plug-in hybrid electric vehicles. J. Power Sources 2020, 450, 227638. [Google Scholar] [CrossRef]
  20. Cheng, M.; Chen, B. Nonlinear Model Predictive Control of a Power-Split Hybrid Electric Vehicle with Consideration of Battery Aging. J. Dyn. Syst. Meas. Control. 2019, 141, 081008. [Google Scholar] [CrossRef] [Green Version]
  21. Anselma, P.G.; Kollmeyer, P.; Belingardi, G.; Emadi, A. Multi-Objective Hybrid Electric Vehicle Control for Maximizing Fuel Economy and Battery Lifetime. In Proceedings of the 2020 IEEE Transportation Electrification Conference & Expo (ITEC), Chicago, IL, USA, 22–26 June 2020; pp. 1–6. [Google Scholar]
  22. Patil, C.; Naghshtabrizi, P.; Verma, R.; Tang, Z.; Smith, K.; Shi, Y. Optimal battery utilization over lifetime for parallel hybrid electric vehicle to maximize fuel economy. In Proceedings of the 2016 American Control Conference (ACC), Boston, MA, USA, 6–8 July 2016; pp. 1524–1529. [Google Scholar]
  23. Anselma, P.G.; Kollmeyer, P.; Lempert, J.; Zhao, Z.; Belingardi, G.; Emadi, A. Battery state-of-health sensitive energy management of hybrid electric vehicles: Lifetime prediction and ageing experimental validation. Appl. Energy 2021, 285, 116440. [Google Scholar] [CrossRef]
  24. Du, R.; Hu, X.; Xie, S.; Hu, L.; Zhang, Z.; Lin, X. Battery aging- and temperature-aware predictive energy management for hybrid electric vehicles. J. Power Sources 2020, 473, 228568. [Google Scholar] [CrossRef]
  25. Fiat Chrysler Automobiles. Renegade 4xe and Compass 4xe: The Jeep®® Brand’s Take on the Plug-in Hybrid. Available online: http://www.media.fcaemea.com/em-en/jeep/press/renegade-4xe-and-compass-4xe-the-jeep-brand-s-take-on-the-plug-in-hybrid (accessed on 28 May 2021).
  26. A123 Systems. Nanophosphate®® High Power Lithium Ion Cell ANR26650M1-B. Available online: https://www.batteryspace.com/prod-specs/6610.pdf (accessed on 28 May 2021).
  27. Uddin, K.; Perera, S.; Widanage, W.D.; Somerville, L.; Marco, J. Characterising Lithium-Ion Battery Degradation through the Identification and Tracking of Electrochemical Battery Model Parameters. Batteries 2016, 2, 13. [Google Scholar] [CrossRef]
  28. Rizzoni, G.; Guzzella, L.; Baumann, B. Unified modeling of hybrid electric vehicle drivetrains. IEEE/ASME Trans. Mechatron. 1999, 4, 246–257. [Google Scholar] [CrossRef]
  29. Alix, G.; Dabadie, J.-C.; Font, G. An ICE Map Generation Tool Applied to the Evaluation of the Impact of Downsizing on Hybrid Vehicle Consumption. SAE Tech. Pap. 2015, 24, 2385. [Google Scholar] [CrossRef]
  30. Le Berr, F.; Abdelli, A.; Postariu, D.-M.; Benlamine, R. Design and Optimization of Future Hybrid and Electric Propulsion Systems: An Advanced Tool Integrated in a Complete Workflow to Study Electric Devices. Oil Gas Sci. Technol.-Rev. d’IFP Energ. Nouv. 2012, 67, 547–562. [Google Scholar] [CrossRef] [Green Version]
  31. Anselma, P.G.; Kollmeyer, P.; Belingardi, G.; Emadi, A. Multitarget Evaluation of Hybrid Electric Vehicle Powertrain Architectures Considering Fuel Economy and Battery Lifetime. SAE Tech. Pap. 2020, 37, 15. [Google Scholar] [CrossRef]
  32. United States Environmental Protection Agency. Compliance and Fuel Economy Data-Annual Certification Data for Vehicles, Engines, and Equipment. Available online: https://www.epa.gov/compliance-and-fuel-economy-data/annual-certification-data-vehicles-engines-and-equipment (accessed on 1 June 2021).
  33. Engbroks, L.; Knappe, P.; Goerke, D.; Schmiedler, S.; Goedecke, T.; Geringer, B. Energetic Costs of ICE Starts in (P)HEV—Experimental Evaluation and Its Influence on Optimization Based Energy Management Strategies. SAE Tech. Pap. 2019, 24, 0203. [Google Scholar]
  34. Tran, M.-K.; Mevawala, A.; Panchal, S.; Raahemifar, K.; Fowler, M.; Fraser, R. Effect of integrating the hysteresis component to the equivalent circuit model of Lithium-ion battery for dynamic and non-dynamic applications. J. Energy Storage 2020, 32, 101785. [Google Scholar] [CrossRef]
  35. Maheshwari, A.; Dumitrescu, M.A.; Destro, M.; Santarelli, M. A modeling approach to understand charge discharge differences in thermal behavior in lithium iron phosphate–graphite battery. Electrochim. Acta 2017, 243, 129–141. [Google Scholar] [CrossRef]
  36. Mevawalla, A.; Panchal, S.; Tran, M.-K.; Fowler, M.; Fraser, R. One dimensional fast computational partial differential model for heat transfer in lithium-ion batteries. J. Energy Storage 2021, 37, 102471. [Google Scholar] [CrossRef]
  37. Han, T.; Khalighi, B.; Yen, E.C.; Kaushik, S. Li-Ion Battery Pack Thermal Management: Liquid Versus Air Cooling. J. Therm. Sci. Eng. Appl. 2018, 11, 021009. [Google Scholar] [CrossRef]
  38. Jaguemont, J.; Boulon, L.; Dube, Y.; Martel, F. Thermal Management of a Hybrid Electric Vehicle in Cold Weather. IEEE Trans. Energy Convers. 2016, 31, 1110–1120. [Google Scholar] [CrossRef]
  39. Kim, Y.; Mohan, S.; Siegel, J.B.; Stefanopoulou, A.G.; Ding, Y. The estimation of radial temperature distribution in cylindrical battery cells under unknown cooling conditions. In Proceedings of the 52nd IEEE Conference on Decision and Control, Florence, Italy, 1 June 2013. [Google Scholar]
  40. Janarthanam, S.; Burrows, N.; Boddakayala, B.R. Factors Influencing Liquid over Air Cooling of High Voltage Battery Packs in an Electrified Vehicle. SAE Tech. Pap. 2017, 1, 1171. [Google Scholar] [CrossRef]
  41. Lin, X.; Perez, H.E.; Mohan, S.; Siegel, J.; Stefanopoulou, A.G.; Ding, Y.; Castanier, M.P. A lumped-parameter electro-thermal model for cylindrical batteries. J. Power Sources 2014, 257, 1–11. [Google Scholar] [CrossRef]
  42. Jeon, D.H.; Baek, S.M. Thermal modeling of cylindrical lithium ion battery during discharge cycle. Energy Convers. Manag. 2011, 52, 2973–2981. [Google Scholar] [CrossRef]
  43. Lempert, J.; Kollmeyer, P.; Malysz, P.; Gross, O.; Cotton, J.; Emadi, A. Battery Entropic Heating Coefficient Testing and Use in Cell-Level Loss Modeling for Extreme Fast Charging. SAE Int. J. Adv. Curr. Pract. Mobil. 2020, 1, 0862. [Google Scholar] [CrossRef]
  44. Meyer, J.; Agathocleous, N.; Youmans, H.; Williams, H.; Vespa, T.; Rugh, J.; Lustbader, J.; Titov, E. Advanced Climate System for EV Extended Range. In US Department of Energy Technical Report; U.S. Department of Energy: Washington, DC, USA, 2017. [Google Scholar] [CrossRef]
  45. Arasu, M.; Ahmed, Q.; Rizzoni, G. Optimizing Battery Cooling System for a Range Extended Electric Truck. SAE Tech. Pap. 2019, 1, 158. [Google Scholar] [CrossRef]
  46. Kennedy, J.; Eberhart, R. Particle swarm optimization. In Proceedings of the ICNN’95—International Conference on Neural Networks, Perth, WA, Australia, 27 November–1 December 1995; Volume 4, pp. 1942–1948. [Google Scholar]
  47. ANCI. Mobilità Sostenibile—Ricerca ANCI, Nelle Città Serpentoni di Auto ‘Vuote’, ma Cala Inquinamento. Available online: http://www.anci.it/mobilita-sostenibile-ricerca-anci-nelle-citta-serpentoni-di-auto-vuote-ma-cala-inquinamento/ (accessed on 7 June 2021).
  48. Ford, D. As Cars Are Kept Longer, 200,000 Is New 100,000. New York Times, 16 March 2012. [Google Scholar]
  49. Bloomberg. Gasoline Prices around the World: The Real Cost of Filling Up. Available online: https://www.bloomberg.com/graphics/gas-prices/#20202:Italy:EUR:l (accessed on 3 September 2021).
  50. Eurostat. Electricity Prices for Household Consumers—Bi-Annual Data. Available online: https://ec.europa.eu/eurostat/databrowser/view/nrg_pc_204/default/table?lang=en (accessed on 3 September 2021).
  51. Hamza, K.; Laberteaux, K.; Chu, K.-C. On Modeling the Total Cost of Ownership of Electric and Plug-in Hybrid Vehicles. SAE Tech. Pap. 2020, 1, 1435. [Google Scholar] [CrossRef]
  52. Anselma, P.G.; Belingardi, G. Multi-objective optimal computer-aided engineering of hydraulic brake systems for electrified road vehicles. Veh. Syst. Dyn. 2020, 1–22. [Google Scholar] [CrossRef]
  53. Brandimarte, P. Optimization Model Solving. In An Introduction to Financial Markets: A Quantitative Approach; John Wiley & Sons Inc.: Hoboken, NJ, USA, 2018; pp. 717–718. [Google Scholar]
  54. Nouiri, M.; Bekrar, A.; Jemai, A.; Niar, S.; Ammari, A.C. An effective and distributed particle swarm optimization algorithm for flexible job-shop scheduling problem. J. Intell. Manuf. 2015, 29, 603–615. [Google Scholar] [CrossRef]
  55. Mashadi, B.; Khadem Nahvi, M. Fuel consumption reduction by introducing best-mode controller for hybrid electric vehicles. Proc. Inst. Mech. Eng. Part D J. Automob. Eng. 2020, 234, 810–822. [Google Scholar] [CrossRef]
  56. Yarpiz. Particle Swarm Optimization in MATLAB. Available online: https://yarpiz.com/50/ypea102-particle-swarm-optimization (accessed on 7 June 2021).
Figure 1. Schematic diagram of a parallel-through-the-road HEV powertrain.
Applsci 11 08593 g001
Figure 2. Efficiency maps of ICE, MGP0, and MGP4 generated by means of Simcenter Amesim® software.
Applsci 11 08593 g002
Figure 3. Schematic diagram of the arrangement of cells within the modeled battery pack.
Applsci 11 08593 g003
Figure 4. Schematic diagram of the cabin and battery air cooling system.
Applsci 11 08593 g004
Figure 5. Allowed lifetime Ah-throughput predicted by the numerical ageing model as a function of the cell temperature and C-rate.
Applsci 11 08593 g005
Figure 6. Flowchart for simulating the HEV in a driving mission according to the implemented energy and thermal management approaches.
Applsci 11 08593 g006
Figure 7. Flowchart of the particle swarm optimization-based calibration of the parameters for HEV energy and thermal management.
Applsci 11 08593 g007
Figure 8. Calibrated values of T b a t c o o l i n g , O N , T b a t c o o l i n g , O F F , and S O C E V , O F F according to the ambient temperature and HVAC system state.
Applsci 11 08593 g008
Figure 9. Plug-in HEV fuel consumption, battery energy consumption, and overall energy consumption as a function of the ambient temperature while benchmarking with corresponding values at 15 °C.
Applsci 11 08593 g009
Table 1. Parameters of the parallel-through-the-road plug-in HEV powertrain.
ComponentParameterValue
ICEMax. power (hp @ RPM)130 @ 5500
Max. torque (Nm @ RPM)270 @ 1850
MGP4Max. power (hp @ RPM)60 @ >1240
Max. torque (Nm @ RPM)250 @ <1240
MGP0Max. power (hp @ RPM)20 @ >2480
Max. torque (Nm @ RPM)48 @ <2480
Transmission ratiosRear final drive (-)5.6
Front final drive (-)3.68
Automatic gearbox (-)[4.46; 2.51; 1.56;
1.14; 0.85; 0.67]
MGP0 belt (-)2.7
High-voltage batteryBattery nominal capacity/voltage (kWh/V)10.94/400
Cell nominal capacity/voltage (Wh/V)7.6/3.33
Pack configuration120 S; 12 P
Cell typeA123 ANR26650
Vehicle bodyRoad load coefficient A (N)94.04
Road load coefficient B (Ns/m)3.81
Road load coefficient C (Ns2/m2)0.48
Wheel radius (m)0.322
Table 2. Battery and air thermal parameters [26,39].
ParameterSymbolValue
Battery pack mass m b a t 109.4 kg
Battery pack length l b a t 1050 mm
Battery pack height H b a t 240 mm
Battery pack width w b a t 400 mm
Battery side exchange surface S b a t 1.10 m2
Overall cooling exchange surface S c o o l i n g 2.55 m2
Battery specific heat c b a t 1109.2 J/(kg∙K)
Air specific heat c p , a i r 1005 J/(kg∙K)
Convective coefficient—side air h s i d e , a i r 10 W(m2∙K)
Convective coefficient—cooling air h c o o l i n g , a i r 50 W(m2∙K)
Table 3. Battery ageing parameters for A123 26650 cell [23].
ParameterSymbolValue
C-rate index for
pre-exponential factor
c [0.5; 2; 4; 6; 8; 10; 12; 14; 16; 18; 20]
Pre-exponential factor as function of C-rate B ( c ) [31,630; 21,681; 17,307; 12,934; 13,512; 15,512; 12,099; 11,380; 13,656; 16,342; 14,599]
Activation factor A f ( c ) 3814.68–44.56∙ c
Power-law factor z 0.55
Table 4. Variables and objective function for the optimization based HEV energy and thermal management calibration.
ParameterSymbolBounds
Calibration variablesUpper battery pack temperature threshold for cooling system activation T b a t c o o l i n g , O N  
( T a m b , H V A C s t a t e )
[ T a m b –40°]
Lower battery pack temperature threshold for cooling system de-activation T b a t c o o l i n g , O F F  
( T a m b , H V A C s t a t e )
[10°– T a m b ]
Lower battery SOC threshold for pure electric to hybrid electric operation transition S O C E V , O F F  
( T a m b , H V A C s t a t e )
[0.3–1]
Calibration objective functionOperative cost associated to the entire plug-in HEV lifetime J c a l i b r a t i o n (31)
Table 5. Statistics for retained driving missions.
Driving
Mission
WLTPFTP75RTS95HWFETRWC01—UphillRWC02—Long HighwayRWC03—Down-MountainRWC04—Downhill
Length L c y c l e [km]23.317.812.916.517.829627.416.7
Time [s]180018788877651031979223451123
Max speed [km/h]131.391.2134.496.3112.7135.484.9103
Average speed [km/h]46.534.152.577.662.1108.84253.5
Average acceleration [m/s2]0.40.50.80.20.50.20.50.6
Average deceleration [m/s2]−0.4−0.6−0.8−0.2−0.6−0.2−0.6−0.6
Max altitude—min altitude [m]0000278523682225
Final altitude—
initial altitude [m]
0000235341−633−148
Journey frequency α f r e q [%]8.3316.6716.6716.678.338.338.3316.67
Table 6. Retained PSO parameters.
ParameterValue
Swarm size [-]20
Number of iterations [-]15
Inertia coefficient [-]0.73
Cognitive coefficient [-]1.5
Social coefficient [-]1.5
Table 7. Calibrated thermal and energy management parameters and HEV performance in terms of energy consumption and predicted battery lifetime as a function of the ambient temperature and HVAC system state.
HVAC System State T a m b  
[°C]
T b a t c o o l i n g , O N  
[°C]
T b a t c o o l i n g , O F F  
[°C]
S O C E V , O F F  
[%]
F u e l a v g , t o t a l  
[L/100 km]
E l e c t r i c i t y a v g , t o t a l  
[kWh/100 km]
b a t t l i f e , t o t a l  
[km∙103]
J c a l i b r a t i o n  
[k€]
Off1525.716.133.40.6916.5779913.8
Off1830.718.233.50.6916.4265813.8
Off2131.920.233.40.6916.4152113.8
Off2433.025.233.40.6916.4041413.8
Off2735.726.433.50.6916.3933113.8
Off3033.529.655.80.7416.2130014.0
Off3337.432.970.71.4414.2130015.6
Off3639.436.976.52.6510.7430018.4
On1529.219.033.20.6916.5578113.8
On1835.027.033.40.6916.4265113.8
On2130.823.833.40.6916.4152413.8
On2433.023.933.50.6916.4042213.8
On2735.930.733.30.6916.3934213.8
On3035.225.848.90.7016.3430013.9
On3340.023.667.31.1015.2030014.8
On3638.731.374.32.2012.0630417.4
Publisher’s Note: MDPI stays neutral with regard to jurisdictional claims in published maps and institutional affiliations.

