Article

Analysis of Process Costing for the Use of Navigation Systems in Functional Endoscopic Sinus Surgery

by
Franziska Eva Schwan
1,*,†,
Maximilian Traxdorf
2,†,
Caroline Theresa Seebauer
1,
Andrzej Sekita
2,
Cornelia Habekost
1,
Heinrich Iro
2 and
Christopher Bohr
1
1
Department of Otorhinolaryngology, Head and Neck Surgery, University Hospital of Regensburg, 93053 Regensburg, Germany
2
Department of Otorhinolaryngology, Head and Neck Surgery, Friedrich-Alexander University Erlangen-Nuremberg (FAU), 91054 Erlangen, Germany
*
Author to whom correspondence should be addressed.
Both authors contributed equally.
Appl. Sci. 2021, 11(18), 8616; https://doi.org/10.3390/app11188616
Submission received: 6 August 2021 / Revised: 30 August 2021 / Accepted: 11 September 2021 / Published: 16 September 2021
(This article belongs to the Special Issue Novel Advances in Computer-Assisted Surgery)

Abstract

:

Featured Application

This paper and its findings are important for any clinic that is thinking about setting up a navigation system for its ENT department, concerning the costs, efficiency in the operating room, and applicability for training purposes.

Abstract

(1) Background: The use of navigation systems is rarely necessary for routine sinus surgery. They may prove to be advantageous for difficult operations, for example, in finding structures that are difficult to reach, in the treatment of cancers, or in revisional surgery. Navigation systems are also said to have positive effects on the self-confidence of surgeons in stressful situations and in the training of doctors. (2) Methods: This retrospective study included patients who underwent surgical treatment for chronic sinusitis from 2012 to 2016 at the ENT clinic of the University Hospital, Erlangen. Two groups were formed; one includes patients without navigated sinus surgery, the other includes those with navigation. The incision–suture times of both groups and cost analysis are compared. An appropriate cost estimate for sinus surgery is determined. (3) Results: From the available results, no economically efficient navigation systems in sinus surgery at the ENT clinic can be shown. The main reason is that lengthening the operating time leads to higher costs. (4) Conclusions: Although the use of a navigation system for endonasal sinus surgery cannot be economically justified, it is an important tool, especially in cases with complex anatomical conditions, and the system is essential for training purposes.

1. Introduction

The intraoperative use of navigation devices has long been an integral part of surgical otorhinolaryngology. These devices have so far been used mainly in endonasal endoscopic sinus surgery.
However, the healthcare system and the hospital sector are increasingly transforming into a business system, based on the principle of economic efficiency.
Since the introduction of navigation systems at the end of the 1980s, several studies have addressed the technical aspects, the accuracy of the systems, the operating procedure and outcome, as well as the acceptance of and the necessity for such systems [1]. Navigation is shown to be advantageous in the treatment of recurrent cases of chronic polypoid sinusitis, for mucocele, and malignant tumors, as well as in locating the frontal and sphenoid sinuses [1]. Yet, economic efficiency can only be confirmed in exceptional cases. The available studies show higher costs incurred when using navigation systems [1,2,3,4].
Consequently, health insurance funds will only bear the costs of endoscopic endonasal sinus operations with intraoperative navigation in exceptional cases. Therefore, an accurate calculation of the investment involved in using a navigation system is required.
The purpose of navigation is to improve intraoperative orientation by the localization of anatomical structures, which requires the ongoing development of imaging techniques and endoscopy. At the same time, intraoperative navigation is based on connecting data about the patient’s position in space, as well as the position of the navigable surgical instruments and the dataset from computed tomography (CT) and/or magnetic resonance imaging (MRI) that has been recorded preoperatively under defined conditions [5].
In 1989, Georg Schlöndorff was the first to describe computer-assisted surgery as a technique to support head and neck surgeons [6]. The technique was based on a three-dimensional volume model of the patient’s skull, generated by CT or MRI. Body points could be marked in this 3D model by an intraoperative correlation of model and patient. A volume digitizer was used for the purpose. The real-time positioning of surgical instruments without visual control could, thus, be achieved. Schlöndorff demonstrated the use of the system in the areas of the skull base, orbits, and paranasal sinuses [6].
The navigation system manufactured by Fiagon (Henningsdorf) has been used in the ENT clinic of the University Hospital, Erlangen since 2007.
This is an electromagnetic system and consists of a computing unit, a field generator built into the headrest, and a localizer. In addition, navigable instruments can be connected to the computing unit.
Before navigation starts, registration of the patient and the calibration of the system take place. This involves correlating the location of instrument and patient with the CT data set. The localizer placed on the patient shows the exact position of the patient in the generated magnetic field. Precise alignment is achieved by surface registration. A point cloud is produced in the computing unit, and this is matched to the CT-imaging dataset [7].
Figure 1a shows the main components and Figure 1b shows the instruments used for navigated sinus operations. The location of the pointer instrument being used is projected into the axial, coronal, and sagittal sectional planes of the CT on the screen and correlated with the endoscopy image that appears alongside on the screen. The instrument tip is highlighted in the view by crosshairs and a green arrow (see Figure 1c) [7,8].

Process Cost Accounting

“Process cost accounting is a cost accounting system that calculates indirect costs of processes (activities) over quantitative reference parameters (drivers), which represent dimensional expressions for the process (activity) quantities or are defined as such” [9]. A cause-based allocation of indirect costs to the cost-bearer thus becomes possible [9].
The basic requirement for process cost accounting is to identify the existing processes. A process exhibits the following characteristics: a measurable service output, of a specific quality, with analyzable throughput time or processing time, the delivery of which measurably demands resources (costs) and can be attributed to specific cost-influencing factors (cost drivers) [10]. In the hierarchical process model of a hospital, a process consists of several primary processes that in turn are divided into subprocesses. At this level, a distinction is made between activity quantity-induced (aqi) and activity quantity-neutral (aqn) processes or activities [10,11,12].
A process cost rate is calculated for each aqi. This denotes the average costs for the single performance of a specific subprocess. It is calculated by dividing the defined process costs by the relevant expression of the process reference parameter. If aqn processes are also to be included in the calculation, these are divided among all aqi processes proportionally to the ratio of aqi costs. This results in an apportionment rate and a total process cost rate for each aqi process [9,11].
The objective of this retrospective study is to investigate the economic efficiency of the Fiagon navigation system that is used in the ENT clinic of the University Hospital Erlangen.

2. Materials and Methods

The retrospective study included patients who underwent surgical treatment for chronic sinusitis between 1 January 2012 and 31 December 2016. A total of 1158 cases with complete data records were identified for this period. Navigation was used in nearly one-third of these cases.
A group of patients with navigated sinus surgery and a second group without navigation were formed. Table 1 shows the age and gender distribution in the two groups.
Table 2 lists the number of cases by year, divided into the defined groups. This gives a total mean of 227 cases per year. The number of navigated operations increased steadily during this period.
The 51- to 60-year-old patients form the largest group; the patients’ mean age is 48.97 years. Figure 2 provides a clear picture of the age structure.
In terms of methodology, the patients were recorded using the patient data administration system, Meierhofer Clinical Competence (MCC, Meierhofer AG, Munich, Germany), from Meierhofer AG. The cases are recorded according to their ICD-10 diagnosis J32 and classified based on OPS procedures 5–22 (1–9). The navigated cases are additionally identified by OPS Code 5-988.
Patients in whom a malignant tumor of the nasal or paranasal sinus or of the middle ear was detected by histology, as well as patients who simultaneously underwent septoplasty, were excluded. The incision–suture time defines the time between the first and the last step of an operation performed by the surgeon.
In terms of content, the incision–suture times of both groups and cost analysis are compared. An appropriate cost estimate for sinus surgery is defined for this purpose.
The operations were performed by several surgeons with different levels of experience. Table 3 lists the distribution of physicians according to seniority.
Patients with chronic rhinosinusitis (with and without polyps) underwent surgery. The diagnosis was made via nasal endoscopy, by means of imaging techniques such as CT scans. A previously unsuccessful attempt at conservative treatment was also required.
As regards content, the study deals with the subprocess of surgery to treat chronic rhinosinusitis, in particular the incision–suture time of navigated vs. non-navigated surgery, as documented in the MCC program. This measure of time defines the process being studied and is also the process parameter that has a major influence. The second important process parameter is the activity quantity, i.e., the number of operations performed per year.
In the MCC program, there are no noticeable differences in the preparation time between navigated and non-navigated operations because the navigation set-up is simple, is integrated into surgical routine practice, and can be managed within the time taken for regular surgical preparations.
Means and medians are formed from the incision–suture times for the analysis, and for calculating process costs.
To calculate the mean as a function of the physician’s position, the weighted mean x ¯ was calculated using Formula (1) [13]:
Formula 1:
x ¯ = i = 1 n w i   x i i = 1 n w i
To determine the measure of dispersion, the standard deviation (s) of the mean was determined with Formula (2) [13]:
Formula 2:
s = 1 n   i = 1 n ( x i x ¯ ) 2
The median ( x ˜ ) is defined as follows [13]:
Formula 3:
x ˜ =   x n + 1 2   ;   n   odd   1 2 x n 2 + x n 2 + 1 ;   n   even  

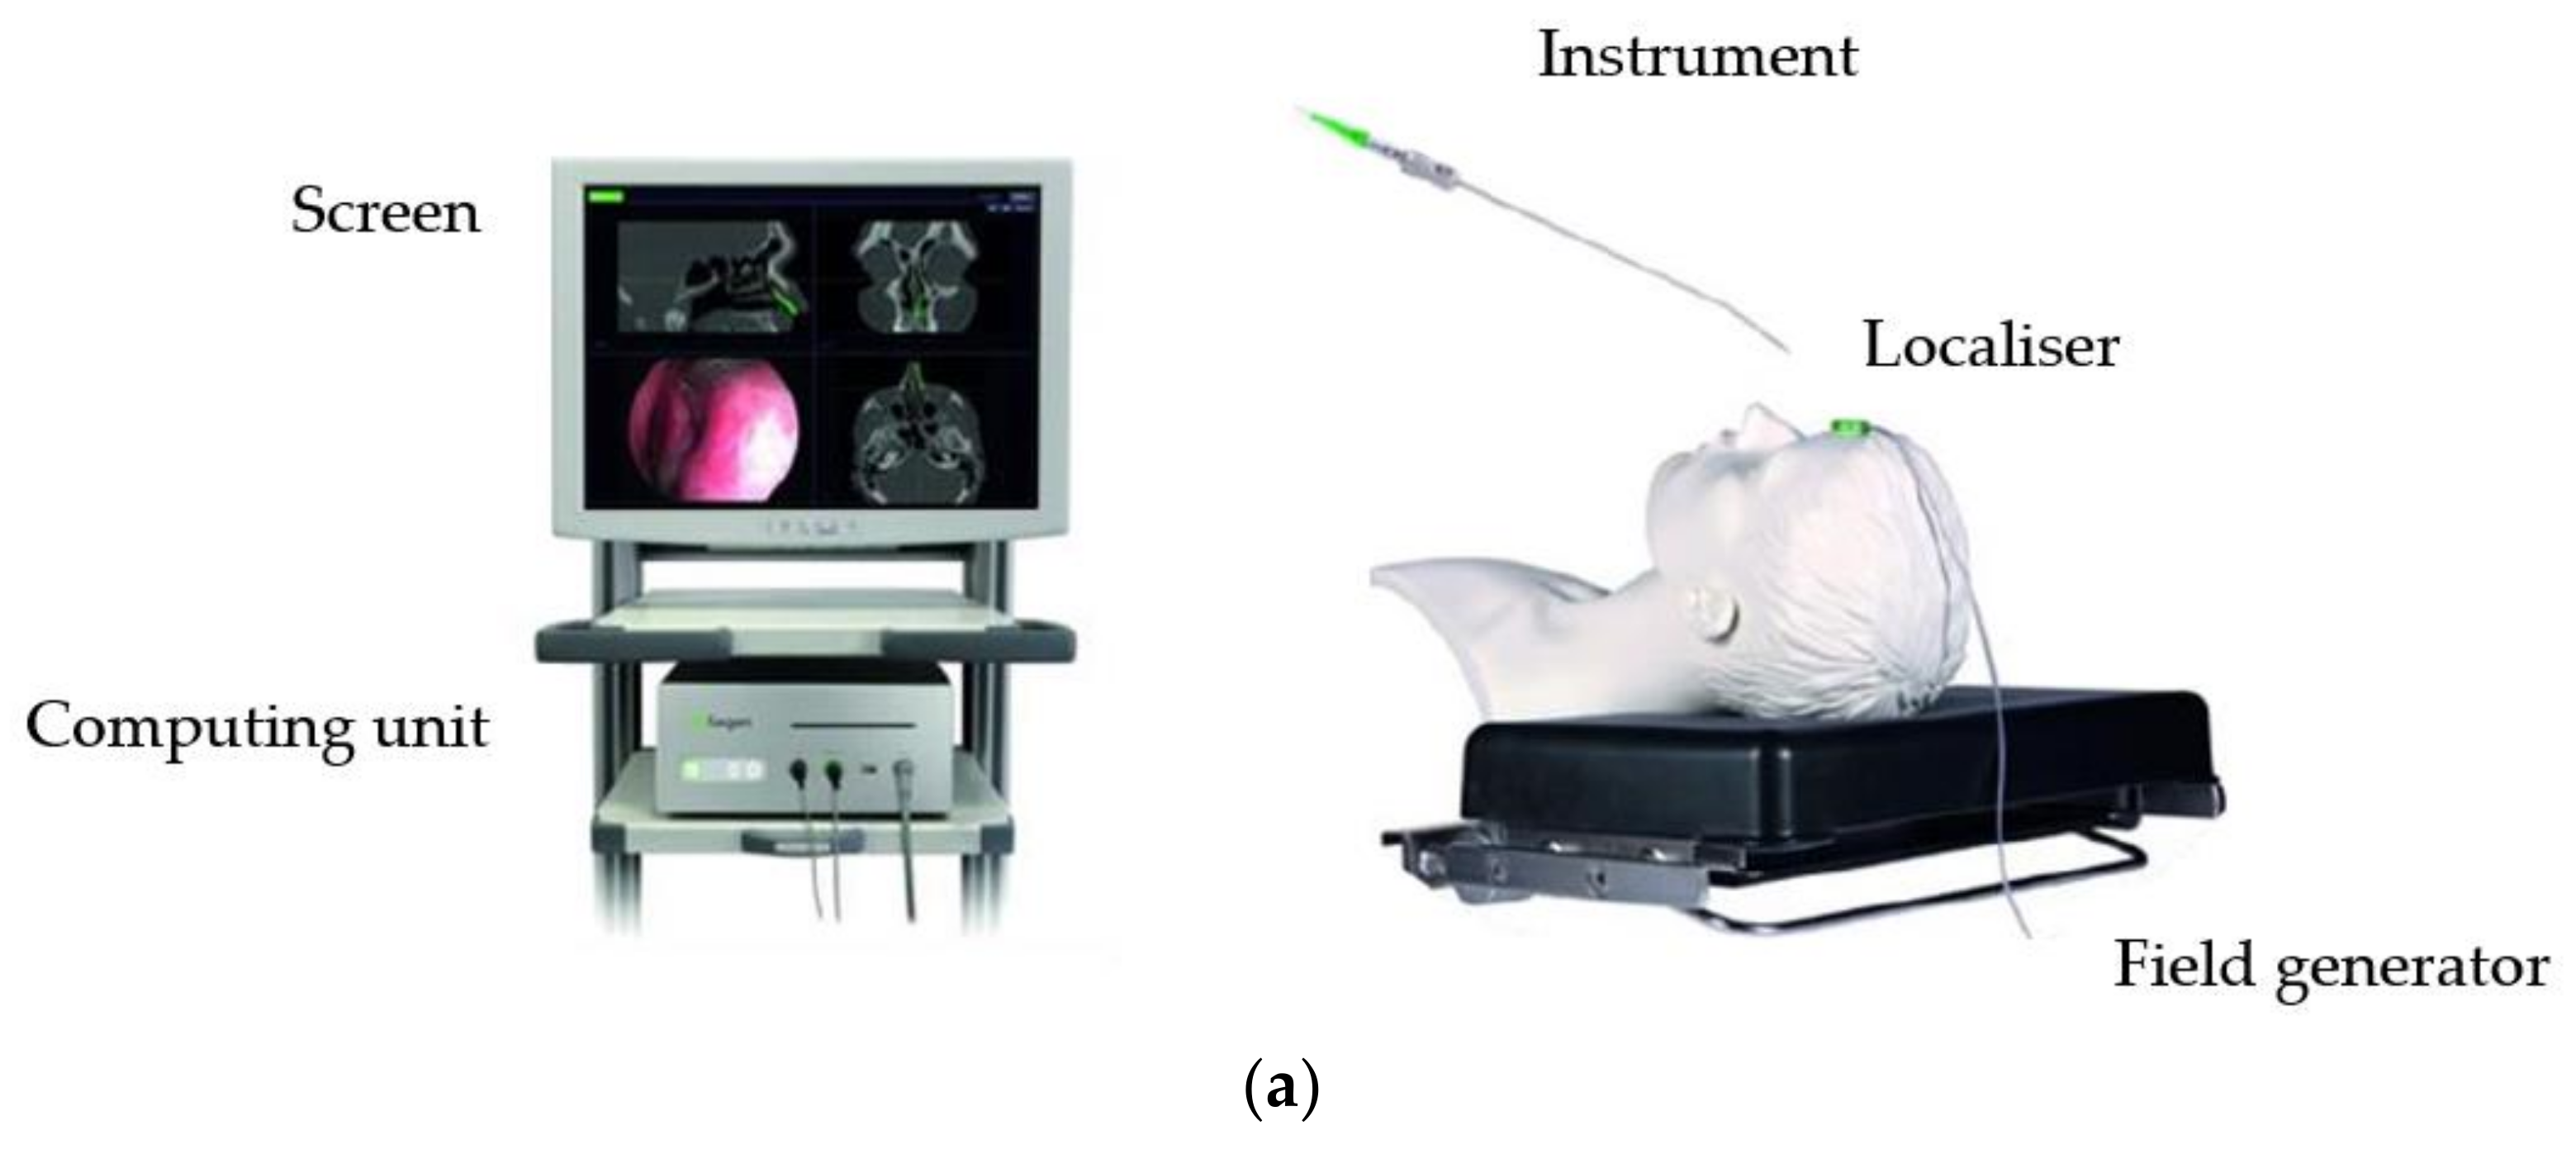
2.1. Navigation Device Usage Time

Fiagon navigation devices will document their use in log files. As well as the date and time, they log for how long the pointer is used by the surgeon. This results in an accumulated time per use. From this, the mean navigation device usage time per operation can be calculated over the observation period.
As no patient information is stored in the log files, the logged uses of the navigation devices must be clearly assigned to the documented operations from the MCC program. This is performed according to the following criteria:
  • Documentation of a complete and successful registration process.
  • Matching date and operating time, from the log file to a navigated operation from the MCC.

2.2. Approach to Determining Process Costs

For this study, the business department of the University Hospital, Erlangen provides cost rates for the years 2012–2016, which are established according to cost per unit accounting. These rates have been suitably adapted to the process of sinus surgery, as being studied, to generate a process cost rate for the observation period.
Table 4 shows the cost rates of the ENT clinic for the year 2016, with the cost center groups, Surgery and Anesthesia, and the relevant cost-type groups.
For the cost-type groups, “Personnel costs medical activity” and “Personnel costs medical technical activity/functional activity”, the following points should be noted in the “Comments” column:
These items involve weighted incision–suture times or anesthesia times, so that the relevant weighting must be determined for these items. Cost-type group 1, for instance, is weighted when one or more physicians, in addition to the surgeon, are included in an operation for a certain period of time. The weighting is derived from a backward calculation in which the weighted value is divided by the unweighted number.
In the case of cost group 4, the ratio of incision–suture times is formed from cost-type groups 1 and 7, to obtain the weighting.
Anesthesia time is used for the cost center group, Anesthesia. The anesthesia time is longer than the incision–suture time and includes the time spent in the recovery room. The incision–suture time is, therefore, used for the process observed in this study, as it defines the process being investigated, i.e., the operation.
For each cost-type group, a mean cost rate is formed for the five years under consideration. A mean weighting is also calculated for each necessary cost-type group. This is found for cost center groups 4 and 5 by dividing the mean times of the appropriate cost-type groups 1 and 2 by the respective mean time of cost-type group 7. The weighting of the averaged cost rates is then performed by multiplication, and a sum for a total process cost rate is established.
The next steps in determining the financial efficiency of navigated operations originate from the healthcare economy and are referred to as a bottom-up approach, or micro-costing. This approach can be used to record costs and benefit effects [13].
A difference is formed via the ascertained mean incision–suture times of the navigated and non-navigated operations. This time difference is then multiplied by the abovementioned, ascertained process cost rate. This produces a mean cost difference per operation, which in turn is multiplied by a mean process quantity per year, taken from Table 2. The product shows either the annual additional costs or the cost-saving from navigated operations [13,14].

3. Results

3.1. Mean Navigation Device Usage Time

The log files of the navigation devices contain recordings from the start of 2014 to the end of 2016. A total of 130 operations can clearly be identified for the analysis. Frequency distribution of the period of use, with a class width of 3 min, is generated.
The following bar chart (Figure 3) shows a non-symmetrical distribution and is right-skewed. Nearly 50% of the navigation uses lasted less than 6 min. The most frequent class, with 46 entries, is the 3–6-min range, followed by the third class of 6–9 min, with 30 entries.
Table 5 shows a mean duration of 7.5 min with a standard deviation of 5 min. In view of the high standard deviation and the strongly right-skewed frequency distribution, the median of 6.4 min should be regarded as a more informative value.
The outliers, particularly the maximum of 29.7 min and the high dispersion, can firstly be explained using a navigated suction instrument; secondly, the pointer instrument might have been located in the magnetic field of the transmitter so that activity was still being recorded. Other potential factors that can lead to a longer accumulated time are faulty intraoperative registration processes or repetitions of registration. Successful registration takes less than 1 min, according to the log files. Longer usage times should be regarded as unrealistic because the pointer is only used briefly for checking the position. The minimum of 0.6 min indicates a registration process but no further use of the pointer and, hence, of the navigation device.
The periods of use are not assigned to the respective doctors in the analysis, which means that it is not possible to classify usage time according to the surgeon’s level of experience; therefore, no statement can be made as to whether an experienced surgeon uses the device for a shorter time than an inexperienced one.

3.2. Frequency Distributions of Incision–Suture Times

Based on their incision–suture times, the operations are divided into blocks with a class width of 30 min. For instance, in the segment of operations lasting less than 30 min, 89 were performed without navigation, which equates to the 10.7 percent of non-navigated cases included in the study. A total of seven classes are formed, the last one covering those operations with an incision–suture time of more than 180 min. The frequency distribution results are presented in the two bar charts in Figure 4, one showing absolute values and the other showing percentages.

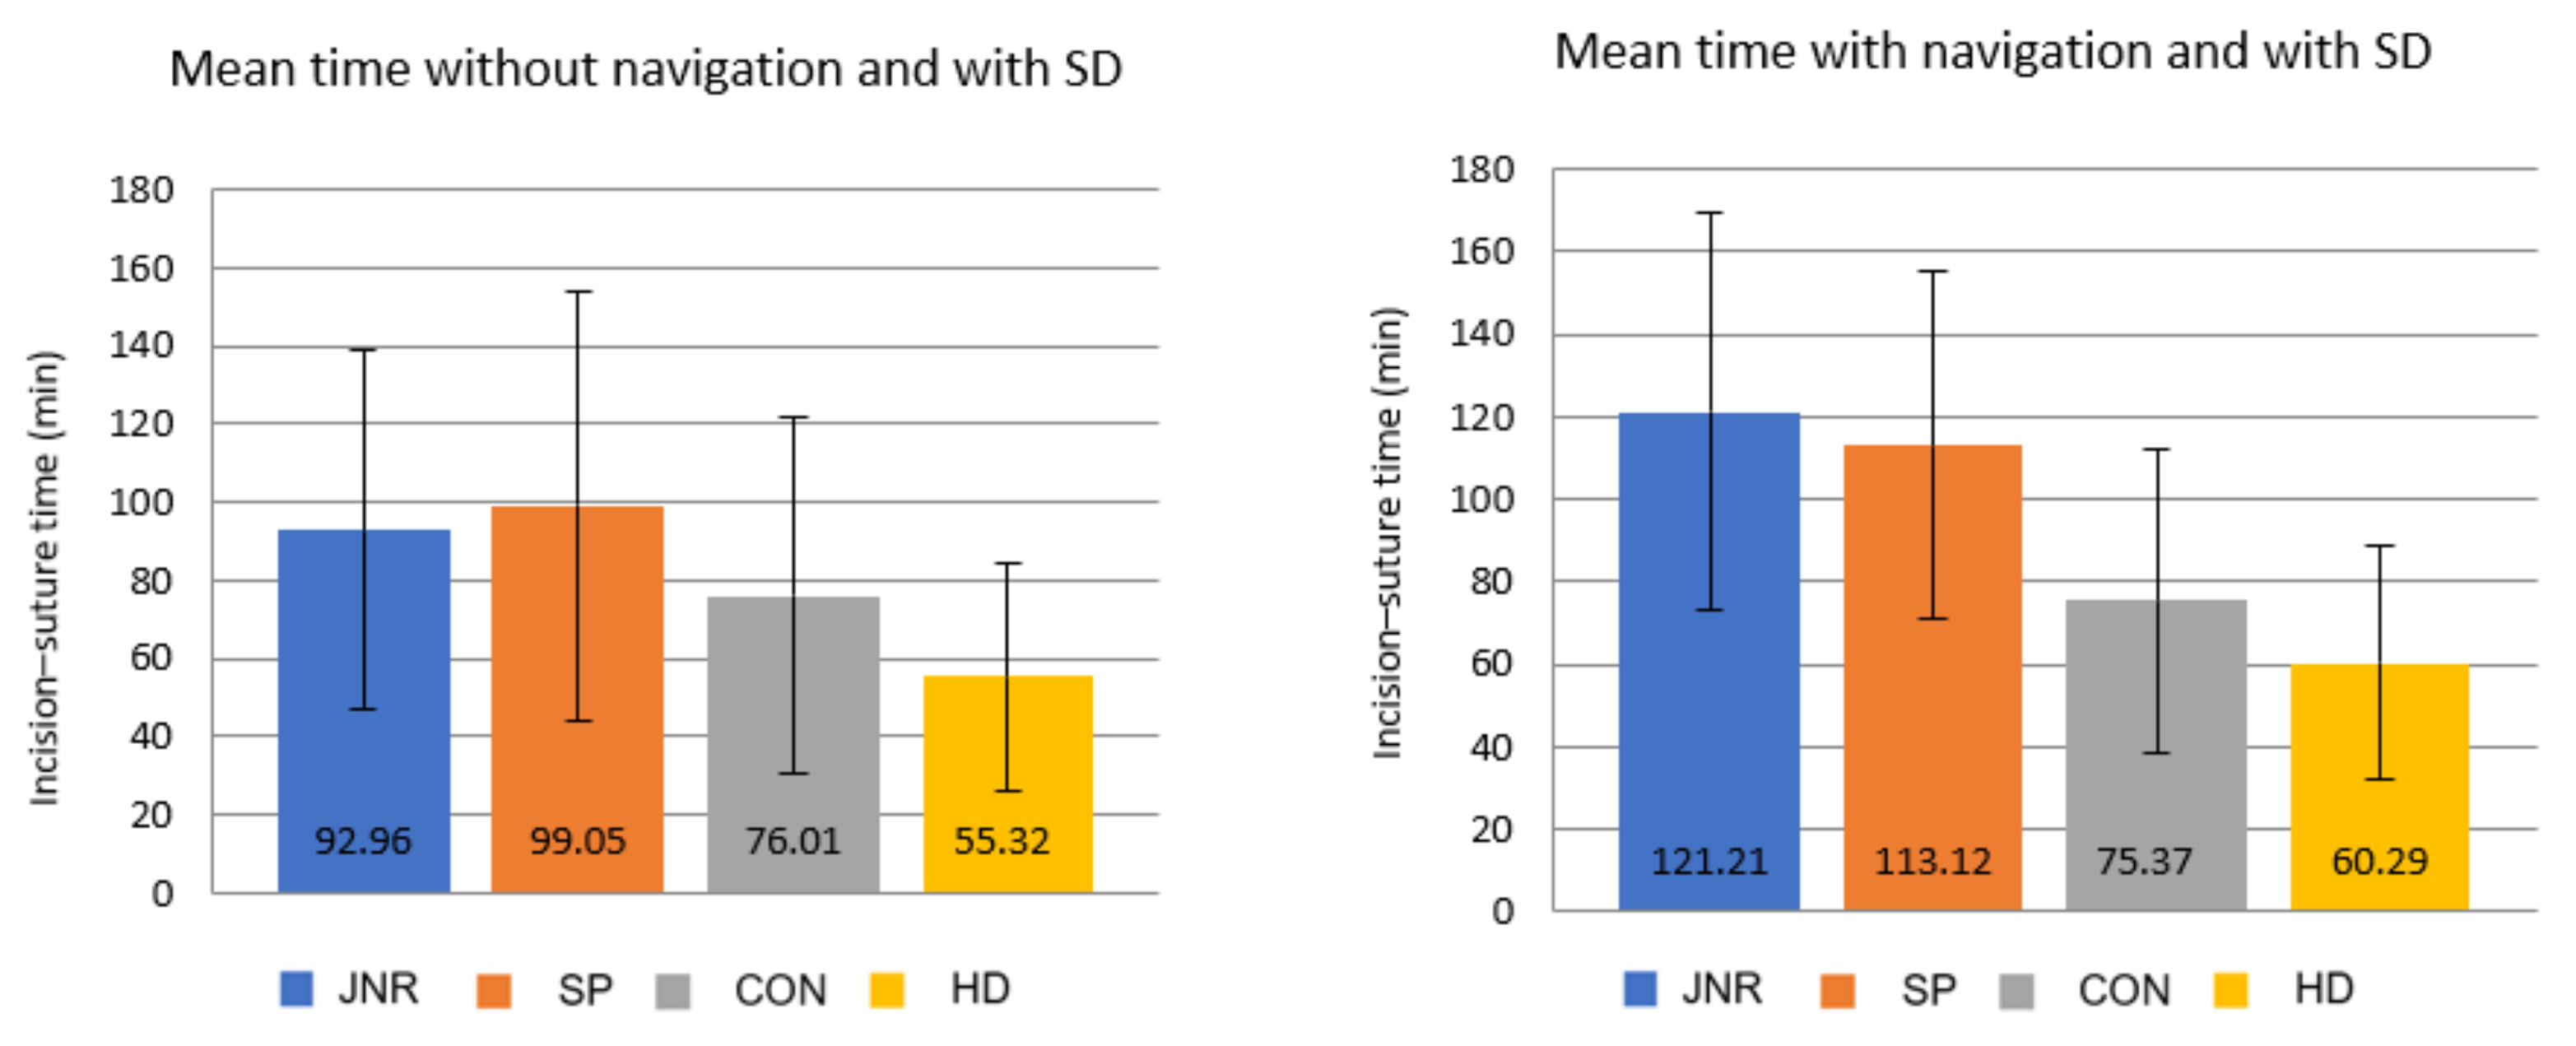
3.3. Results—Operating Times

Figure 5 shows the arithmetic means of incision–suture times over the complete observation period and the respective median times, with interquartile range.
For operations without navigation, the overall mean time is 80 min, with a standard deviation of 45.6 min. By contrast, operations performed with the aid of a navigation device are a mean of 4.5 min shorter, hence, lasting 75.5 min, with a standard deviation of 40.6 min. The median operating times are additionally calculated. The median time is 69 min for navigated operations and 72 min for non-navigated surgery.
Table 6 lists the number of operations according to each rank of physician (JNR: Junior Doctor, SP: Specialist, CON: Consultant, HD: Head of Department), the mean operating time in terms of the incision–suture times, the median duration of operations, and the standard deviation.
Figure 6 shows the mean durations that are characterized by high standard deviation. For this reason, the median values (Figure 7) are used for the interpretations.
It can be seen from the diagrams that the operating times shorten with increasing levels of experience. It is also noticeable that the use of the navigation device does not afford a time advantage for any physician’s position. In terms of the mean operating times, this is because the times must be weighted according to the physician’s position in order to obtain an overall average. The uneven number of cases in the two groups, and the non-symmetrical frequency distribution, also play a role.
The longer operating times can be explained in the case of junior doctors with less surgical experience or routine practice exercises. However, it is surprising that the operating times are longer for specialists than for junior doctors.
It is also noticeable that junior doctors and specialists operate rather infrequently with a navigation system. In five years, 22 junior doctors performed 136 operations without a navigation device and 34 with one. The pattern is similar for specialists; seven specialists were responsible for 179 operations without a navigation device and 33 operations with one. The operating times are similar for junior doctors (87 min without and 93 min with navigation) and specialists (93 min without and 114 min with navigation).
Greater surgical experience is clearly reflected in the median operating times for the consultants and the head of the department. In non-navigated operations, those consultants with a median of 67 min, and the head of the department with 49 min, are faster than the corresponding overall median of 72 min. For procedures in which the navigation device is used, the consultants require a median of 72 min, the head of the department, 57 min. Their operations take longer with the navigation device: the consultants require 5 min longer with navigation, the head of the department, 8 min longer.
Table 7 reveals that two physicians in a particular position usually performed more than 50% of the navigated operations. Among the junior doctors, JNR3 and JNR17 operated most frequently, with 6 and 14 procedures, respectively. In the group of specialists, it is SP2 and SP3 who are most frequently involved, with 7 and 14 operations, respectively; among the consultants, it is CON7 and CON9, with 23 and 28 procedures, respectively. The head of the department performed 183 navigated operations. These physicians have the most experience with the navigation device and, therefore, have the greatest influence on the analysis. When operation numbers without navigation are added, these doctors usually performed the most operations in their position group and, hence, have the most experience with sinus surgery.
Comparing these physicians among themselves shows that only SP3 is faster with the navigation device, by about 1 min, with a median incision–suture time of 112 min. The two consultants require a median of more than 20 min longer per operation when using navigation. Table 6 shows the calculation of incision–suture times when considering these selected physicians. This shows that, while the overall mean times of the two groups match, the median times change for a comparable number of operations. For 310 non-navigated operations, the mean operating time is now 74.6 min and has, hence, become shorter. Navigated operations last 73.8 min on average, for a total of 275 operations.
Conversely, the navigated operations with the selected physicians now lasted 10 min longer in the overall median. The overall median of navigated operations remains the same as in Table 5, at 69 min. The median time of 72 min falls to 59 min for those operations without navigation.
The minimal change to the overall result on the side of navigated operations, versus Table 5, is largely due to the number of operations by the head of the department because he performs more than 50% of the navigated operations.
The reason for the change on the side of operations without navigation is that a great many operating times that lie above the overall mean or median in Table 5 were omitted.

3.4. Cost Analysis

Table 8 shows the results of the determination of the process cost rate. The tariffs for the cost-type groups in years 2012–2016 and the resulting mean values are listed. The table also contains the calculated mean weightings. The weighting for personnel costs of medical activity in the ENT surgery cost center group can be verified using the data from the MCC documentation. On average, 1.7 physicians operated in non-navigated surgery, and 1.8 in navigated operations. These values correspond to the established weighting from the data of the business department.
Overall, a process cost rate of EUR 11.79/min is calculated. The personnel costs, which are made up of the medical activity and medical technical activity/functional activity for ENT surgery and anesthesia, are EUR 6.24/min.
Based on an analysis of operating times and the process cost rate, three possible calculations or cases according to the bottom-up approach can be implemented:
  • Inclusion of all surgeons from Table 5.
  • Only selected surgeons from Table 6.
  • Only the head of the department.
A Fiagon navigation device costs EUR 70,000, according to the list price. Given a service life of five years, and without including maintenance costs, investment costs are hence EUR 14,000 per year. To cover the costs of using this navigation device by means of sinus surgery alone, the navigated operations would have to be at least 5.5 min shorter in duration. This applies to the process cost rate calculated here, along with the assumption that 227 operations per year are performed.
Table 9 shows the results of the cost accounting. For the general, first case, including all surgeons, an economic advantage of EUR 8.029 per year before the inclusion of investment costs can be achieved with the navigation device. For cases two and three, additional costs of EUR 26,763.30 and EUR 21,410.60 per year are incurred when a navigation device is used. If the investment costs are included in the calculation, additional costs per year occur in all cases: EUR 5971 (case 1), EUR 40,763.30 (case 2) and EUR 35,410.60 (case 3).

4. Discussion

Critical Examination of the Methodology

In terms of patient selection, the criticism may be raised that a search using classification systems will yield unspecific diagnoses and forms of treatment. The ICD-10 code, as well as the OPS-301 code, will also include all subcategories.
A breakdown of operations according to separate areas of the paranasal sinuses, or based on specific procedures, was rejected because this proved difficult to analyze. It was not possible to establish a definite and representative number of procedures that would still have been comparable in this respect. Furthermore, the uneven case numbers for navigated and non-navigated groups can be problematic. For instance, there are 329 navigated versus 929 non-navigated cases. This means that the mean or the median for navigated surgery is heavily dependent on the performance of the head of the department because he performs over 50% of the procedures. The other half of the operations are divided heterogeneously between surgeons with differing levels of experience.
Furthermore, it was not possible to check whether the complexity of the cases is evenly distributed. It must also be assumed that the frequency of navigation usage was greater in particularly difficult procedures, which led to a poorer time result.
The process cost rate for the specific process of surgery observed in this study cannot be determined using process cost accounting. This is because the expense of process cost accounting is not justified for comparing two near-identical processes that only differ in the use of an additional device. The advantage of process cost accounting over cost unit accounting is that indirect costs are identified and apportioned to so-called cost drivers [15]. These indirect costs play a secondary role in this study. According to Greiling, process-oriented cost unit accounting is sufficient as the basis for process optimization if the transparency of indirect costs is to be ignored [10]. The cost rates generated by cost unit accounting by the business department of the Hospital University, Erlangen fully cover the process being examined in this study. Adapting the cost rates to the process time, which in this study equates to the incision–suture time, produces an appropriate, process-oriented cost rate.
The cost rates for operations quoted in the literature are difficult to compare with each other because their determination is dependent on various factors and prevailing conditions [2]. Cerha et al. reported in 2009 that the personnel costs of an orthopedic operating theatre at the University Hospital, Dresden were EUR 5.58/min. Personnel encompasses the presence of two physicians, two theatre nurses, one surgical assistant, and the anesthetist [16].
In our study, the personnel costs for the medical and “med. tech. activity/functional activity” for ENT surgery and anesthesia are EUR 6.24/min. This is roughly in line with the abovementioned personnel costs.
Strauß et al. used a cost rate of EUR 10/min as their basis for calculating operating theatre costs in 2006. The Millennium Research Group Inc. from Toronto, Canada, which issued a market analysis for image-guided surgery, was quoted as a source [2].
The process costs of the Department of Vascular Surgery and Endovascular Surgery of the University Hospital, Heidelberg were EUR 11.75/min in 2017, according to Attigah et al. The cost rate was achieved by means of process cost accounting, to compare a hybrid operating theatre with a conventional operating theatre. The personnel costs are given as EUR 6.74/min in the publication [14]. In a study on the efficiency of a navigation device for ENT surgery, Strauß et al. calculate a cost rate of EUR 16/min (including those times when the operating theatre is not being used), which is a generally recognized approach to cost calculation for modern operating theatres [17].
The abovementioned examples of cost rates indicate that the process cost rate determined in this study can be classed as realistic. Personnel costs can be seen as a good indicator. It is also noticeable that the process cost rate in this study is identical to the cost rate from the example of the University Hospital, Heidelberg.
The level of the cost rate and the number of operations performed per year have an influence on the mean difference in operating time between navigated and non-navigated surgery. It defines the level at which it is worth investing in a navigation system. An increase in the cost rate or in the number of operations signifies that the minimum time by which navigated operations need to speed up may be lower. A decrease means that navigated operations require a greater time advantage over non-navigated procedures.
The cost analysis applied in this study is simplified and idealized. For instance, the accounting that is conducted compares the situation of navigated operations alone with non-navigated operations alone. The cost analysis is mainly dependent on the factor of time because a longer operating time ties up more resources. The operating time in turn is heavily dependent on the surgeon’s level of experience and the difficulty of the surgery. Usable mean times cannot be determined because of high dispersion, which is consistently present for all physicians’ positions. The median is more stable against outliers and, in this case, is preferable to mean times.
Even though experienced handling of the navigation device has a positive impact on workload by relieving stressful phases, such as when trying to locate the sphenoid bone or the base of the skull, analysis of the data shows that the navigation device is only rarely used during junior doctors’ training so that routine practice cannot be developed on which specialists, for instance, might be able to build [2].
Thus, the results presented here do not coincide with those of Strauß et al. from 2006 and 2009. Their studies show that the incision–suture times of endoscopically functional sinus operations are shortened by up to 10 min using a navigation system. In the study from 2009, however, particular attention is paid to ensuring a comparable manifestation of the clinical picture of chronic sinusitis. This is made possible by the specific preselection of patients [2,17].
The question arises of how far a navigation system benefits an experienced surgeon. Analysis of the navigation system records shows a mean period of use of approx. 6.4 min, i.e., the system is most frequently used in the ranges of 3–6 min and 6–9 min. Although this does not entirely coincide with the prolonged periods for the operating times of consultants and the head of the department, the time is also not recovered through the use of the navigation system, which suggests that the surgeons derive other benefits from using navigation systems rather than merely the shortening of the operating time. Two further studies show that the greatest benefit of navigated operations lies in locating the frontal sinus and the sphenoid sinus. A navigation system is also an immense help in verifying the cranial base, as well as in revisional surgery for chronic polypoid sinusitis, mucocele, and malignant tumors [1,18].
Oeken et al. report in their study that navigation would have a direct influence on surgery in 25% of the cases they examined; without navigation, one would have to switch to transfacial access in 14% of cases, and the operations would not have been performed with the required thoroughness in 11% of cases [1].
In their feasibility study, Giotakis et al. observed that, following primary navigated sinus surgery, there was a tendency to have fewer missed sinus compartments, meaning sinus compartments that would have required surgical treatment but were inadvertently not operated upon [19].
In further studies, representative surveys show that the majority of surgeons see no major added benefit to navigation, or its use is viewed as not essential in nearly three-quarters of cases [1,20]. Rosen et al. viewed the navigation tool as a hindrance to process steps, especially in initial operations for chronic sinusitis [21].
Consequently, the results of this study support the results of numerous studies that conclude that navigation systems result in longer operating times and higher expenditure [19,22,23,24]. However, a distinction must be made, because older papers still assume an additional surgical preparation time of up to 15 min, which is included in their calculations [25,26]. A system setup, taking place at the same time as regular preparations and patient registrations, which takes longer than 5 min is a rarity with modern navigation systems [2,17,27].
Gibbons et al. conclude that computer-assisted endoscopic sinus surgery carries higher costs, but they express the opinion that not all benefits of computer-assisted endoscopic sinus surgery are quantifiable, and the immaterial benefits outweigh the higher costs. In their view, these benefits include the surgeon’s added self-confidence and verification during surgery [24].
In their meta-analysis of the use of navigation devices in sinus surgery, Sunkaraneni et al. report that the properly supervised use of navigation by trainees is an effective learning tool. They quote, among others, the study by Casiano and Numa, showing that navigation systems have a positive impact on surgical accuracy and efficiency in sinus operations during the training of junior doctors (equivalent to “residency” in the American system) [28,29]. A study by Sugino et al. was published in 2018; in it, they developed surgical process models that enable surgeons, by means of navigation, to identify the differences between their own surgical technique and that of other, more experienced colleagues, thereby improving their surgical performance [30].
As early as 2002, Fried et al. reported in their study that computer-assisted surgery for sinus operations contributes to a reduction in complications and allows more thorough surgery to be performed [31]. In their 2013 meta-analysis, Dalgorf et al. conclude that major complications, as well as complications overall, are less likely when navigation systems are used in sinus surgery [32].

5. Conclusions

The present study shows that the incision–suture times in endonasal sinus surgery cannot be shortened using a navigation system. Broadly speaking, the results indicate a slight time advantage with navigation systems, but there are a few points of criticism. These include the uneven number of operations and the non-homogeneous distribution regarding surgeons’ levels of experience. For comparison, it thus makes sense to consider only those cases in which the surgeons can demonstrate some routine experience both with and without navigation. Analyses of these cases (Table 6) reveal that the median operating times with navigation are even up to 10 min longer. When viewed individually, the results also indicate that the surgeons gain no time advantage as a result of improved anatomical orientation.
This study proves that the lengthening of the operating time leads to an increase in expenditure. In addition, there are the costs of acquiring the navigation system, as well as normal service and maintenance costs.
Although the use of a navigation system for endonasal sinus surgery cannot be economically justified, it is a valuable tool, especially in cases with complex anatomical conditions and, based on the authors’ experience, it is an investment that makes absolute sense and is sometimes essential as a training tool and for operations with a high degree of difficulty.

Author Contributions

Conceptualization: F.E.S., M.T., C.B.; methodology: F.E.S., M.T., A.S.; software: F.E.S., M.T., A.S.; validation: C.B., H.I.; formal analysis: A.S., F.E.S.; investigation: F.E.S., A.S, C.T.S., C.H.; resources: F.E.S., M.T., A.S.; data curation: F.E.S., M.T., A.S., C.H.; writing—original draft preparation: F.E.S.; writing—review and editing: F.E.S., M.T., C.T.S., A.S., C.H., H.I., C.B.; visualization: F.E.S.; supervision: C.B.; project administration: C.B. All authors have read and agreed to the published version of the manuscript.

Funding

This research received no external funding.

Institutional Review Board Statement

The study was performed in accordance with the ethical standards as laid down in the 1964 Declaration of Helsinki and its later amendments.

Informed Consent Statement

Not applicable.

Conflicts of Interest

The authors declare no conflict of interest.

References

  1. Oeken, J.; Törpel, J. Der Einfluss der Navigation auf die endoskopische NNH-Chirurgie. HNO 2007, 56, 151–157. [Google Scholar] [CrossRef] [PubMed]
  2. Strauß, G.; Koulechov, K.; Röttger, S.; Bahner, J.; Trantakis, C.; Hofer, M.; Korb, W.; Burgert, O.; Meixensberger, J.; Manzey, D.; et al. Ist der Vorteil eines Navigationssystems in der HNO-Chirurgie messbar? Ein Konzept zur Evaluation ergonomischer und chirurgischer Erfolgsparameter. HNO 2006, 54, 947–957. [Google Scholar] [CrossRef] [PubMed]
  3. Grevers, G.; Menauer, F.; Leunig, A.; Caversaccio, M.; Kastenbauer, E. Navigationschirurgie bei Nasennebenhöhlenerkrankungen. Laryngorhinootologie 1999, 78, 41–46. [Google Scholar] [CrossRef]
  4. Reardon, E.J. Navigational risks associated with sinus surgery and the clinical effects of implementing a navigational system for sinus surgery. Laryngoscope 2002, 112 (Suppl. 99), 1–19. [Google Scholar] [CrossRef]
  5. Caversaccio, M.; Zheng, G.; Nolte, L.-P. Computerassistierte Chirurgie der Nasennebenhöhlen und er vorderen Schädelbasis. HNO 2008, 56, 376–378. [Google Scholar] [CrossRef]
  6. Schlöndorff, G.; Mosges, R.; Meyer-Ebrecht, D.; Krybus, W.; Adams, L. CAS (computer assisted surgery). A new procedure in head and neck surgery. HNO 1989, 37, 187–190. [Google Scholar] [PubMed]
  7. Hedermann, R. New Manufacturing Concepts for Electromagnetically Navigated Instruments. Master’s Thesis, Mechanical Engeneering, Technical University, Munich, Germany, 2013. [Google Scholar]
  8. Fiagon AG Medical Technologies. Available online: https://www.fiagon.com/ous/de/ (accessed on 6 August 2021).
  9. Zapp, W. Kosten-, Leistungs-, Erlös- und Ergebnisrechnung im Krankenhaus. (1. Auflage Ausg.); Baumann Fachverlage GmbH & Co. KG: Kulmbach, Germany, 2009. [Google Scholar]
  10. Hedderich, J. Angewandte Statistik: Methodensammlung mit R, 15. Auflage Hrsg.; Springer Spektrum: Berlin, Germany, 2016. [Google Scholar]
  11. Greiling, M. Pfade durch das klinische Prozessmanagement. (1. Auflage Ausg.); Kohlhammer GmbH: Stuttgart, Germany, 2004. [Google Scholar]
  12. Greiling, M. Prozesskostenrechnung im Krankenhaus-Instrument und praktische Umsetzung zur Steuerung der DRGs. In Leistungsmanagement im Krankenhaus: G-DRGS; Vetter, U., Hofmann, L., Eds.; Springer: Berlin/Heidelberg, Germany, 2005; pp. 117–129. [Google Scholar]
  13. Schöffski, O.; Graf von der Schulenburg, J.-M. Gesundheitsökonomische Evaluationen (4. Auflage Ausg.); Springer: Berlin/Heidelberg, Germany, 2012. [Google Scholar]
  14. Attigah, N.; Demirel, S.; Hakimi, M.; Bruijnen, H.; Schöffski, O.; Müller, A.; Geis, U.; Böckler, D. Hybridoperationssaal vs. konventioneller Operationssaal: Betriebswirtschaftliche Gegenüberstellung in der Gefäßchirurgie am Beispiel der endovaskulären Aneurysmachirugie. Chirurg 2017, 88, 587–594. [Google Scholar] [CrossRef] [PubMed]
  15. Kothe-Zimmermann, H. Prozesskostenrechnung und Prozessoptimierung im Krankenhaus (1. Auflage Ausg.); W. Kohlhammer: Stuttart, Germany, 2006. [Google Scholar]
  16. Cerha, O.; Kirschner, S.; Günther, K.-P.; Lützner, J.J.D.O. Kostenanalyse zu Navigation in der Knieendoprothetik. Orthopädie 2009, 38, 1235–1240. [Google Scholar] [CrossRef]
  17. Strauß, G.; Limpert, E.; Strauss, M.; Hofer, M.; Dittrich, E.; Nowatschin, S.; Lüth, T. Untersuchung zur Effizienz eines Navigationssystems für die HNO-Chirurgie. Laryngorhinootologie 2009, 88, 776–781. [Google Scholar] [CrossRef]
  18. Mueller, S.; Caversaccio, M. Outcome of computer-assisted surgery in patients with chronic rhinosinusitis. J. Laryngol. Otol. 2010, 124, 500–504. [Google Scholar] [CrossRef] [Green Version]
  19. Giotakis, A.; Kral, F.; Freysinger, W.; Markart, S.; Riechelmann, H. Missed paranasal sinus compartments in sinus surgery with and without image-guidance systems: A pilot feasibility study. Int. J. Comput. Assist. Radiol. Surg. 2019, 14, 895–902. [Google Scholar] [CrossRef] [PubMed]
  20. Hepworth, E.; Bucknor, M.; Patel, A.; Vaughan, W.C. Nationwide survey on the use of image-guided functional endoscopic sinus surgery. Otolaryngol. Head Neck. Surg. 2006, 135, 68–73. [Google Scholar] [CrossRef]
  21. Rosen, M.; Saigal, K.; Evans, J.; Keane, W.M. A review of the endoscopic approach to the pituitary through the sphenoid sinus. Curr. Opin. Otolaryngol. Head Neck Surg. 2006, 14, 6–13. [Google Scholar] [CrossRef] [PubMed]
  22. Weber, R. Aktueller Stand der endonasalen Nasennebenhöhlenchirurgie. Laryngorhinootologie 2015, 94 (Suppl. 1), S64–S142. [Google Scholar] [CrossRef] [PubMed]
  23. Gibbons, M.; Gunn, M.; Niwas, S.; Sillers, M.J. Cost analysis of computer-aided endoscopic sinus surgery. Am. J. Rhinol. Mar.-Apr. 2001, 15, 71–75. [Google Scholar] [CrossRef] [PubMed]
  24. Metson, R.; Consenza, M.; Cunningham, M.; Randolph, G.W. Physician experience with an optical image guidance system for sinus surgery. Laryngoscope. 2000, 110, 972–976. [Google Scholar] [CrossRef] [PubMed]
  25. Caversaccio, M.; Bächler, R.; Lädrach, K.; Schroth, G.; Nolte, L.P.; Häusler, R. Frameless computer-aided surgery system for revision endoscopic sinus surgery. Otolaryngol. Head Neck Surg. 2000, 122, 808–813. [Google Scholar] [CrossRef]
  26. Sedlmaier, B.; Schleich, A.; Ohnesorge, B. Das NEN-HNO-Navigationsystem-erste klinische Anwendung. HNO 2001, 49, 523–529. [Google Scholar] [CrossRef]
  27. Kahn, M.; Ecke, U.; Mann, W. Der Einsatz eines optischen Navigationssystems in der Nasennebenhöhlenchirurgie. HNO 2003, 51, 209–215. [Google Scholar] [CrossRef]
  28. Sunkaraneni, V.; Yeh, D.; Qian, H.; Javer, A.R. Computer or not? Use of image guidance during endoscopic sinus surgery for chronic rhinosinusitis at St Paul’s Hospital, Vancouver, and meta-analysis. J. Laryngol. Otol. 2013, 127, 368–377. [Google Scholar] [CrossRef]
  29. Casiano, R.; Numa, W. Efficacy of computed tomographic image-guided endoscopic sinus surgery in residency training programs. Laryngoscope 2000, 110, 1277–1282. [Google Scholar] [CrossRef]
  30. Sugino, T.; Nakamura, R.; Kuboki, A.; Honda, O.; Yamamoto, M.; Ohtori, N. Comparative analysis of surgical processes for image-guided endoscopic sinus surgery. Int. J. Comput. Assist. Radiol. Surg. 2019, 1, 93–104. [Google Scholar] [CrossRef] [PubMed]
  31. Fried, M.; Moahrir, V.; Shin, J.; Taylor-Becker, M.; Morrison, P. Comparison of endoscopic sinus surgery with and without image guidance. Am. J. Rhinol. Jul.-Aug. 2002, 16, 193–197. [Google Scholar] [CrossRef]
  32. Dalgorf, D.; Sacks, R.; Wormald, P.-J.; Naidoo, Y.; Panizza, B.; Uren, B.; Brown, C.; Curotta, J.; Snidvongs, K.; Harvey, R.J. Image-guided surgery influences perioperative morbidity from endoscopic sinus surgery: A systematic review and meta-analysis. Otolaryngol. Head Neck Surg. 2013, 149, 17–29. [Google Scholar] [CrossRef] [PubMed]
Figure 1. (a) Fiagon navigation system. (b) Fiagon navigation instruments for sinus surgery. (c) Output screen view with endoscopy image as well as sagittal, coronal, and axial CT sectional views [7,8].
Applsci 11 08616 g001aApplsci 11 08616 g001b
Figure 2. Age distribution of patients.
Applsci 11 08616 g002
Figure 3. Frequency distribution of navigation device usage times.
Applsci 11 08616 g003
Figure 4. Frequency distribution incision–suture time (IST), both absolute and as a percentage.
Applsci 11 08616 g004
Figure 5. Mean durations over 5 years, with standard deviation (SD) and interquartile range (IQR).
Applsci 11 08616 g005
Figure 6. Mean time without and with navigation with standard deviation (SD); (JNR: Junior Doctor; SP: Specialist; CON: Consultant; HD: Head of Department).
Applsci 11 08616 g006
Figure 7. Median time without and with navigation, with interquartile range (IQR).
Applsci 11 08616 g007
Table 1. Characterization of the total sample.
Period01.01.2012–31.12.2016
TotalGroup without NavigationGroup with Navigation
Number of cases (n)1158829329
female (n)448339109
female (%)38.69%40.89%33.13%
male (n)710490220
male (%)61.31%59.11%66.87%
Mean age (a)48.9748.5550.04
Age: min/max8/898/878/89
Table 2. Case numbers by years.
20122013201420152016TotalMean (n/Year)
With navigation15387611189329
Without navigation217174157137144829
Total2322122332482081158227
Table 3. Case numbers, based on the seniority of the doctors.
PositionNumber of PhysiciansNumber of Operations
with Navigation
Number of Operations
without Navigation
Total
Junior Doctors2234136170
Specialists833179212
Consultants1579363442
Head of Department1183151334
Total463298291158
Table 4. Cost rates for ENT surgery and anesthesia in the ENT clinic. (CC grp: cost center group; CT grp: cost-type group; ActType: activity type; Avg Tariff: average tariff; IST: incision-suture time; Wt: weighted; MA: medical activity; FA: functional activity; SUT: set-up time; ANA: Anesthesia).
CC
grp
CT
grp
Cost-Type Group
Long Name
ActTypeAvgTariffComments
ENT Surgery41Personnel costs: medical activitySNZ_GW_ADEUR 1.19/minWeighted incision–suture time incl. set-up time physician
43Personnel costs:
med. tech. activity/functional activity
SNZ_GW_FDEUR 0.83/minWeighted incision–suture time incl. set-up time functional activity
47Personnel and material costs: med. infrastructureSNZ_RZEUR 1.37/minIncision–suture time incl. set-up time
48Personnel and material costs: non-med. infrastructureSNZ_RZEUR 1.31/minIncision–suture time incl. set-up time
44aMaterial costs: medication (indirect costs)SNZ_RZEUR 0.05/minIncision–suture time incl. set-up time
46aMaterial costs: other med. needs (indirect costs)SNZ_RZEUR 0.83/minIncision–suture time incl. set-up time
Anesthesia51Personnel costs: medical activityNRK_ADEUR 0.98/minWeighted anesthesia time incl. set-up time physician
53Personnel costs:
med. tech. activity/functional activity
NRK_FDEUR 0.74/minWeighted anesthesia time incl. set-up time functional activity
54aMaterial costs: medication (indirect costs)NRKEUR 0.12/minAnesthesia time
56aMaterial costs: other med. need (indirect costs)NRKEUR 0.58/minAnesthesia time
57Personnel and material costs: med. infrastructureNRKEUR 0.32/minAnesthesia time
58Personnel and material costs: non-med. infrastructureNRKEUR 0.47/minAnesthesia time
Table 5. Results—navigation device log files.
MeanMedianSDInterquartile RangeMinimumMaximum
Time (min)7.506.445.036.570.6029.67
Table 6. Overview of results. (JNR: Junior Doctor; SP: Specialist; CON: Consultant; HD: Head of Department; Number: number of operations performed by each rank of physician; Median: median time; SD: standard deviation; highlighted in green: shorter mean operating time; highlighted in red: longer mean operating time).
Without NavigationWith Navigation
NumberMean Operating Time (Min)Median
(Min)
SDNumberMean Operating Time (Min)Median (Min)SD
Junior Doctors13692.9687.0040.8134121.21110.0049.20
JNR1884.258718.58389.33949.87
JNR2480.7510245.19
JNR3878.757231.526162.1714169.36
JNR4276.007646.67
JNR519101.059637.201110.00100
JNR6484.2591.537.99157.0057
JNR7394.67908.08
JNR8167.0067
JNR9586.407649.23
JNR106118.6711161.05
JNR11778.867844.08288.5088.538.89
JNR12482.5010433.042100.50100.54.95
JNR13399.338038.80
JNR14572.806135.441206.00206
JNR15995.0087.538.88
JNR16146.0046
JNR1713102.9211646.6514129.64117.534.49
JNR181598.0093.543.04283.008311.31
JNR194144.0012562.42
JNR202117.0011738.18138.0038
JNR21870.385833.331110.00110
JNR22597.209744.72
Specialists17999.0593.0050.5233113.12114.0042.40
SP126101.4610746.545132.6016860.64
SP234114.3210556.497127.7112236.07
SP328111.8611360.0514106.0711234.10
SP41865.787721.96
SP518123.1113143.531175.00161.5
SP63977.447443.43259.5059.538.89
SP716103.31101.539.87499.2510236.34
Consultants36376.0167.0042.527975.3772.0034.70
CON11184.557728.57140.0040
CON23468.7659.536.40275.007522.63
CON328103.6110345.19181.0081
CON4148.0048
CON56116.6711852.37
CON617106.41104.553.71150.0050
CON75983.2281.538.662392.8710433.65
CON81483.577423.44
CON91752.2445.527.382870.186933.46
CON106467.8161.537.09368.003272.99
CON112651.275025.68862.258029.79
CON122371.968145.41158.0058
CON132161.816328.56659.3354.526.69
CON144277.866755.92583.205933.17
Head of Department15155.3249.0029.1018360.2957.0028.52
Overall result82980.0072.0044.5932975.5069.0040.55
Table 7. Operations performed, reduced to those physicians most frequently operating.
Without NavigationWith Navigation
NumberMean Operating TimeMedianSDNumberMean Operating TimeMedianSD
Junior Doctors2193.7180.0042.4120139.40117.0048.10
JNR3878.757231.526162.1714169.36
JNR1713102.9211646.6514129.64117.534.49
Specialists62113.21109.0057.6521113.29114.0035.43
SP234114.3210556.497127.71122.0036.07
SP328111.8611360.0514106.0711234.10
Consultants7676.2967.5038.535180.4180.0035.11
CON75983.2281.538.662392.8710433.65
CON91752.2445.527.382870.186933.46
Head of Department15155.3249.0029.1018360.2957.0028.52
Overall result31074.6459.0045.2827573.8269.0039.76
Table 8. Results—cost rate determination.
Tariff (EUR/Min)
ENT SurgeryCCGrpCTGrpCTGrp
Long Name
20122013201420152016MeanSDMean WeightingCalculated Tariff (EUR/Min)
41Personnel costs: medical activity1.211.011.221.121.191.150.0711.71.91
43Personnel costs: med. tech.
activity/functional activity
0.860.910.890.950.830.890.0392.42.15
47Personnel and material costs: med. infrastructure1.011.121.071.091.371.130.1131.01.13
48Personnel and material costs: non-med. infrastructure1.151.181.271.161.301.210.0571.01.21
44aMaterial costs: medication (indirect costs)0.070.060.060.050.050.060.0061.00.06
46aMaterial costs: other med.
need (indirect costs)
0.870.811.090.600.830.840.1431.00.84
Anesthesia51Personnel costs: medical activity1.181.131.111.120.981.100.0621.31.44
53Personnel costs: med. tech.
activity/functional activity
0.790.810.840.850.740.810.0361.81.45
57Personnel and material costs: med. infrastructure0.380.380.370.390.320.370.0251.00.37
58Personnel and material costs: non-med. infrastructure0.560.560.510.420.470.510.0481.00.51
54aMaterial costs: medication (indirect costs)0.130.120.120.130.120.120.0061.00.12
56aMaterial costs: other med.
need (indirect costs)
0.590.600.600.640.580.600.0191.00.60
Total:11.79
Table 9. Cost accounting.
Number of Operations/Year:227
Navigated (Min)Non-Navigated (Min)Difference (Min)Cost Rate (EUR/Min)Per Operation
(EUR)
Per Year (EUR)
Case 16972−311.79−5.4−8029.0
Case 2695910117.926,763.3
Case 35749894.321,410.6
Publisher’s Note: MDPI stays neutral with regard to jurisdictional claims in published maps and institutional affiliations.

