Article

Investigation into the Antioxidant Activity of Standardized Plant Extracts with Pharmaceutical Potential

by
Elena Moroșan
1,†,
Magdalena Mititelu
1,†,
Doina Drăgănescu
2,
Dumitru Lupuliasa
3,
Emma Adriana Ozon
3,*,
Oana Karampelas
3,*,
Cerasela Elena Gîrd
4,
Corina Aramă
5,
Marilena Viorica Hovaneț
6,
Adina Magdalena Musuc
7,* and
Ana Corina Ioniță
1
1
Department of Clinical Laboratory and Food Safety, Faculty of Pharmacy, Carol Davila University of Medicine and Pharmacy, 6 Traian Vuia Street, 020945 Bucharest, Romania
2
Department of Pharmaceutical Physics and Informatics, Faculty of Pharmacy, Carol Davila University of Medicine and Pharmacy, 6 Traian Vuia Street, 020945 Bucharest, Romania
3
Department of Pharmaceutical Technology and Biopharmacy, Faculty of Pharmacy, Carol Davila University of Medicine and Pharmacy, 6 Traian Vuia Street, 020945 Bucharest, Romania
4
Department of Pharmacognosy, Phytochemistry, Phytotherapy, Faculty of Pharmacy, Carol Davila University of Medicine and Pharmacy, 6 Traian Vuia Street, 020945 Bucharest, Romania
5
Department of Analytical Chemistry, Faculty of Pharmacy, Carol Davila University of Medicine and Pharmacy, 6 Traian Vuia Street, 020945 Bucharest, Romania
6
Department of Pharmaceutical Botany and Cell Biology, Faculty of Pharmacy, Carol Davila University of Medicine and Pharmacy, 6 Traian Vuia Street, 020945 Bucharest, Romania
7
“Ilie Murgulescu” Institute of Physical Chemistry, 202 Spl. Independentei, 060021 Bucharest, Romania
*
Authors to whom correspondence should be addressed.
These authors contributed equally to this work.
Appl. Sci. 2021, 11(18), 8685; https://doi.org/10.3390/app11188685 (registering DOI)
Submission received: 19 August 2021 / Revised: 15 September 2021 / Accepted: 16 September 2021 / Published: 17 September 2021

Abstract

:
Given the important role of antioxidants in the cellular degeneration process, as well as the increased interest in recent years related to the use of natural antioxidants in therapy, the present study aims to investigate the antioxidant activity of a new pharmaceutical product containing natural antioxidants extracted from plant raw materials. In a first step, the product conventionally named “CILTAG”, containing a mixture in equal proportions of 10% hydroalcoholic extractive solutions of dried plant raw materials from Medicaginis herba, Trifolii pratense flores, Ginkgo bilobae folium, Myrtilli fructus, and Cynosbati fructus, was obtained. In the second stage, the antioxidant activity of the hydroalcoholic extractive solutions included in the pharmaceutical product was tested by chemiluminescence and electrochemical methods and by the superoxide dismutase (SOD) method. The electrochemical determination of the antioxidant capacity of hydroalcoholic extractive solutions was based on a method that provides an indirect evaluation of the presumed antioxidant properties of some compounds using Trolox (6-hydroxy-2,5,7,8-tetramethylchroman-2-carboxylic acid), as a standard measurement. The experimental results indicate a significant antioxidant potential for both the analyzed plant extractive solutions that are part of CILTAG and the final product.

Graphical Abstract

1. Introduction

Oxidative stress can affect vital molecules in human cells, including DNA and proteins, which are responsible for many processes in the body [1,2,3]. In the human body, uncontrolled oxidation is commonly caused by highly reactive molecules known as free radicals [4,5]. Free radicals, produced either by normal cellular metabolism or as an effect of pollution and exposure to other external factors, are responsible for premature aging of the body and play a pathogenic role in cardiovascular and degenerative diseases (e.g., cataracts, Alzheimer’s disease, and cancer) [6,7]. Depending on the intensity, oxidative stress can occur intra or extracellularly. Intracellular oxidative stress can cause cell necrosis and marked cell disorganization, with catastrophic effects in the case of a cell that cannot reproduce. Extracellular oxidative stress is also cytotoxic [8,9].
The main antioxidants are vitamins A, C, and E, selenium, zinc, coenzyme Q10, beta-carotene, lycopene, lutein, and the enzymes superoxide dismutase (SOD) and glutathione peroxidase (GPx) [10,11,12].
Numerous clinical studies have shown that adequate intake of fruits and vegetables is an important part of a healthy diet and low intake of fruits and vegetables is a risk factor for chronic diseases such as cancer, coronary heart disease, stroke, and cataract formation [13,14]. Fruits and vegetables do not provide ready antioxidants to combat oxidative stress but stimulate the natural production of antioxidants and other substances with a protective role essential to the body’s biochemistry [15,16]. Fruits and vegetables are also known to be rich sources of antioxidants, and clinical studies have shown that people who include them in their diet regularly reduce the risk of developing certain conditions, such as cardiovascular disease, eye disease, and cancer [17,18,19,20].
Polyphenols, represented by flavones, flavanols, flavanones, isoflavones, anthocyanidols, catechins, and polyphenolcarboxylic acids, are recognized for their antioxidant action due to their polyphenolic structure. For example, flavones, by their reducing characteristic imprinted by hydroxylphenolic groups as well as by the properties of chelating metals, have antioxidant properties that are manifested by protecting tissues against free radicals and lipid peroxidation [21,22].
Regarding anthocyanins and their ability to modulate certain processes underlying the development of neurodegenerative diseases, some studies have evaluated their pharmacokinetics in the brain [23,24,25]. Related to the etiology of neurodegenerative diseases, one of the contributing factors to their installation is oxidative stress, which is responsible for the destruction of vital macromolecules, such as membrane lipids, proteins, and DNA, all of which lead to neuronal death. The main sources of oxidative stress in the brain are mitochondrial dysfunction and loss of endogenous free radical defense systems. Anthocyanins, along with other flavonoids, are well-known for their antioxidant action, and their ability to destroy toxic free radicals underlies their neuroprotective effects [26]. An in vitro study was performed on a PC12 cell line treated with hydrogen peroxide to induce oxidative stress in order to evaluate the neuroprotective effect of strawberries, a fruit rich in anthocyanins, whose antioxidant capacity has also been compared to that of bananas and oranges. Strawberries showed the highest neuroprotective activity, most likely due to the high anthocyanin content [27]. Another study evaluated the antioxidant activity of the frozen pulp of acai berries in the brains of rats given hydrogen peroxide [28]. Pre-treatment with acai considerably reduced the destruction of lipids and proteins induced by hydrogen peroxide. Additionally, in the presence of acai, the activity of antioxidant enzymes was maintained at a basal level [28,29]. One research study evaluated the protective effects of an ethanoic extract of mulberry fruit (Morus alba L.) against chemically induced neurotoxicity (6-hydroxydopamine and 1-methyl-4-phenylpyridinium producing changes corresponding to Parkinson’s disease) [30]. Pre-treatment with mulberry extract of the SH-SY5Y cell line (derived from human neuroblastoma) or of a primary culture of murine dopaminergic neurons, protected cells from the effects of neurotoxins by its antioxidant and antiapoptotic action [30,31]. An additional study looked at the neuroprotective effects of anthocyanins extracted from black soybean based on a model of β-amyloid-induced neurodegeneration [32]. The extract was used to treat an HT22 cell line and was also injected intra-cerebroventrally into adult rats to induce neurotoxicity. Anthocyanin treatment performed for 12 h led to the restoration of cell viability, normalized membrane potentials and Ca2+ levels, and decreased neuronal death. Furthermore, anthocyanins reversed the effects of β-amyloid on the protein expression of mitochondrial apoptotic pathways, such as cytochrome-C, and Alzheimer’s disease-specific markers, such as tau proteins and β-secretase-1, a precursor of β-amyloid [32].
Other studies have shown that supplementing a diet with strawberries or blueberries, fruits rich in anthocyanins, led to a reversal of motor and cognitive disabilities specific to old age in rats [33].
Therefore, anthocyanins are a class of compounds with pleiotropic activity, and their ability to modulate several aspects of the installation and progression of neurodegenerative diseases makes them promising candidates in the auxiliary treatment of these pathologies [34]. Among the processes in which they occur are oxidative processes, calcium and protein homeostasis, neuro-inflammation, and apoptotic neural pathways. Moreover, the fact that they are frequently found in a normal diet confirms that their use is safe. However, in order to confirm the evidence obtained on cell lines and animal models, it is necessary to design in vivo studies to be performed on humans; however, currently their number is low [35].
Along with polyphenols, the following compounds are also recognized for their significant antioxidant action: terpenes (carotenoids), phytosterols, sulfur compounds, and a series of vitamins (E, C). Terpenes are carotenoids, compounds that capture singlet oxygen (1O2) in the human body [36,37]. Carotenes take over the extra electron of free radicals and turn into less-reactive radicals that gradually release energy stored in the form of heat with the restoration of carotenes [38]. Phytosterols inhibit lipid peroxidation and superoxide anion radical formation [39]. Sulfur compounds with antioxidant actions include glucosinolates, indoles, and allyl sulfides [40]. Vitamin C is known for its ability to reduce some reactive oxygen species, such as peroxides and superoxide anion radicals [41].
Based on these considerations, attention has been focused on researching those plant products that contain these types of active principles and that by association can induce a clearly superior antioxidant action [42,43,44,45,46].
The aim of the present study is to manufacture a new pharmaceutical product (conventionally named CILTAG) based on medicinal plants that contains high amounts of antioxidants and to prove that their association leads to increased antioxidant activity. Hydroalcoholic extractive solutions of the plant raw materials were evaluated by qualitative and quantitative analyses to establish their chemical composition. For the CILTAG product, the phytochemical profile was determined, and the in vitro antioxidant activity was investigated in both the ingredients and the final product.

2. Materials and Methods

2.1. Materials

The harvesting of plant products was done (i) during the flowering period for herba and flores and (ii) in maturity for folium and fructus, both from cultivated and spontaneous flora. Thus, Medicaginis herba, Trifolii pratense flores, Myrtilii fructus, and Cynosbati fructus were collected in August–September from spontaneous flora from Arges County, Romania, and Ginkgo bilobae folium was harvested from cultivated flora from Bucharest Botanical Garden, Romania, in June. Their drying was carried out naturally.
The ethylic and methylic alcohols, all used reagents, and the reference substances were of analytical purity. They were provided by Fluka® Analytical, Switzerland and Sigma-Aldrich, Germany. The utilized water was obtained by ultra-purification using a Millipore system. The ascorbic acid, as a reference substance, was provided by BASF- Germany. The methylic alcohol for HPLC (H3PO4, 89% p.a.) was from Merck. The Trolox and 2,2-dyphenyl-1-pycrylhydrazil (DPPH) were provided by Sigma.

2.2. Methods

In the first part of the study, the pre-formulation studies aimed to establish the properties of the plant raw materials by identifying and dosing the contained active ingredients.

2.2.1. Qualitative Phytochemical Screening

The dried raw plant materials were subjected to repeated hot ethanol extraction. The obtained alcoholic extracts were then concentrated to a certain volume. The active principles of the extracts were identified by means of specific reactions. Qualitative chemical analysis was performed on the initial alcoholic extractive solutions [47,48], with particular emphasis on such methods as reduction with Fehling’s and Tollens’ reagents and the use of the Molisch reaction and Styassny’s reagent.
Identification of Reducing Compounds [47]:
(i).
The reaction with Fehling’s reagent was based on the ability of these compounds to reduce a solution of Fehling’s reagent to copper oxide in a strongly alkaline medium. A solution of 1 mL of alcoholic extract diluted with 2 mL of distilled water was treated with 1 mL of a mixture of Fehling’s solutions and heated for 30 min. The appearance of a red-brick precipitate of copper oxide indicates the presence of reducing compounds.
(ii).
Reaction with Tollens’ reagent: 3–4 drops of Tollens’ reagent were added to 1 mL of alcoholic extract solution and heated. We then observed the deposition of the silver mirror on the test tube.
Identification of Carbohydrates
The carbohydrates were identified using the Molisch reaction. A total of 2 mL of alcoholic extract solution was concentrated to dryness. Then, 1–2 drops of concentrated sulfuric acid and 3–4 drops of 1% thymol were added to the residue. The presence of a red-orange color indicated the presence of such compounds.
Identification of Tannins [49]
According to the chemical nature of tannins and their classification into gallic tannins and catechin tannins [49], the following methods of identification were used:
(i).
Identification with 1% ferric chloride: 1 mL of alcoholic extract solution was diluted with 2 mL of distilled water and 2–3 drops of ferric chloride were added until a green (for the catechin tannin) or blue (for the gallic tannin) color was observed.
(ii).
Identification with Styassny’s reagent (a hydrochloric formaldehyde solution formed by formaldehyde and concentrated hydrochloric acid in a molar ratio of 2:1): 5 mL of alcoholic extract solution was treated with 4–5 mL of Styassny’s reagent; then, the solution was heated for at least 30 min. The appearance of a red-brown precipitate indicates the presence of the catechin tannin.
(iii).
The final step was the separation of the catechin tannin from the gallic tannin.
(iv).
For the blue-black color that indicates the presence of the catechin tannin, 10 mL of extract solution was treated with 10 mL of Styassny’s reagent then heated for at least 30 min. The condensed catechin tannin was separated by filtration. The solution was neutralized with Na2CO3. When the blue color appeared, 1–2 drops of Styassny’s reagent were added. The blue color was a signal of the presence of gallic tannins.
Identification of Flavonosides
Flavonosides were identified directly in the alcoholic solution if they were not mixed with anthocyanosides or were identified after hydrolysis [49].
(i).
The Shibata reaction (cyanidol reaction): under the reducing action of nascent hydrogen, the pyranic nucleus undergoes a reduction of the ketone group with the redistribution of electrons inside the nucleus and the formation of a pyrrole salt. A 3–5 mL solution was evaporated to a residue. The residue was dissolved in 1–2 mL of hot methanol. The solution was brought to a test tube, and fragments of metallic magnesium and 0.5 mL of concentrated hydrochloric acid were added. Within 5 min, an orange (flavones), a red (flavonols), and a red-purple (flavanones) color appeared.
(ii).
Chelation reaction with salts of bi- and trivalent metals: 3–5 mL of solution was evaporated to dryness. The residue was dissolved in 1–3 mL of alcohol and then 1–2 mL of aluminum chloride was added. The intensification of the yellow coloration was observed.
(iii).
Formation of phenoxides: 3–5 mL of solution was evaporated. The residue was dissolved in methanol and then 1–2 mL of sodium hydroxide was added. The intensification of the yellow coloration was observed.
Identification of Coumarins
The identification of coumarins was based on their ability to emit radiation in UV light and the formation of purple salts with hydroxycinnamic acids.
(i).
Determination of fluorescence in UV light: coumarins in UV light have a blue-green or purple fluorescence. In alkaline aqueous solution (using 0.1 M NaOH), salts of o-hydroxycinnamic acid or its derivatives with an intensification of fluorescence were formed. A total of 3–5 mL of solution was evaporated in a sand bath. The residue was dispersed in 3–4 mL of hot water. The aqueous solution was supplied in two tubes. The contents of one tube were treated with 4–5 drops of 0.1 M NaOH (Merck). Upon examination in UV light, coumarins showed a blue-green or purple fluorescence that was more intense in an alkaline environment.
(ii).
Transformation into hydroxycinnamic acids (the Feigl–Anger–Frehden reaction): in the presence of a hydroxyl amine, in an alkaline medium, hydroxycinnamic acids were formed and their iron (III) salts were colored purple. We then added 4–5 mL of solution, 4–5 drops of hydrochloric hydroxylamine, and 4–5 mL of NaOH (at pH = 9–10) to a porcelain capsule. The mixture was heated to a residue, cooled, and acidified with 1 M HCl solution (at pH = 3–4). Upon adding 3–4 drops of ferric chloride (III), a violet coloration was obtained.
Identification of Anthocyanosides
The identification of anthocyanosides was based on the ability of both the heteroside and the aglycone to present different colors depending on the pH of the solution. At an acidic pH, anthocyanosides were colored in red (due to the presence of oxonium ions); at a neutral pH, anthocyanosides were colored in blue (due to the carbon ion); at a low alkaline pH, anthocyanosides were colored in blue (due to the presence of the phenoxonium ion); and at a strong alkaline pH, anthocyanosides were colored in yellow (due to the formation of chalcone by breakage of the pyran).
A total of 5–6 mL of alcoholic extract solution was treated with 10% sodium hydroxide following the change in the color, which demonstrated the presence of anthocyanosides.
Identification of ODPs
Orthodihydroxyphenols (ODPs) are phenolic compounds of type C6-C3 and represented by caffeic acid or monocafeylquinic esters (chlorogenic acid and its isomers) and dicafeylquinic esters (cinarine). These compounds are soluble in polar solvents, and they have marked reducing properties. Their identification was based on their reducing properties, on obtaining nitrosoderivatives with the help of aromatic diazo compounds (the coupling compounds obtained are red or orange), and on the formation of red nitrosoderivatives [24,45]. The phenolic compounds form para-nitrosoderivatives with nitric acid. They tautomerize spontaneously, producing the respective red oximes that are soluble in alkaline solutions. A total of 1 mL of test solution was treated with 1 mL of 0.1 M hydrochloric acid, 1 mL of Arnow’s reagent (sodium nitrite), and 1 mL of 1 N sodium hydroxide and then stirred. A red coloration appeared.

2.2.2. Quantitative Phytochemical Screening

Flavones, ODPs, catechin tannins, anthocyanosides, and proanthocyanosides were quantitatively determined. The determinations were repeated three times on different samples.
Quantitative Determination of Flavonoids
Flavones were extracted in hydrophilic solvents and then treated with aluminum chloride to form internal complexes with an intense yellow colorimetric coloration.
A total of 1 g of dried and pulverized vegetable product was treated with 100 mL of 70% methyl alcohol and refluxed for 30 min. The solution (denoted extraction solution A) was cooled and filtered. A total of 10 mL of extraction solution A was diluted with methanol to 25 mL. To 5 mL of filtrate were added 5 mL of 10% sodium acetate, 3 mL of 2.5% aluminum chloride, and methanol to 25 mL. After 45 min, the absorbance of the chelate at λ = 427 nm was determined using as a compensating liquid a solution obtained under the same conditions as the sample solution (5 mL of filtered solution, 8 mL of water, and methanol to 25 mL). The flavonoid concentration in the samples was calculated using a standard curve established on 1 mL, 2 mL, 3 mL, and 4 mL standard rutoside solutions (Table 1). The results are expressed as the rutoside (%) content of the dried sample.
Quantitative Determination of ODPs
The amount of phenolic derivative was determined based on the ability of caffeic acid to form nitrosoderivatives with nitric acid. Nitrosoderivatives are compounds that spontaneously isomerize to isonitrosoderivatives or oximes. Due to their weak acidic character, they dissolve in alkaline solutions to give red colors.
A total of 1 g of crushed vegetable product was refluxed twice with 10 mL of 50% methanol. The combined solutions were filtered and, after cooling, up to 100 mL of 50% methanol was added. We added 1 mL of 0.5 N HCl, 1 mL of Arnow’s reagent, and 1 mL of 1 N NaOH to 1 mL of solution and then stirred it. After 15 min, the absorbance of the sample at λ = 510 nm was determined. The control sample was prepared by adding to the extraction solution 1 mL of 0.5 N HCl, 1 mL of 1 N NaOH, and 50% methanol to 10 mL.
The calculation of the amount of polyphenolic derivative was performed in relation to a standard curve established on caffeic acid (Table 1).
Quantitative Determination of Tannins
The determination of tannins was based on the ability of catechin tannins to precipitate with Styassny’s reagent (formaldehyde and concentrated hydrochloric acid in a 2:1 molar ratio). The precipitate was weighed after filtration and drying [49,50].
A total of 1 g of crushed vegetable product was extracted repeatedly with hot distilled water to 10 mL. A total of 5 mL of Styassny’s reagent was added. The solution was heated at 90 °C for 30 min, after which it was cooled and then filtered. The precipitate was kept for 10–15 min in the heated oven. After drying, the precipitate was weighed.
Quantitative Determination of Anthocyanins
A 0.15 g sample of dried raw plant materials was treated with a 50 mL mixture of 95% v/v. ethyl alcohol and 1.5 N hydrochloric acid (85:15) and kept at 4 °C for 24 h, after which it was filtered. The absorbances at 535 nm were measured in comparison with a 1% cyanidol solution.
The anthocyanin content was calculated according to Equation (1):
mg %   anthocyanins   = A × d 98.2
where A is the absorbance of the solution at 535 nm and d is the dilution factor (50). The absorbance value in the given solvent was measured for a concentration of 1% cyanidol.
Quantitative Determination of Proanthocyanins
A 0.1 g sample of dried vegetable product was treated with 50 mL of 2 N HCl and heated for 40 min. After cooling and filtering, the solution was extracted twice with 20–25 mL of n-butyl alcohol. The absorbance at 550 nm was immediately determined.
The amount of proanthocyanin was calculated according to Equation (2):
mg   proanthocyanins = 6 × A e × M × V P
where 6 is the correction coefficient of the efficiency of transformation of proanthocyanins into anthocyanins, A is the absorbance of the sample at 550 nm, e is the molecular absorbance of the compound under consideration (347 nm), M is the molecular weight of the compound under consideration (306 g/mol), V is the volume of the solution, and P is the mass of the analyzed sample (g).

2.2.3. Determination of Moisture

To ensure the preservation of plant products, a certain degree of humidity must be maintained within the imposed limits. The amount of water in plant products is influenced by the environment, their chemical composition, and the degree of drying.
The moisture content was determined by drying a 5 g sample of dried vegetable product, placed in a 5 mm layer, in the oven at 100–105 °C for 4 h. The sample was then cooled in a desiccator and weighed. Subsequently, it was dried for a further 60 min then cooled in the desiccator and weighed to a constant mass.

2.2.4. Determination of the Chemical Constituents According to Their Solubility

The chemical constituents of the plant product were solubilized under different conditions in a certain solvent (alcohol and water). A 5 g sample of crushed vegetable product was treated with 100 g of the intended solvent (ethyl alcohol 95% (v/v), water), stirred vigorously several times, left to soak for 23 h, stirred again for 1 h and filtered, and then the initial portions of the filtrate were removed. A 20 g sample of the filtrate was evaporated to dryness in a water bath in a weighing vial (previously brought to a constant mass by repeated holding in the oven and weighing). The weighing ampoule was dried in an oven at 105 °C for 3 h, cooled in a desiccator, and weighed. The residue was soluble and was referred to 100 g of plant product.

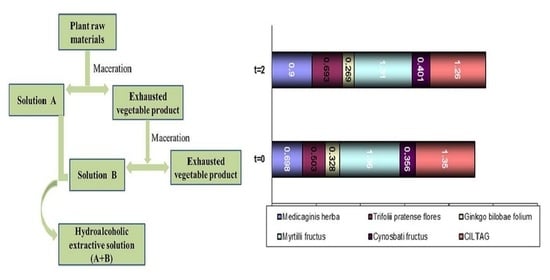
2.2.5. Obtaining the “CILTAG” Hydroalcoholic Extract

After establishing the plant extracts’ characteristics, a new pharmaceutical product, conventionally named “CILTAG”, was prepared. The compound contains a mixture in equal parts of 10% hydroalcoholic extracts of Medicaginis herba, Trifolii pratense flores, Ginkgo bilobae folium, Myrtilli fructus, and Cynosbati fructus. The pharmaceutical form of the hydroalcoholic extract was chosen due to its high stability over time. As the performance of bioactive compounds from plant materials depends on the extraction process, it is crucial to select a proper extraction method by considering different parameters with an important influence on the process: the mean particle diameter and the pre-extraction wetting of the vegetable product, the nature of the extraction solvent, the vegetable product to solvent ratio, the stirring time, the extraction time, and the temperature.
The raw plant materials were crushed and passed through a no. 4 mesh size sieve (4.75 mm). As mixed mucilage-type polyholosides were identified in the aqueous extraction solution, they were first precipitated in the plant cell by wetting the plant products with absolute alcohol.
Based on the solubility of the active compounds contained in the studied plant products, 50% ethanol (v/v) as an extraction solvent (named the menstrum) and a 1:10 vegetable product to solvent ratio were chosen. The double maceration method was selected.
The dried and crushed raw plant materials were successively treated with various amounts of the total volume of menstruum and remained in a closed container for a well-established period of time. The extraction solution (A) was separated, and the pressed plant product was treated with the next portion of solvent, resulting in another extracted solution (B). The extraction fractions (A and B) were finally reunited.
The vegetable product was placed with the menstrum in a closed vessel for seven days at 20 °C and protected from light. During this period, the samples were shaken daily 3–4 times. After 7 days, the liquid was strained then filtered and the solid residue (the marc) was pressed. The obtained hydroalcoholic extract was kept in the refrigerator. The partially depleted vegetable product was subjected to a new depletion after 4 days, following the same procedure. The final hydroalcoholic extract was combined with the previously obtained one.
The technological process is summarized in Figure 1.

2.2.6. Testing of the Hydroalcoholic Extracts Included in the CILTAG Product

The following parameters on the extracts were tested: the organoleptical characteristics, the composition (by HPLC), and the quantitative determination of ascorbic acid (by HPLC).

The Compositional Analysis

To determine the compounds in the solubilized phyto-complexes from the hydroalcoholic solution, HPLC was performed on each solution. In the case of the Cynosbati fructus extractive solution, from the HPLC method we could not identify the chromatographic peaks. For this reason, the constituents were determined by a UV-vis spectrophotometric method using a Cary 50 UV-Vis spectrophotometer (Varian Inc., California, USA). The determinations were made in quartz cuvettes (with a 10 mm transmitted path length), the hydroacloholic Cynosbati fructus extractive solution was diluted to 1:10 (v//v) with 95% (v/v) ethanol (Fluka® Analytical, Switzerland), and the spectra were registered in the domain of λ = 220–500 nm.
The extractive hydroalcoholic solutions of Medicaginis herba, Trifolii pratense flores, Ginkgo bilobae folium, Myrtilli fructus, and Cynosbati fructus were obtained by dissolving 4 mg of extract in ethanol and diluting the solution to 25 mL. The solutions were filtered through a 0.45 µm Millipore filter. The standard solution was prepared by dissolving 3 mg of each reference substance in ethanol and diluting the solution to 25 mL. As a stationary phase, a C18 (Discovery C18 250 × 4.6 mm i.d., 5 µm particles) column was used. The mobile phase was formed by Solution A (water and phosphoric acid (3 mL of 85% phosphoric acid was diluted with 1000 mL of water)) and Solution B (acetonitrile). The linear gradient from 0 to 100% is presented in Table S1 of the Supplementary Materials File.
A mobile phase flow rate of 1 mL/min was used, and the detection was registered at 335 nm. The spectra were obtained at wavelengths of 200–400 nm, the injection volume was 20 µL, and the temperature was the ambient one. The peaks were identified by a comparison of the retention times between samples and references.

The Quantitative Determination of Ascorbic Acid

The samples were analyzed immediately after preparation and at 60 days. The HPLC data cited in the literature suggest that the determination be made by reversed-phase HPLC [51]. A VARIAN ProStar HPLC system with a quaternary pump and a photodiode array detector (PDA) produced by Varian, Inc., USA was used. The parameters for the chromatographic system were an Inertsil 5 OD2-2 column, 250 x 4.6 min (i.d.) with 5 µm particles, mobile phase: A = 0.1% H3PO4 in water with CH3OH 1% and B = CH3OH, 95A:5B, the flow rate was 0.6 mL/min with isocratic elution at 25 °C, the separation period was 20 min, and the injection volume was 20 µL. The reagents used were ascorbic acid, a reference substance (BASF, Ludwigshafen, Germany), CH3OH for HPLC (Sigma-Aldrich, SA Darmstadt, Germany), H3PO4 89% p.a. (Sigma-Aldrich, SA Darmstadt, Germany), and ultrapure H2O. The used ascorbic acid standard solutions were Solvent A: 0.1% H3PO4 in water with CH3OH 1%; Solution A: 2 × 10⁻³ g/mL (0.1 g of ascorbic acid dissolved in solvent A to 50 mL); Solution E1: 2 × 10⁻⁵ g/mL (0.5 mL of solution A diluted with solvent A to 50 mL); Solution E2: 3 × 10⁻⁵ g/mL (0.75 mL of solution A diluted with solvent A to 50 mL); Solution E3: 4 × 10⁻⁵ g/mL (1.00 mL of solution A diluted with solvent A to 50 mL); Solution E4: 5 × 10⁻⁵ g/mL(1.25 mL of solution A diluted with solvent A to 50 mL); Solution E5: 6 × 10⁻⁵ g/mL (1.50 mL of solution A diluted with solvent A to 50 mL); and Solution E6: 8 × 10⁻⁵ g/mL (2.00 mL of solution A diluted with solvent A to 50 mL).
The sample solution was obtained by diluting 0.10 mL of CILTAG with 25 mL of solvent A.

2.2.7. Determination of Antioxidant Action

(1)
Determination of antioxidant action by chemiluminescence
The correlation between the characteristics of active principles for the studied plant products and their antioxidant activity (in the H2O2–luminol system) is useful for estimating the antioxidant capacity with potential use in the pharmaceutical industry [52,53].
For good functioning of the chemiluminescent system (a LH2 + H2O2 (luminol and hydrogen peroxide) system as a chemiluminescence -generating system for determining the oxidation capacity of biological molecules), it was important to establish the optimal measurement parameters of the system [54,55].
The parameters that characterize the chemiluminescence are the intensity, color, and speed of the chemiluminescence emission, the decrease in light intensity, and the polarization of light. Several factors must be considered, including the signal’s reproducibility, the amplitude and possible existence of inflection points, the maximum and minimum emission points, and areas of characteristic length.
From the reproducibility point of view, this means obtaining for the same reactions, at the same component concentrations, similar signals, both in terms of kinetics and intensity. Achieving this reproducibility depends on several factors, including the nature of the buffer used, the pH of the sample, the homogenization of the sample, the duration of the reaction, and the ambient temperature.
To determine the antioxidant activity, we used a TD 20/20 TUNER DESIGNES chemiluminometer (Turner BioSystems, California, USA) coupled to a computer equipped with 1.5 mL encapsulated glass vats, a luminol chemiluminescence-generating system, and hydrogen peroxide in TRIS-HCl buffer at a pH = 8.6 with a final volume of 1 mL.
An initial unstable compound resulted from the reaction using the chemiluminescence-generating system, but it was stabilized by the formation of a bi-anion and a transformation accompanied by the emission of a quantum of light with a maximum wavelength of 430 nm.
When an antioxidant molecule is introduced into this system, it causes a decrease in the intensity of the light signal by producing the consumption of free radicals. When the molecule is pro-oxidant, there is an increase in the number of free radicals in the system.
The behavior of some molecules, as well as comparisons between the pro- and antioxidant properties, can be analyzed when the chemiluminescence increases knowing that some diseases can be produced by reactive oxygen species and free radicals.
All measurements were made on three parallel samples, obtaining a relative spread of the results of up to 2–3% compared with the average value.
The recording of the chemiluminescent signal was done at 5 s and the results obtained are expressed in relative luminescence values in comparison with the standard values. It is important to vary the concentration of the solutions by using concentrations of 2 × 10⁻³ g%/mL.
In the study of the peroxidation behavior of the system, we determined: (i) the antioxidant activity (AA%); (ii) the speed of inhibition/amplification of the signal according to Equations (3) and (4):
%   AA   = I 0 I p I 0 × 100  
where I0 represents the intensity of the chemiluminescent signal of the control (luminol) at t = 5 s, and Ip represents the intensity of the chemiluminescent signal in the presence of the sample at t = 5 s; and (iii) the initial speed at different times according to the relation:
v   = I 5 t   [ S 1 ]  
where v represents the reaction speed expressed in time−1, I5 represents the intensity of the chemiluminescent signal after the first 5 s, and t represents the reaction time corresponding to the change in the signal intensity.
(2)
Determination of antioxidant action by the electrochemical method [56,57,58]
Voltametric studies were performed with a 273 A EG&G (potentiostat/galvanostat) electrochemical system (Princeton Applied Research/EG&G, USA) with a type KO264 three-electrode microcell with a total working volume of 3 to 15 mL. Millielectrodes (effective electrode area: 3.14E-2 cm2) of solid gold (Au) were used as working electrodes, depending on the electroactivity manifested by each compound investigated, with a Pt wire auxiliary electrode and a Ag/AgCl (3M KCl) reference electrode.
The used electrochemical techniques were cyclic voltammetry (CV), linear potential sweep voltammetry (LSV), and square wave voltammetry (SWV). The inert electrolyte was H2SO4 0.12 mol L−1 in methanol solution.
The used reagents were methyl alcohol, sulfuric acid, Trolox, and 2,2’-diphenyl-1-picrylhydrazyl (DPPH). They were of analytical purity and obtained from Sigma-Aldrich, Darmstadt, Germany.
All voltametric measurements were made at 25 °C in an inert atmosphere after deaeration of the analyzed solutions.
The Trolox stock solutions were 10−3 mol L−1 methanolic solutions freshly prepared and maintained at 4 °C and in the dark so as to avoid the formation of oxidative degradation compounds. The stock solutions of DPPH were 3 × 10⁻³ mol L−1 alcoholic solutions.
UV-VIS spectrometric determinations were performed using a JASCO V-530 spectrometer (JASCO INTERNATIONAL CO., LTD., Japan).
In the first step, a calibration curve was made for Trolox alone, without free radicals in the system, in the concentration range between 10−6 mol L−1 and 10−4 mol L−1 to ensure the accuracy of the method.
The square wave voltammetry (SWV) investigation technique and the Trolox peak response with a potential of +0.785 ± 0.015 V were used. The obtained calibration line (Figure S1 in the Supplementary Materials File), with a good correlation coefficient value (0.9698), defines a linear range of the response in two intervals between 3 × 10⁻⁶ mol L−1 and 1 × 10⁻⁴ mol L−1. The subsequent experimental step was the electroanalytical characterization of the free radical DPPH, which has a peak potential of around 0.915 ± 0.015 V and whose signal response is extremely sensitive to concentration (Figure S2 in the Supplementary Materials File).
Once the characteristic electroanalytical parameters of the compounds were established, the antioxidant capacity of Trolox was determined against the DPPH free radical. For this, the linear dependencies between the decrease in the current intensity of the DPPH peak and the increase in the Trolox concentration in the working cell were obtained and considered the calibration lines for the antioxidant activity.
A total of 5 mL of inert electrolyte and 0.12 M H2SO4 in CH3OH were deaerated for 4 min by purging Argon in the system; then, 1 mL of DPPH from the 10−3 M stock solution was introduced, again purging the Argon for 30 s. The corresponding DPPH voltammogram was registered, then volumes between 10 µL and 70 µL of the Trolox stock solution were added to the system in order to obtain the dependence between the decrease in the anodic peak current intensity of the DPPH and the Trolox concentration in the system. The corresponding voltammogram was displayed 2 min and 4 min after the addition of Trolox. The obtained lines are shown in Figure S3 in the Supplementary Materials File.
In Figure S3, it can be observed that for 2 min the sensitivity of the slope was satisfactory and, also, the correlation coefficient that was obtained for the linear dependence, which gives the equivalent value of the antioxidant capacity, was satisfactory. Values are the average of three determinations.
After obtaining the linear dependencies, the antioxidant capacity of the 10% hydroalcoholic extractive solutions of Medicaginis herba, Trifolii pratense flores, Ginkgo bilobae folium, Myrtilli fructus, and Cynosbati fructus and the CILTAG antioxidant preparation was determined.
(3)
Determination of antioxidant action by the superoxide dismutase (SOD) method
SOD is an enzyme that catalyzes the dismutation of superoxide radicals to hydrogen peroxide and molecular oxygen. To determine the superoxide dismutase (SOD)-like activity, a reaction system to produce (-O2) and an indicator substance to measure it are required. The production system (-O2) is a mixture of methylthioninium chloride–methylene blue (AM) and tetramethylenediamine (TMED), and the indicator substance is nitroblue tetrazolium (NBT). In the presence of (-O2), NBT is reduced to formazan, a colored compound whose maximum absorbance is 560 nm. Thus, the color intensity is directly proportional to the concentration of (-O2) in the reaction mixture. So, SOD and substances with SOD-like activity cause the consumption of (-O2) in the system and thus prevent the formation of formazan [59].
The hydroalcoholic extractive solutions of Medicaginis herba, Trifolii pratense flores, Ginkgo bilobae folium, Myrtilli fructus, and Cynosbati fructus and the antioxidant product (CILTAG) were tested for their antioxidant action. To ensure the presence of oxygen in the reaction mixture, the phosphate buffer used was previously purged with air for 20 min. Both the sample and the standard were placed for 15 min under a 17 W fluorescent lamp in an enclosed space and away from other light sources. All samples (including the control) were read at 560 nm after having previously been extracted in 2 mL of chloroform.
All used reagents were of analytical grade and obtained from Fluka® Analytical, Aesch, Switzerland.
The schemes shown in Table 2 were used. The ingredient quantities and the used reagents are also listed in Table 2.
A SOD unit was considered to be the amount of enzyme that reduces by 50% the amount of formazan formed in the control reaction [49]. SOD activity is expressed in units/mL of sample and was calculated considering the dilution of the sample.
The calculation was considered to be valid if the proportion of formazan reduced in the control reaction was 50%. This amount was defined as one unit of enzymatic activity and is expressed as unit/mg protein.

3. Results and Discussion

3.1. Preformulation Studies

3.1.1. Qualitative Phytochemical Screening

The results of the qualitative chemical analysis of the hydroalcoholic extractive solutions are presented in the Table 3.
All extractive solutions contain reducing compounds (which is explained by the presence of polyphenolic compounds) and carbohydrates. Although tannins were enclosed in all vegetable products, only in Medicaginis herba was the presence of mixed tannins detected, the separation being carried out based on the catechin tannin’s ability to condense in the presence of concentrated mineral acids.
To identify the flavones in Myrtilli fructus, Trifolium pratense flores, and Cynosbati fructus products, the separation of anthocyanins, which interfere with the reaction, was necessary. The separation was performed after the extractive solution’s hydrolysis and was based on the difference in the solubility of aglicans, namely: flavonic aglycones are solubilized in ether, while anthocyanin aglycones are solubilized in an acidic aqueous solution. The flavonic aglycones identified after the hydrolysis were:
-
flavones in the hydroalcoholic solutions of Medicaginis herba, Trifolii pratense flores, Ginkgo bilobae folium, and Cynosbati fructus; and
-
flavonols in the hydroalcoholic solution of Myrtilli fructus.
Anthocyanins were identified only in the hydroalcoholic solution obtained from Myrtili fructus, and proanthocyanins, compounds that in an acidic environment are transformed into colored anthocyanins, were identified in the solutions obtained from Trifolii pratense flores, Myrtili fructus, and Cynosbati fructus. Although the flowers of Medicago sativa are purple in color, the reactions for anthocyanines were negative due to the existence of these active principles only in flowers. For this reason, they can be found in very small quantities in the herba product (below the sensitivity limit of the used identification reactions).
In all hydroalcoholic extractive solutions, ODPs, compounds with antioxidant activity, were identified. The intensity of the reaction depends on the nature of the raw materials used to obtain the extract [43].

3.1.2. Quantitative Phytochemical Screening

The results of the quantitative determination of flavonoids, ODPs, tannins, anthocyanins, and proanthocyanins are presented in Table 4.
Based on Table 4, the following results were obtained: (a) the highest amount of flavones was identified in Ginkgo bilobae folium, but in all raw plant materials flavonoides were found in significant quantities; (b) ODP-type polyphenolic derivatives were more quantitatively marked in the Cynosbati fructus product; (c) no significant differences between products were observed in the content of catechin-type tannins, but the increased quantities of tannins along with flavones led to an increased antioxidant effect; and (d) the plant product Myrtilli fructus had a content of 0.483–0.504 g% of anthocyanins expressed in cyanidol.

3.1.3. Determination of Moisture and the Chemical Constituents according to Their Solubility

From the preliminary determinations, we could not differentiate the products under study (Table 4), but all of them had a moisture content that was in accordance with the imposed regulations.

3.2. CILTAG and Hydroalcoholic Extract Analysis

3.2.1. Organoleptic Characteristics

All solutions were clear, had different colors (from yellow to red), and had the characteristic taste and smell. The CILTAG was a clear, red solution with a distinctive smell.

3.2.2. The Compositional Analysis

Several bioactive compounds were separated from the Medicaginis herba, Trifolii pratense flores, Ginkgo bilobae folium, and Myrtilli fructus hydroalcoholic extractive solutions and are highlighted in Table 5.
From Table 5, it can be observed that the identified compounds were flavonoid derivatives and polyphenolcarboxylic acids, which, due to their structural characteristics, exhibit antioxidant activity.
The HPLC test was also conducted for the Cynosbati fructus extractive solution, but we could not identify the chromatographic peaks. By using the UV-Vis spectrophotometric method, the spectrum was obtained and is presented in Figure S4 in the Supplementary Materials File.
By HPLC studies on the Medicaginis herba, Trifolii pratense folium, Ginkgo bilobae folium, and Myrtilli fructus hydroalcoholic extractive solutions, and UV-Vis spectrophotometry performed on the Cynosbati fructus hydroalcoholic extractive solution, the presence of bioactive compounds with antioxidant activity was confirmed in their composition.
From the quantitative point of view, we noted an increase in the concentration of flavones in the hydroalcoholic extract for Trifolii pratense flores, an increase in the concentration of ODPs in the hydroalcoholic extract for Cynosbati fructus, and a lower concentration of tannins in the hydroalcoholic extract for Ginkgo bilobae folium.
Based on the obtained results, the qualitative and quantitative composition of the CILTAG pharmaceutical product was found to be: 201.43–223.13 mg% rutoside, 317.39–333.29 mg% caffeic acid, 215.39–223.14 mg% catechin-type tannins, 229.83–238.14 mg% leucoanthocyanines, and 8.38 mg% anthocyanines.

3.2.3. The Quantitative Determination of Ascorbic Acid

In order to ensure the suitability of the method for our determinations, we analyzed the accuracy, precision (repeatability, reproducibility), linearity, and range of the method and the relative specificity of the complex matrix in which ascorbic acid was found. Validation results are presented in Table S2 in the Supplementary Materials File.
The accuracy and repeatability were verified by injecting one to six standard solutions in triplicate on the same day, and the reproducibility was verified by repeating the determinations on three consecutive days. The specificity was determined using the chromatogram obtained for the analysis of an artificially prepared matrix from standards of ODP-type flavones and polyphenolic derivatives (which accompany the ascorbic acid in vegetable-based hydroalcoholic extractive solutions). The linearity, range of concentrations, and stability were determined after statistical processing by the regression of the experimental data obtained from analyzing three sets of standard solutions prepared as described above.
The calculation of the ascorbic acid concentration was done by the external calibration method using the regression curve obtained when determining the linearity. A total of 20 µL of the diluted sample was injected in duplicate.
The ascorbic acid in the sample was identified based on the retention time and the UV absorption spectrum of the eluate (ascorbic acid in aqueous solution absorbs UV light at 243 nm). The obtained peaks were pure. The average content of ascorbic acid obtained during storage, from 10 analyses, was 19.66 ± 0.85 mg mL−1.
The low stability of ascorbic acid in solution is well known and was the reason why the ascorbic acid determination was performed 60 days after the solutions’ preparation.
The prepared extractive solutions were kept for 2 months in parallel at room temperature and in a refrigerator (4–8 °C). The ascorbic acid content was determined every two weeks by the HPLC method.
During this time, the ascorbic acid content of the product kept at room temperature decreased by 20%. The obtained average concentrations of ascorbic acid after 60 days were: (i) for room temperature, 15.64 ± 1.32 mg mL−1 (79.55%); and (ii) for refrigerated storage, 20.78 ± 0.82 mg mL−1 (105.69%).
The HPLC method was selected and adapted according to the data in the literature, and the characteristics of the analyzed extractive solutions were suitable for the determinations as can be observed from the validation data.
By dosing the ascorbic acid by the HPLC method, it was found that the antioxidant preparation “CILTAG” contains 20 mg/mL ascorbic acid.

3.3. Antioxidant Activity Evaluation

3.3.1. Antioxidant Capacity by Chemiluminescence

Chemiluminescence data were quantified by calculating the evolution of the chemiluminescent signal over time in the presence of 10% hydroalcoholic extractive solutions of Medicaginis herba, Trifolii pratense flores, Gingko bilobae folium, Myrtilli fructus, and Cynosbati fructus and the antioxidant product (Table 6).
From the analysis of the antioxidant activity values (AA%), it can be observed that the hydroalcoholic extract of Myrtillis fructus has the most pronounced antioxidant activity (AA% = 92.1), followed by the hydroalcoholic extractive solution of Trifolii pratense flores (AA% = 59.24), Medicaginis herba (AA% = 63.55), and Cynosbati fructus (AA% = 44.86). The hydroalcoholic extractive solution of Ginkgo bilobae folium has an average AA% = 43.47. The antioxidant product CILTAG shows an antioxidant activity (AA%) = 86.16, which is slightly diminished compared with the hydroalcoholic extractive solution of Myrtillis fructus due to the values of the other components (Figure 2 and Figure 3).
The reaction rate is consistent with the variation in the antioxidant activity. Thus, the most active compound Myrtillis fructus has the fastest reaction rate.

3.3.2. Determination of Antioxidant Activity by the Electrochemical Method

The determination of the antioxidant capacity of the studied samples was made using as a reference the antioxidant capacity of Trolox, as it had previously been obtained. The methodology used was the same for all samples, with one exception for each sample: after recording the DPPH voltammogram, a 10 µL sample was introduced into the system and the voltammogram corresponding to the addition was recorded again. The readings for each sample were made at time zero and at 2 min. Figures S5–S10 in the Supplementary Materials File show the behaviors of the samples with respect to the long-living radical DPPH at the times established as optimal for measurement.
From Figures S5–S10, it is obvious that all the analyzed samples have some antioxidant properties that can be explained by the important content of polyphenolic derivatives, including flavones, catechols, ODPs, proanthocyanosides, and anthocyanosides.
This method reports on the total antioxidant capacity of the extracts, and no fractional separation of the components in the mixture was performed.
After recording the voltammograms, the peak current intensities corresponding to each sample were read and the differences were determined at 0 and 2 min from the peak current intensity belonging to DPPH in the absence of any antioxidant. The results are presented in Table 7.
Equation (5) was used to determine the antioxidant capacity of the samples:
A C s a m p l e = V s a m p l e × K × i s a m p l e i b l a n c k i T r o l o x i b l a n c k
where V is the sample volume, K is the dilution factor of the sample, isample is the intensity of the anodic peak current of the DPPH in the presence of the sample, iblanck is the peak current intensity of DPPH in the absence of any antioxidant, and iTrolox is the peak current intensity of DPPH in the presence of Trolox.
The obtained values are presented in Table S3 in the Supplementary Materials File and Figure 4.
The obtained data were verified by UV-VIS spectrometry, and we observed the changes in the absorption maxima of DPPH from 519 nm. The spectrometric determinations for Myrtilli fructus, Cynosbati fructus, and the antioxidant product, however, were inconclusive since the extracts have absorption maxima in the region of 500–520 nm, which made it difficult to monitor possible changes in the maximum DPPH. In the case of Medicaginis herba, Trifolii pratensae flores, and Ginkgo bilobae folium, to which the method could be applied, the antioxidant capacity was calculated according to Equation (6):
A C s a m p l e = V s a m p l e × K × A s a m p l e   A b l a n c k A T r o l o x   A b l a n c k
where ACsample is the antioxidant capacity of the sample, V is the sample volume, K is the sample dilution factor, Asample is the absorbance of DPPH in the presence of the sample, Ablanck is the absorbance of DPPH in the absence of any antioxidant, and ATrolox is the absorbance of DPPH in the presence of Trolox.
The obtained values are presented in Table S4 in the Supplementary Materials File and Figure 5.
From Figure 4 and Figure 5, it can be observed that the values obtained by the two methods are comparable. However, the slight increase in the spectrophotometric determinations may be due to the additivity of UV/VIS absorption, as none of the extracts were colorless.
Over time, the antioxidant capacity of the investigated extracts reached its maximum level at about 2 min and remained at this maximum for 7 min.
From the statistical analysis of the obtained data, it can be concluded that the method has a high degree of accuracy, the obtained values of the correlation coefficient are good, and the results are in accordance with the chemical composition of the extracts.

3.3.3. Determination of Antioxidant Capacity by the Superoxidismutase (SOD) Method

From the analysis of the obtained data (Table 8), it can be observed that all the solutions used at a 1/10 dilution show antioxidant activity that inhibits the amount of enzyme in a proportion of more than 50%. Among the studied solutions, it was found that the highest increase in antioxidant activity occurred in the extractive solutions of Trifolii pratense flores and Cynosbati fructus. The antioxidant preparation inhibited the activity of the enzyme by 94%.
The antioxidant activity is explained by the presence of polyphenolic derivatives, including flavones, catechols, and ODPs.
Phytochemical screenings are preliminary tests carried out to identify the presence of different active ingredients in the extracts. The separation of the main groups of active principles was done by the selective extraction of plant products with two different solvents: ethanol for non-polar ingredients and water for the polar ones. Although the flowers of Medicago sativa are purple in color, the reactions for anthocyanines were negative due to the existence of these active principles only in flowers. For this reason, they can be found in very small quantities in the herba product (below the sensitivity limit of the used identification reactions). Some of the ingredients, such as Medicaginis herba and Trifolii pratense flores, have been found to exert other pharmaceutical effects than antioxidant activity. On the other hand, Gingko bilobae folium, Myrtilli fructus, and Cynosbati fructus have been studied to a much greater degree and are already included in different pharmaceutical formulations.

4. Conclusions

In conclusion, the present research successfully identified the qualitative and quantitative composition of the CILTAG pharmaceutical product. By analyzing the values of antioxidant activity, it was observed that the obtained CILTAG has an above average antioxidant activity, which is explained by the presence of active principles with an antioxidant action (polyphenolic derivatives, including flavones, catechols, and ODPs). These compounds are part of the extractive solutions from which the mixtures are formed. Additionally, other active principles identified in the composition of the extractive solutions were proanthocyanosides and anthocyanosides. A good correlation between the phytochemical composition of the product and the measured antioxidant potential was observed. Taken together, our results reveal that the rate of success in obtaining the new pharmaceutical product CILTAG, with a certain antioxidant activity, depended on several factors: (i) the appropriate selection of solvents (a hydroalcoholic solution); (ii) the chosen extraction method; and (iii) the established concentration of each studied extract. However, further studies must be performed on the CILTAG product to establish its physical-chemical stability and to investigate other therapeutical activities. Additionally, in vivo studies should be conducted to verify its toxicity and to determine the exact dosage required in different alterations or disease treatments.

Supplementary Materials

The following are available online at https://www.mdpi.com/article/10.3390/app11188685/s1, Figure S1: Calibration line for Trolox; Figure S2: Overlapping voltammograms for DPPH and methanolic solutions: 10−4 molL−1 (1), 5 × 10⁻⁵ molL−1 (2), and 2.55 × 10⁻⁵ molL−1 (3); Figure S3: Variation in the intensity of the DPPH anodic peak current with the Trolox concentration at 0 min (1), 2 min (2), and 4 min (3); Figure S4: UV-Vis spectrum of the hydroalcoholic Cynosbati fructus extractive solution; Figure S5: Overlapping voltammograms corresponding to DPPH, addition of 10 µL of the hydroalcoholic solution of Medicaginis herba at 0 min and 2 min; Figure S6: Overlapping voltammograms corresponding to DPPH, addition of 10 µL of the hydroalcoholic solution of Trifolii pratensae flores at 0 min and 2 min; Figure S7: Overlapping voltammograms corresponding to DPPH, addition of 10 µL of the hydroalcoholic solution of Ginkgo bilobae folium at 0 min and 2 min; Figure S8: Overlapping voltammograms corresponding to DPPH, addition of 10 µL of the hydroalcoholic solution of Myrtilli fructus at 0 min and 2 min; Figure S9: Overlapping voltammograms corresponding to DPPH, addition of 10 µL of the hydroalcoholic solution of Cynosbati fructus at 0 min and 2 min; Figure S10: Overlapping voltammograms corresponding to DPPH, addition of 10 µL of the hydroalcoholic solution of the CILTAG product at 0 min and 2 min; Table S1: The linear gradient used in the present study; Table S2: Validation data for the HPLC method used to determine the ascorbic acid content; Table S3: Equivalent antioxidant capacity (TEAC) values for hydroalcoholic solutions of Medicaginis herba, Trifolii pratensae flores, Ginkgo bilobae folium, Myrtilli fructus, and Cynosbati fructus and CILTAG (Spectrometric determination); Table S4: Antioxidant capacity (AC) values for hydroalcoholic solutions of Medicaginis herba, Trifolii pratensae flores, and Ginkgo bilobae folium (Spectrometric determination).

Author Contributions

Conceptualization, E.M., M.M. and E.A.O.; methodology, D.D., D.L. and O.K.; validation, E.M., C.E.G., C.A. and A.C.I.; formal analysis, E.M., M.M., D.D. and M.V.H.; investigation, D.L., E.A.O., C.A., M.V.H., A.C.I. and M.M.; data curation, E.M., A.M.M., E.A.O. and A.C.I.; writing—original draft preparation, O.K., E.A.O. and A.M.M.; writing—review and editing, E.A.O. and A.M.M. All authors have read and agreed to the published version of the manuscript.

Funding

This research received no external funding. The APC was funded by the Carol Davila University of Medicine and Pharmacy.

Institutional Review Board Statement

Not applicable.

Informed Consent Statement

Not applicable.

Conflicts of Interest

The authors declare no conflict of interest.

References

  1. Aitbaev, K.; Murkamilov, I.; Fomin, V. Molecular mechanisms of aging: The role of oxidative stress and epigenetic modifications. Adv. Gerontol. 2019, 32, 20–28. [Google Scholar] [CrossRef] [PubMed]
  2. Hu, X.; Dong, D.; Xia, M.; Yang, Y.; Wang, J.; Su, J.; Sun, L.; Yu, H. Oxidative stress and antioxidant capacity: Development and prospects. New J. Chem. 2020, 44, 11405–11419. [Google Scholar] [CrossRef]
  3. Luo, J.; Mils, K.; le Cessie, S.; Noordam, R.; van Heemst, D. Ageing, age-related diseases and oxidative stress: What to do next? Ageing Res. Rev. 2020, 57, 100982. [Google Scholar] [CrossRef] [PubMed]
  4. Halliwell, B. Reactive Species and Antioxidants. Redox Biology Is a Fundamental Theme of Aerobic Life. Plant Physiol. 2006, 141, 312–322. [Google Scholar] [CrossRef] [PubMed] [Green Version]
  5. Souza-Monteiro, J.R.; Arrifano, G.P.F.; Queiroz, A.I.D.G.; Mello, B.S.F.; Custódio, C.S.; Macêdo, D.S.; Hamoy, M.; Paraense, R.S.O.; Bittencourt, L.O.; Lima, R.R.; et al. Antidepressant and Antiaging Effects of Açaí (Euterpe oleracea Mart.) in Mice. Oxid. Med. Cell. Longev. 2019, 2019, 3614960. [Google Scholar] [CrossRef] [PubMed] [Green Version]
  6. Valko, M.; Leibfritz, D.; Moncol, J.; Cronin, M.T.; Mazur, M.; Telser, J. Free radicals and antioxidants in normal physiological functions and human disease. Int. J. Biochem. Cell Biol. 2007, 39, 44–84. [Google Scholar] [CrossRef]
  7. Förstermann, U. Oxidative stress in vascular disease: Causes, defense mechanisms and potential therapies. Nat. Clin. Pract. Cardiovasc. Med. 2008, 5, 338–349. [Google Scholar] [CrossRef]
  8. Granger, D.N.; Kvietys, P.R. Reperfusion injury and reactive oxygen species: The evolution of a concept. Redox Biol. 2015, 6, 524–551. [Google Scholar] [CrossRef] [Green Version]
  9. Pallepati, P.; Averill-Bates, D.A. Reactive oxygen species, cell death signaling and apoptosis. In Princ Free Rad Biomed; Pantopoulos, K., Schipper, H., Eds.; Nova Science Publishers Inc.: Hauppauge, NY, USA, 2012; pp. 513–546. [Google Scholar]
  10. Kasote, D.M.; Katyare, S.S.; Hegde, M.V.; Bae, H. Significance of antioxidant potential of plants and its relevance to therapeutic applications. Int. J. Biol. Sci. 2015, 11, 982–991. [Google Scholar] [CrossRef] [Green Version]
  11. Duthie, G.G.; Duthie, S.J.; Kyle, J.A.M. Plant polyphenols in cancer and heart disease: Implications as nutritional antioxidants. Nutr. Res. Rev. 2000, 13, 79. [Google Scholar] [CrossRef] [Green Version]
  12. Moniruzzaman, M.; Lee, S.; Park, Y.; Min, T.; Bai, S.C. Evaluation of dietary selenium, vitamin C and E as the multi-antioxidanys on the methylmercury intoxicated mice based on mercury bioaccumulation, antioxidant enzyme activity, lipid peroxidation and mitochondrial oxidative stress. Chemosphere 2021, 273, 129673. [Google Scholar] [CrossRef]
  13. Gutteridge, J.C.; Halliwell, B. Free Radicals and Antioxidants in the Year 2000: A Historical Look to the Future. Ann. N. Y. Acad. Sci. 2006, 899, 136–147. [Google Scholar] [CrossRef]
  14. Heim, K.E.; Tagliaferro, A.R.; Bobilya, D.J. Flavonoid antioxidants: Chemistry, metabolism and structure-activity relationships. J. Nutr. Biochem. 2002, 13, 572–584. [Google Scholar] [CrossRef]
  15. Milisav, I.; Ribari, S.; Poljsak, B. Antioxidant Vitamins and Ageing; Springer: Berlin/Heidelberg, Germany, 2018. [Google Scholar]
  16. Gonzales, M.; Villena, G.K.; Kitazono, A.A. Evaluation of the antioxidant activities of aquas extracts from seven wild plants from the Andea using an in vivo yeast assay. Results Chem. 2021, 3, 100098. [Google Scholar] [CrossRef]
  17. Ahmed, M.; Khan, M.I.; Muhammad, M.R.; Khan, A.U.; Khan, R.A. Role of medicinal plants in oxidative stress and cancer. Sci. Rep. 2013, 2, 641. [Google Scholar]
  18. Wang, H.; Liu, J.; Li, T.; Liu, R.H. Blueberry extract promotes longevity and stress tolerance via DAF-16 in Caenorhabditis elegans. Food Funct. 2018, 9, 5273–5282. [Google Scholar] [CrossRef]
  19. Drăgoi, C.M.; Moroșan, E.; Dumitrescu, I.B.; Nicolae, A.C.; Arsene, A.L.; Drăgănescu, D.; Lupuliasa, D.; Ioniță, A.C.; Pantea, A.; Stoian, C.; et al. Insights into chrononutrition: The innermost interplay amongst nutrition, metabolism and the circadian clock, in the context of epigenetic reprogramming. Farmacia 2019, 67, 557–571. [Google Scholar] [CrossRef]
  20. Chatzigeorgiou, S.; Thai, Q.D.; Tchoumtchoua, J.; Tallas, K.; Tsakiri, E.N.; Papassideri, I.; Halabalaki, M.; Skaltsounis, A.L.; Trougakos, I.P. Isolation of natural products with anti-ageing activity from the fruits of Platanus orientalis. Phytomedicine 2017, 33, 53–61. [Google Scholar] [CrossRef]
  21. Haminiuk, C.W.I.; Maciel, G.M.; Plata-Oviedo, M.S.V.; Peralta, R.M. Phenolic compounds in fruits—An overview. Int. J. Food Sci. Technol. 2012, 47, 2023–2044. [Google Scholar] [CrossRef]
  22. Li, C.; Wang, E.; Elshikh, M.S.; Alwahibi, M.S.; Wang, W.; Wu, G.; Shen, Y.; Abbasi, A.M.; Shan, S. Extraction and purification of total flavonoids from Gnaphalium affine D. Don and their evaluation for free radicals’ scavenging and oxidative damage inhabitation potential in mice liver. Arab. J. Chem. 2021, 14, 103006. [Google Scholar] [CrossRef]
  23. Manolescu, B.N.; Oprea, E.; Mititelu, M.; Ruta, L.; Fărcășanu, I.C. Dietary anthocyanins and stroke: A rewiew of pharmacokinetics and pharmacodynamic studies. Nutrients 2019, 11, 1479. [Google Scholar] [CrossRef] [Green Version]
  24. Nile, S.H.; Nile, A.S.; Keum, Y.S. Total phenolics, antioxidant, antitumor and enzyme inhibitory activity of indian medicinal and aromatic plants extracted with different extraction methods. 3 Biotech 2017, 7, 76. [Google Scholar] [CrossRef] [Green Version]
  25. Fornasaro, S.; Ziberna, L.; Gasperotti, M.; Tramer, F.; Vrhovšek, U.; Mattivi, F.; Passamonti, S. Determination of cyanidin 3-glucoside in rat brain, liver and kidneys by UPLC/MS-MS and its application to a short-term pharmacokinetic study. Sci. Rep. 2016, 6, 22815. [Google Scholar] [CrossRef]
  26. Henry, C.J. Functional foods. Eur. J. Clin. Nutr. 2010, 64, 657–659. [Google Scholar] [CrossRef] [Green Version]
  27. Heo, H.J.; Lee, C. Strawberry and Its Anthocyanins Reduce Oxidative Stress-Induced Apoptosis in PC12 Cells. J. Agric. Food Chem. 2005, 53, 1984–1989. [Google Scholar] [CrossRef]
  28. Spada, P.D.; Dani, C.; Bortolini, G.V.; Funchal, C.; Henriques, J.A.; Salvador, M. Frozen fruit pulp of Euterpe oleraceae Mart. (Acai) prevents hydrogen peroxide-induced damage in the cerebral cortex, cerebellum, and hippocampus of rats. J. Med. Food 2009, 12, 1084–1088. [Google Scholar] [CrossRef]
  29. Slawson, D.L.; Fitzgerald, N.; Morgan, K.T. Position of the Academy of Nutrition and Dietetics: The role of nutrition in health promotion and chronic disease prevention. J. Acad. Nutr. Diet. 2013, 113, 972–979. [Google Scholar] [CrossRef]
  30. Kim, H.G.; Ju, M.S.; Shim, J.S.; Kim, M.C.; Lee, S.H.; Huh, Y.; Kim, S.Y.; Oh, M.S. Mulberry fruit protects dopaminergic neurons in toxin-induced Parkinson’s disease models. Br. J. Nutr. 2010, 104, 8–16. [Google Scholar] [CrossRef] [Green Version]
  31. Kim, Y.; Je, Y. Flavonoid intake and mortality from cardiovascular disease and all causes: A meta-analysis of prospective cohort studies. Eur. Soc. Clin. Nutr. Metab. 2017, 20, 68–77. [Google Scholar] [CrossRef]
  32. Badshah, H.; Kim, T.H.; Kim, M.O. Protective effects of anthocyanins against amyloid beta-induced neurotoxicity in vivo and in vitro. Neurochem. Int. 2015, 80, 51–59. [Google Scholar] [CrossRef]
  33. Shukitt-Hale, B.; Bielinski, D.; Lau, F.; Willis, L.; Carey, A.; Joseph, J. The beneficial effects of berries on cognition, motor behaviour and neuronal function in ageing. Br. J. Nutr. 2015, 114, 1542–1549. [Google Scholar] [CrossRef] [Green Version]
  34. Sikalidis, A.K. From Food for Survival to Food for Personalized Optimal Health: A Historical Perspective of How Food and Nutrition Gave Rise to Nutrigenomics. J. Am. Coll. Nutr. 2019, 38, 84–95. [Google Scholar] [CrossRef] [PubMed]
  35. Winter, A.; Bickford, P. Anthocyanins and Their Metabolites as Therapeutic Agents for Neurodegenerative Disease. Antioxidants 2019, 8, 333. [Google Scholar] [CrossRef] [PubMed] [Green Version]
  36. Milani, A.; Basirnejad, M.; Shahbazi, S.; Bolhassani, A. Carotenoids: Biochemistry, pharmacology and treatment. Br. J. Pharmacol. 2017, 174, 1290–1324. [Google Scholar] [CrossRef] [Green Version]
  37. Middha, P.; Weinstein, S.J.; Männistö, S.; Albanes, D.; Mondul, A.M. β-Carotene Supplementation and Lung Cancer Incidence in the Alpha-Tocopherol, Beta-Carotene Cancer Prevention Study: The Role of Tar and Nicotine. Nicotine Tob. Res. 2018, 21, 1045–1050. [Google Scholar] [CrossRef] [Green Version]
  38. Woondall, A.A.; Lee, S.W.M.; Weesie, R.J.; Jackson, M.J.; Britton, G. Oxidation of carotenoids by free radicals: Relationship between structure and reactivity. Biochim. Biophys. Acta (BBA) Gen. Subj. 1997, 1336, 33–42. [Google Scholar] [CrossRef]
  39. Lombaro, L.; Grasso, F.; Lanciano, F.; Loria, S.; Monetti, E.C.H. Chapter 2-Broad-Spectrum Healyh Protection of Extra Virgin Olive Oil Compounds in Studies in Natural Products Chemistry; ur-Rahman, A., Ed.; Eslevier: Amsterdam, The Netherlands, 2018; Volume 57, pp. 41–77. [Google Scholar]
  40. De Figueiredo, S.M.; Binda, N.S.; Nogueira-Machado, J.A.; Vieira-Filho, S.A.; Caligiorne, R.B. The antioxidant properties of organosulfur compounds (sulforaphane). Recent Pat. Endocr. Metab. Immune Drug Discov. 2015, 9, 24–39. [Google Scholar] [CrossRef]
  41. Kazmierczak-Barariska, J.; Boguszewska, K.; Adamus-Grabicka, A.; Karwowski, B.T. Two faces of Vitamin C-Antioxidative and pro-oxidative agent. Nutrients 2020, 12, 1501. [Google Scholar] [CrossRef]
  42. Luo, S.; Jiang, X.; Jia, L.; Tan, C.; Li, M.; Yang, Q.; Du, Y.; Ding, C. In Vivo and In Vitro Antioxidant Activities of Methanol Extracts from Olive Leaves on Caenorhabditis elegans. Molecules 2019, 24, 704. [Google Scholar] [CrossRef] [Green Version]
  43. Hovanet, M.-V.; Dociu, N.; Dinu, M.; Ancuceanu, R.; Morosan, E.; Oprea, E. A Comparative Physico-chemical Analysis of Acerplatanoides and Acer pseudopla tanus Seed Oils. Rev. Chim. 2015, 66, 987–991. [Google Scholar]
  44. Sharma, K.; Mahato, N.; Lee, Y.R. Extraction, characterization and biological activity of citrus flavonoids. Rev. Chem. Eng. 2018, 35, 265–284. [Google Scholar] [CrossRef]
  45. *** Romanian Pharmacopoeia X edition. Ed. Med. 1993, 37, 67–68, 335, 419–421, 921–922.
  46. Mititelu, M.; Ioniţă, A.C.; Moroşan, E. Research regarding integral processing of mussels from Black Sea. Farmacia 2014, 62, 625–632. [Google Scholar]
  47. López, A.; García-Alonso, J.; Fenoll, J.; Hellín, P.; Flores, P. Chemical composition and antioxidant capacity of lettuce: Comparative study of regular-sized (Romaine) and baby-sized (Little Gem and Mini Romaine) types. J. Food Compos. Anal. 2014, 33, 39–48. [Google Scholar] [CrossRef]
  48. Chang-Bum, A.; Tai-Sun, S.; Hye, K.S.; Jae-Young, J. Phenolic composition and antioxidant effect of aqueous extract of Arisaema cum Bile, the Oriental Herb Medicine, in human fibroblast cells. Immunopharmacol. Immunotoxicol. 2012, 34, 661–666. [Google Scholar]
  49. Wei, S.D.; Lin, Y.M.; Liao, M.M.; Zhou, H.C.; Li, Y.Y. Characterization and antioxidative properties of condensed tannins from the mangrove plant Aegiceras corniculatum. J. Appl. Polym. Sci. 2012, 124, 2463–2472. [Google Scholar] [CrossRef]
  50. Dhar, P.; Tayade, A.B.; Bajpai, P.K.; Sharma, V.K.; Das, S.K.; Chaurasia, O.P.; Srivastava, R.B.; Singh, S.B. Antioxidant Capacities and Total Polyphenol Contents of Hydro-ethanolic Extract of Phytococktail from Trans-Himalaya. J. Food Sci. 2012, 77, C156–C161. [Google Scholar] [CrossRef] [PubMed]
  51. Aguilar, M.I. (Ed.) Reversed-Phase High-Performance Liquid Chromatography. In HPLC of Peptides and Proteins. Methods in Molecular Biology™; Springer: Totowa, NJ, USA, 2004; Volume 251. [Google Scholar] [CrossRef]
  52. Sushant, A.; Manoj, K.B.; Krisha, D.; Puspa, K.; Roshani, G.; Niranjan, K. Total Phenolic Content, Flavonoid Content and Antioxidant Potential of Wild Vegetables from Western Nepal. Plants 2019, 8, 96. [Google Scholar]
  53. Pogacnik, L.; Poklar Ulrih, N. Application of optimized chemiluminescence assay for determination of the antioxidant capacity of herbal extracts. Luminescence 2012, 27, 505–510. [Google Scholar] [CrossRef]
  54. Tsaplev, Y.B.; Vasil’ev, R.F.; Kancheva, V.D.; Trofimov, A.V. Joint Chemiluminescence of Lophine and Luminol in the Presence of Hydrogen Peroxide and Hemin. Russ. J. Phys. Chem. B 2020, 14, 431–435. [Google Scholar] [CrossRef]
  55. Bastos, E.L.; Romoff, P.; Eckert, C.R.; Baader, W.J. Evaluation of Antiradical Capacity by H2O2−Hemin-Induced Luminol Chemiluminescence. J. Agric. Food Chem. 2003, 51, 7481–7488. [Google Scholar] [CrossRef] [PubMed]
  56. Pisoschi, A.M.; Cimpeanu, C.; Predoi, G. Electrochemical Methods for Total Antioxidant Capacity and its Main Contributors Determination: A review. Open Chem. 2015, 13, 824–856. [Google Scholar] [CrossRef] [Green Version]
  57. Korotkova, E.I.; Voronova, O.A.; Dorozhko, E.V. Study of antioxidant properties of flavonoids by voltammetry. J. Solid State Electrochem. 2012, 16, 2435–2440. [Google Scholar] [CrossRef]
  58. Lino, F.M.A.; de Sá, L.Z.; Torres, I.M.S.; Rocha, M.L.; Dinis, T.C.P.; Ghedini, P.C.; Somerset, V.S.; Gil, E.S. Voltammetric and spectrometric determination of antioxidant capacity of selected wines. Electrochim. Acta 2014, 128, 25–31. [Google Scholar] [CrossRef]
  59. Deepika, S.; Rajagopal, S.V. Evaluation of in vitro antioxidant activity of flowers of Blepharis Molluginifolia. IJPSR 2014, 5, 2225–2229. [Google Scholar]
Figure 1. The extraction process for the CILTAG product.
Applsci 11 08685 g001
Figure 2. Comparative histogram of the antioxidant activity values of the studied solutions.
Applsci 11 08685 g002
Figure 3. Variation in antioxidant activity values as a function of the reaction time for the studied solutions.
Applsci 11 08685 g003
Figure 4. Graphical representation of the antioxidant capacity of hydroalcoholic solutions of Medicaginis herba, Trifolii pratensae flores, Ginkgo bilobae folium, Myrtilli fructus, and Cynosbati fructus and CILTAG.
Applsci 11 08685 g004
Figure 5. Graphical representation of the antioxidant capacity of hydroalcoholic solutions of Medicaginis herba, Trifolii pratensae flores, and Ginkgo bilobae folium.
Applsci 11 08685 g005
Table 1. Variation in extinction according to the concentration of rutoside solution (µg/mL) and variation according to the concentration of caffeic acid solution (µg/mL).
Nr. Crt.Concentration of Rutoside Solution (µg/mL)Extinction of Rutoside Solution *Concentration of Caffeic Acid Solution
(µg/mL)
Extinction of Caffeic Acid Solution *
110.137 ± 0.00213.360.193 ± 0.001
220.345 ± 0.00326.720.385 ± 0.001
330.582 ± 0.00440.080.578 ± 0.002
440.799 ± 0.00453.440.764 ± 0.002
5--66.800.963 ± 0.003
* The tests were performed in triplicate and the results are expressed as the median of the obtained values. The SD is shown in the table.
Table 2. The quantities of ingredients and reagents.
SampleDry Residue g%SOD-Like Activity U/mL
Medicaginis herba3.31000
Trifolii pratense flores11500
Gingko bilobae folium3.11700
Myrtilli fructus13.5100
Cynosbati fructus3.5130
Ribes nigri fructus17.51000
Rubi idaei fructus2.21000
Rubi fruticosi fructus2.44120
Fragariae moschatae fructus3.31000
CILTAG4.7100
ReagentsSampleStandard
Phosphate buffer 0.05 M pH 7.82.6 mL2.7 mL
TMED 0.78 M0.05 mL0.05 mL
AM 2 × 10⁻⁴ M0.05 mL0.05 mL
NBT 3 × 10⁻³ M0.2 mL0.2 mL
Plant extract0.1 mL-
Table 3. Qualitative chemical analysis of hydroalcoholic extractive solutions.
Extractive SolutionIdentified Active Groups of Plant Compounds
Reducing CompoundsCarbohydratesTanninsFlavonesAnthocyaninsProantocyaninsODPs
Medicaginis herba++++++++
Trifolii pratense flores++++++++++
Ginkgo bilobae folium++++++++
Myrtilli fructus+++++++++++++
Cynosbati fructus+++++++++++
“−” = negative reaction; “+” = positive reaction; “+” = weak positive reaction; “++” = intensely positive reaction.
Table 4. The results of the quantitative determination of flavones, ODPs, catechin tannins, and proanthocyanins and the preliminary quantitative determination.
Vegetable ProductFlavones/g% (Rutoside)ODPs/g% (Caffeic Acid)Catechin-Type Tannins/g%Proantocyans L.A.%/100 mLMoisture Content, g%Water-Soluble Substances/g%Alcohol-Soluble Substances/g%
Medicaginis herba0.195–0.2130.233–0.2840.18–0.19-9.13–10.0412.84–13.0511.08–11.73
Trifolii pratense flores0.223–0.2750.274–0.3010.23–0.310.093–0.1058.15–9.0314.93–15.7314.05–14.83
Ginkgo bilobae folium0.387–0.4120.213–0.2730.10–0.21-10.14–11.2713.05–14.2212.93–13.13
Cynosbati fructus0.198–0.2030.487–0.5030.27–0.300.323–0.3739.27–10.3311.87–12.2712.87–13.12
Myrtilli fructus--0.33–0.410.387–0.40112.23–13.0412.87–13.2311.43–12.07
Table 5. Bioactive compounds separated from and identified in the Medicaginis herba, Trifolii pratense flores, Ginkgo bilobae folium, and Myrtilli fructus hydroalcoholic extractive solutions.
Extractive SolutionsIdentified CompoundsRetention Time (tR)Maximum Absorbance Wavelength λmax (nm)
Medicaginis herbaRosmarinic acid 30544266, 334
Trifolii pratense foliumRutoside19053257, 293, 344
Caffeic acid10771280
Rosmarinic acid30251254, 350
Kaempferol47787259
Ginkgo bilobae foliumFerulic acid18093216, 234
Rosmarinic acid30877312
Quercetol38845358
Kaempferol48547358
Myrtilli fructusChlorogenic acid 8045218, 242, 325
Table 6. Values of the chemiluminescent signal as a function of time and of the antioxidant activity in the presence of hydroalcoholic solutions.
Analyzed ProductIpAA%V (5 sec)
Medicaginis herba726.663.55145
Trifolii pratense flores808.859.24162
Gingko bilobae folium108143.47216
Myrtillis fructus140.692.128.1
Cynosbati fructus102944.86206
Antioxidant product CILTAG227.586.1645.5
Ip = chemiluminescent signal intensity in the presence of the studied solutions at t = 5 s; AA% = antioxidant activity; V (5 sec) = speed of the chemiluminescent signal after the first 5 s.
Table 7. The values of the anodic peak current intensities of DPPH in the presence of hydroalcoholic solutions of Medicaginis herba, Trifolii pratensae flores, Ginkgo bilobae folium, Myrtilli fructus, and Cynosbati fructus and CILTAG.
SampleIDPPH (mA)Time (Minutes)Intensities
Medicaginis herba2.33000.487
2.07020.701
Trifolii pratense flores2.26100.317
2.33820.437
Gingko bilobae folium2.46100.861
2.29221.03
Myrtillis fructus1.89600.207
1.89220.211
Cynosbati fructus1.89000.220
1.88720.236
CILTAG2.46100.861
2.28721.100
Table 8. Percentage inhibition (%) of lipid peroxidation.
SampleDilutionsDilutionsDilutions
1/101/1001/1000
Medicaginis herba754311
Trifolii pratense flores1008756
Gingko bilobae folium513730
Myrtilli fructus988749
Cynosbati fructus1008756
Antioxidant product CILTAG947840
Publisher’s Note: MDPI stays neutral with regard to jurisdictional claims in published maps and institutional affiliations.

