


Abstract
While lower limb biomechanics of people with diabetes are well described, the effects of diabetes type and of peripheral neuropathy on foot joint kinematics have not been addressed in depth. A total of 70 patients with type 1 (n = 25) and type 2 (n = 45) diabetes mellitus, with and without peripheral neuropathy, underwent functional evaluation via gait analysis using an established multisegment foot kinematic model. ANCOVA was performed to assess differences in foot joints’ range of motion (ROM) between groups with diabetes and a control group by accounting for the effects of age, body mass index (BMI) and normalized walking speed. Statistical parametric mapping was used to assess differences in temporal patterns of foot joint motion across normalized gait cycle. Small but significant correlations were found between age, BMI, speed and foot joints’ ROM. Regardless of diabetes type and presence of neuropathy, all subgroups with diabetes showed limited ROM at the midtarsal and tarsometatarsal joints. Increased midtarsal joint dorsiflexion and adduction was associated with increased tarsometatarsal joint plantarflexion. After accounting for the effect of covariates, diabetes is associated with reduced ROM and to alterations of the kinematic patterns, especially at the midtarsal and tarsometatarsal joints, irrespective of type and neuropathy.
1. Introduction
Diabetic foot refers to a complex set of physiological and mechanical alterations affecting the feet of persons with type 1 and type 2 diabetes mellitus [1]. According to the International Diabetes Federation [2], the population with diabetes is expected to increase by 48% worldwide by 2045 with a huge impact on healthcare systems. Several factors contribute to the severity and prognosis of the disease, including age and body mass index (BMI), diabetes duration, co-morbidities and metabolic control [3]. Diabetes is often associated with the presence and severity of diabetic peripheral neuropathy (DPN), a multifactorial chronic complication related to vascular and nerve damage. This leads to progressive loss of vibratory, thermal, tactile and proprioceptive sensitivity [4], mainly distal muscle weakness and dysfunction [5,6,7,8], distal joint motion restrictions [9,10,11,12] and eventually to the development of foot ulcers and amputations [13]. DPN, together with compromised blood flow, is responsible for a high number of ulcerations; up to 60% of lower extremity amputations are due to diabetic foot ulcers [14,15].
In a complex clinical scenario, correlations between the clinical aspects of diabetes or DPN and foot biomechanics is a complex task. To date, most of the relevant literature has focused on the effects of DPN on lower limb kinetics and kinematics [10,16,17,18,19,20] and little is known on differences in foot biomechanics between type 1 and type 2 diabetes or in patients with and without DPN [21,22]. DPN was associated with reduced trunk and lower limb mobility [23]. In terms of foot kinematics, diabetic foot presents limited passive range of motion of subtalar and metatarsophalangeal joints [7,11,12,24]. This is reflected also in kinematic alterations of gait, such as reduced motion of ankle [17,20,21,22], midtarsal [21] and 1st metatarsal joints [17]. In terms of alterations in timing and activation levels of lower limb muscles, diabetes and DPN were both associated with earlier activation of the ankle plantarflexors [9,25,26], reduction in the intrinsic foot muscles volume [5,6,7,27], delayed peak of gastrocnemius lateralis and vastus lateralis [20,28] and lower tibialis anterior magnitude [20].
However, detailed analysis of foot joint kinematics via multisegment foot models have been rarely investigated, and the effect of diabetes and DPN on specific foot joints has not been fully explored. Kinematic, kinetic and surface electromyographic analyses have often been performed in isolation, or in limited sample-size and heterogeneous subgroups of people with diabetes and DPN. This situation has created a fragmented scenario where the available information and data are difficult to merge in a coherent picture of diabetic foot biomechanics. Independent variables which have been shown to affect gait biomechanics, such as age, BMI, disease duration and walking speed, have either not been accounted for or have only been considered in the analysis of extremely small homogenous subgroups. Walking speed, in particular, is possibly the most important independent gait parameter; it was shown to significantly affect several lower limb kinematic parameters, such as the foot joint range of motion [29] and the dynamics of the foot arch [30]. Therefore, the possible confounding effect of this parameter should always be accounted for when investigating the effect of diabetes on foot biomechanics.
In the present study, we collected and analyzed the kinematics of foot joints using an established multisegment model of the foot in a relatively large population of people with type 1 and type 2 diabetes, with and without DPN. The main aim was to characterize diabetes type and DPN in terms of joint kinematic parameters in walking, accounting for confounding variables such as age, BMI and walking speed.
2. Materials and Methods
2.1. Participants
From January to December 2016, a wide sample of participants with diabetes were visited by an experienced diabetologist and were clinically classified as type 1 or type 2, with or without DPN. 70 patients (38M/32F; age 57.8 ± 12.4 years; BMI 28.9 ± 6.5 kg/m2) were divided in four groups according to the diabetes type (type 1, n = 25; type 2, n = 45) and to the presence of DPN (DPN, n = 40; non-DPN, n = 30) and underwent the full clinical and biomechanical protocol (Table 1). Presence and level of DPN was determined via the Michigan Neuropathy Screening Instrument [31]. A group of 27 healthy adults (11M/16F; age 53.1 ± 8.7 years; BMI 24.2 ± 3.5 kg/m2) was recruited as control. The study was conducted according to the guidelines of the Declaration of Helsinki and approved by the Ethics Committee of Istituto Ortopedico Rizzoli (protocol code IOR 7685, 28th July 2017). Informed consent was signed by all participants involved in the study.
Table 1.
Size and gender distribution in type 1, type 2, neuropathic, non-neuropathic and control groups. Mean (±std) of the four independent variables used as covariates are reported for each group. Kruskal–Wallis statistical differences are shown in the last two columns. * denotes post hoc pairwise statistically significant difference between any diabetic group and control (p < 0.05); ^ denotes post hoc pairwise statistically significant difference between two diabetic groups (p < 0.05).
2.2. Experimental Protocol
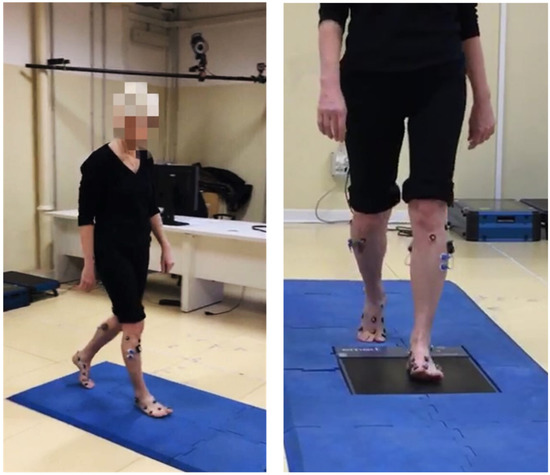
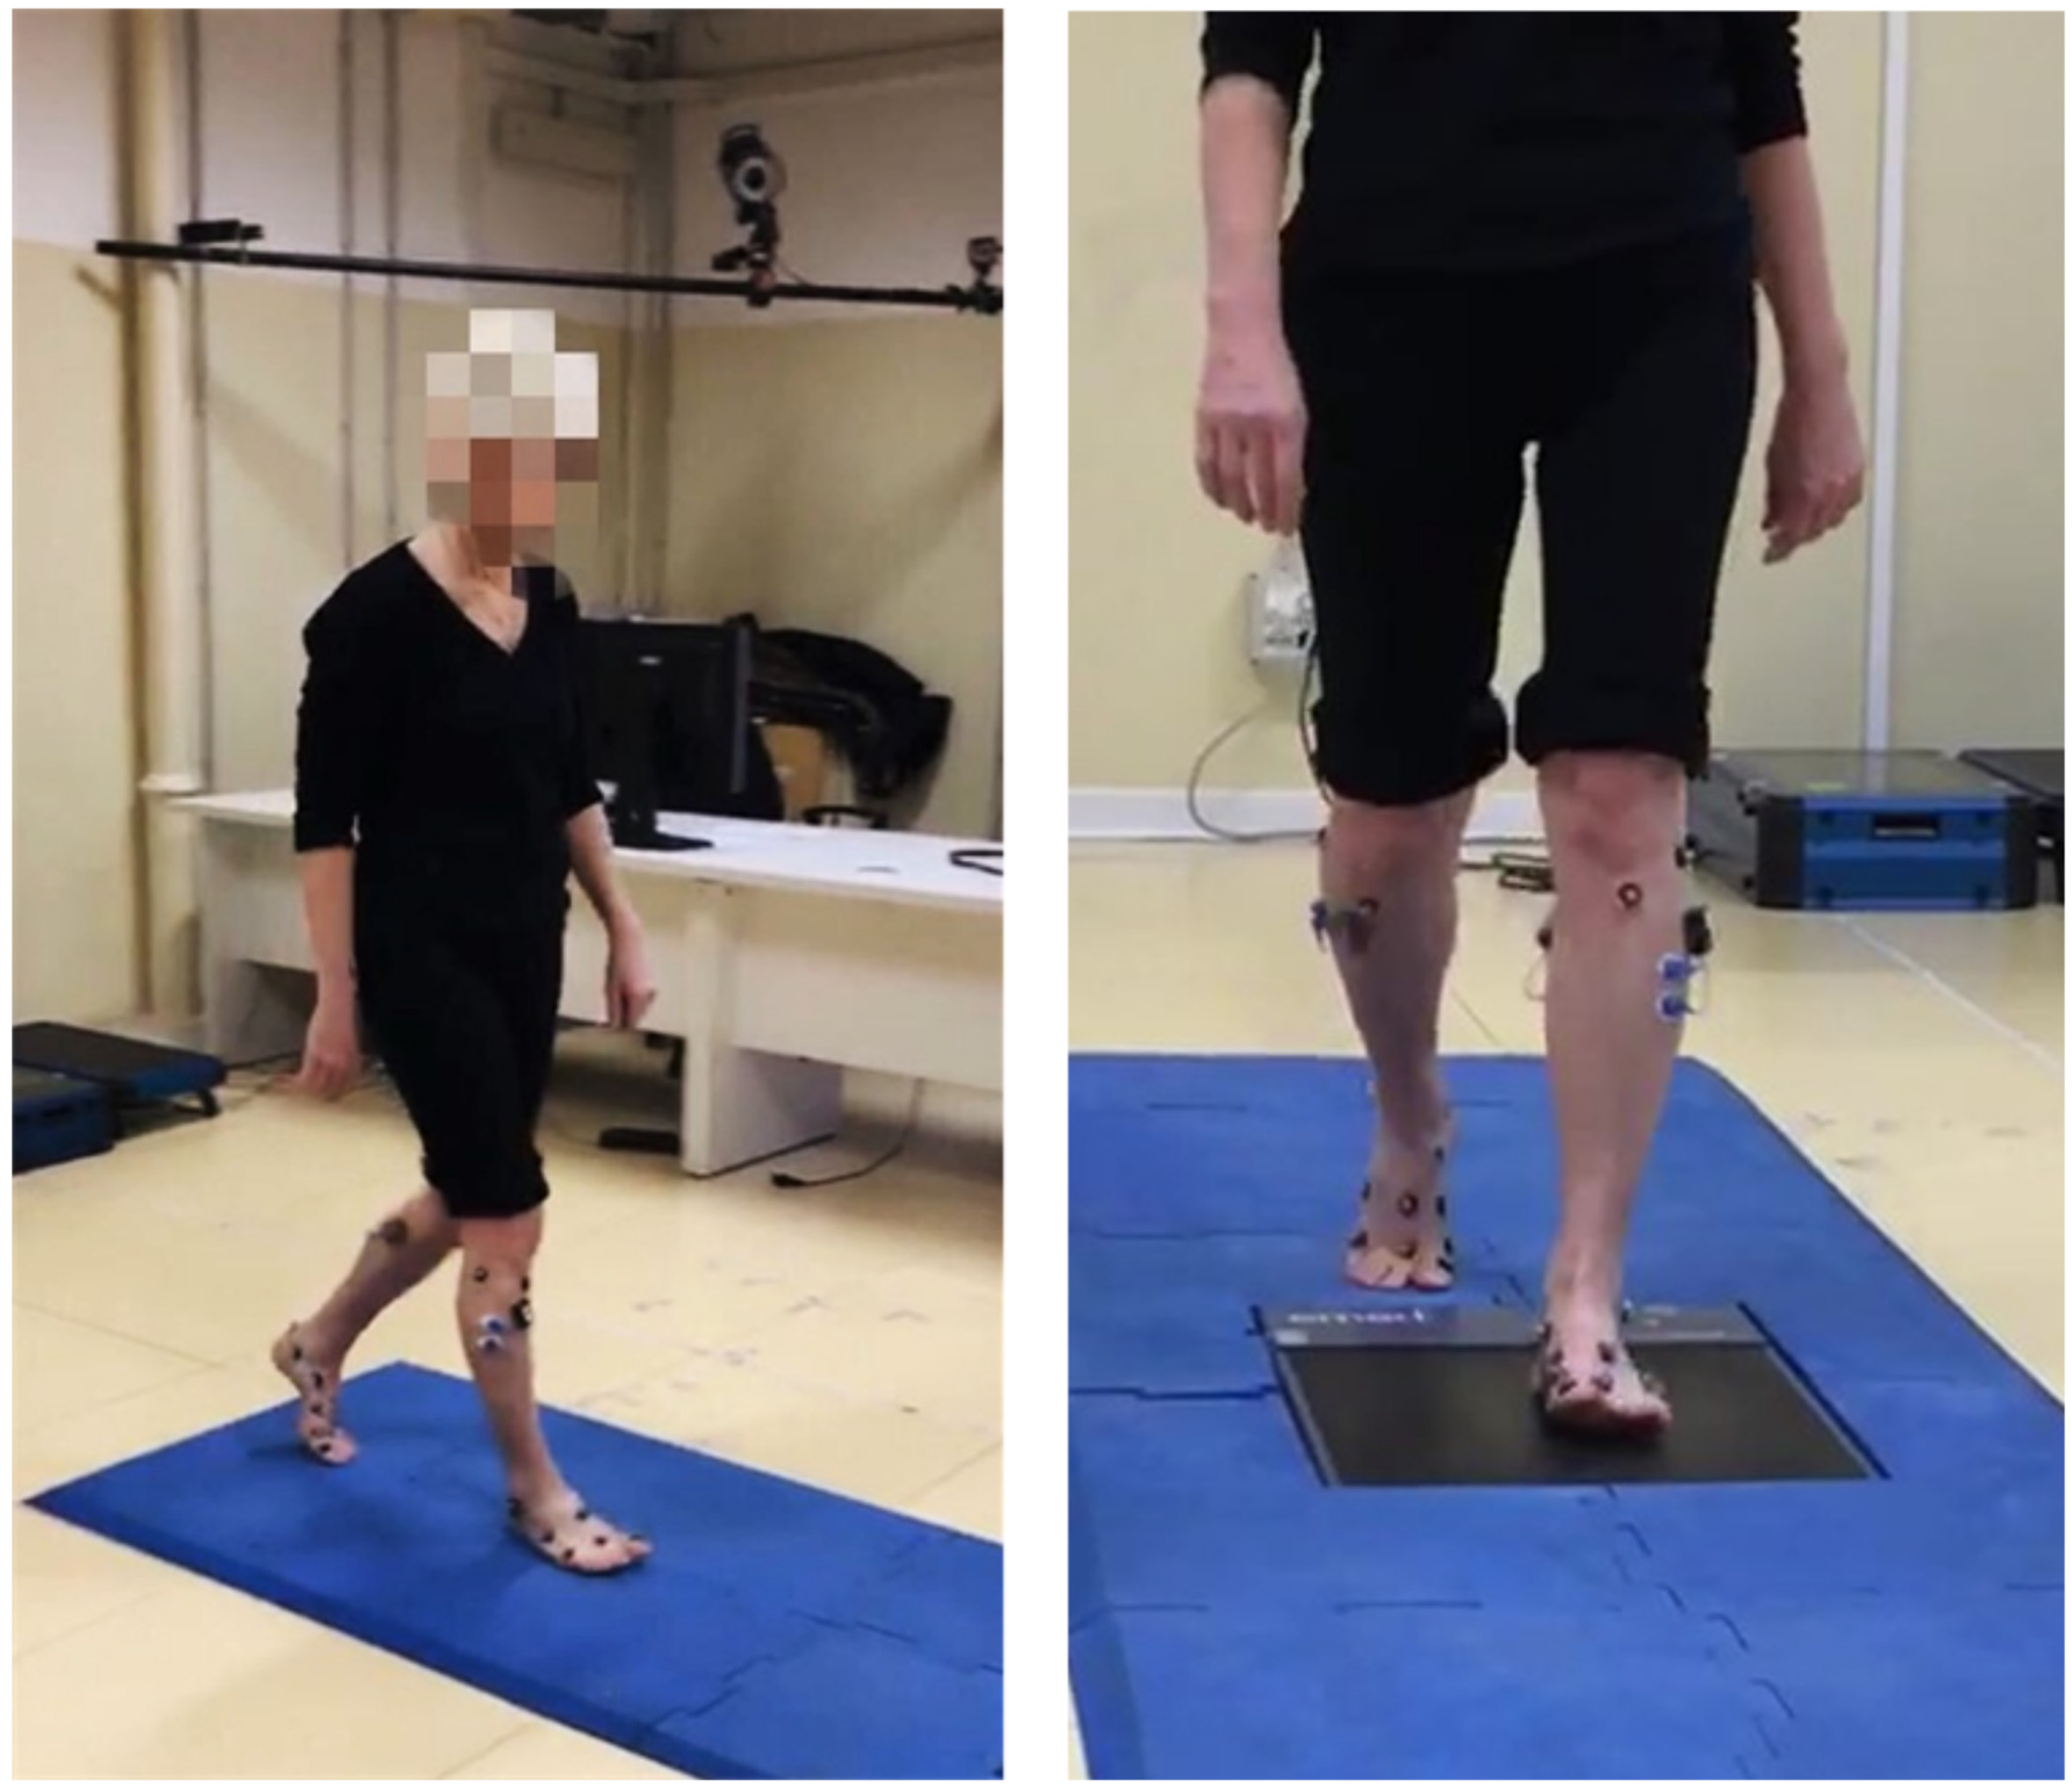
All participants underwent functional evaluation via skin marker-based kinematic analysis using an 8-camera motion analysis system at 100 Hz (Vicon 612, Vicon Motion Capture, Oxford, UK) (Figure 1).
Figure 1.
Exemplary walking trial for one of the participants with diabetes fitted with the Rizzoli Foot Model marker set.
Two force plates embedded in the floor (Kistler, Switzerland) recorded the ground reaction forces at 2000 Hz. A single experienced examiner fitted each participant with 18 reflective markers on anatomical landmarks on the shank, calcaneus, midfoot, metatarsus and proximal phalanx of the hallux, according to the Rizzoli Foot Model [32,33]. Local anatomical reference frames were established on each segment according to the position of relevant markers. The relative orientation between segments was determined using the Joint Coordinate System [34]. Gait analysis was performed during barefoot walking at comfortable self-selected speed. For each participant, relative motion with respect to the three axes of the joint coordinate system (dorsi/plantar flexion, inversion/eversion and adduction/abduction) was measured between the following pairs of segments: calcaneus and shank (ShCa; ankle joint complex); midfoot and calcaneus (CaMi; midtarsal joint); metarasus and midfoot (MiMe; tarsometatarsal joint); metatarsus and calcaneus (CaMe). The overall shank-to-foot motion (ShFo), assumed to be one single rigid segment, and the sagittal plane motion of the first metatarsophalangeal joint (MTPj) were also measured. Time histories of joint kinematics were normalized over gait cycle duration. Timing of gait events and spatio-temporal parameters were determined by the analysis of the markers’ trajectories and of the ground reaction forces. Range of motion (ROM) of all joints with respect to the three axes of rotations was computed as the absolute difference between maximum and minimum value over stance phase duration. All gait data were averaged across five walking trials for each subject and used as samples for the statistical analysis. Right limb data only were used in the present analysis.
2.3. Statistics
The Kruskal–Wallis test was used to assess whether there was any difference in age, BMI, walking speed and diabetes duration between groups, and Tukey’s honest significant difference procedure as a post hoc test (α = 0.05). Analysis of covariance ANCOVA (STATISTICA 10, Tibco Statistica, Palo Alto, CA) with Bonferroni post hoc was used to assess the effect of diabetes type and DPN on ROM (α = 0.05). Participants’ BMI (kg/m2), age (yrs) and normalized walking speed (m/s*height−1) were used as covariates to assess differences in foot joints ROM among diabetes and DPN groups and control, after checking for significant correlations between each covariate and the ROM variable.
Statistical parametric mapping (SPM) of two-tailed paired t-tests allowed to identify supra-threshold clusters of SPM (t) [35] for the pairwise comparisons between temporal profiles of joint rotations in diabetes and DPN sub-groups, and with respect to the control population.
3. Results
Significant differences were found in age, BMI, diabetes duration and walking speed between diabetes type and DPN subgroups and controls (Table 1). Type 1 individuals were significantly younger than type 2, which in turn were older than controls. Type 2 individuals had the largest BMI (p < 0.01), and along with DPN and non-DPN groups, walked at a slower normalized speed than control (p < 0.001). Type 1 had a longer diabetes duration than type 2. Mean spatio-temporal parameters in each group with diabetes and in the control are reported in Table 2. All groups with diabetes, except type 1, walked at a slower speed and with shorter stride length than controls.
Table 2.
Spatio-temporal parameters in type 1, type 2, neuropathic (DPN), non-neuropathic (non-DPN) and control groups. Mean (±std) of each parameter are reported for each group. Kruskal–Wallis statistical differences are shown in the last two columns. * denotes post hoc pairwise statistically significant difference between any diabetic group and control (p < 0.05); ^ denotes post hoc pairwise statistically significant difference between two diabetic groups (p < 0.05).
3.1. Effect of Covariates on Foot Joint ROM
Age showed significant (p < 0.05) negative correlations with transverse-plane ROM of the ankle (ShCa; R = 0.30), frontal-plane ROM of the metatarsus with respect to the calcaneus (CaMe; R = 0.21), and sagittal plane ROM of the first MTPj (R = 0.27). Normalized walking speed showed significant positive correlations with ROM of several foot joints (0.19 < R < 0.26; p < 0.05). BMI had limited but significant negative correlation with transverse-plane ROM of the midtarsal joint (CaMi; R = 0.19) and positive correlation with transverse-plane ROM of tarsometatarsal joint (MiMe, R = 0.26). Diabetes duration showed significant correlation with sagittal plane ROM of the midtarsal joint (CaMi; R = 0.28).
3.2. Effect of Diabetes Type on Foot Joint ROM and Gait Kinematics
According to a post hoc power analysis (G*Power 3.1, [36]), the sample size in each group was enough to reach a power greater than 0.8 for all ROM variables. ANCOVA analysis revealed several significant differences in ROM between diabetes type 1, type 2 and controls by accounting for the effect of normalized walking speed, age and BMI (Table 3). In the sagittal plane, the midtarsal and tarsometatarsal joints and the metatarsus to calcaneus rotation presented significantly lower ROM in type 1 and type 2 with respect to controls (p < 0.05). Reduction in ROM in both type 1 and type 2 was also observed at ShFo in the sagittal and transverse planes.
Table 3.
Mean and standard deviation of foot joints ROM [deg] in stance in type 1, type 2 and control groups. The last column is reporting the ANCOVA statistically significant differences between groups using walking speed, BMI, disease duration as covariates.
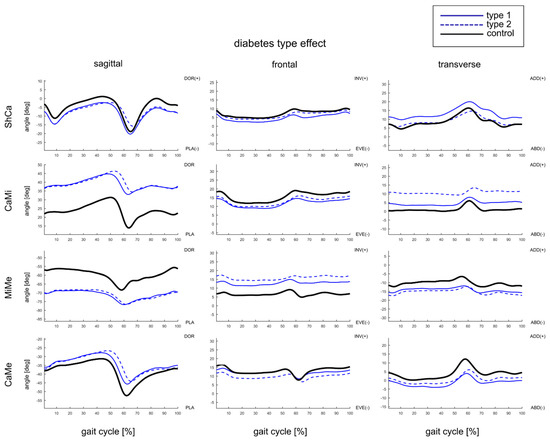
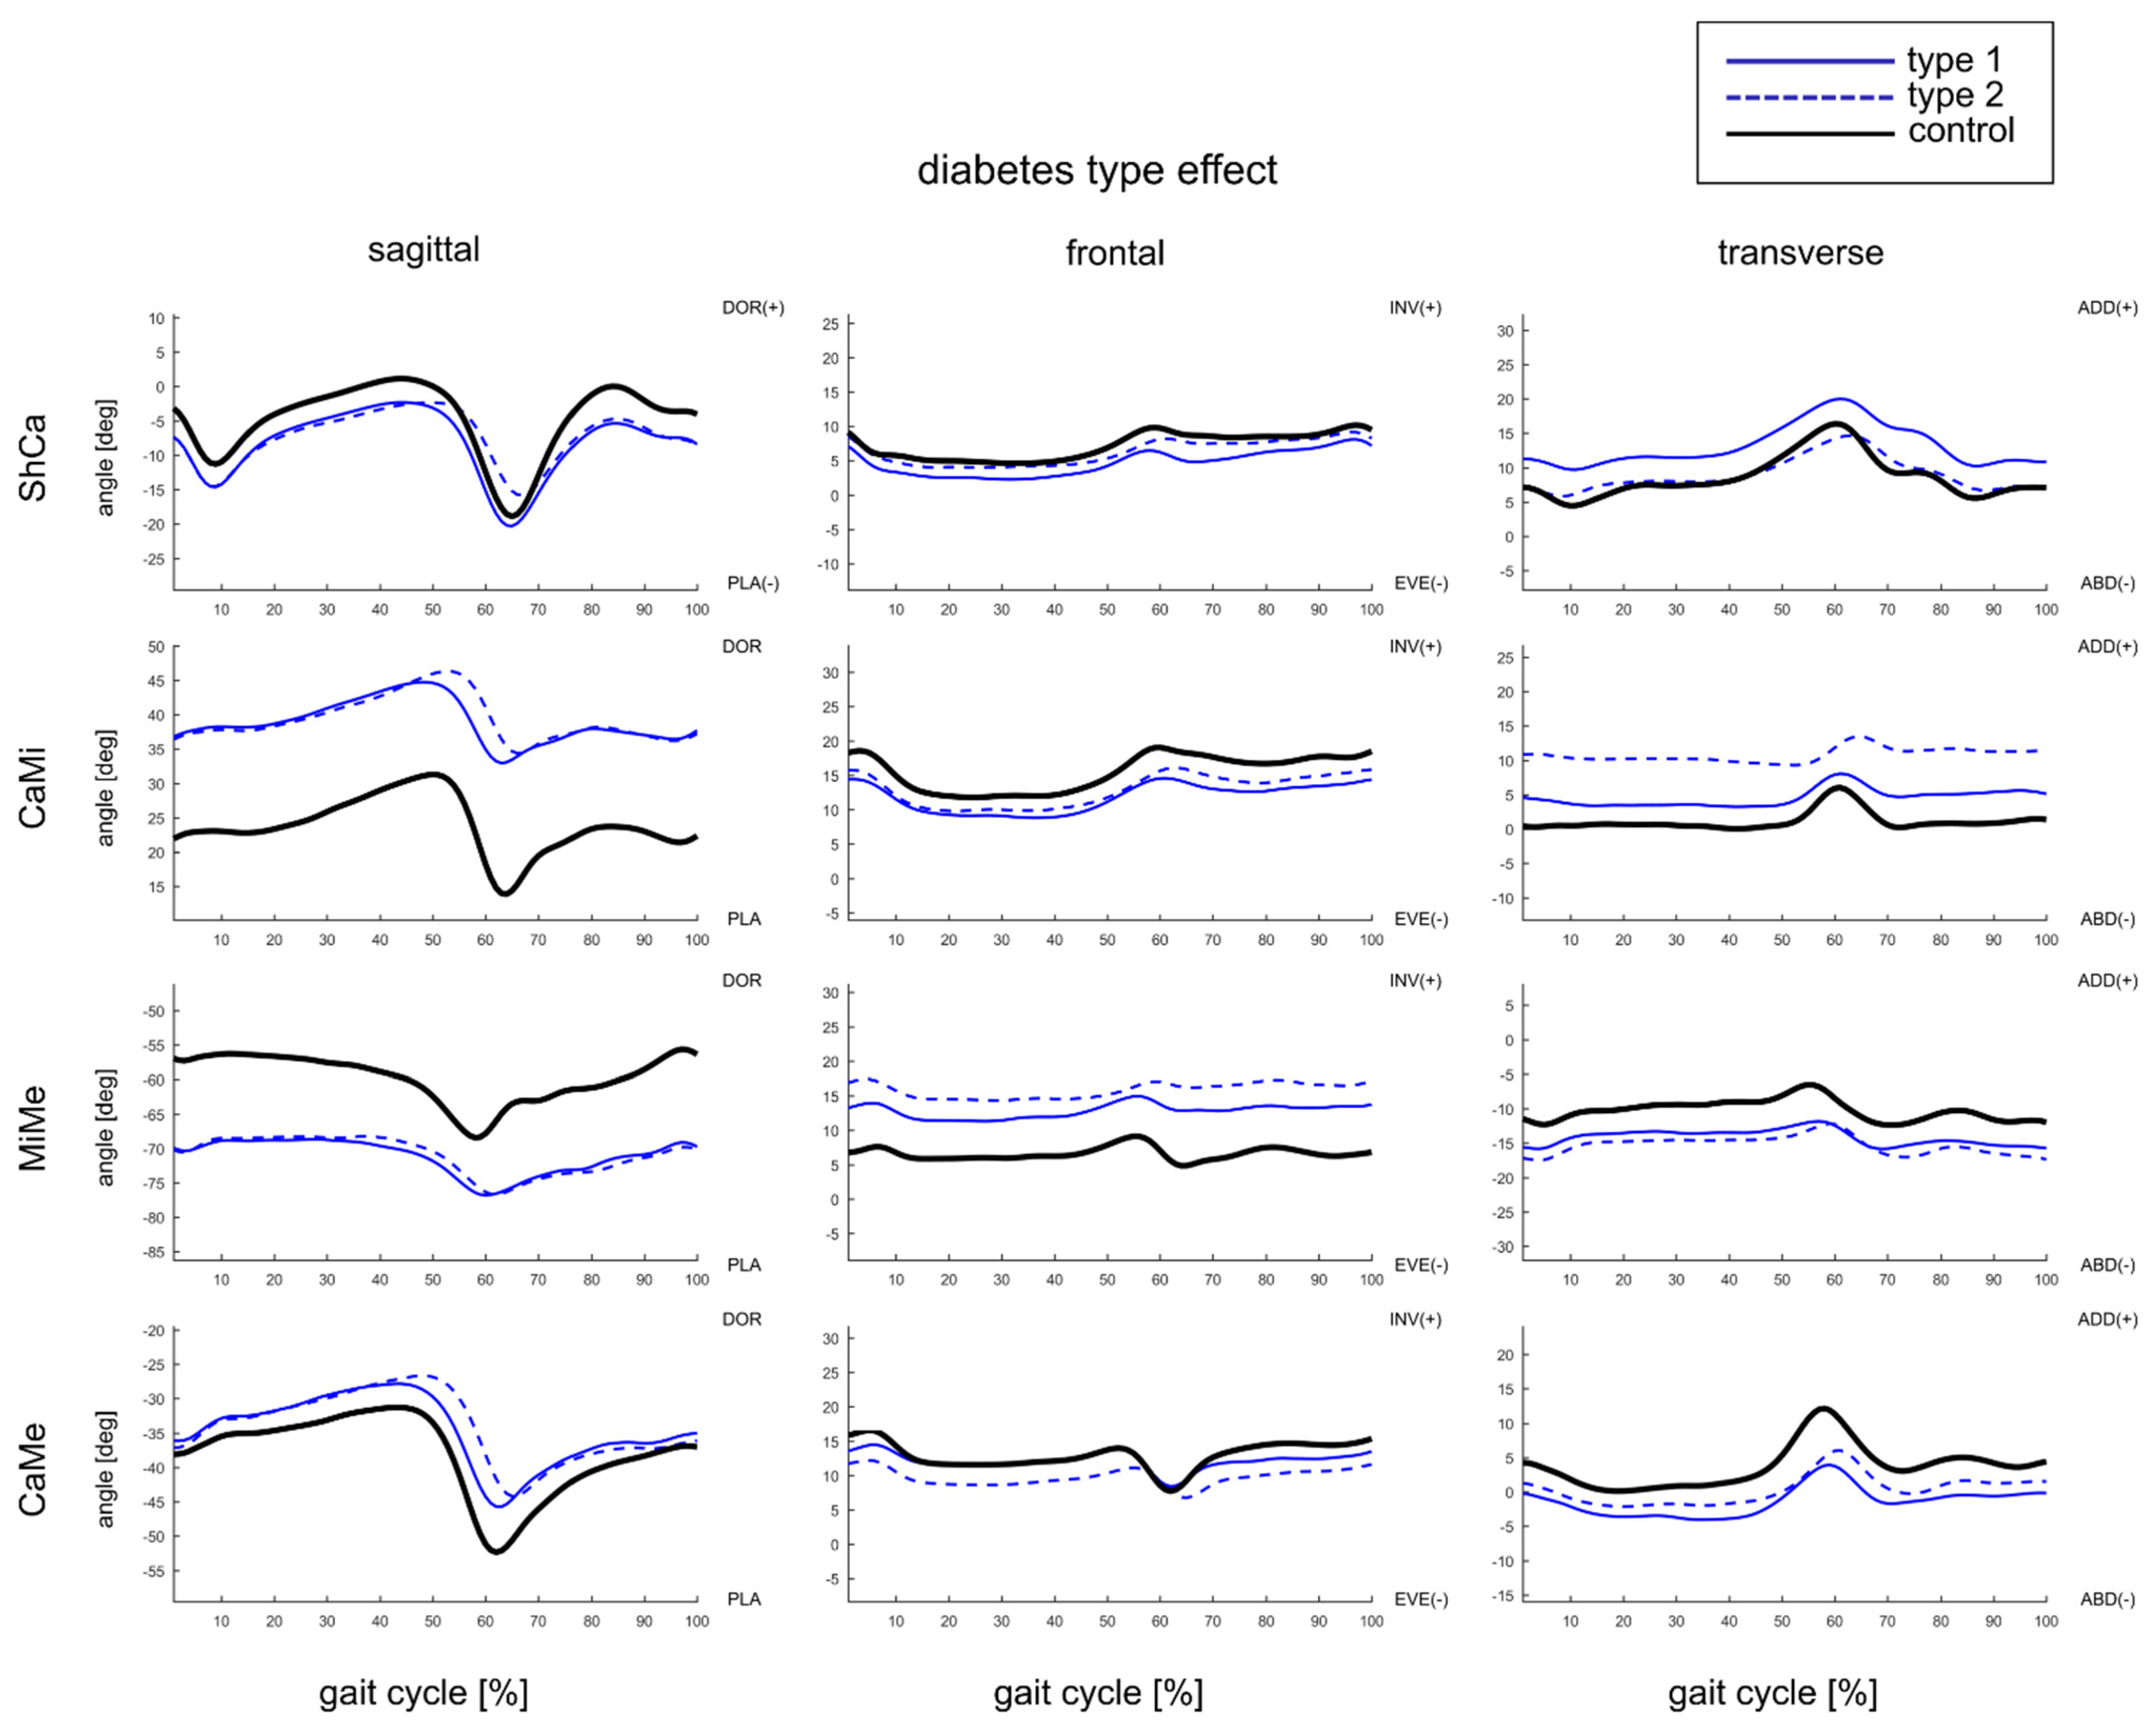
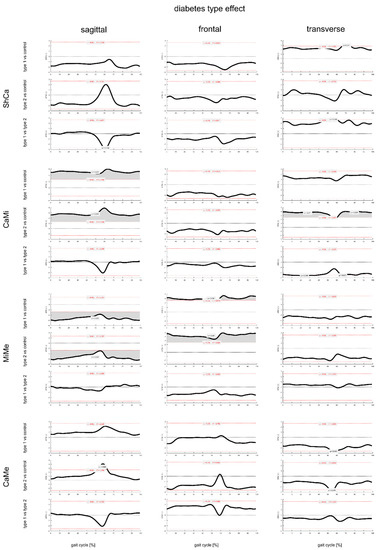
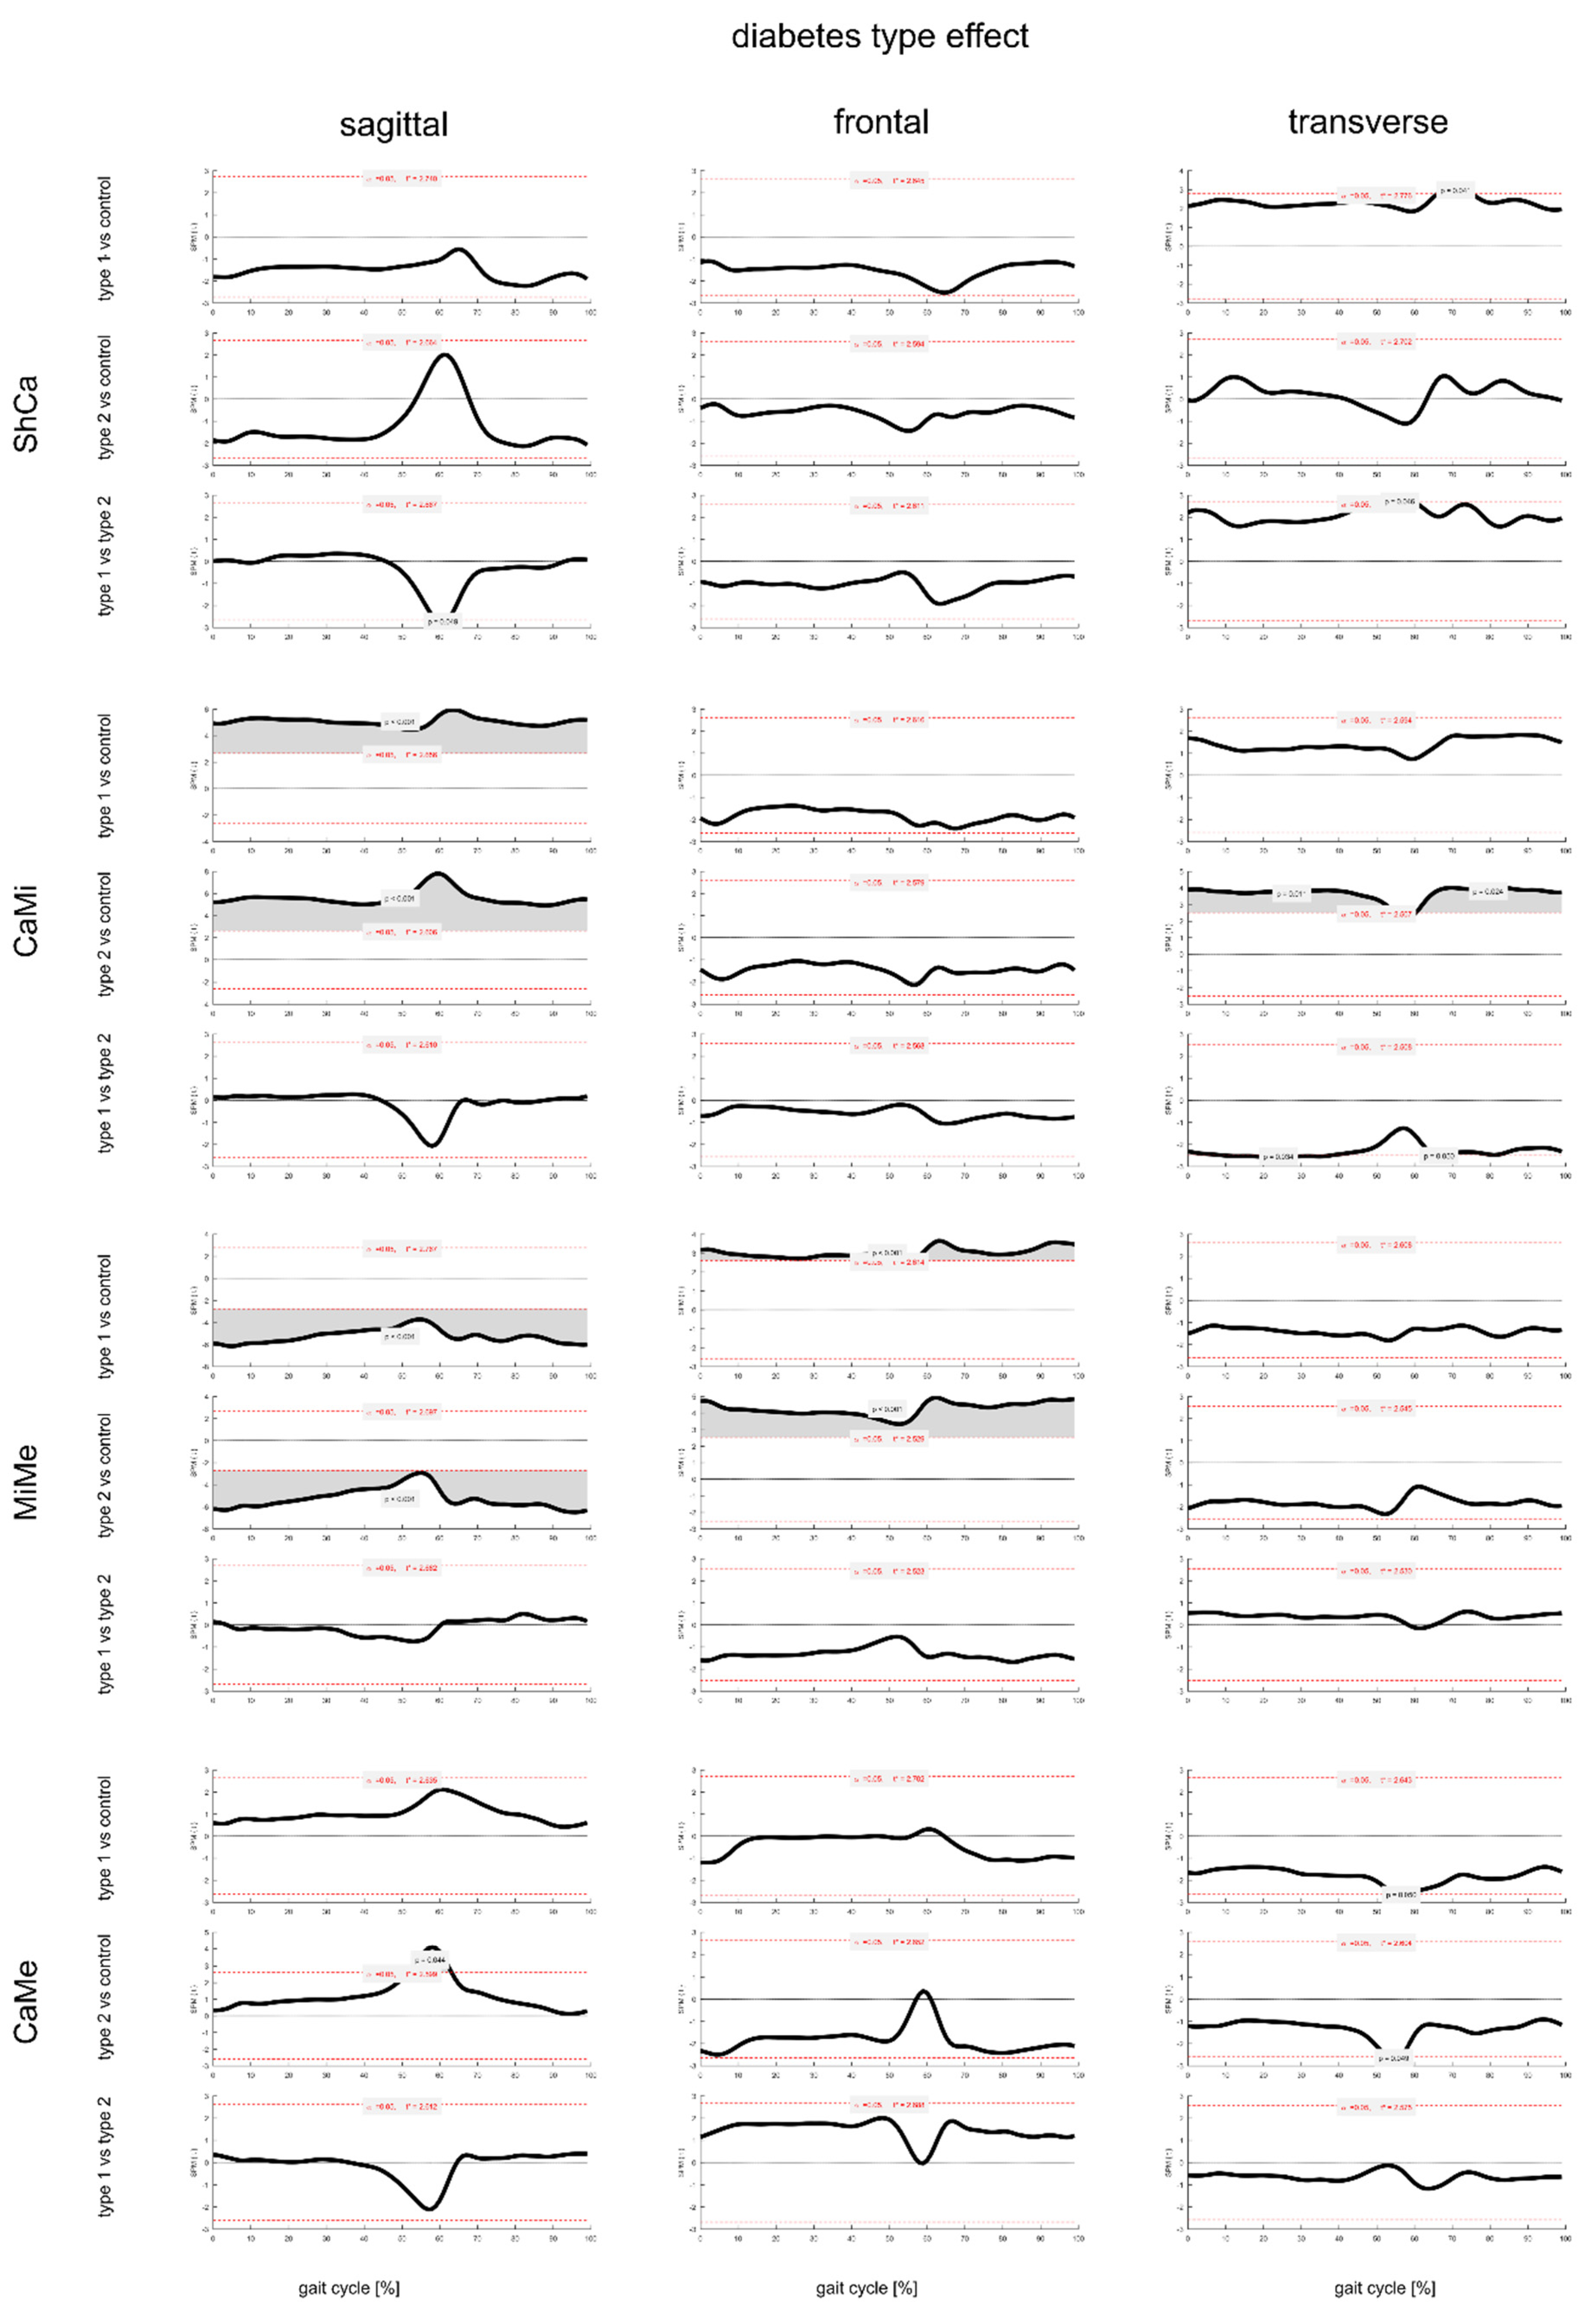
Regarding the SPM analysis, while some offsets were observed between groups, most foot joints had similar temporal patterns of rotations across the whole population for most of the normalized gait cycle (Figure 2 and Figure 3). In the sagittal plane, at the ankle joint (ShCa), one supra-threshold cluster (60% of gait cycle) was lower than the critical threshold of −2.667 as feet of type 1 were more plantarflexed than those in type 2. The probability that a supra-threshold cluster of this size would be observed in repeated random samplings was significant (p = 0.049).
Figure 2.
Mean temporal profiles of foot joint rotations [deg] normalized to gait cycle duration across all trials of type 1 (continuous blue line) and type 2 diabetes (dashed blue line), and control subjects (continuous black line). Top to bottom, rotation in the three anatomical planes between calcaneus and shank (ShCa), midfoot and calcaneus (CaMi), metatarsus and midfoot (MiMe), and metatarsus and calcaneus (CaMe). Left to right, rotations in the sagittal, frontal and transverse planes according to the axes of each joint coordinate system.
Figure 3.
Outcomes of the SPM two-tailed paired t-tests which allowed to identify supra-threshold clusters of SPM (t) for the pairwise comparisons between temporal profiles of joint rotations in type 1, type 2 and control groups. Time intervals of statistically significant differences (p < 0.05) between groups are shown in grey.
The midtarsal joints of type 1 and type 2 were more dorsiflexed across the whole gait cycle than those in control. Conversely, the tarsometatarsal joint was more plantarflexed than in controls across the whole gait cycle. As to the metatarsus to calcaneus (CaMe) sagittal plane rotation, one supra-threshold cluster (50–65% of gait cycle) exceeded the critical threshold of 2.599 as the CaMe pair in type 2 was significantly more dorsiflexed than that in control (p = 0.044). The tarsometatarsal joint in type 1 and type 2 was significantly more inverted than that in controls throughout the whole gait cycle. As to the metatarsus to calcaneus frontal-plane rotation, one supra-threshold cluster (55–65% of gait cycle) exceeded the critical threshold and the CaMe angle in type 2 was significantly more everted than that in controls (p < 0.05). In the transverse plane, one supra-threshold cluster (65–75% of gait cycle) exceeded the critical threshold and the ankle in type 1 was significantly more adducted than in controls (p = 0.041); the ankle of type 1 was also significantly more adducted than in type 2 at 50–60% of gait cycle (p = 0.046). The midtarsal joint of type 2 was significantly more adducted than in controls for most of the gait cycle; the midtarsal joint of type 2 was overall more adducted than in type 1 with two clusters exceeding the threshold. As to the metatarsus to calcaneus transverse-plane rotation, both type 1 and type 2 were more abducted than controls at 50–60% of gait cycle (p = 0.050; p = 0.049).
3.3. Effect of DPN on Foot Joints ROM and Gait Kinematics
ANCOVA analysis revealed several significant differences in ROM between DPN, non-DPN and controls by accounting also for the effect of normalized walking speed, age and BMI (Table 4). In the sagittal plane, the midtarsal and tarsometatarsal joints and the metatarsus to calcaneus rotation had significantly lower ROM in DPN and non-DPN with respect to controls (p < 0.05). While no significant differences were observed between DPN and non-DPN, frontal-plane ROM of the midtarsal joint in non-DPN was significantly lower than control. The metatarsus to calcaneus transverse-plane rotation presented significantly lower ROM in DPN and non-DPN with respect to controls (p < 0.01). A reduction in motion in DPN and non-DPN was also observed between leg and foot in the sagittal and transverse planes.
Table 4.
Mean and standard deviation of foot joints ROM [deg] in stance in neuropathic (DPN), non-neuropathic (non-DPN) and control groups.
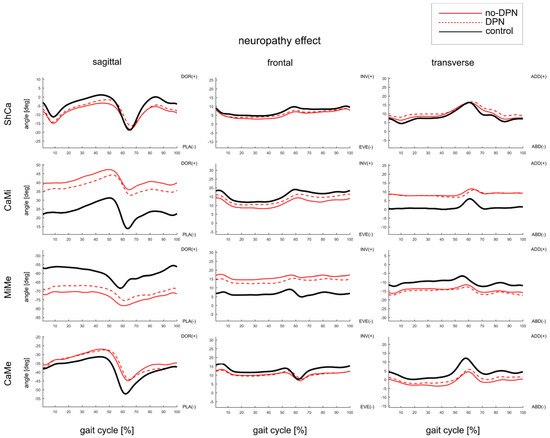
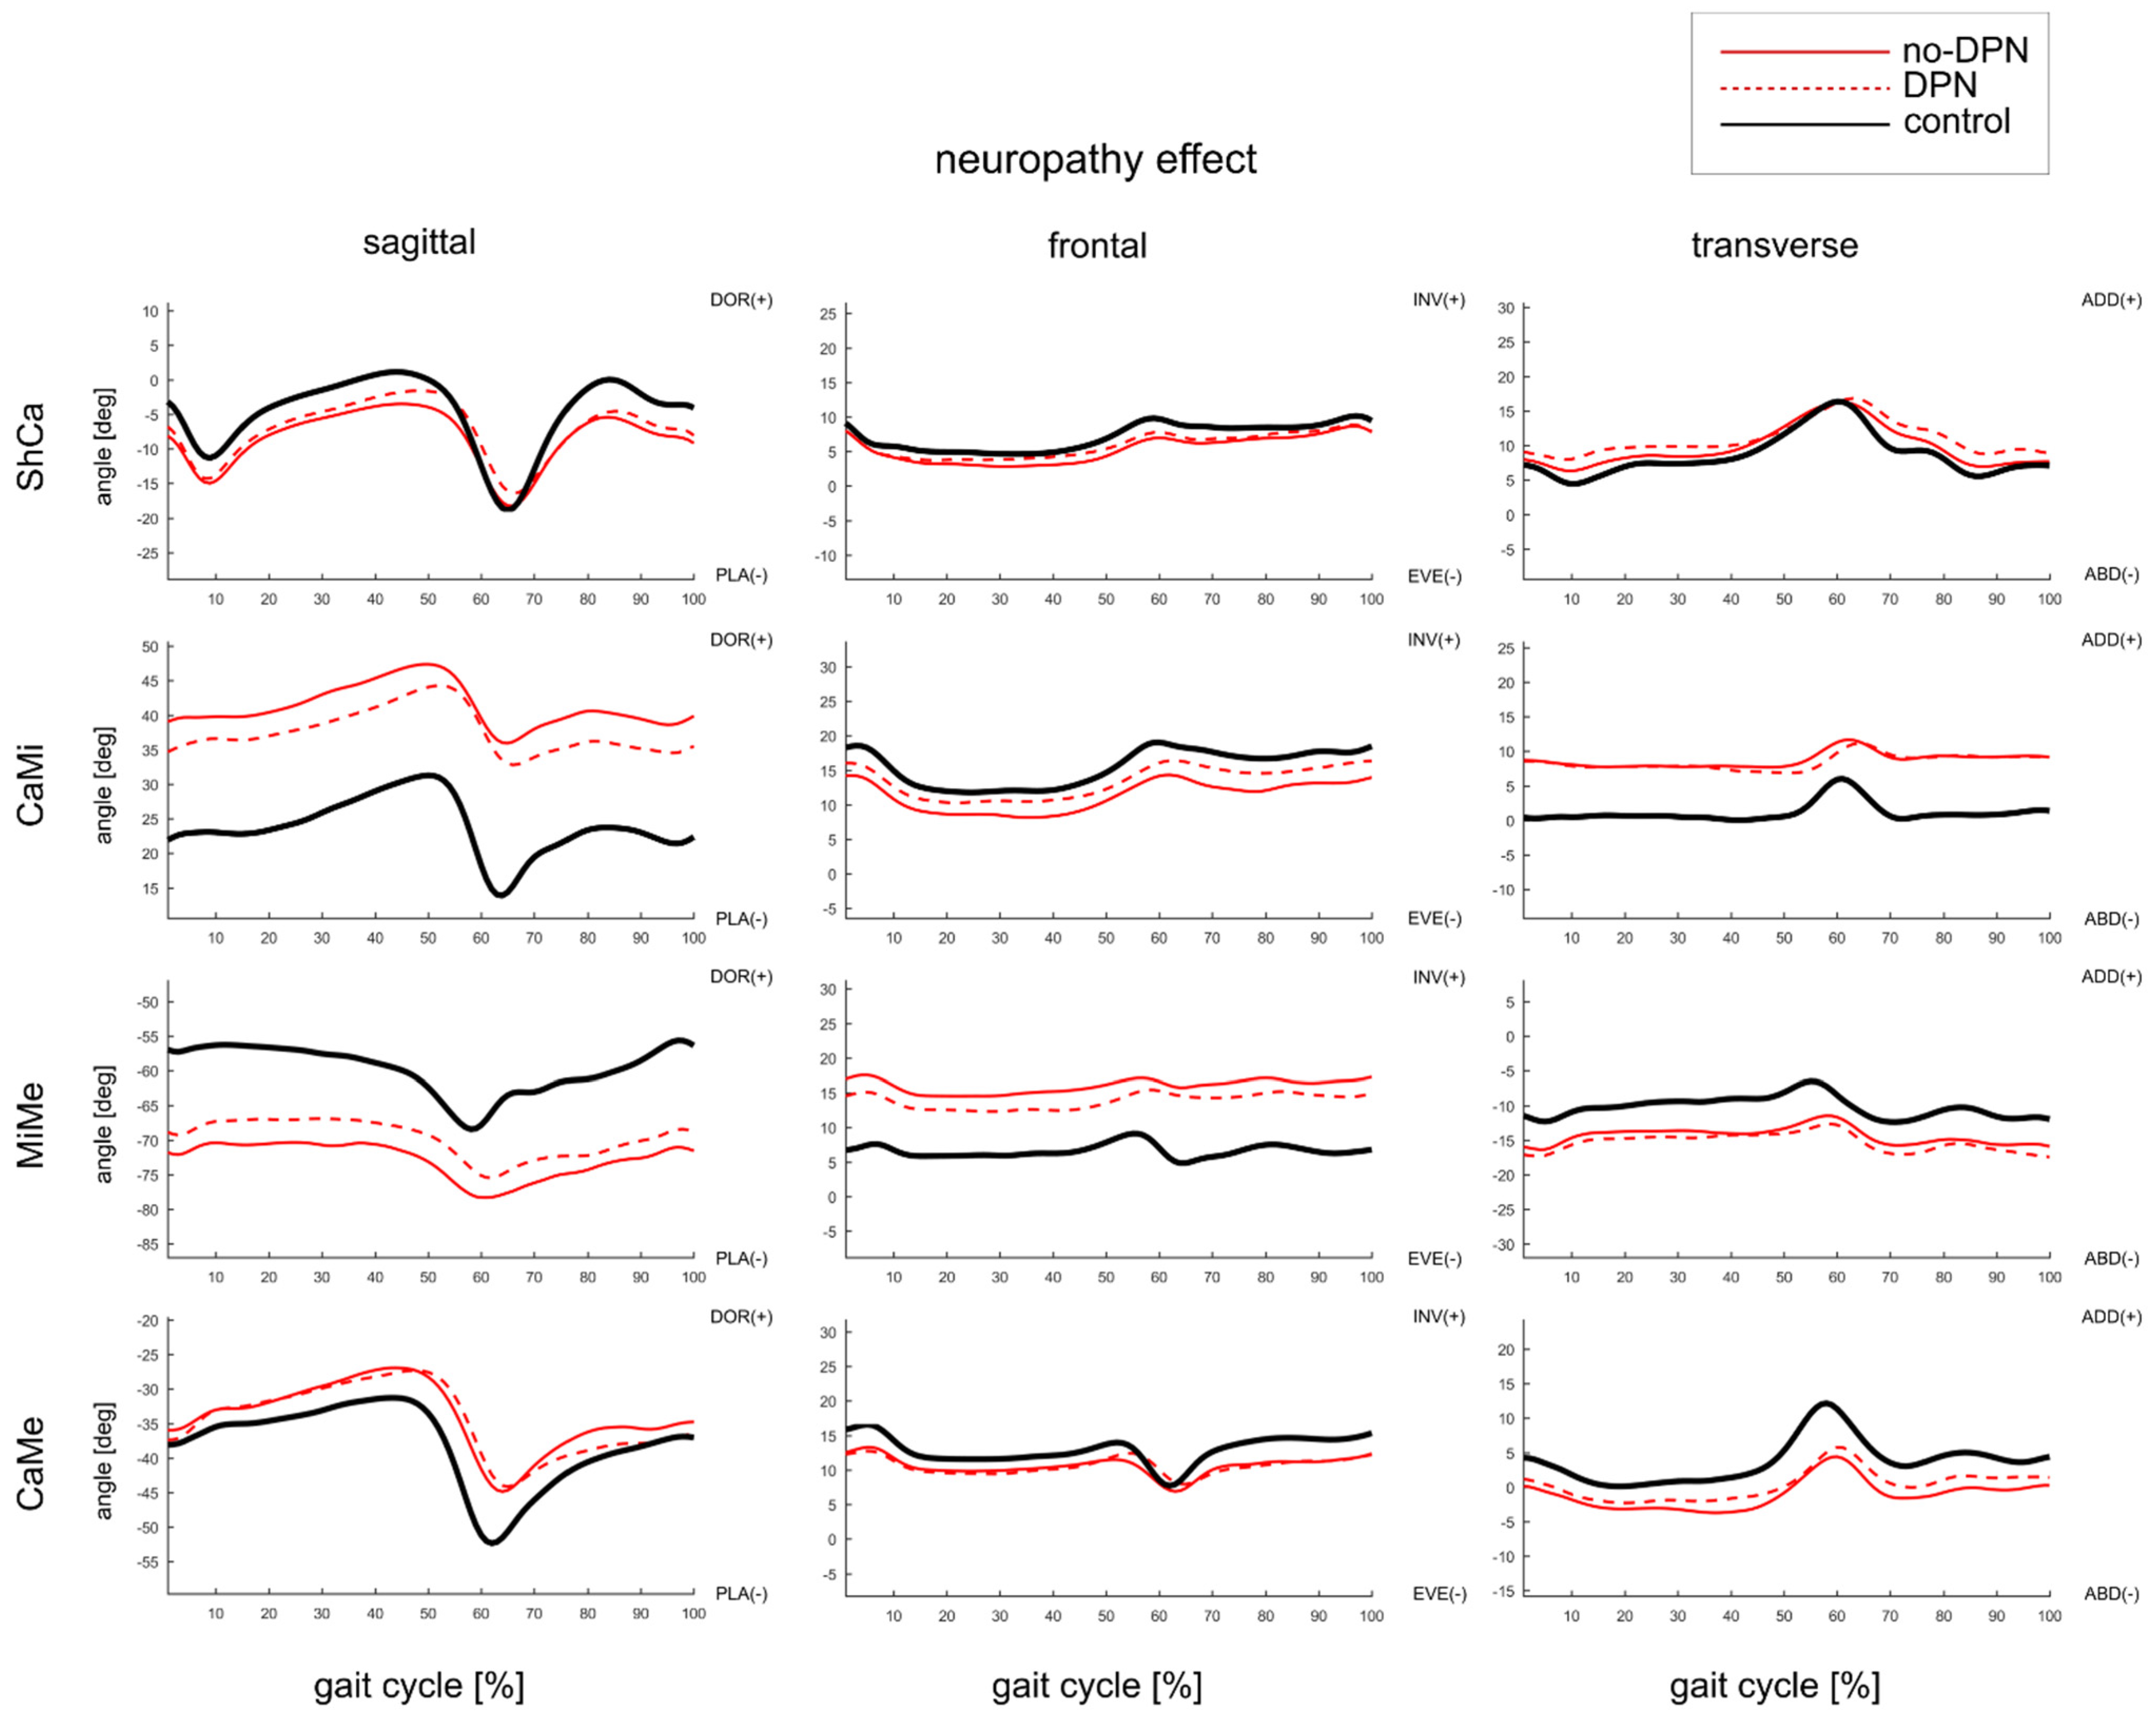
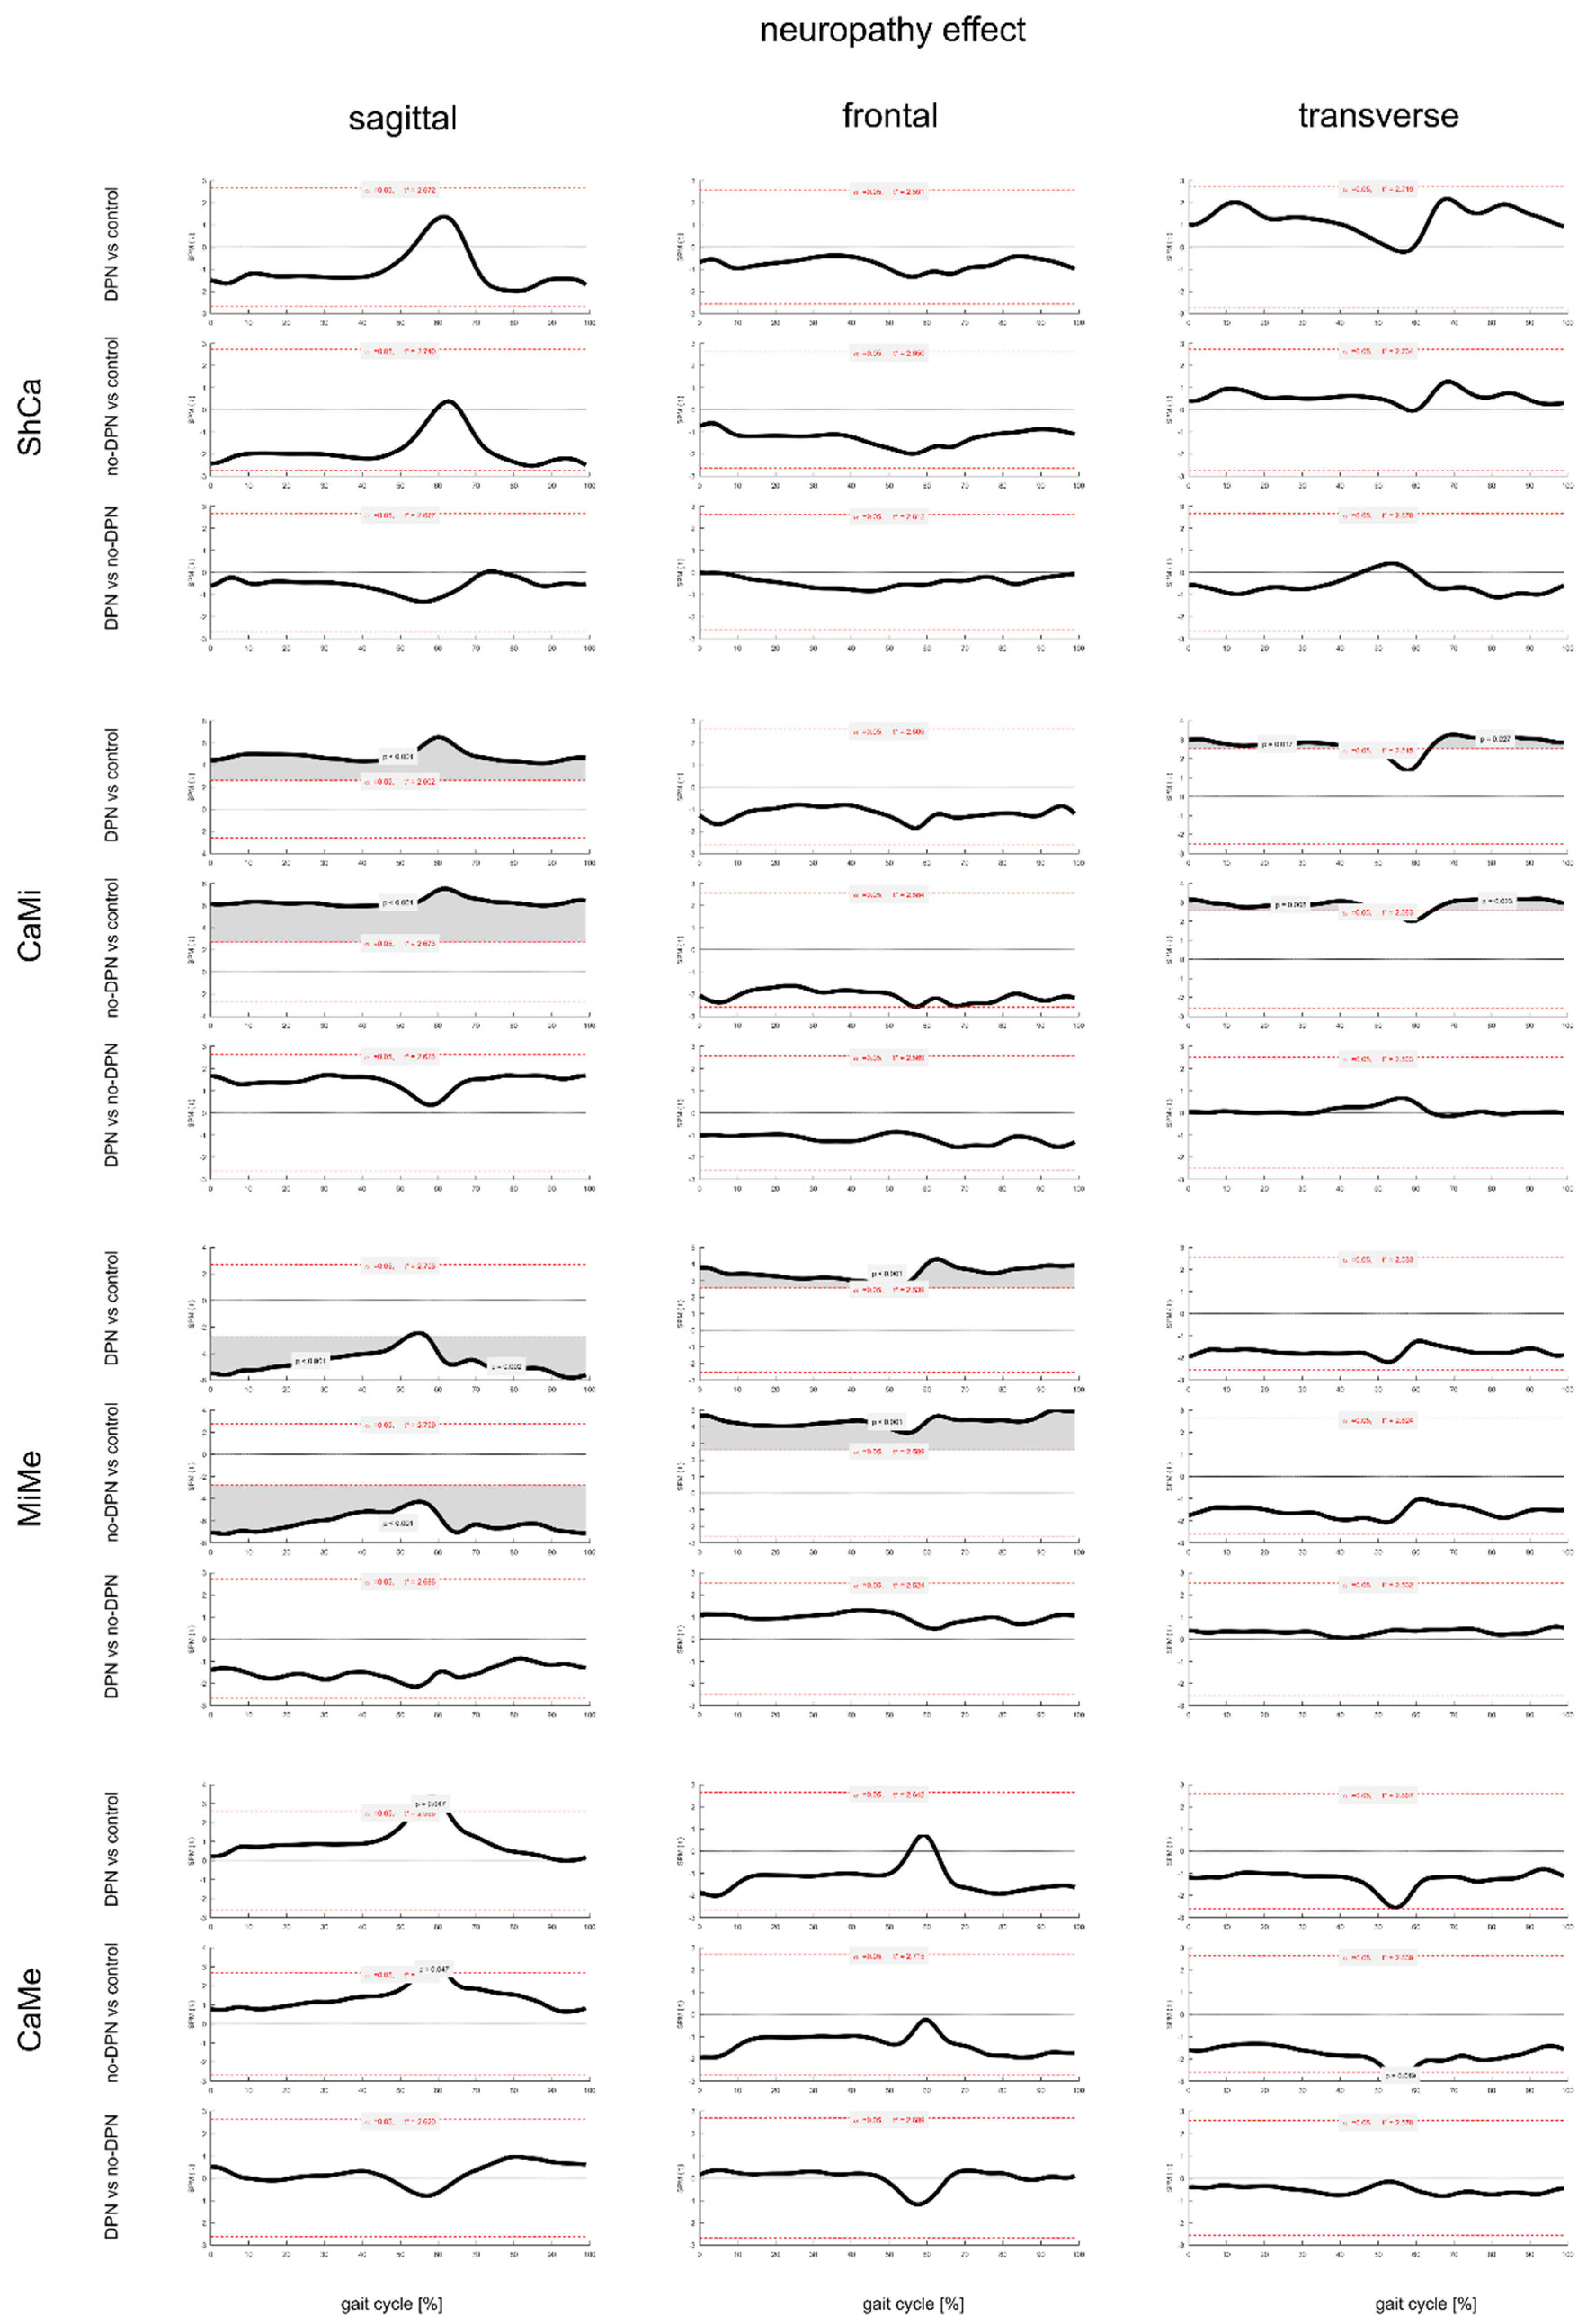
Regarding the SPM analysis, while some offset was present between groups, most foot joints had similar temporal patterns of rotations across DPN, non-DPN and control subjects for most of the normalized gait cycle (Figure 4 and Figure 5). In the sagittal plane, DPN and non-DPN midtarsal joint was more dorsiflexed across the whole gait cycle with respect to controls (p < 0.001). Conversely, the tarsometatarsal joint was more plantarflexed across the whole gait cycle. As to the metatarsus to calcaneus sagittal plane rotation, one supra-threshold cluster (55–65% of gait cycle) exceeded the critical threshold as the CaMe pair in both DPN and non-DPN was significantly more dorsiflexed than in controls (p < 0.05). In the frontal plane, the tarsometatarsal joint of DPN and non-DPN was significantly more inverted than in controls throughout the whole gait cycle (p < 0.001). In the transverse plane, the midtarsal joint of both DPN and non-DPN was significantly more adducted than in controls for most of the gait cycle.
Figure 4.
Mean temporal profiles of foot joint rotations [deg] normalized to gait cycle duration across all trials of neuropathic (DPN, continuous red line), non-neuropathic (non-DPN, dashed red line) and control subjects (continuous black line). Top to bottom, rotation in the three anatomical planes between calcaneus and shank (ShCa), midfoot and calcaneus (CaMi), metatarsus and midfoot (MiMe) and metatarsus and calcaneus (CaMe). Left to right, rotations in the sagittal, frontal and transverse planes according to the axes of each joint coordinate system.
Figure 5.
Outcomes of the SPM two-tailed paired t-tests which allowed to identify supra-threshold clusters of SPM (t) for the pairwise comparisons between temporal profiles of joint rotations in neuropathic (DPN), non-neuropathic (non-DPN) and control. Time intervals of statistically significant differences (p < 0.05) between groups are shown in grey.
4. Discussion
This study is part of a larger investigation on the effects of diabetes and DPN on foot and ankle biomechanics. Deeper understanding of multisegment foot kinematics in people with diabetes may help understanding the multiple alterations in foot biomechanics which likely occur at a later stage of the disease, as well as driving early rehabilitation treatments. The present investigation focused on the effect of diabetes type and DPN on multisegment foot kinematics by accounting for some of the main independent variables that may affect outcome. In agreement with previous kinematic investigations [17,20,21,22], foot joints of participants with diabetes showed restricted ROM in gait compared with healthy controls, but some differences were also found between type 1 and type 2 diabetes.
This is the one of the few studies reporting multisegment foot kinematics on a rather large population with diabetes which were grouped by diabetes type and by the presence of DPN. In a previous effort by the present authors, several correlations were found between foot morphological parameters, such a decreased metatarsal bone distance from the floor and segments inclination, with respect to plantar-load parameters [37]. To the best of our knowledge, the effects of covariates on foot joints ROM were not accounted for in previous studies thus limiting those investigations to the analysis of populations matched by age or BMI. According to the present dataset, BMI, age and normalized walking speed are significantly correlated to foot joints ROM in gait, albeit most correlation coefficients were small. In particular, age was positively correlated to reduced ROM at several foot joints, which may be associated with the onset of arthritis and the reduced joint distance in the older population [38]. On the contrary, normalized walking speed was correlated to increased ROM at several foot joints. This can be explained by the observed increased stride length (Table 2), which may result in larger joint excursions, at least in the sagittal plane.
Participants with diabetes, regardless of its type and the presence of DPN, exhibited reduced sagittal plane ROM at several foot joints with respect to control. The significant reduced ROM was observed by accounting for the reduction in normalized walking speed in the groups with diabetes. Albeit not statistically significant at the ankle joint complex (ShCa), similar to what was reported previously [18,21], DPN was associated with decreased ROM between shank and foot and at the midtarsal joint. Significant reduction in sagittal plane ROM was also observed at the tarsometatarsal joint. This reduced motion may be consequence of altered mechanical properties of tendons [39,40], of increased stiffness of plantar soft tissues [41] and of bone and joint disorganization [42] due to diabetes and DPN.
While, in general, the patterns of joints rotations were similar between groups with diabetes and control throughout the gait cycle, one-dimensional SPM revealed some differences in joints kinematics. This was more significant for the temporal profiles of the midtarsal and tarsometatarsal joints which presented significant offsets with respect to the controls. With respect to the control group, the dynamic posture of the midfoot in participants with type 1 and type 2 diabetes resulted more dorsiflexed to the calcaneus, whereas the metatarsus was more plantarflexed and inverted to the midfoot. In addition, participants with type 2 diabetes presented larger adduction of the midfoot to the calcaneus with respect to both control and type 1 for large parts of the gait cycle. These aspects would require additional investigations to be fully unraveled.
Both DPN and non-DPN subgroups showed significant kinematic alterations at the distal foot joints. With respect to the control group, the dynamic posture of the DPN and non-DPN midfoot resulted more dorsiflexed to the calcaneus, whereas the metatarsus was more plantarflexed and inverted to the midfoot. The midfoot was also significantly more adducted to the calcaneus across all gait cycle in both non-DPN and DPN groups.
The analysis of the effect of the diabetes type and of DPN on foot kinematics in gait helped reveal significant postural alterations of the midfoot joints with respect to those in the control group. The alterations of the midtarsal joint were present in all diabetes and DPN subgroups and appeared to be almost fully compensated by equal and opposite postural alterations of the tarsometatarsal joint, or vice versa. In fact, the temporal patterns of rotation between metatarsus and calcaneus—which span midtarsal and tarsometatarsal joints and thus represent the overall foot posture—were within control values for large parts of the gait cycle. These differed from the control at push-off (around 60% of the gait cycle) by showing increased dorsiflexion of the metatarsus in all diabetes and DPN subgroups (bottom of Figure 2, Figure 3, Figure 4 and Figure 5). Reduced plantarflexion of the metatarsus at push-off may point to an altered windlass mechanism which does not seem to be consequence of a decreased stretching action of the MTPj pulley on the plantar fascia [30] (see Table 2 and Table 3). Increased thickness of the Achilles tendon and of the plantar fascia, and/or reduced activity of the intrinsic foot muscles acting on the medial arch [27], may be responsible for a decreased tension in the arch at push-off, and thus to a more dorsiflexed posture of metatarsus segment, in the participants with diabetes [43].
The results of this study should be interpreted considering some limitations. While the inter-trial variability of foot joint kinematics in gait using the Rizzoli Foot Model was shown to be high (about 1 deg), with slightly lower inter-session variability (about 4 deg) [44,45], it should be highlighted that accuracy of skin marker-based measurements can be affected by large errors due to skin-motion artefacts. This error, albeit difficult to quantify, can be considered consistent across subjects performing the same task and instrumented by the same experienced examiner. However, since this error is consequence of the relative movement between skin and underlying bony landmark, this could be affected by the dry and stiffer skin present in people with diabetes, and thus may differ to that of controls. While age, BMI and walking speed showed some correlations—albeit small—with foot joint ROM, the comparisons of temporal patterns of joint kinematics between groups with diabetes and controls did not account for the effect of these covariates. Last, while the post hoc power analysis confirmed that the size of each group was enough for the ANCOVA testing, a more even sample size between groups should be sought to minimize type I errors.
5. Conclusions
BMI, age and walking speed correlated with foot joints ROM in different populations with diabetes and DPN. Diabetes, after accounting for the effect of these covariates and regardless of DPN, is responsible for reduced ROM at several foot joints during gait. In addition, diabetes significantly affects the temporal patterns of foot joint motion especially at the midtarsal and tarsometatarsal joints. The alterations of the midtarsal joint affecting all diabetes and DPN subgroups should be considered in rehabilitation strategies including foot and mobility-related exercises that were recently included in the Guidelines of the International Working Group on Diabetic Foot—IWGDF [46]—as preventive action for foot ulcers.
Author Contributions
Conceptualization, P.C., C.G., G.L., G.M., L.B. (Lisa Berti) and A.L.; methodology, P.C., C.G. G.L., L.B. (Lisa Berti) and A.L.; software, P.C. and M.O.; validation, P.C., C.G., M.O. and I.C.N.S.; formal analysis, P.C. and I.C.N.S.; investigation, P.C., C.G., G.M., L.B. (Luca Baccolini), G.L., M.O. and L.B. (Lisa Berti); resources, C.G., L.B. (Luca Baccolini), G.M., and A.L.; data curation, P.C., I.C.N.S. and M.O.; writing—original draft preparation, P.C. and I.C.N.S.; writing—review and editing, P.C., C.G., G.L., G.M., L.B. (Luca Baccolini), I.C.N.S., L.B. (Lisa Berti) and A.L.; visualization, P.C., C.G., L.B. (Lisa Berti), G.L. and A.L.; supervision, C.G. and A.L.; Project administration, C.G. and A.L.; funding acquisition, A.L. All authors have read and agreed to the published version of the manuscript.
Funding
This research was funded by Ministero della Sanità (Italy), 5x1000 grant program. I.C.N.S. is supported by CNPq (Process 304124/2018-4) as fellow researcher.
Institutional Review Board Statement
The study was conducted according to the guidelines of the Declaration of Helsinki and approved by the Ethics Committee of Istituto Ortopedico Rizzoli (protocol code IOR 7685, 28 July 2017).
Informed Consent Statement
Informed consent was obtained from all subjects involved in the study.
Data Availability Statement
Data are owned by the IRCCS Istituto Ortopedico Rizzoli, the Italian National Institute of Health, and the IRCCS-Azienda Ospedaliera di Bologna Policlinico Sant’Orsola-Malpighi. Request to use, share and disseminate such data must be sent to alberto.leardini@ior.it.
Conflicts of Interest
The authors declare no conflict of interest.
References
- Lazzarini, P.A.; Pacella, R.E.; Armstrong, D.G.; Van Netten, J.J. Diabetes-related lower-extremity complications are a leading cause of the global burden of disability. Diabet. Med. J. Br. Diabet. Assoc. 2018, 35, 1297–1299. [Google Scholar] [CrossRef] [Scilit]
- Federation, I.D. IDF Diabetes Atlas; International Diabetes Federation: Brussels, Belgium, 2019. [Google Scholar]
- Monteiro-Soares, M.; Boyko, E.; Ribeiro, J.; Dinis-Ribeiro, M. Predictive factors for diabetic foot ulceration: A systematic review. Diabetes/Metabolism Res. Rev. 2012, 28, 574–600. [Google Scholar] [CrossRef] [Scilit]
- Tesfaye, S.; Boulton, A.J.M.; Dyck, P.J.; Freeman, R.; Horowitz, M.; Kempler, P.; Lauria, G.; Malik, R.; Spallone, V.; Vinik, A.; et al. Diabetic Neuropathies: Update on Definitions, Diagnostic Criteria, Estimation of Severity, and Treatments. Diabetes Care 2010, 33, 2285–2293. [Google Scholar] [CrossRef] [Scilit] [PubMed]
- Andersen, H.; Gjerstad, M.D.; Jakobsen, J. Atrophy of Foot Muscles: A measure of diabetic neuropathy. Diabetes Care 2004, 27, 2382–2385. [Google Scholar] [CrossRef] [Scilit] [PubMed]
- Andreassen, C.S.; Jakobsen, J.; Andersen, H. Muscle Weakness: A Progressive Late Complication in Diabetic Distal Symmetric Polyneuropathy. Diabetes 2006, 55, 806–812. [Google Scholar] [CrossRef] [Scilit]
- Cheuy, V.; Hastings, M.; Commean, P.K.; Ward, S.R.; Mueller, M.J. Intrinsic foot muscle deterioration is associated with metatarsophalangeal joint angle in people with diabetes and neuropathy. Clin. Biomech. 2013, 28, 1055–1060. [Google Scholar] [CrossRef] [Scilit]
- Mahieu, R.; Coenen, M.; van Bemmel, T.; van der Zaag-Loonen, H.; Theuvenet, W. Detecting intrinsic muscle weakness of the hallux as an addition to early-stage screening of the feet in patients with diabetes. Diabetes Res. Clin. Pr. 2016, 119, 83–87. [Google Scholar] [CrossRef] [Scilit]
- Gomes, A.A.; Onodera, A.N.; Otuzi, M.E.; Pripas, D.; Mezzarane, R.A.; Sacco, I.C. Electromyography and kinematic changes of gait cycle at different cadences in diabetic neuropathic individuals. Muscle Nerve 2011, 44, 258–268. [Google Scholar] [CrossRef] [Scilit]
- Sacco, I.; Hamamoto, A.; Gomes, A.; Onodera, A.; Hirata, R.; Hennig, E. Role of ankle mobility in foot rollover during gait in individuals with diabetic neuropathy. Clin. Biomech. 2009, 24, 687–692. [Google Scholar] [CrossRef] [Scilit] [PubMed]
- Salsich, G.B.; Brown, M.; Mueller, M.J. Relationships between Plantar Flexor Muscle Stiffness, Strength, and Range of Motion in Subjects With Diabetes-Peripheral Neuropathy Compared to Age-Matched Controls. J. Orthop. Sports Phys. Ther. 2000, 30, 473–483. [Google Scholar] [CrossRef] [Scilit] [PubMed]
- Sinacore, D.R.; Gutekunst, D.J.; Hastings, M.K.; Strube, M.J.; Bohnert, K.L.; Prior, F.W.; Johnson, J.E. Neuropathic midfoot deformity: Associations with ankle and subtalar joint motion. J. Foot Ankle Res. 2013, 6, 11. [Google Scholar] [CrossRef] [Scilit]
- Armstrong, D.G.; Boulton, A.J.M.; Bus, S.A. Diabetic Foot Ulcers and Their Recurrence. N. Engl. J. Med. 2017, 376, 2367–2375. [Google Scholar] [CrossRef] [Scilit] [PubMed]
- Murphy-Lavoie, H.M.; Ramsey, A.; Nguyen, M.; Singh, S. Diabetic Foot Infections. In StatPearls; StatPearls Publishing LLC.: Treasure Island, FL, USA, 2021. [Google Scholar]
- Giacomozzi, C.; Sartor, C.D.; Telles, R.; Uccioli, L.; Sacco, I.C.N. Ulcer-risk classification and plantar pressure distribution in patients with diabetic polyneuropathy: Exploring the factors that can lead to foot ulceration. Annali dell’Istituto Superiore di Sanità 2018, 54, 284–293. [Google Scholar] [PubMed]
- DiLiberto, F.E.; Tome, J.; Baumhauer, J.F.; Quinn, J.R.; Houck, J.; Nawoczenski, D.A. Multi-joint foot kinetics during walking in people with Diabetes Mellitus and peripheral neuropathy. J. Biomech. 2015, 48, 3679–3684. [Google Scholar] [CrossRef] [Scilit] [PubMed]
- Rao, S.; Saltzman, C.; Yack, H.J. Segmental foot mobility in individuals with and without diabetes and neuropathy. Clin. Biomech. 2007, 22, 464–471. [Google Scholar] [CrossRef] [Scilit]
- Rao, S.; Saltzman, C.L.; Yack, H.J. Relationships between segmental foot mobility and plantar loading in individuals with and without diabetes and neuropathy. Gait Posture 2010, 31, 251–255. [Google Scholar] [CrossRef] [Scilit] [PubMed]
- Sacco, I.C.; Picon, A.P.; Macedo, D.O.; Butugan, M.K.; Watari, R.; Sartor, C. Alterations in the Lower Limb Joint Moments Precede the Peripheral Neuropathy Diagnosis in Diabetes Patients. Diabetes Technol. Ther. 2015, 17, 405–412. [Google Scholar] [CrossRef] [Scilit]
- Watari, R.; Sartor, C.D.; Picon, A.P.; Butugan, M.K.; Amorim, C.F.; Ortega, N.R.S.; Sacco, I.C.N. Effect of diabetic neuropathy severity classified by a fuzzy model in muscle dynamics during gait. J. Neuroeng. Rehabil. 2014, 11, 11. [Google Scholar] [CrossRef] [Scilit]
- Deschamps, K.; Matricali, G.; Roosen, P.; Nobels, F.; Tits, J.; Desloovere, K.; Bruyninckx, H.; Flour, M.; Deleu, P.-A.; Verhoeven, W.; et al. Comparison of foot segmental mobility and coupling during gait between patients with diabetes mellitus with and without neuropathy and adults without diabetes. Clin. Biomech. 2013, 28, 813–819. [Google Scholar] [CrossRef] [Scilit]
- Sawacha, Z.; Cristoferi, G.; Guarneri, G.; Corazza, S.; Donà, G.; Denti, P.; Facchinetti, A.; Avogaro, A.; Cobelli, C. Characterizing multisegment foot kinematics during gait in diabetic foot patients. J. Neuroeng. Rehabil. 2009, 6, 37. [Google Scholar] [CrossRef] [Scilit]
- Sawacha, Z.; Gabriella, G.; Cristoferi, G.; Guiotto, A.; Avogaro, A.; Cobelli, C. Diabetic gait and posture abnormalities: A biomechanical investigation through three dimensional gait analysis. Clin. Biomech. 2009, 24, 722–728. [Google Scholar] [CrossRef] [Scilit] [PubMed]
- Fernando, D.J.; Masson, E.A.; Veves, A.; Boulton, A.J. Relationship of Limited Joint Mobility to Abnormal Foot Pressures and Diabetic Foot Ulceration. Diabetes Care 1991, 14, 8–11. [Google Scholar] [CrossRef] [Scilit] [PubMed]
- Kwon, O.-Y.; Minor, S.D.; Maluf, K.S.; Mueller, M.J. Comparison of muscle activity during walking in subjects with and without diabetic neuropathy. Gait Posture 2003, 18, 105–113. [Google Scholar] [CrossRef] [Scilit]
- Sacco, I.; Amadio, A. Influence of the diabetic neuropathy on the behavior of electromyographic and sensorial responses in treadmill gait. Clin. Biomech. 2003, 18, 426–434. [Google Scholar] [CrossRef] [Scilit]
- Bus, S.A.; Yang, Q.X.; Wang, J.H.; Smith, M.B.; Wunderlich, R.; Cavanagh, P.R. Intrinsic Muscle Atrophy and Toe Deformity in the Diabetic Neuropathic Foot: A magnetic resonance imaging study. Diabetes Care 2002, 25, 1444–1450. [Google Scholar] [CrossRef] [Scilit]
- Akashi, P.M.; Sacco, I.C.; Watari, R.; Hennig, E. The effect of diabetic neuropathy and previous foot ulceration in EMG and ground reaction forces during gait. Clin. Biomech. 2008, 23, 584–592. [Google Scholar] [CrossRef] [Scilit]
- Caravaggi, P.; Leardini, A.; Crompton, R. Kinematic correlates of walking cadence in the foot. J. Biomech. 2010, 43, 2425–2433. [Google Scholar] [CrossRef] [Scilit] [PubMed]
- Caravaggi, P.; Pataky, T.; Günther, M.; Savage, R.; Crompton, R. Dynamics of longitudinal arch support in relation to walking speed: Contribution of the plantar aponeurosis. J. Anat. 2010, 217, 254–261. [Google Scholar] [CrossRef] [Scilit] [PubMed]
- Feldman, E.; Stevens, M.J.; Thomas, P.K.; Brown, M.B.; Canal, N.; Greene, D.A. A Practical Two-Step Quantitative Clinical and Electrophysiological Assessment for the Diagnosis and Staging of Diabetic Neuropathy. Diabetes Care 1994, 17, 1281–1289. [Google Scholar] [CrossRef] [Scilit]
- Portinaro, N.; Leardini, A.; Panou, A.; Monzani, V.; Caravaggi, P. Modifying the Rizzoli foot model to improve the diagnosis of pes-planus: Application to kinematics of feet in teenagers. J. Foot Ankle Res. 2014, 7, 1–7. [Google Scholar] [CrossRef] [Scilit] [PubMed]
- Leardini, A.; Benedetti, M.G.; Berti, L.; Bettinelli, D.; Nativo, R.; Giannini, S. Rear-foot, mid-foot and fore-foot motion during the stance phase of gait. Gait Posture 2007, 25, 453–462. [Google Scholar] [CrossRef] [Scilit]
- Grood, E.S.; Suntay, W.J. A Joint Coordinate System for the Clinical Description of Three-Dimensional Motions: Application to the Knee. J. Biomech. Eng. 1983, 105, 136–144. [Google Scholar] [CrossRef] [Scilit] [PubMed]
- Pataky, T.C.; Robinson, M.A.; Vanrenterghem, J. Vector field statistical analysis of kinematic and force trajectories. J. Biomech. 2013, 46, 2394–2401. [Google Scholar] [CrossRef] [Scilit]
- Faul, F.; Erdfelder, E.; Lang, A.-G.; Buchner, A. G*Power 3: A flexible statistical power analysis program for the social, behavioral, and biomedical sciences. Behav. Res. Methods 2007, 39, 175–191. [Google Scholar] [CrossRef] [Scilit]
- Belvedere, C.; Giacomozzi, C.; Carrara, C.; Lullini, G.; Caravaggi, P.; Berti, L.; Marchesini, G.; Baccolini, L.; Durante, S.; Leardini, A. Correlations between weight-bearing 3D bone architecture and dynamic plantar pressure measurements in the diabetic foot. J. Foot Ankle Res. 2020, 13, 1–11. [Google Scholar] [CrossRef] [Scilit]
- Arnold, J.B.; Mackintosh, S.; Jones, S.; Thewlis, D. Differences in foot kinematics between young and older adults during walking. Gait Posture 2014, 39, 689–694. [Google Scholar] [CrossRef] [Scilit] [PubMed]
- A Ranger, T.; Wong, A.M.Y.; Cook, J.L.; Gaida, J.E. Is there an association between tendinopathy and diabetes mellitus? A systematic review with meta-analysis. Br. J. Sports Med. 2015, 50, 982–989. [Google Scholar] [CrossRef] [Scilit] [PubMed]
- Giacomozzi, C.; D’Ambrogi, E.; Uccioli, L.; Macellari, V. Does the thickening of Achilles tendon and plantar fascia contribute to the alteration of diabetic foot loading? Clin. Biomech. 2005, 20, 532–539. [Google Scholar] [CrossRef] [Scilit] [PubMed]
- Pai, S.; Ledoux, W.R. The compressive mechanical properties of diabetic and non-diabetic plantar soft tissue. J. Biomech. 2010, 43, 1754–1760. [Google Scholar] [CrossRef] [Scilit]
- Rogers, L.C.; Frykberg, R.G.; Armstrong, D.G.; Boulton, A.J.M.; Edmonds, M.; Van, G.H.; Hartemann, A.; Game, F.; Jeffcoate, W.; Jirkovska, A.; et al. The Charcot foot in diabetes. J. Am. Podiatr. Med Assoc. 2011, 101, 437–446. [Google Scholar] [CrossRef] [Scilit]
- D’Ambrogi, E.; Giacomozzi, C.; Macellari, V.; Uccioli, L. Abnormal foot function in diabetic patients: The altered onset of Windlass mechanism. Diabet. Med. 2005, 22, 1713–1719. [Google Scholar] [CrossRef] [Scilit] [PubMed]
- Matias, A.B.; Caravaggi, P.; Leardini, A.; Taddei, U.T.; Ortolani, M.; Sacco, I. Repeatability of skin-markers based kinematic measures from a multi-segment foot model in walking and running. J. Biomech. 2020, 110, 109983. [Google Scholar] [CrossRef] [Scilit]
- Caravaggi, P.; Benedetti, M.G.; Berti, L.; Leardini, A. Repeatability of a multi-segment foot protocol in adult subjects. Gait Posture 2011, 33, 133–135. [Google Scholar] [CrossRef] [Scilit] [PubMed]
- Bus, S.A.; Van Netten, J.J.; Hinchliffe, R.J.; Apelqvist, J.; Lipsky, B.A.; Schaper, N.C. IWGDF Editorial Board Standards for the Development and Methodology of the 2019 International Working Group on the Diabetic Foot Guidelines. Diabetes/Metabolism Res. Rev. 2020, 36. [Google Scholar] [CrossRef] [Scilit] [PubMed]

Publisher’s Note: MDPI stays neutral with regard to jurisdictional claims in published maps and institutional affiliations. |
© 2021 by the authors. Licensee MDPI, Basel, Switzerland. This article is an open access article distributed under the terms and conditions of the Creative Commons Attribution (CC BY) license (https://creativecommons.org/licenses/by/4.0/).