Article

The Impact of Effective Microorganisms on Flesh Color and Chemical Composition of Raw Potato Tubers

by
Piotr Pszczółkowski
1,
Barbara Krochmal-Marczak
2,
Barbara Sawicka
3,* and
Mateusz Pszczółkowski
4
1
Experimental Station for Cultivar Assessment of Central Crop Research Centre, Uhnin, 21-211 Dębowa Kłoda, Poland
2
Department of Food Production and Safety, Carpathian State University in Krosno, Dmochowskiego 12 Str., 38-400 Krosno, Poland
3
Department of Plant Production Technology and Commodity Science, University of Life Sciences in Lublin, Akademicka 13 Str., 20-950 Lublin, Poland
4
Staphyt Sp. z o.o. Włodawska 45 Str., 21-200 Parczew, Poland
*
Author to whom correspondence should be addressed.
Appl. Sci. 2021, 11(19), 8959; https://doi.org/10.3390/app11198959
Submission received: 25 August 2021 / Revised: 17 September 2021 / Accepted: 21 September 2021 / Published: 26 September 2021
(This article belongs to the Section Food Science and Technology)

Abstract

:
The objective of this study was to develop an innovative method of potato cultivation, with limited use of chemicals, for use in food processing. The results of the research are based on field experiments carried out between 2015 and 2017 at the Experimental Station in Parczew, Poland. The first-order factors were cultivation practices: A—standard cultivation practices with fungicides to control potato blight; and cultivation practices B, C, and D using the application of effective microorganisms (EM). The potato varieties were the second-order factor. The scope of the research included assessing the flesh color of the raw tubers and the content of dry mass, sugars and vitamin C. The color measurement of raw tubers was carried out using the CIEL *a *b* system. Cultivation methods using applications of effective microorganisms contributed significantly to the change in color brightness of the raw tuber flesh compared to the standard methods. The flesh color of the research potato cultivar tubers, their trichromatic coordinates and the reactions of potato varieties were determined according to the cultivation practices used. It was found that the brightness of the color of raw tuber flesh depends on the content of dry matter and the content of reducing sugars in the tubers.

1. Introduction

Consumers appreciate organically produced food without the use of chemicals. Organic production systems used in modern agriculture significantly reduce the use of synthetic products in plant production, but also have a significant impact on the quality and quantity of the crop yield and affect crop suitability as a raw material for processing in the food industry [1,2,3,4].
Currently, one of the most popular methods for assessing the color of plant products, which is the basis for the color management system in the processing of plant products, is the CIELab system. Although the influence of color and its importance in our lives are constantly increasing, our knowledge of color and color control is insufficient. This leads to many problems in decisions on the color of a final product or the possibilities of trade in food, especially refined products such as crisps and French fries. Because the color evaluation is performed according to human imagination and experience, it is impossible that everyone can correctly control the color using actual color standards. Hence, the CIELab system was used to assess the color of raw tuber flesh. This method uses principles of Euclidean geometry by measuring the difference in the distance between two points in the adopted color model in a three-dimensional space [5]. For classification purposes, a color can be expressed in terms of hue, lightness, and saturation (brightness). The shades form a color wheel. In the world of colors, hue is a term for the classification of red, yellow, purple, etc. Moreover, although yellow and red are two different shades, by mixing them together we obtain orange; mixing yellow and green yields yellow-green, and mixing blue and green gives blue-green. The brightness of the colors changes in a straight line. The colors can be divided into light and dark. On the other hand, the saturation changes centrifugally, i.e., in proportion to the distance from the center. Colors are muffled near the center and become more vivid as we move away from the center of the three-dimensional solid of colors [5]. Figure 1 shows the basic adjectives used to describe color brightness and saturation. This system is a perceptual, uniform, trichromatic color model, where the L* component is defined as the change in brightness of the tested sample and its values are in the range from 0 to 100%; the a* component, representing the green-red axis, denotes the hue of the color; and the b* component, representing the blue-yellow axis, denotes color saturation. Both the a* and b* components assume values ranging from −120 to 120 [5,6,7]. Thus, the color can be quantified with the scales for hues, brightness, and saturation. The notion of saturation is also defined as the maximum intensity of the color’s chromatic component under brightness—the greater the color saturation, the greater its value. The color of raw potato tuber flesh is of key importance as a quality criterion in food processing, especially for refined products (crisps, French fries). The uniform shade of the raw tuber color plays an important role in the case of the final products.
Fungicides used in protecting potatoes against Phytophthora infestans harm the quality of the potato tubers and the natural environment [8]. The substances that could partially replace fungicides in potato production include microbiological preparations, weed extracts, seaweed extracts, and Rhizobium biofertilizers [9,10,11,12]. The microbial preparations are a mixture of naturally occurring microorganisms (mainly lactic acid bacteria, yeast, photosynthetic bacteria, and some fungi). Effective microorganisms (EM) is a term denoting a set of microorganisms (bacteria, fungi, yeast and actinomycetes) naturally occurring in nature, remaining in a state of equilibrium with each other, and therefore necessary for the proper functioning of higher organisms [10,11]. The concept of EM was developed by professor Teruo Higa in Okinawa, Japan [12]. Observations of EMs in natural ecosystems laid the foundations for the so-called “EM biotechnology”.
The use of EM farming biotechnology in food processing ensures higher standards while reducing the burden of work, which leads to a significant reduction in production costs [13]. Moreover, EM cultures have high antioxidant potential. They are used in food processing for a variety of reasons, e.g., to produce pectinases used for the clarification of fruit juices or proteinases used in the processing of milk. EMs can also help process potatoes into an enriched product; hence, research has been undertaken on using EMs in the production of potatoes for food processing into refined products. This study sought to develop an innovative technology for potato cultivation useful for food processing, introducing EMs and concurrently limiting the usage of agrichemicals (mineral fertilizers and plant protection products).
The demand for safe food has been growing in Europe in recent times, leading to the search for substances (organic preparations) that could replace or partially eliminate pesticides used in plant protection. This quest is necessary because there has been a significant decrease in the number of active substances authorized for use in agriculture every year in the EU. Methods of obtaining stable potato yields, free from pesticide residues, are also being sought; this type of research is important for the end-user, the consumer, and the processing industry. This study investigated the impact of the management of EM practices in potato cultivation on the nutritional value of tubers in terms of the tendency of raw tubers to darken.
Moreover, the objective of the study was to assess potato tuber suitability for consumption and processing purposes. To this end, the influence of microbiological preparations on the genotypes and enzymatic darkening of potato tubers was determined. In addition, the study aimed to find the cultivar most suitable for food processing for refined products (French fries, chips, crisps, dumplings, etc.). The research hypothesis assumed that as a result of the action of microbiological preparations (EM) used in potato cultivation, the chemical composition of tubers would improve, which would affect the accumulation of dry matter, starch, total sugars, reducing sugars, saccharose, of biologically active compounds, and thus the antioxidant properties of potato tubers, brightening the flesh of raw tubers, which would allow them to be used in the processing technology of refined products, contrary to the null hypothesis that EMs do not significantly affect the chemical composition of potato tubers or modify the color of raw tuber flesh.

2. Materials and Methods

The test results were based on field experiments carried out in Parczew (51°38′24′′ N; 22°54′02′′ E); altitude above sea level: 148 m), in 2015–2017. Parczew is located in the mesoregion of southeastern Poland, called the West Polesie. The experiment was conducted using the method of random sub-blocks, in a split-plot design, in 3 replications, on sandy loam soil, medium or strong, of good rye complex. The primary objective was comparison of 4 cultivation practices: method A—standard cultivation practices with fungicides to control late blight of potato; and methods B, C, D—varying applications of (EM) in the potato cultivation process. Comparison of 2 potato cultivars (‘Bellarosa’ and ‘Tajfun’) was the secondary objective.

2.1. Cultivation Practices

Cultivation practice A (standard group): the 3 application timings were managed against late potato blight. All application timings were established in accordance with recommendations on the labels of each fungicide (Table 1).
In cultivation systems B, C and D, where microorganisms were used, potato tubers were drenched in a 10% solution of EmFarma™ for 5 min before planting. Then, during the potato growing season, 2 products containing EMs were used in the following amounts and doses:
Cultivation practice B—3 applications of EmFarma PlusTM and Ema5TM products at a dose of 10 dm−3 plus 1 dm−3 in 350 dm−3 ha−1 water were applied.
Cultivation practice C—5 applications of EmFarma PlusTM and Ema5TM in the amount of 10 dm−3 plus 1 dm−3 in 350 dm−3 ha−1 water were applied.
Cultivation practice D—8 applications of EmFarma PlusTM and Ema5TM products in the amount of 10 dm−3 plus 1 dm−3 in 350 dm−3 ha−1 water were applied.
No control object was included in the study due to the exceptional virulence of the stalk form of potato blight in this region, which would endanger the entire experiment and could destroy the entire potato crop.

2.2. Growing Conditions

The potatoes were planted annually in a stand after winter wheat when stubble cultivation was applied after harvesting. In the autumn, manure was applied in a dose of 30 t ha−1 and plowed in with deep plowing. In early spring, the field was dug over and harrowed, and the following mineral fertilization was applied: 100 kg N, 100 kg P2O5, and 150 kg K2O ha−1, according to the levels of these components present in the soil. All mineral fertilizers were applied in early spring, before the start of the experiment. Nitrogen was used in the form of 46% Pulrea (urea), phosphorus in the form of granular superphosphate, 19%, and potassium in the form of a potassium salt, 60%. The propagation material was C1 qualification grade.
The tubers were planted in the third week of April at a spacing of 67.5 × 37 cm. The area of plots to be harvested was 15.0 m−2. All treatments were performed following the requirements of good agricultural practice. Mechanical and chemical methods controlled weed infestation. Mechanical maintenance was applied upon the emergence of the potatoes and consisted of rolling and single dredging combined with harrowing.
Just before emergence, a herbicide that destroys dicotyledonous weeds (Dispersive Afalon 450 SC—1.5 dm−3ha−1) was applied, and the herbicide Fusilade Forte 150 EC (1.5 dm−3ha−1) was applied in the phase of 2–3 leaves of monocotyledonous weeds. After the application of herbicides, no mechanical or chemical treatments were applied to the potato plots. During the growing season, the potatoes were sprayed against the Colorado potato beetle, using the following preparations in the recommended doses: Proteus 110 OD (thiacloprid and deltamethrin) at 0.4 dm−3 ha−1, Karate Zeon 050 CS (clothianidin at 0.1 dm−3 ha−1, or Fastac 100 EC (Alfa—cypermethrin) at 0.1 dm−3 ha−1. Chemical plant protection treatments were applied using recommended thresholds for harmful pests. In the experiment, an integrated system of cultivation was used; mineral fertilization and chemical plant protection agents were applied against the Colorado potato beetle to all experimental plots, and fungicides against potato blight were used in the standard cultivation practice, because the sustainable system of agriculture allows for the use of chemical pesticides guided by indications for thresholds of the harmfulness of pathogens.
In the period of technical maturity (99 BBCH), the tubers in the early groups of cultivars were harvested with an elevator digger. After being dug up, 7 kg of potato samples were taken from each plot in triplicate, avoiding the borders. From these samples, 30–40 moderate-size potato tubers were selected to assess the color of the raw tuber flesh [14].
Their characteristics in terms of culinary suitability, resistance to viral and fungal potato diseases, and resistance to nematodes are presented in Table 2.

2.3. Characteristics of Microbiological Preparations

The bio-preparations used were Ema5TM (ProBio), EMFarmaTM, and EmFarma Plus (ProBiotics Poland). The tested EM preparations are certified and recognized as safe for the environment (EMFarma certificate no. PZH/HT-3112/2016). The certificate EMFarma No. PZH/HT—3112/2016 means that the product has been positively assessed by the Toxicology and Risk Assessment Department of the National Institute of Public Health—National Institute of Hygiene in terms of safety for people and the environment, provided that it is used in accordance with the intended use and recommendations provided on the label or in the instructions for use. The probiotic composition of EMFarmaTM is a useful mixture of bacteria that promotes the natural growth of beneficial microorganisms found in agricultural environments and is safe for people and the environment. An example of such a preparation is EM1, which has been used in agricultural practice for several years [12,15,16,17]. Allahverdiyev et al. [18] showed that EM preparations contain in their structure groups of lactic acid, nitrogen-fixing bacteria, photosynthetic bacteria, and yeasts. Lactic acid bacteria found in the digestive tracts of healthy people and animals, such as Lactobacillus plantarum, Lactobacillus casei, Lactobacillus fermentum, Lactobacillus salivarius, Lactobacillus delbrueckii, and the yeasts Saccharomyces cerevisiae, are distinguished from other microorganisms by their beneficial influence in many fields. They are used, among others, for restoration of the natural intestinal microflora, the production of functional food, and the preservation of food products. EM products are natural and do not pollute the soil. According to Boligłowa and Gleń [19] and Allahverdiyev et al. [18], effective microorganisms not only improve food with important amino acids such as lysine, valine, methionine, leucine, isoleucine, tyrosine, phenylalanine, histidine, and threonine, but also decrease gastrointestinal problems in humans and animals.
EM technology is known and used worldwide for specific purposes in the cultivation of a variety of species and varieties. Ema5TM contains lactic acid bacteria, photosynthetic bacteria (PNSB), actinomycetes, and yeast. These microorganisms have detoxifying, antioxidant, and antientropic properties. These properties make EMs an effective, highly useful group of microorganisms that can play a significant role in a polluted or unsustainable environment and in food processing technologies [20,21,22,23,24]. This biopreparation is produced by natural fermentation and is not chemically synthesized; it is GMO-free. Therefore, EMFarmaTM and Ema5TM are natural, economical alternatives to plant protection products and other chemicals. The tested bio-preparations in question are highly concentrated solutions; 1 billion living microorganisms are present in 1 ml. The optimal probiotic composition of EMFarma TM means that its dosage can vary widely and depends on the species of the cultivated plant or the physico-chemical composition of the soil, ranging from 1.5 to 5 dm−3 of the concentrate per 1 ha. This bio-product can be used to soak seeds before sowing, or tubers and seedlings before planting, and can also mitigate plant diseases [1,12].
Microbiological bio-products can also be used in irrigation systems for plants [12,25]. The exact composition of these microbiological products is unknown as it is protected by copyright.

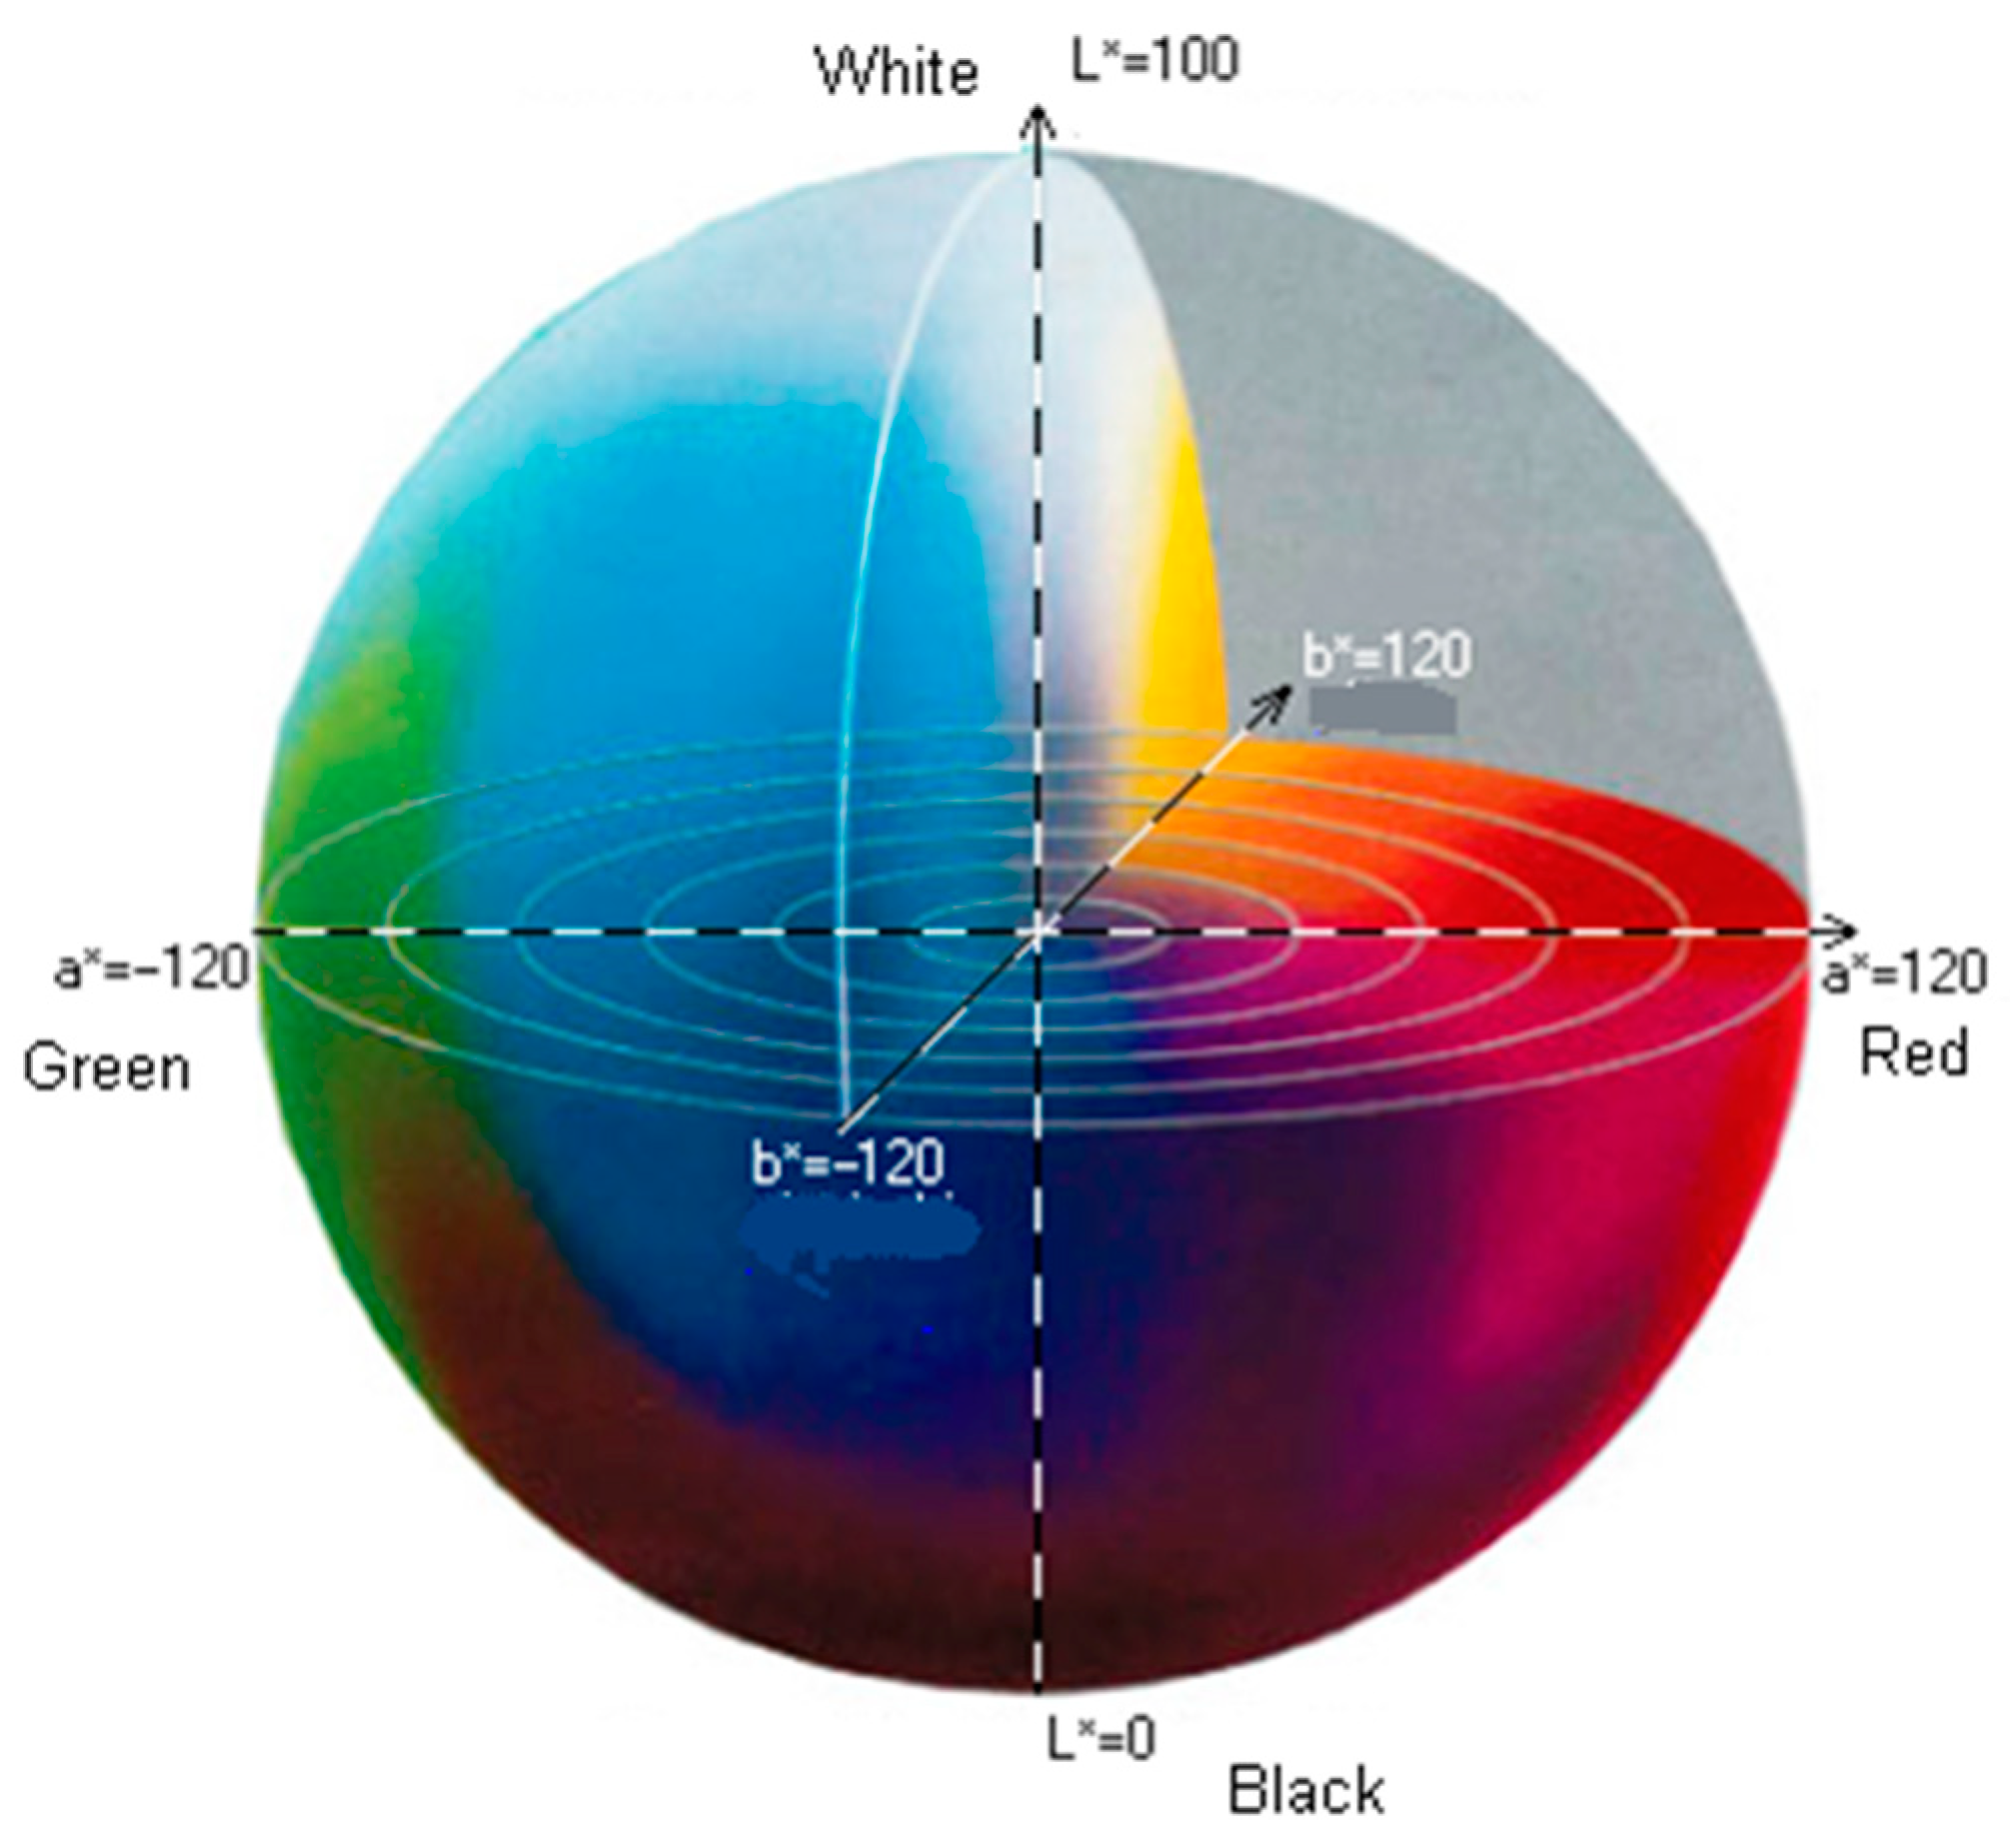
2.4. Color Assessment of Raw Tuber Pulp

To assess the color of fresh tuber flesh, the trichromatic colorimetry method was applied with the use of a Konica Minolta CM-5 colorimeter (Japan). The color of potato tuber flesh was expressed in the CIE L*a*b* system; this system includes three parameters described with the letters L, a, and b.
Parameter L determines the brightness of the tested sample, and takes values from 0 (black) to 100 (white).
Parameter a* determines the proportion of colors, green and red in the test sample. A positive value for this parameter determines the amount of yellow, while a negative value determines the shades of green.
Parameter b* determines the levels of blue and yellow. Positive values for this parameter define the amount of yellow, while negative values define the amount of blue. The value range of the a* and b* parameters in the CIE system is −120 to 120 (Figure 1) [5,26,27].
Before testing, the device was calibrated against a white standard. Assuming that the white light is white, the reference has tristimulus elements (xw, yw, zw); the transformation on CIE XYZ coordinates into CIEL*a*b* coordinates is described by the following equations: [5]
  L * = 116   f ( y y w ) 16  
  a * = 500 f ( x x w ) f ( y y w )  
  b * = 200 f ( y y w ) f ( z z w )
where function f ( t t w ) is described by the formula:
( t t w ) 1 / 3 ( t t w ) > 0.008856
f ( t t w ) =   ( t t w 903.4 t t w 116 ) + 16 ( t t w ) < 0.008856
All analyses were carried out 10 min after cutting the tuber pulp.

2.5. Sampling for Chemical Analysis

During the harvest, tuber samples were taken from 10 plants in each plot, and then 50 undamaged tubers were randomly selected for chemical analysis. Prior to analysis, the tubers were washed and dried at ambient temperature.

2.6. Analysis of Selected Elements of the Chemical Composition of Tubers

The following values were determined in the fresh weight of tubers: the content of dry matter, starch, vitamin C, and total sugars and reducing sugars. Analyses were performed in triplicate for each sample. The dry matter was determined by the two-stage dry-weight method. The cut and shredded fresh tuber mass was first dried at 60 °C for 20 h, and then at 105 °C for 2 h. The dry matter content in the tested sample was calculated from the following formula:
  % DM =   c a b a   ×   100
where DM is dry mass, a is vessel weight, b is vessel weight with plant material, c is vessel weight with plant material after drying at 105 °C [28].
The starch content was determined on a hydrostatic balance according to the Riemann–Parow method [14]. The content of vitamin C was determined using the Tillman method, which is a titrimetric method based on the color reaction of ascorbic acid with a solution of 2,6-dichloroindophenol (Tillman’s reagent). A solution of titrant (2,6-dichloroindophenol) at a concentration of about 3.5 × 10⁻⁴ mol·dm−3 was prepared immediately prior to analysis with the standard solution of ascorbic acid [28]. The biodegradable biological material was weighed (average weight of 1 g), and 25 cm−3 2% hydrochloric acid solution was added and titrated to a light pink color maintained for 10 s.
The content of reducing sugars and total sugars were determined by the Luff-Schoorl iodometric method [29]. The sucrose content was calculated as the difference between the total sugars and reducing sugars.
Figure 2 presents the research scheme.

2.7. Soil Sampling

Before setting up the experiment, representative soil samples were taken annually, 20 from each of the fields to be used in the experiment, in order to determine the content of humus, soil pH and the content of basic macro- and micronutrients in the soil. Soil samples were collected using Egner’s stick; the stick was inserted into the soil up to the protruding element, then rotated and removed, and the soil from the stick groove was placed in a container labeled ‘topsoil’. Then, a 40 cm deep hole was dug with a spade, the fallen topsoil was removed from the hole, and another sample was collected with the stick and placed in a bucket labeled ‘subsoil’ [30].

2.8. Methodology for the Assessment of Soil Samples

In the soil samples, the following parameters were determined:
  • soil granulometric composition by laser method [31];
  • pH in 1 mol KCl dm−3 [31,32];
  • organic carbon content (Corganic) by Tiurin method [33]; on this basis, the content of humus in the soil was determined using the Tiurin method;
  • the content of available P2O5 and K2O were determined using the Egner-Riehm method [34,35];
  • the magnesium content in the soil was determined using the Schachtschabel method [36];
  • the Cu, Mn, Zn, Fe, and B content in the soil were determined in 1 mol of HCl [37,38,39], and their levels were determined according to the limit numbers established for this extractant.
Soil chemical and physico-chemical properties were analyzed at the District Chemical and Agricultural Station in Lublin using certified methods.

2.9. Soil Analysis

The field trial was carried out on homogenous fallow soil with a sandy loam composition (NRCS-USDA) [40]. The sand fraction was 67.0%, the silt 30.6%, and the clay was 2.4%. This proportion of individual fractions corresponded to the composition of clay dust. The agronomic category of the soil based on granulometric analysis was defined as clay sand [40]. The content of humus in the arable layer of soil, determined by the Tiurin method, was 1.02%. This soil belonged to good rye complex and was slightly acidic. It was classified in the agronomic category as light mineral soil [30]. The experiment was carried out on the soil composed of light clay sands, weak rye complex, valuation class IVb. The pH of the soil was slightly acidic to neutral. The soil was characterized as high to very high in available phosphorus; moderate in potassium; very low in magnesium; high in boron; very high in iron; low in copper; average in manganese; and very high in zinc (Table 3).

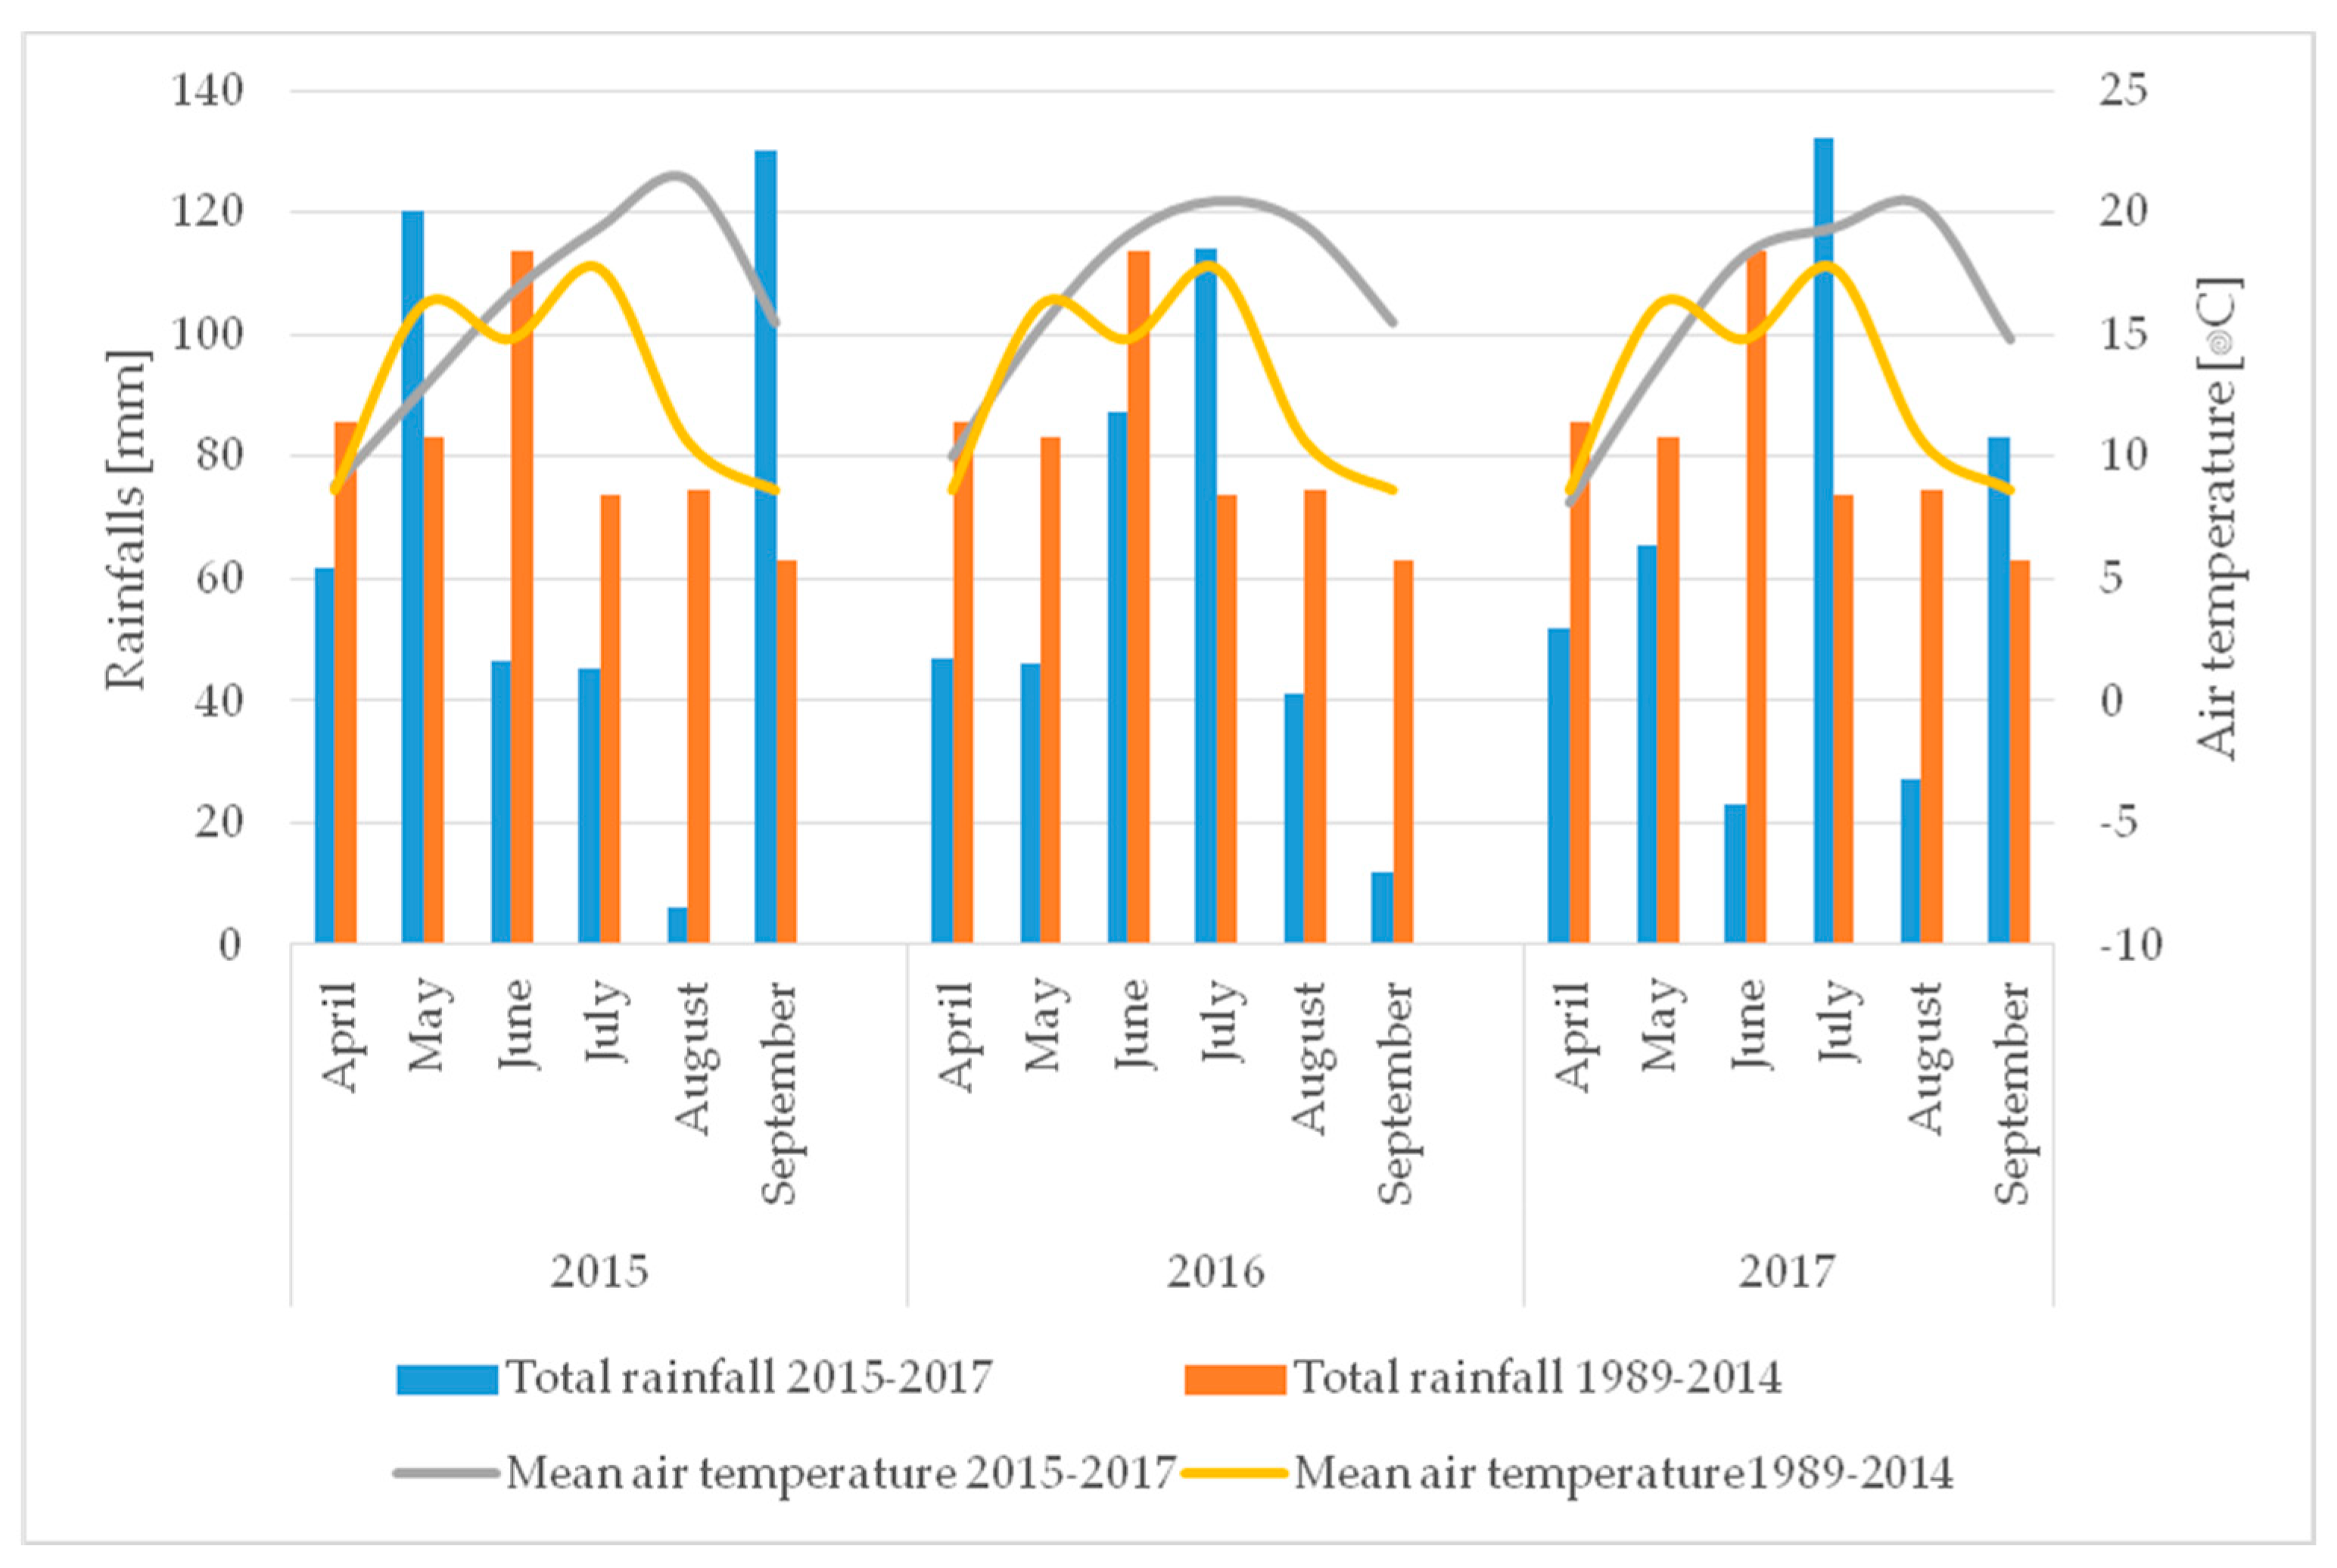
2.10. Meteorological Conditions

The results of meteorological observations came from the experimental station in Uhnin, located 5 km south of Parczew. Meteorological conditions in the years of the study were varied (Figure 3, Table 4). Precipitation and average air temperatures were compared to the long-term averages in the previous 25 years (1989–2014). During the growing period, from April to September, the values of the Sielianinov hydrothermal coefficient, which measures the effectiveness of precipitation in a given month, were determined (Table 4). The greatest lack of rainfall was observed in the first year of the trial in the months June through August, during the intense accumulation of the potato tuber yield, despite the fact that in this year the highest amount of rainfall was recorded during the potato growing season. In 2016, rainfall was optimal, but the air temperature in the months of June through September was much higher than the long-term average. In the third year of the trial (2017), extreme drought conditions were observed in June, during the tuber initiation period, followed by excess rainfall in July, while in August, the month determining the tuber yield accumulation, there was again a significant lack of rainfall (Figure 3).

2.11. Statistical Calculations

The obtained results were subjected to tri-factorial variance analysis (ANOVA) model SAS 9.2 2008 [42] and multiple t-Tukey tests, with the significance level p0.05. The multiple comparison t-Tukey tests enabled detailed comparative analyses of mean values by extracting statistically homogeneous medium-sized groups (homogeneous groups a, b, c) and the determination of the least significant differences of average values, which were marked as HSD (Tukey’s honest significant difference) [43].
In order to determine the share of individual sources of variation in the total variability of the examined features, an assessment of variance components was carried out. The empirical mean square values obtained from the analysis of variance were compared with their expected values. Solving the system of equations in this way yielded an estimate of the variance components corresponding to individual sources of variability. Mutual relations between the determined evaluations of variance components and their percentage structure formed the basis for the evaluation of the influence of varieties and years on the variability of the color of raw tuber potato flesh and on the variability of DM, starch, total sugars, reducing sugars and saccharoses, and vitamin C in the potato tubers [43].
The study also analyzed the simple correlation and polynomial regression of the obtained research results. The following stepwise construction of the regression model was used. It consisted of the fact that the explanatory variable was selected for the model in the first step, which was most strongly correlated with the dependent variable. The model with significant parameters was determined. In the second step, another explanatory variable was selected, which was most strongly correlated with the rest of the first step. The significance of all parameters characterized the extended model. The model was adjusted to empirical data by verifying the hypothesis about the significance of the determination coefficient. The procedure was terminated when the explanatory variables were missing or the addition of a new variable to the equation led to a loss of significance by the parameters or the coefficient of determination [43].
The significance of the sources of variation was tested using the Fischer-Snedecor F test, and the significance of differences between the compared means was assessed using multiple Tukey intervals. Function parameters were determined using the least-squares method, and the significance was verified with the Student’s t-test. In the statistical study, the following were assumed as dependent variables (y): y1—L*; y2—a*, y3—b*. The independent variables were: x1, dry matter content; x2, starch content (%); x3, total sugars (%); x4, reducing sugar content (%); x5, sucrose content (%); x6, vitamin C content (mg·kg−1).

3. Results

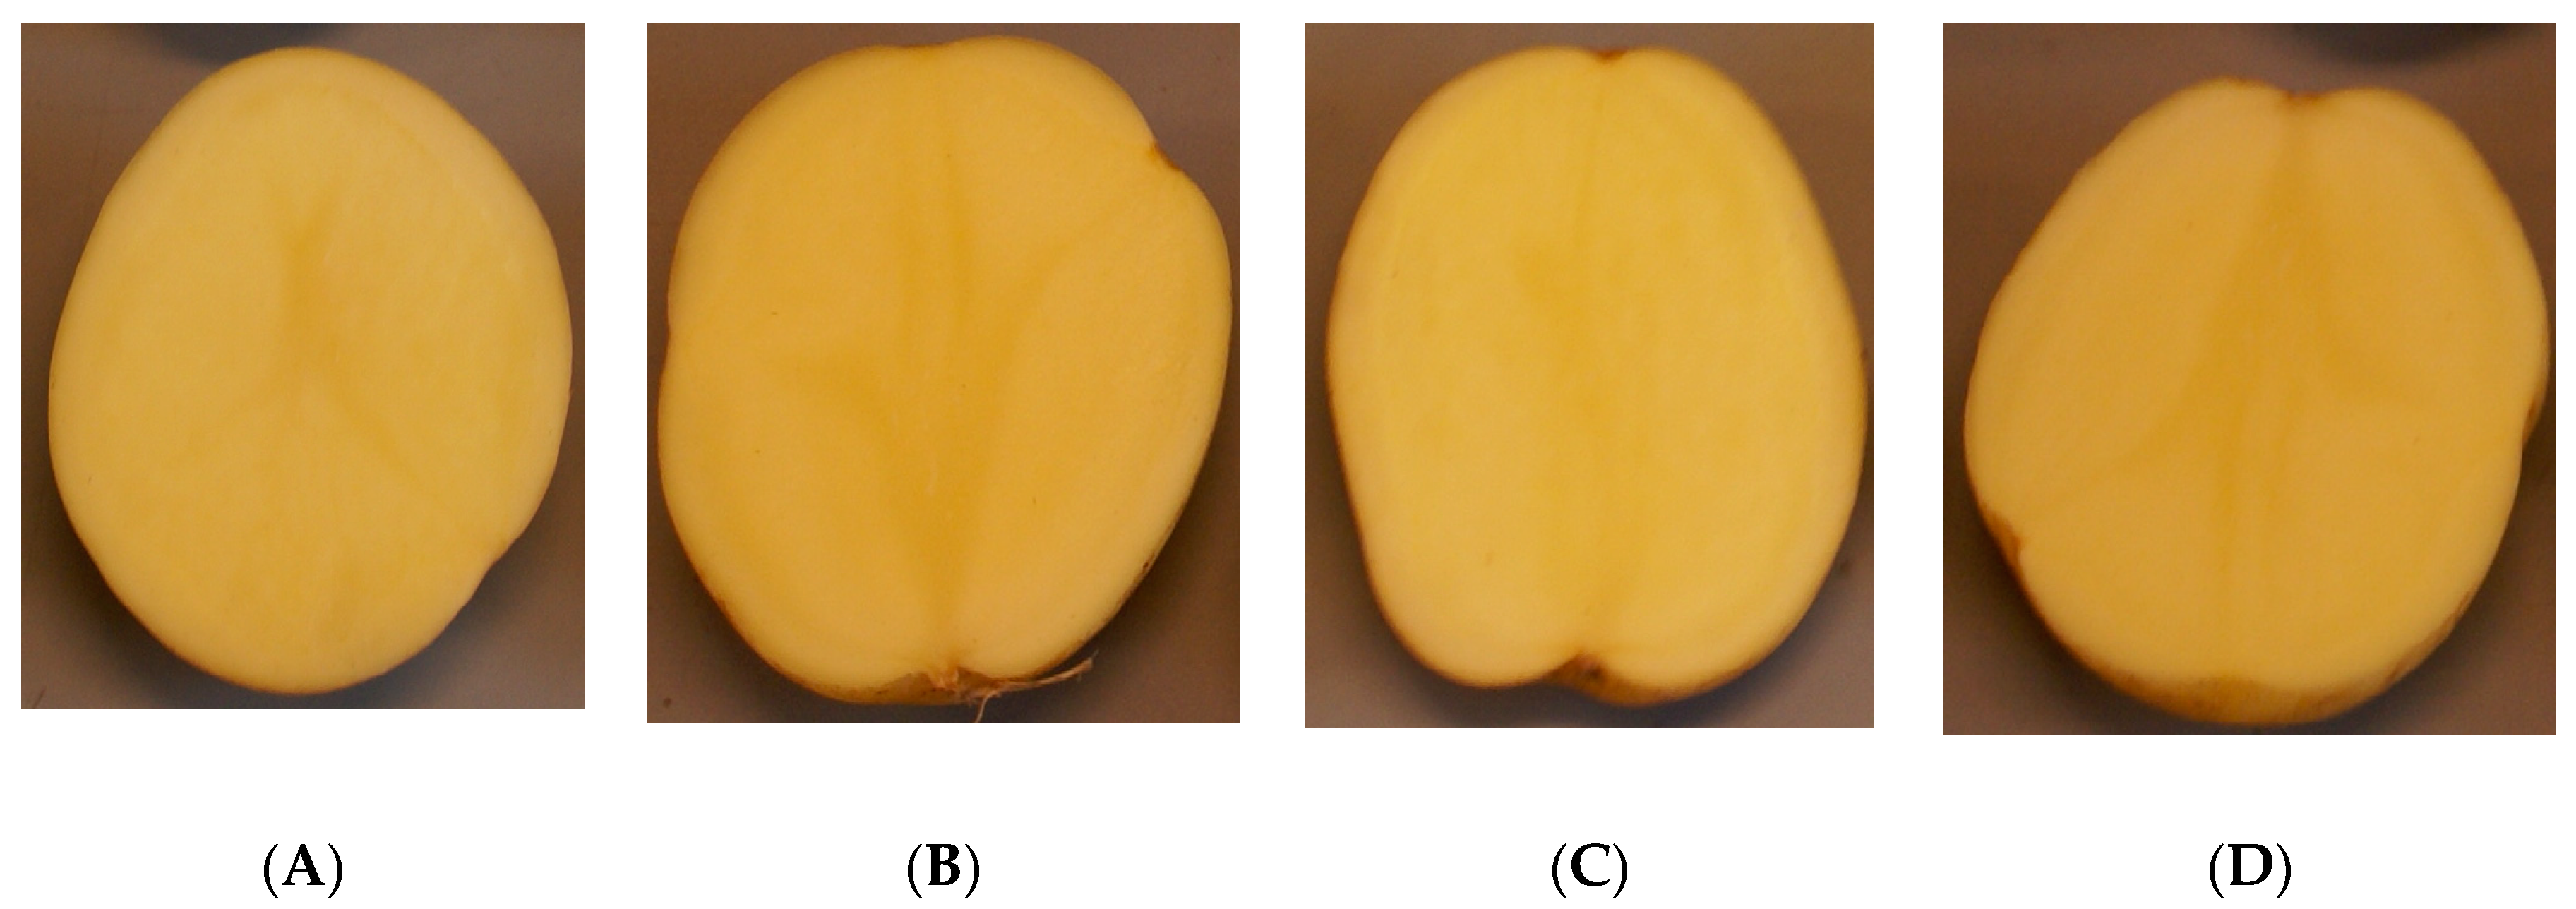
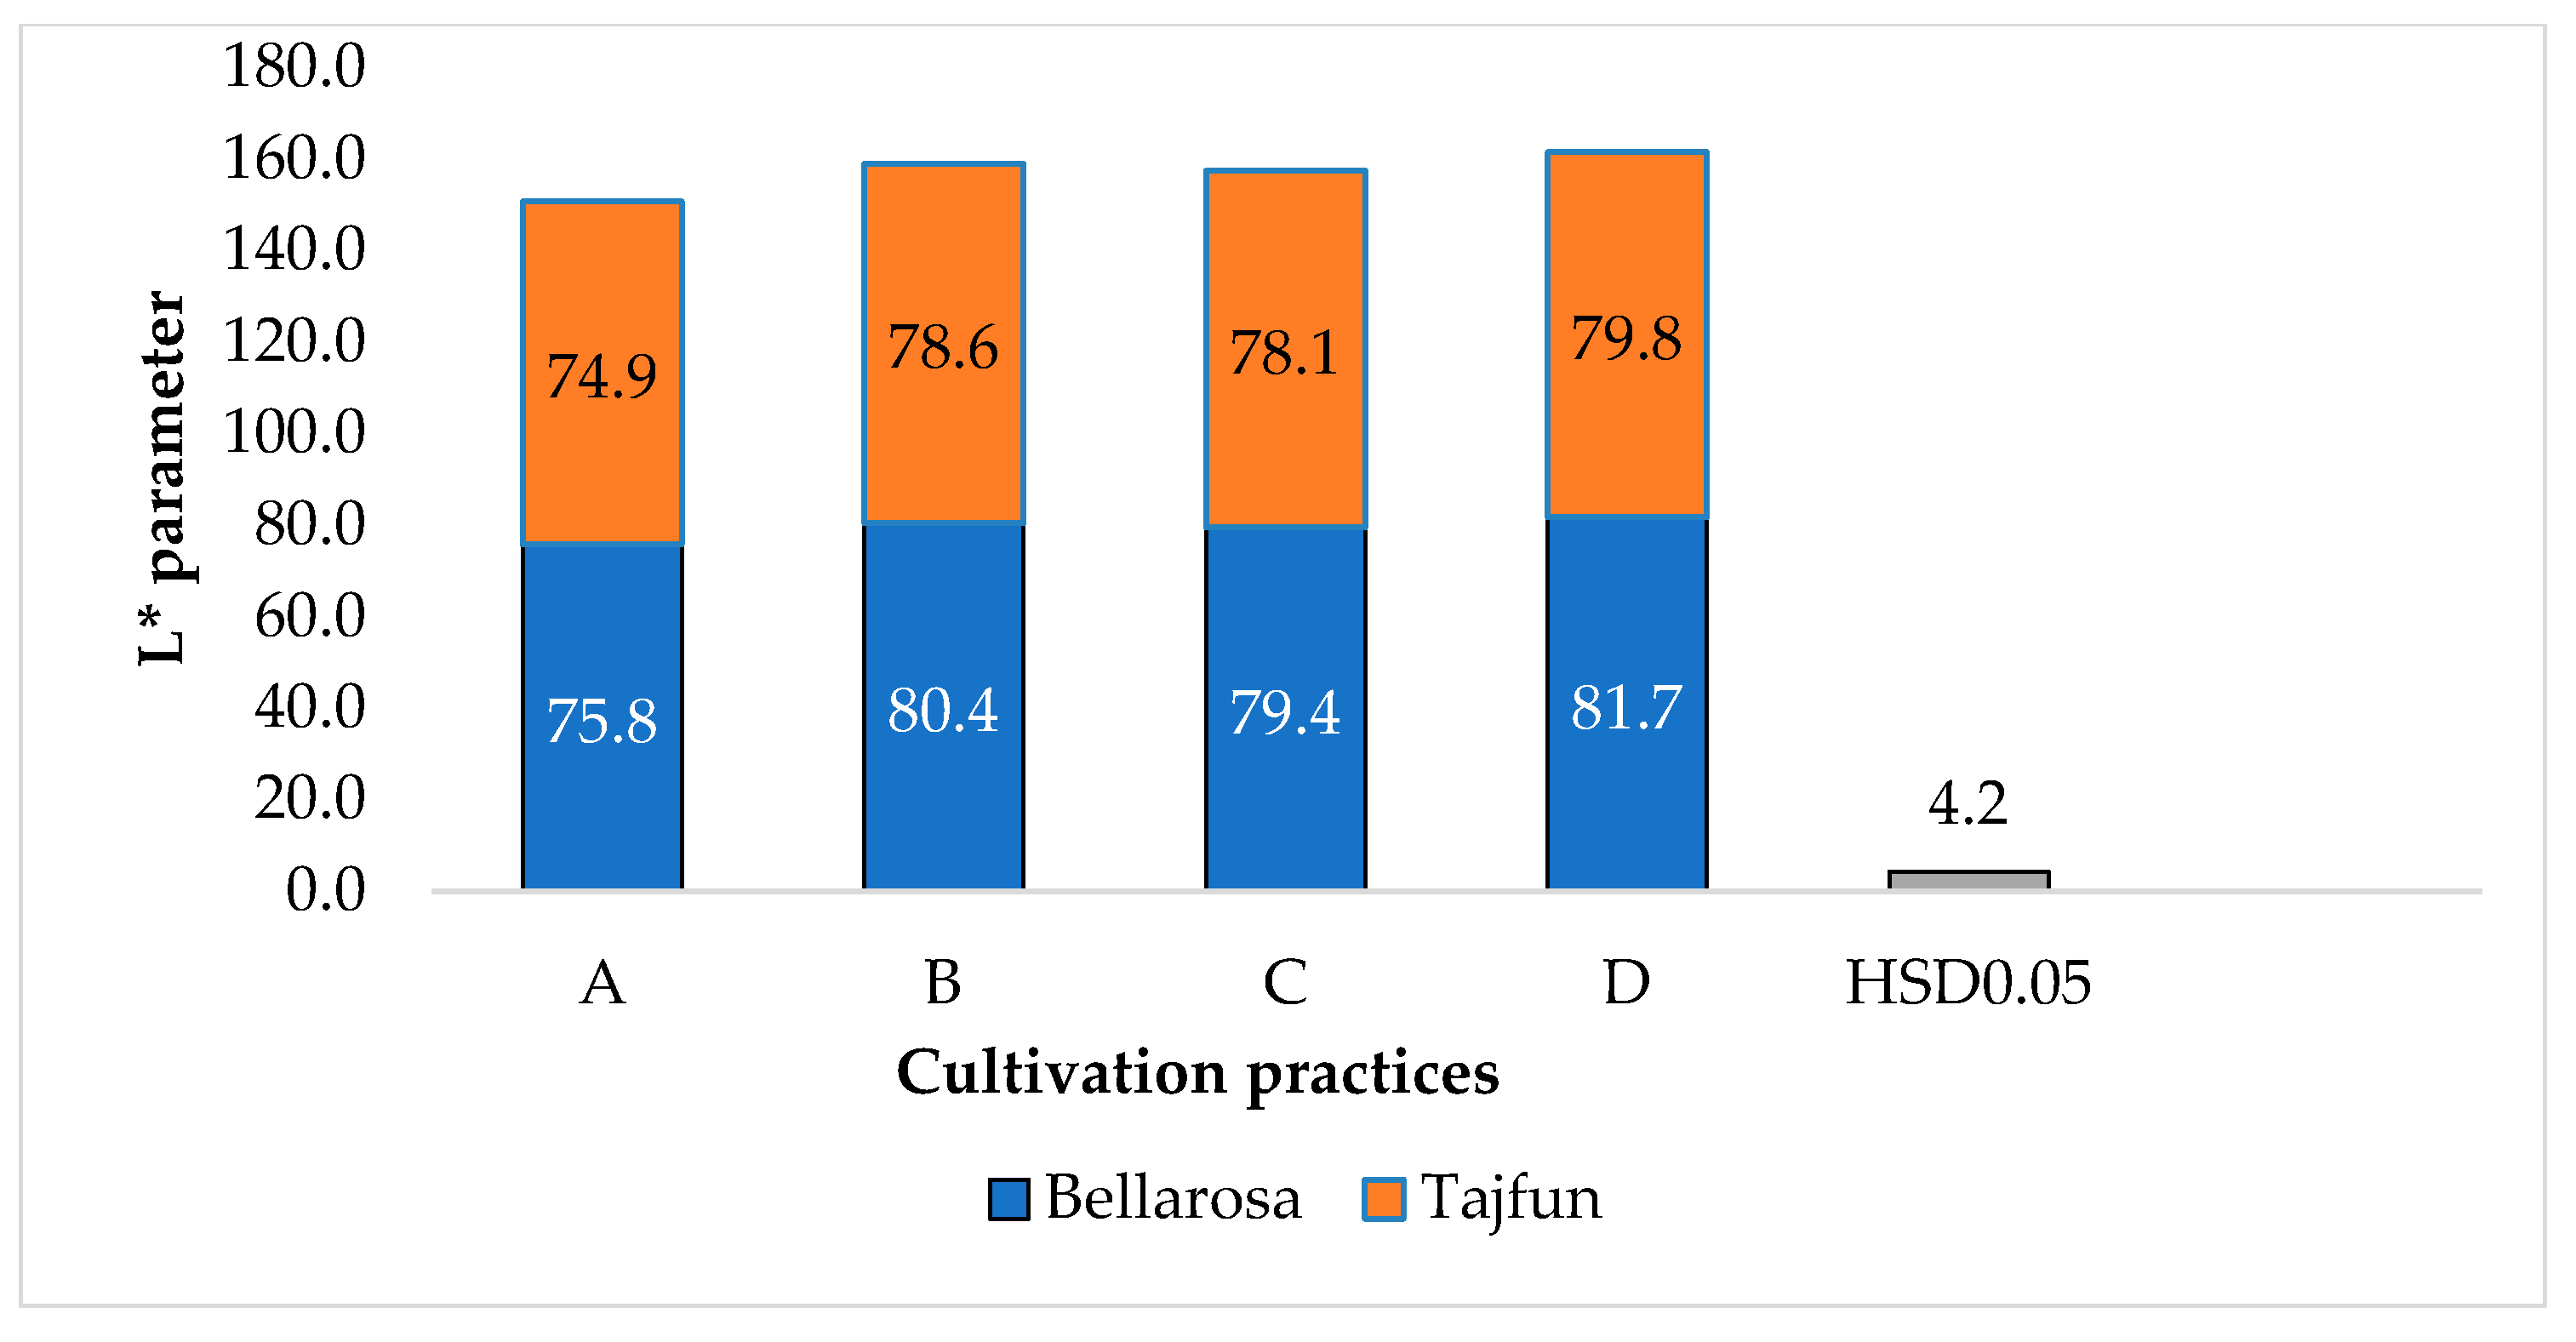
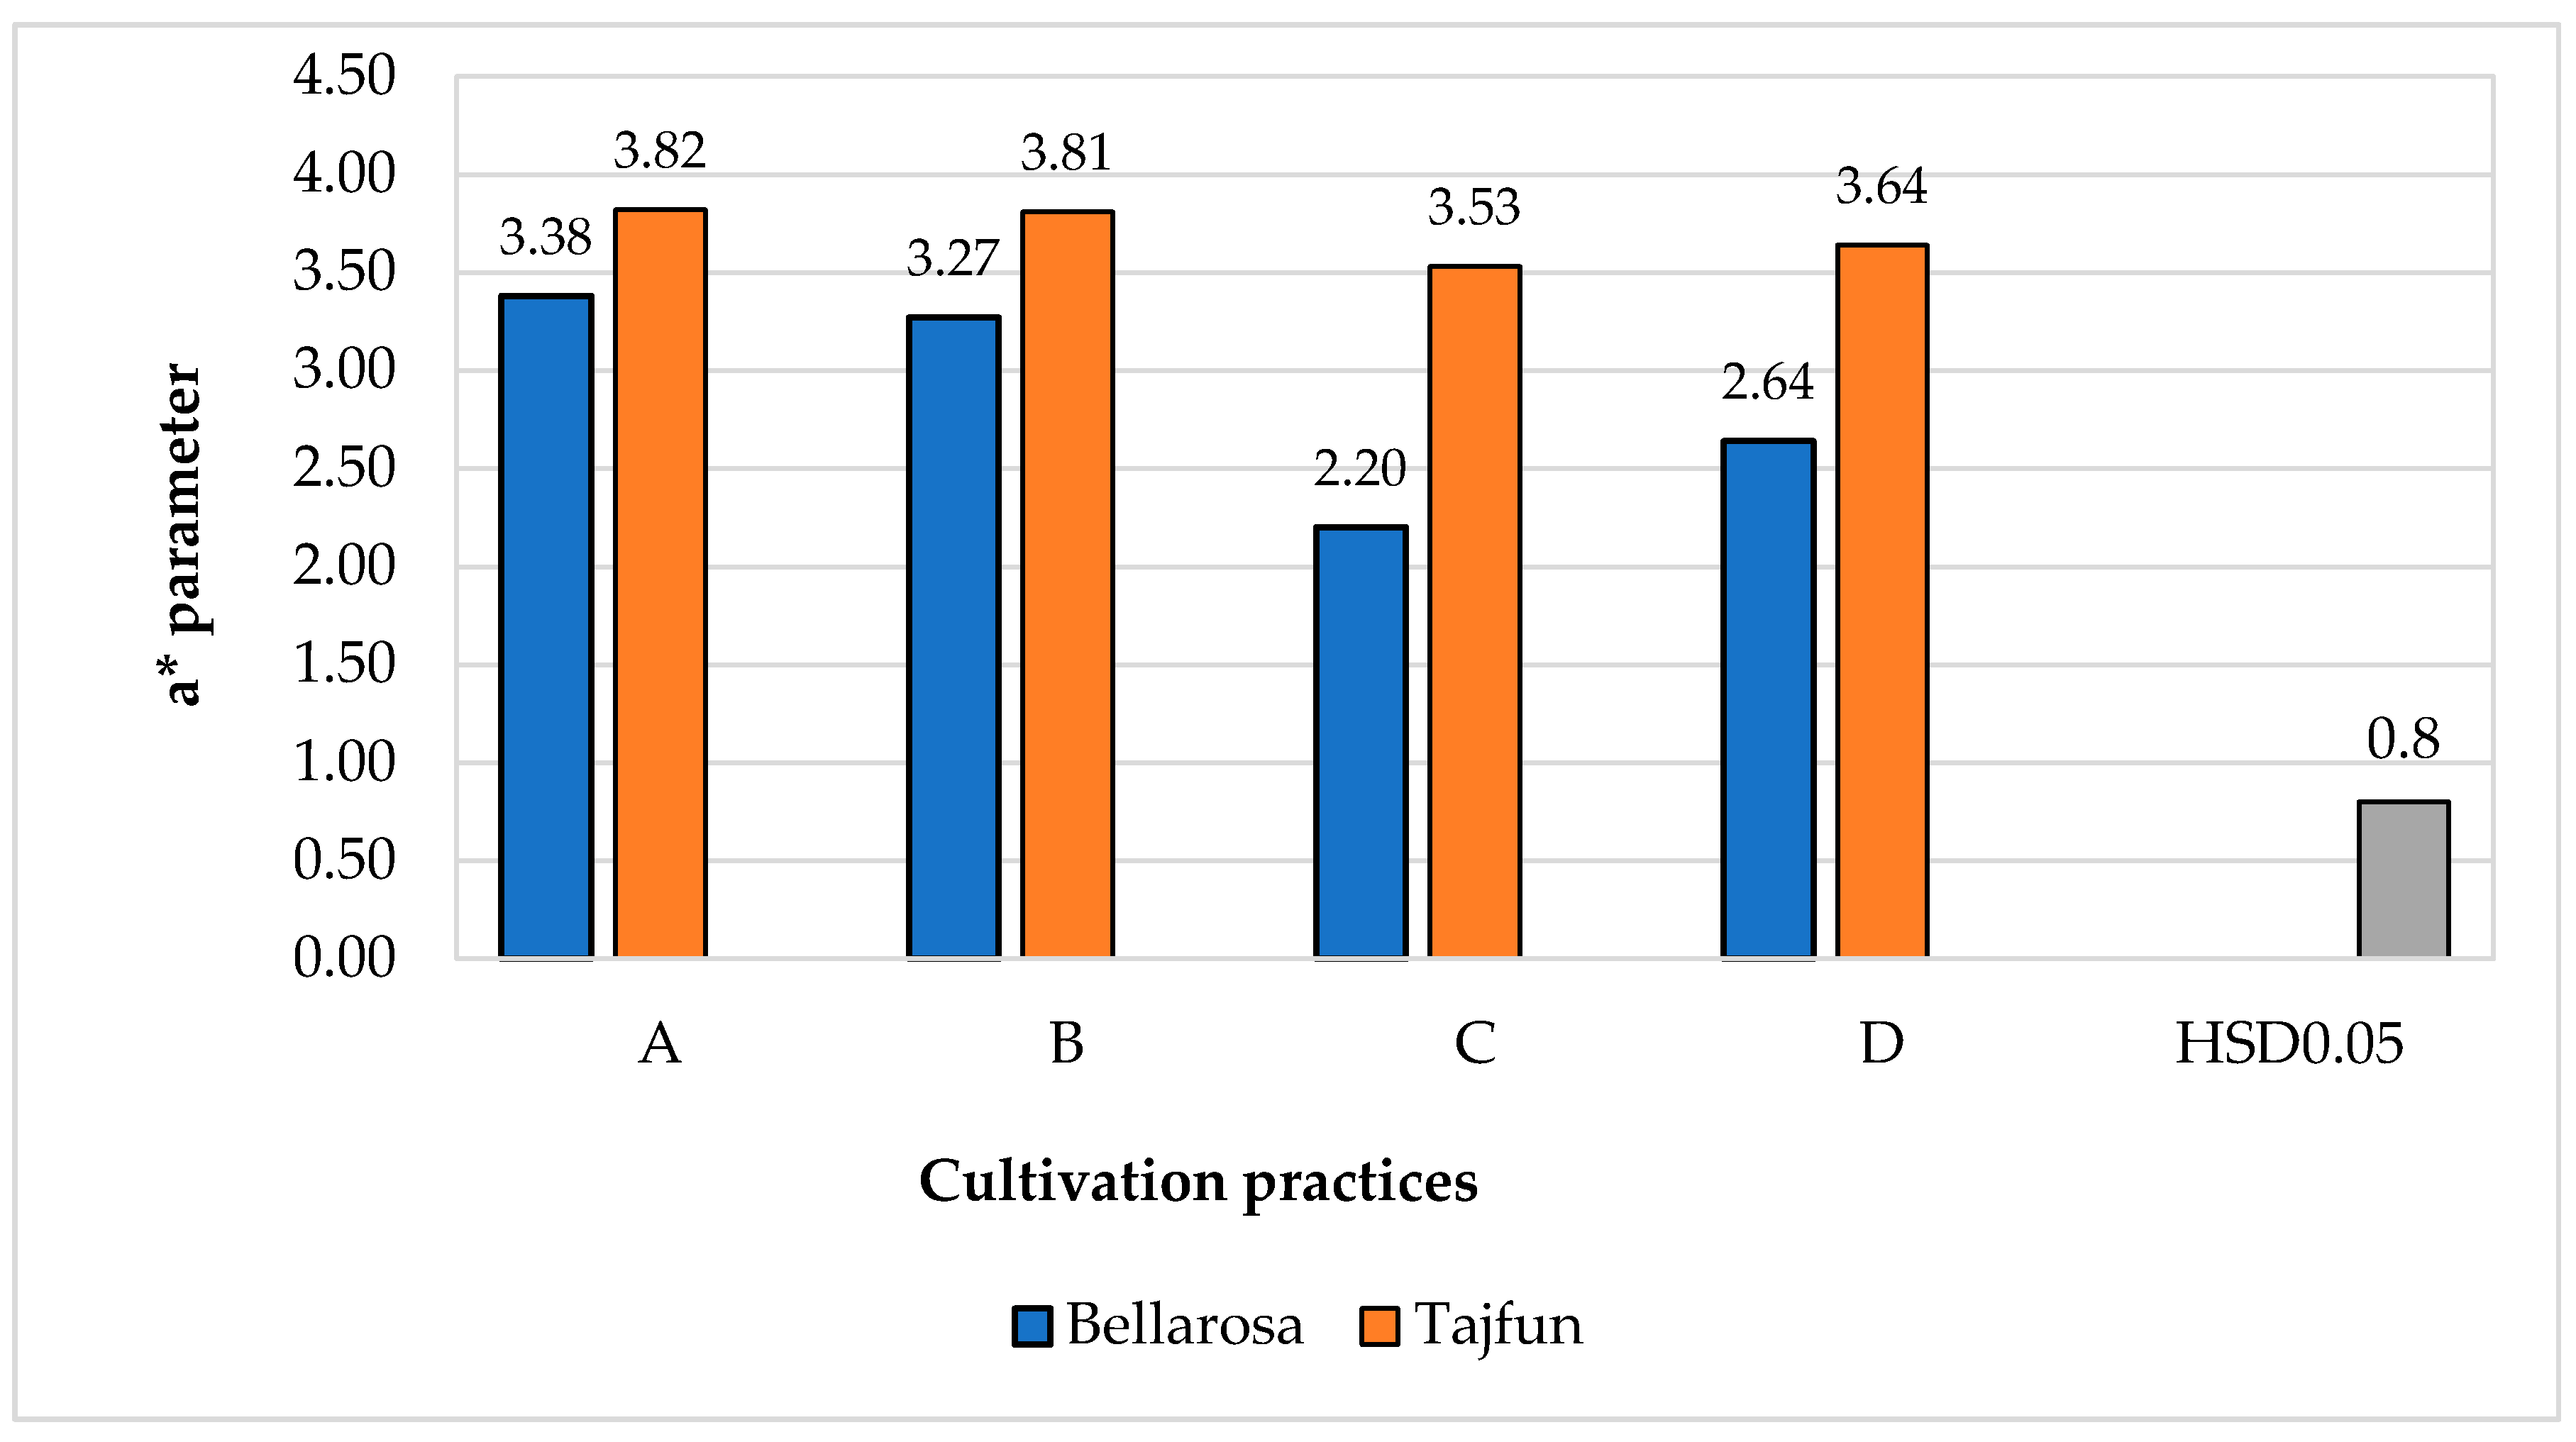
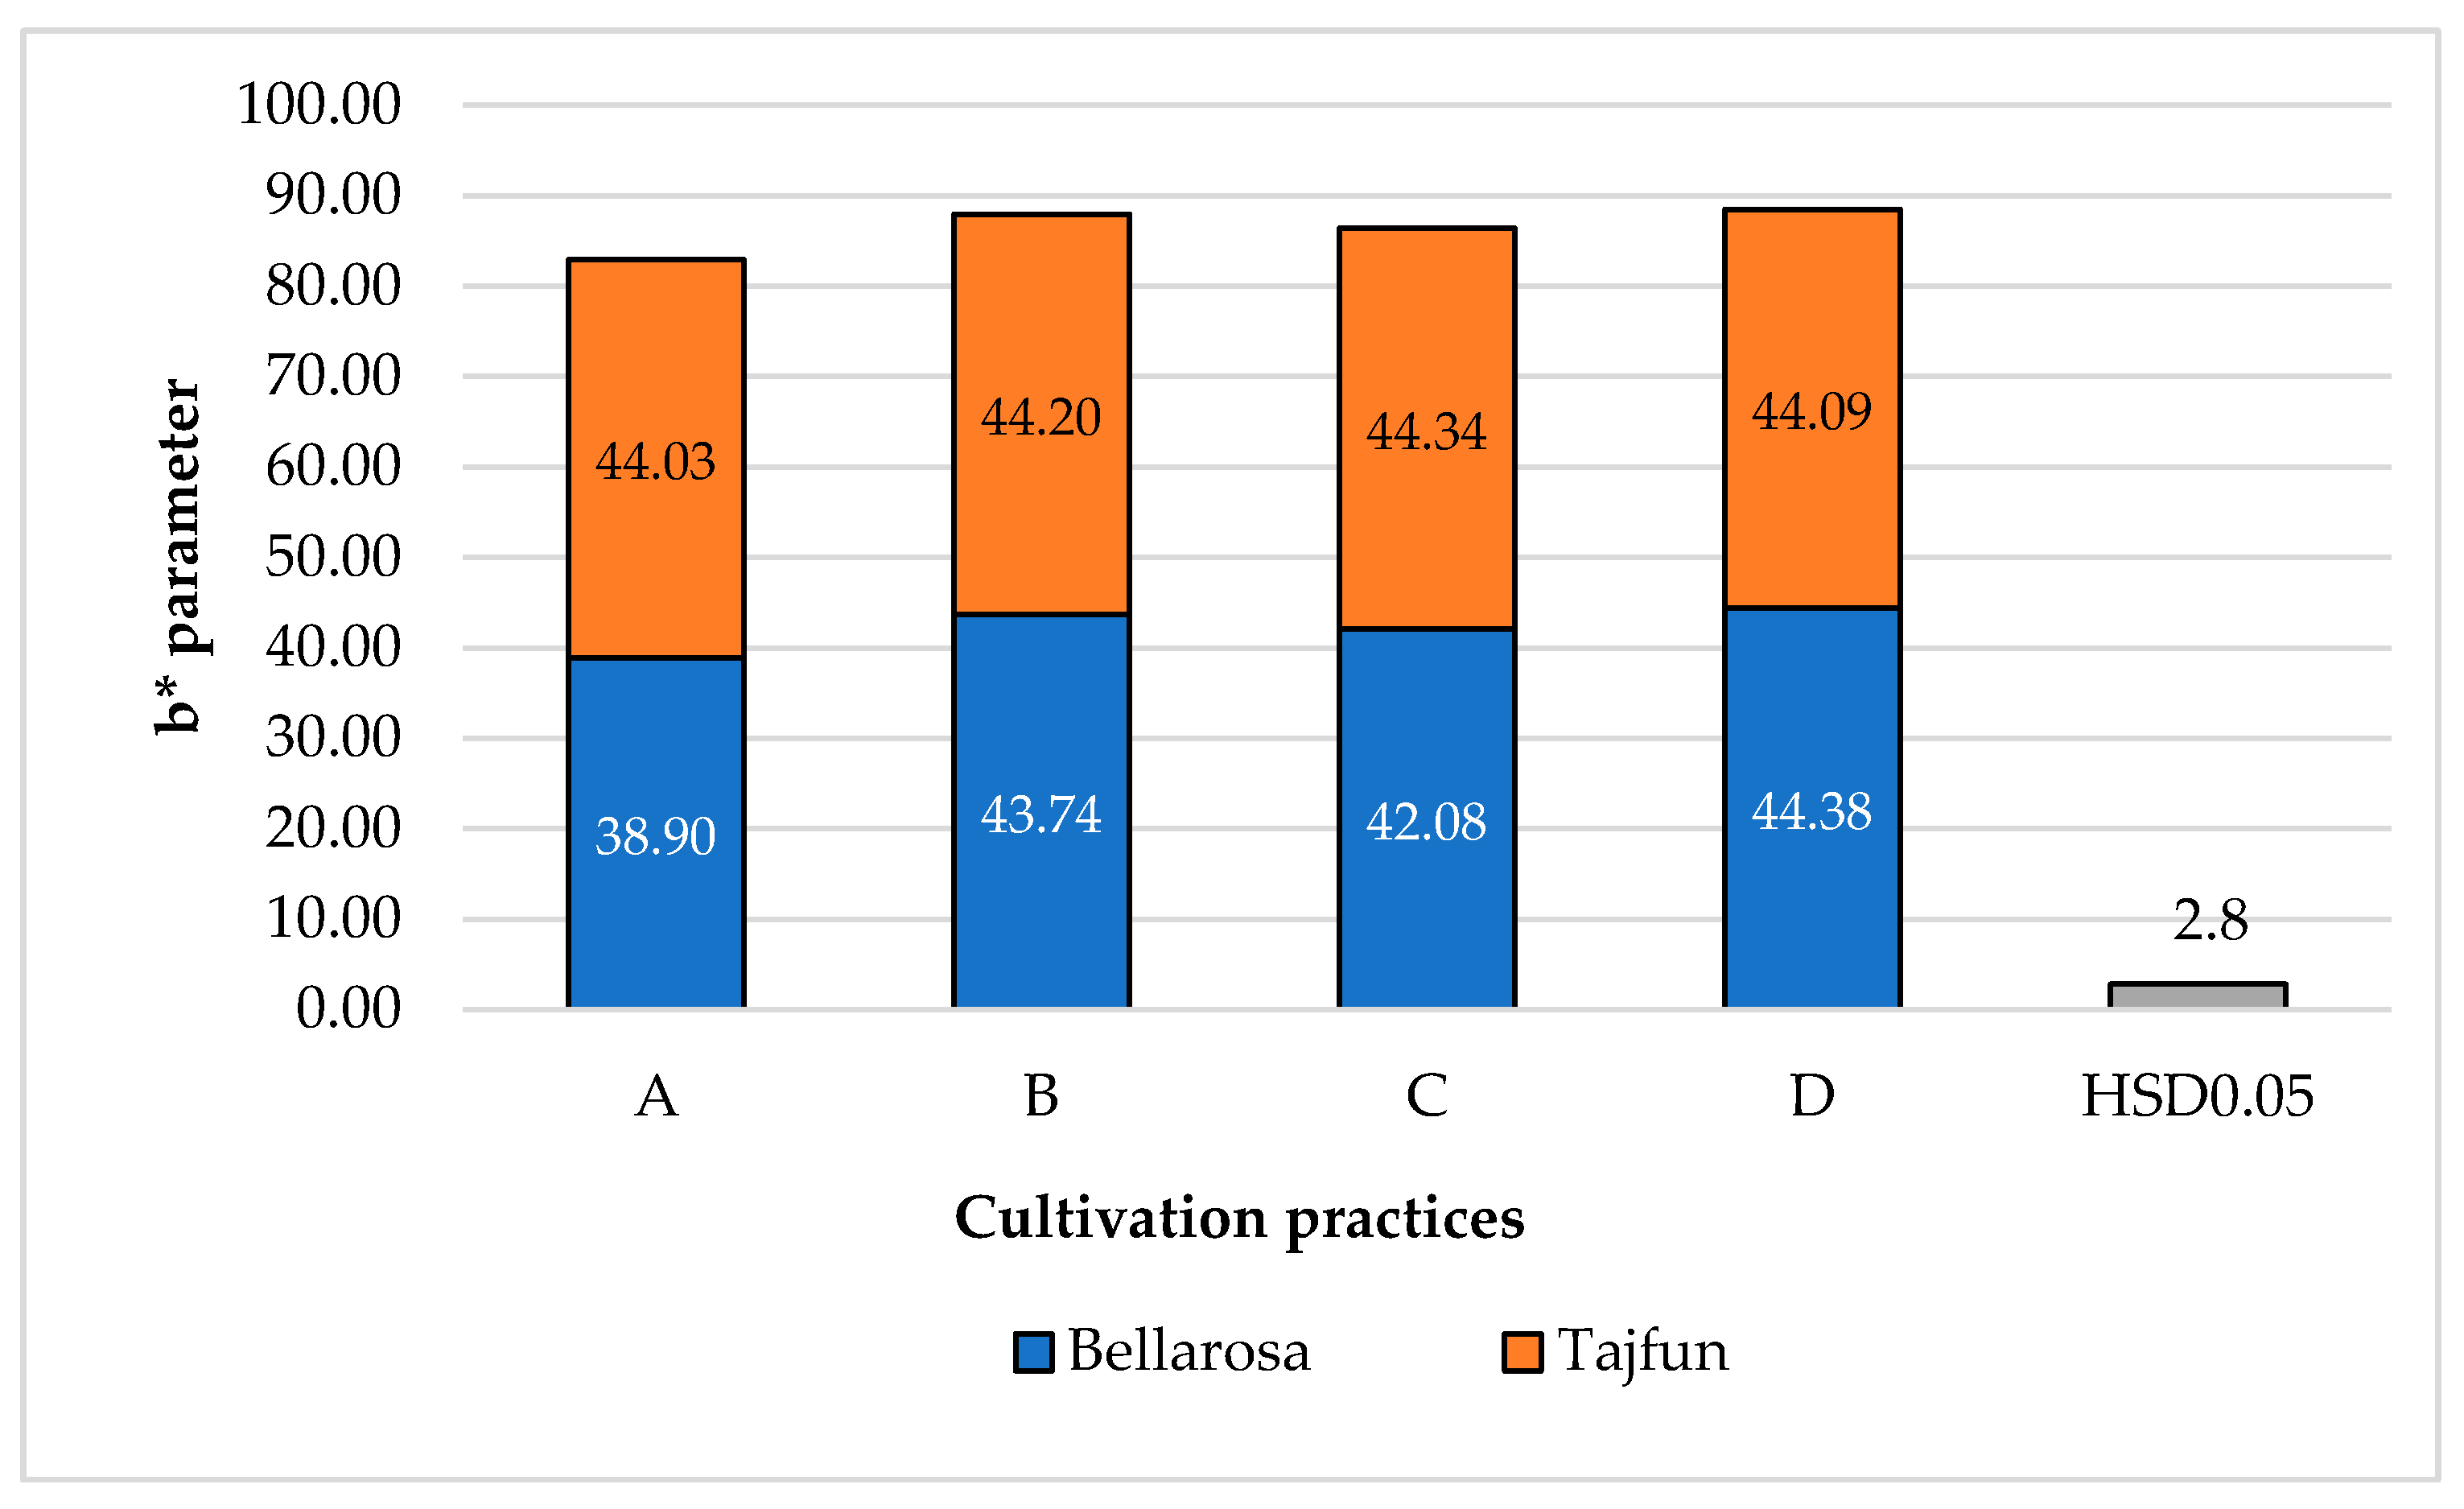
3.1. Influence of Cultivation Practices and Varieties on the Color Indices of Tuber Flesh

The application of fungicides in the cultivation practice technology A, caused significant darkening of the color of the raw tuber flesh, compared to technologies B, C, and D, where the tubers were treated with effective microorganism preparations during the growing season. Three to eight treatments of the preparations of EmFarma PlusTM and Ema5TM were applied and resulted in a favorable effect on the color of the flesh of raw tubers, compared to the standard group using fungicides. Furthermore, this application turned out to be homogeneous with applications B and C (Table 5, Figure 4 and Figure 5).
The highest value of the a* parameter was obtained with the standard technology, without using microbiological preparations, but with fungicides; this value did not differ significantly from technology B with three applications of EMs during the growing season. The remaining technologies, with five or eight times the application of EM, were characterized by a significantly lower value of this feature, which meant a shift of the red color towards green (Table 5).
The b* parameter value was the highest in technologies B, C, and D, where EMs were applied, with spraying three, five, and eight times of EMFarmaTM plus Ema5TM in an aqueous solution during the growing season. The lowest value of this parameter was recorded in standard technology A (Table 5).

3.2. The Impact of Varieties and Weather Conditions, in the Years of Research Variations on Indicators of Tuber Flesh Color

Among the studied cultivars, the ‘Bellarosa’ cultivar, for which the L* component was defined as a change in the tested sample’s brightness, was characterized by significantly lighter flesh color. The ‘Tajfun’ cultivar showed greater color saturation towards red (parameter a*) and a darker shade towards yellow (parameter b*) (Table 5). Both components ranged from −120 to 120. The concept of saturation was also defined as the value of the maximum intensity of the color’s chromatic component in the light of brightness [5,26]. The greater the value of these features (a*, b*), the greater was the color saturation.
The growing season conditions had a significant impact on the L* component of the tuber’s flesh color parameter. The highest value of this parameter, i.e., the brightest flesh color, was obtained in 2015 when a significant shortage of precipitation was noted during the most intense accumulation of tuber yield (June–August). In the remaining years, this indicator turned out to be homogeneous in the value of this feature. In 2015, with a drought in the period of harvesting the crop, significantly lower saturation with red and yellow colors was recorded. We observed a significant shift of the red color towards green (parameter a*) and a shift of the yellow color towards blue (parameter b*). The b* parameter’s highest value was recorded in 2017, with periodic precipitation deficits in June and August (Table 5).

3.3. Interaction of Experimental Factors with Flesh Color Indicators

The most interesting aspect of the work was the interaction of the experimental factors. The technologies used influenced the L* parameter value similarly in all years of the research (Table 6).
The ‘Bellarosa’ cultivar only had a significantly lighter flesh than ‘Tajfun’ in 2017, characterized by drought and even extreme drought in June and August. In the remaining years, the tested varieties showed insignificant differences between each other (Table 6).
There was a difference in response of the studied cultivars to the cultivation practices used. The ‘Bellarosa’ cultivar showed a significantly brighter flesh color in technologies B and D with applications of EM, compared to the standard cultivation practice A, which turned out to be homogeneous with cultivation practice C, in which EMs were applied five times during potato vegetation. The ‘Tajfun’ cultivar had a significantly lighter flesh color in cultivation practice D, in which EMs were applied eight times, compared to the standard cultivation practice (A), where fungicide spray was applied three times. Technologies B, C, and D with the use of EMs in this cultivar turned out to be homogeneous in this feature (Figure 6).
Meteorological conditions in the years of research and the cultivation practices had an impact on the a * color parameter of fresh potato tubers (Table 7).
There was a significant decrease in the value of this parameter under the influence of practices in technology C, which meant a shift of the red color towards green; this was confirmed in all years of research. Further, the value of this parameter was significantly different from that obtained with the standard technology A, as well as from the practices in technology B, where a significant darkening of the tuber flesh was observed. However, there was no significant influence from the practices used in technology D on the value of the a * parameter (Table 7).
The medium-early ‘Tajfun’ potato cultivar was more prone to a red tint than the early ‘Bellarosa’. Significant differences between these varieties were found in all years of research (Table 7).
For the ‘Bellarosa’ cultivar, the highest saturation of red color was recorded in the flesh of tubers grown using standard cultivation practices with fungicides, and the lowest in cultivation practice C, where the tubers were treated with an aqueous solution of EMFarmaTM before planting, and five treatments of EmFarma PlusTM and Ema5TM were applied during the growing season. Homogeneous technologies turned out to be (A) and (B) as well as (C) and (D) (Figure 7). The cultivars showed a significantly different response to EM use only in cultivation practices C and D. The ‘Bellarosa’ cultivar reacted with a significant reduction in red color saturation, while the flesh of the ‘Tajfun’ cultivar was characterized by an increase in red color saturation (Figure 7).
Meteorological conditions in individual years of research did not significantly impact the value of the b* parameter in individual cultivation practices; the differences were not statistically proven.
Cultivation practices had no significant effect on the value of the b* parameter, regardless of the meteorological conditions in the years of the study.
The weather conditions in 2016 and 2017 had a different effect on the b* parameter value between the cultivars tested. The ‘Tajfun’ cultivar was characterized by a more favorable response to optimal weather conditions and was characterized by a significantly greater shift of the blue color towards yellow than the ‘Bellarosa’ cultivar (Table 8).
The interaction of the cultivation practices and genetic properties of the tested cultivars significantly impacted the b* parameter value. The pulp of the ‘Tajfun’ cultivar was distinguished by a significantly greater yellow color saturation than the pulp of the ‘Bellarosa’ cultivar only in the standard cultivation practices (A) with the use of fungicides and in the cultivation practices (C) with five EM applications during the vegetation period. In other technologies, these differences were insignificant (Figure 8).

3.4. Chemical Composition of Tubers

The use of EMs in cultivation practices significantly increased dry matter and starch content and lowered total sugars, reducing sugars, and sucrose in potato tubers compared to the standard application with fungicides. The cultivation practices with EMs did not significantly affect dry matter accumulation in technology D and starch content in technologies C and D. However, none of the applied cultivation practices significantly affected the vitamin C content in tubers, which should be considered a positive effect (Table 9).
The highest contents of dry matter and starch were characteristic of the ‘Tajfun’ cultivar. In contrast, the highest amounts of soluble and reducing sugars and sucrose were found in the early ‘Bellarosa’ cultivar (Table 9).
The highest dry matter content was found in 2015 when there was a significant shortage of precipitation during the yield accumulation period. The year 2017 turned out to be homogeneous in this respect. The highest accumulation of starch was recorded in the second and third years of the study, and these years turned out to be homogeneous in terms of the size of this feature. The highest vitamin C content was recorded in 2017, and in 2015 and 2016, the values of this feature were found to be homogeneous. The highest content of soluble sugars in fresh potato tubers was found in 2016 when an optimal water supply for potato plants was noted. The lowest content of total sugars was recorded in the last year of the study, characterized by rainfall at the level of 70% of the long-term average and air temperature exceeding the long-term average (Table 9).
The interaction of the applied cultivation practices and the meteorological conditions in the research years became significant in the accumulation of tuber dry weight and vitamin C (Table 10). With tuber dry matter, significant differences in the value of this characteristic were observed at each management level, except for the standard group, between 2016 and 2017 and 2016 and 2015. Significant differences in the content of vitamin C occurred under all cultivation management methods between the year 2017 and the other two years, which turned out to be homogeneous to each other (Table 10). A significant interaction of summer × cultivar was found for dry matter, starch, and vitamin C. The ‘Tajfun’ cultivar tubers were characterized by higher content of these chemical components in all years of the study, regardless of other experimental factors (Table 10).
The interaction of applied cultivation practices and meteorological conditions in the years the research took place had an impact on total sugars, reducing sugars, and sucrose.
There were significant differences in total sugars with all cultivation management systems between 2016 and 2015 and 2016 and 2017. The values of reducing sugars and sucrose in the research years 2015 and 2017 were homogeneous in this respect. They were significantly lower than the values recorded in 2016, with optimal conditions during the growing season (Table 11).

3.5. Share of Individual Variances in the Total (Phenotypic) Variance

The evaluation of variance components (Table 12) shows that the share of genotypic variation was highest for the a* parameter (23.3%). The crop practices with EMs had a significant influence on all color characteristics of tuber flesh. The share of variability in cultivation practices in the overall phenotypic variability ranged from 6.4 to 9.6%. The share of the random factor, which was years, ranged from 6.2% to 15.7% in the total variance. The highest share of this factor was found for the L* parameter (15.7%), and the lowest for the a* parameter (6.2%). The interaction of EM cultivation practices with cultivars had a significant effect on all parameters, and the share of variability of this interaction in the total variability ranged from 15.9 to 23.0%. The interaction between EM cultivation practices and years had a significant effect on all color parameters of tuber flesh and accounted for from 11.2 to 16.9% of the phenotypic variability. The interaction of cultivar x years x cultivation practice had the largest share in the total variability among all color traits of the tuber flesh (17.8–34.9%). This proves that the conditions of the growing season, combined with genotypic and technological variability, were the dominant sources of variability for such features as the value of parameters a* and b* (Table 12).
The evaluation of the variable components shows that the share of genotypic variation for selected elements was the highest for total sugars (10.3%) (Table 12). The cultivation practices with the use of EMs had a significant impact on all the chemical composition characteristics examined, with the exception of vitamin C content. The share of cultivation practice variability in the overall phenotypic variability ranged from 2.8 to 20.3%. The share of years as a random factor ranged from 7.0% to 15.3% in the total variance. The highest share of this factor was found for total sugars (15.3%), and the lowest for sucrose (7.0%). The interaction of EMs and potato cultivar cultivation practices had a significant impact on all tested parameters of tuber chemical composition, and the share of variability of this interaction in the total variability ranged from 18.7% to 40.7%. The interaction of EM cultivation practices and years had a significant effect on all parameters of tuber chemical composition, except for starch, and accounted for 3.4 to 60.0% of the phenotypic variability. The interaction of cultivar x years x cultivation practice was decisive at between 14.0 and 36.9%. This proves that the conditions of the growing season, combined with genotypic and technological variability, were an important, but not the dominant, source of variability for the potato traits determining the usefulness of potatoes for food processing (Table 12).

3.6. Relationships between Flesh Color Indices and the Chemical Composition of Raw Potato Tuber Flesh

The characteristics of the chemical composition of tubers and their physical features (flesh color of the tuber) analyzed in the study were characterized with descriptive statistics (using the SPSS software) (Table 13). One of the most important features of descriptive statistics is kurtosis, which is a measure of the concentration of scores around the mean, or “flattening” of a distribution. A positive kurtosis value indicates a leptokurtic distribution and indicates many values close to the mean. In this case, it was tuber dry weight and an L* value. In contrast, a negative kurtosis value indicates a platykurtic distribution of the data and indicates some scattering of the results around the mean. Skewness is a measure of the asymmetry of the results. When it takes a value close to ‘0’, the skewness coefficient proves the results’ lack of asymmetry. The skewness coefficient above ‘0’ indicates the right-hand asymmetry of the distribution (otherwise called the positively skewed distribution). The results below ‘0’ indicate the left-hand asymmetry of the distribution (otherwise called the negative-skewed distribution). Such a left-handed data distribution was characteristic for the flesh color parameters a* and b*, while right-hand asymmetry characterized the remaining features. The coefficient of variation, also known as the relative standard deviation (RSD), is a measure of the dispersion of results. It was used to study the degree of variation in the values of the variables. A high value of the coefficient means a large diversity of the trait and indicates the heterogeneity of the studied population. A low value indicates low variability of the trait and homogeneity of the studied population. The most stable of the examined characteristics were the L* parameter and the a* parameter of the color of the tuber flesh, while the content of total sugars, reducing sugars, and sucrose were the most variable (Table 13).
The relationships between the analyzed physicochemical properties of potato tubers were assessed using Pearson’s simple correlation coefficient (Table 14). This coefficient determines the level of linear dependence between random variables. The greater its absolute value, the stronger the linear relationship between the variables. The largest, strong, positive relationship was observed between total sugars and reducing sugars and sucrose (r = 0.99; 0.98), and reducing sugars and sucrose (r = 0.99) could explain a strong inter-correlation. The L* parameter of the color of tuber flesh turned out to be negatively related to the content of reducing sugars and total sugars and sucrose (r = −0.46). Moreover, the parameter b* of the flesh color was slightly negatively related to the content of these sugars in potato tubers (r = −0.27). Tuber dry matter content was strongly positively correlated with the content of starch (r = 0.77) and vitamin C (r = 0.88), but negatively correlated with the content of total sugars (r = −0.53) (Table 14).
The regression equations were calculated according to the formula y = a + bx, where y is the dependent variable, a the intercept, b the value of the regression coefficient, and x is the independent variable.
The partial multiple regression coefficients (bx) indicate how much the characteristics of the dependent variables change if a factor changes by a unit, with fixed values for other independent variables. The variability of the analyzed results was characterized with arithmetic means, standard deviation, and the coefficient of variation (Table 14). The coefficient of determination (R2) informs how the regression equation explains the dependent variables and takes values from 0 to 100%.
Table 15 presents the relationships between the color indicators of the tuber flesh and the elements of the chemical composition of the potato. The brightness of the flesh color was found to depend on dry matter and reducing sugars. A decrease in the value of this characteristic was expected due to an increase in the content of dry matter and reducing sugars in tubers. The coefficient of determination of this regression model (D = 66.42%) proves this relationship can be assumed to be statistically reliable [43]. The regression equation of the form y = 2.798 − 0.339x1 for the a* flesh color indicator shows the dependence of this feature on the dry matter content. However, the coefficient of determination of this equation D = 31.07% indicates that other factors, not included in the function model, contributed to the variability of this feature, e.g., infectious agents (e.g., Ph. infestans). Similarly, another model of the form y3 = 44.125 − 3.471x1 for the b* index also suggests the dependence of this index on the dry matter content. However, it does not meet the significance requirements, as the model’s determination coefficient was below the 50% required for the credibility of the equation. The reasons for this can be found in the presence of other factors not controlled by this equation model.

4. Discussion

Public concerns about the use of chemicals in the environment and their economic and social impact have prompted farmers, researchers, and consumers to look for alternative farming methods and systems. Sustainable, ecological and biodynamic farming systems are considered environmentally friendly technologies. According to many authors [2,3,4,11,25], these cultivation systems have a positive effect on the biological activity of soils and plant biodiversity, and the harvested crops may have higher energy, nutritional, sensory, and rheological value. Czopek et al. [22] in testing EmaPlus and EMFarma in different concentrations in the cultivation of Ageratum houstonianum Mill., proved that spraying plants 3 times with the EMFarma products at a concentration of 2% significantly increased the number of flower baskets in the main canopy and the weight of the aboveground part of the Ageratum houstonianum. On the other hand, Ji et al. [23] and Wei et al. [24] suggest that probiotic microflora cannot optimize the soil if it does not contain biodegradable organic matter.
The results obtained in this research proved that effective microorganisms (EM) can be an alternative in fighting potato blight and simultaneously improve the quality values of tubers intended for processing, as confirmed by the results of studies by other authors [8,20,21,25]. Still, EM’s role in increasing resistance to this pathogen is less known [44]. The triple use of fungicides used in standard cultivation practice contributed to a significant darkening of the color of the raw tuber flesh (L*) compared with combined cultivation practices using effective microorganisms. There are no data on this subject in the available literature. Wojcieszyńska and Wilczek [45], as well as Sawicka et al. [46] proved that in the tissues of plants infected with potato blight spores, a blue fluorescent zone is created between healthy and diseased tissue, which constitutes a type of barrier between the two types of tissues [47]. Hence, the flesh of raw tubers became darker. We believe that further work is needed to prove that effective microorganisms are helpful in creating a barrier for Phytophthora infestans spores and in providing better conditions for tuber yield growth and quality.
The conducted research proved that the genetic features of the studied cultivars had the greatest impact on the color parameters of raw tuber flesh. In contrast, the chemical composition of tubers was modified only in the third order, after cultivation practices and conditions in the research years, without considering their interaction with each other. It proves the high genetic stability of the tested cultivars. The medium-early cultivar ‘Tajfun’ accumulated significantly more dry matter, starch, and vitamin C, while the early cultivar ‘Bellarosa’ accumulated more total sugars, reducing sugars, and sucrose. The tested cultivars also showed a differentiated response to cultivation practices, especially in the interaction of genetic properties with the meteorological conditions prevailing in the years of the study. It should be assumed that the tested cultivars use effective microorganisms in different ways, e.g., for protection against potato blight (Phytophthora infestans Mont de Bary) and Alternaria solani and Alternaria alternata, which significantly shorten the growing season of potato. EMs allowed the cultivars to maintain vegetation longer and extend the harvesting period, especially the accumulation period for dry matter and starch. According to Boligłowa and Gleń [19], using a 10% EM solution for seed treatment reduces the index of stem base infection pathogenic fungi of the genus Septoria sp., Fusarium sp., Botrytis sp., and Alternaria sp. The reduction of potato diseases under the influence of EMs was also observed by Kowalska [48] and Paśmionka and Kotarba [21]. However, the mechanism of this action is unknown, so more research is needed to explain these changes.
The color of the flesh tubers depended significantly on the cultivation practices used. The greatest saturation of the flesh color of the tuber towards red was observed with the use of fungicides, in the practice of standard cultivation. On the other hand, the highest saturation of the flesh color towards yellow was found in technologies with three or eight applications of biopreparations with EM. No studies directly confirming the influence of EMs on the value of this feature have been found in the available literature. It can only be assumed that EMs induce mechanisms that increase the carotene content in tubers. Their pro-health effect on the human body is known and unlimited. Such properties include, among others, α-carotene, lutein, canthaxanthin, or zeaxanthin. The most important feature of carotenoids is their antioxidant activity against reactive forms and free radicals. Thanks to this property, carotenoids protect the body against severe chronic diseases [49]. Therefore, it is worth investigating this direction of changes under the influence of EMs.
The color of the flesh of potato tubers may be white, cream, yellow, or violet with a whole range of intermediate shades. The yellow color of the flesh is caused by carotenoids (mainly zeaxanthin and lutein) contained in the amounts of a few milligrams per 100 g of tuber [49]. There are also varieties with pink and violet and red-colored flesh due to the presence of anthocyanins in tubers, mainly pelargonidine, petunidin, and malvidin glycosides, in amounts of 2–40 mg/100 g of tuber [50]. The color of the flesh may be adversely affected by the tendency of tubers toward enzymatic darkening [51].
The fungicides used in the research contributed to an increase in total sugars, reducing sugars, and sucrose as well as a significant reduction in the content of dry matter and starch in comparison to the applications with the use of effective microorganisms. These dependencies had a significant impact on the color indexes of the tuber flesh. This is confirmed by the results of studies by Frydecka-Mazurczyk and Zgórska [51].
The research of Kowalska [48] showed that the use of effective microorganisms in the form of EM Farma Plus, regardless of their form of application, significantly reduces the symptoms of Ph. infestans on potato plants.
The influence of varietal characteristics and the soil environment affect the concentration of chlorogenic, citric, and ascorbic acids and iron in potato tubers, which determine the degree of dark color—from gray to black [52,53,54,55,56,57]. The research of Sawicka and Dolatowski [50], Frydecka-Mazurczyk and Zgórska [51], Wang-Pruski and Nowak [55], and Bienia et al. [58] proved that the genetic properties of the tested potato cultivars had the greatest impact on the analyzed color traits of raw tuber flesh. Research results also showed that in a year with a large rainfall deficit (2015) and high average air temperatures, significant differences were observed between the cultivars in the brightness of their raw tuber flesh. This shows that varieties react differently to thermal and humidity conditions. It should be assumed that they influence the concentration of chlorogenic, citric, and ascorbic acids and iron in tubers, thus determining the degree of coloration and color saturation of the tuber flesh [55,58].
The extreme meteorological conditions in 2015 contributed to the lightest color of the tuber flesh compared to the rest of the study years, where more rainfall occurred during the growing season. These dependencies are confirmed by the reports of Sawicka [59] and Krochmal-Marczak et al. [54]. According to Sawicka and Dolatowski [50] and Sawicka and Skiba [60], the darkening of the raw tuber flesh also depends on the influence of other environmental factors during vegetation. Krochmal-Marczak et al. [54] and Spyrka [61] found that changes in the color of tuber flesh are mainly determined by abiotic and biotic factors occurring during the potato vegetation period and during its storage, preparation for sale, and processing.
Janas [1], Pszczółkowski and Sawicka [11], Paśmionka et al. [21], Wierzbicka and Trawczyński [62] argued that EMs stimulate the growth and activity of roots and increase the yield and photosynthetic capacity of plants. In the opinion Khayatnezhad et al. [49], this is due to the greater availability of nutrients facilitated by the use of EM. According to Valarini et al. [52] and Zydlik and Zydlik [53], the influence of effective microorganisms contributes to a faster rate of mineralization and humification transformations that in turn improve the soil’s biological properties by increasing the amount of organic carbon in the soil and contribute to faster humification of organic matter. It can be assumed that this technique will soon find wider application in plant production as an alternative to traditional and sustainable agriculture, as well as biodynamic agriculture.
Rapid darkening of potato tuber flesh creates serious problems in food processing and may cause changes in the external appearance and sensory properties of the products obtained therefrom. Knowledge of this process can be very useful in analyzing the quality of refined potato products and may prove the effectiveness of technological processes for tuber storage [54]. As reported by Sawicka and Dolatowski [50], Frydecka-Mazurczyk and Zgórska [51], and Wang-Pruski and Nowak [55], the enzymatic process of browning potato tuber flesh is mainly connected with the activity of polyphenol oxidases. Polyphenol oxidase in the presence of oxygen oxidizes intracellular polyphenols, causing enzymatic browning of tuber flesh. The extent of this browning depends on the type and location of the polyphenolic compound in the tuber [51,54].
In the conducted research, the brightness and color saturation of the samples of fresh potato tuber flesh were evaluated using a colorimeter. The CIELab system, showing three basic parameters (L* a* b*), allows for precise definitions of the color saturation of the tested samples based on the spectral composition. The color saturation and its tone are more closely related to the participation of waves of different lengths than the dominant wave in the spectrum.
Color is crucial as a quality criterion in food processing. The uniform shade of the color of the final product in the case of potato chips or fries plays a significant role in assessing their quality. It is difficult to achieve, especially when the products are manufactured by various branches of many companies and their subcontractors [27,51]. In addition, the perception of color is conditioned by external factors, such as the color of the surroundings, surface structure, brightness, and gloss. The definition of the color is influenced by the following three components: the light source, the observer (evaluator), and the product sample. These elements were the basis for the creation of a color system for numerical recording of colors. It is a tool for the determination, analysis, and documentation of colors and their differences [5]. The CIELab system turned out to be the most universal in practice for assessing the colors of various products. It is a rectangular coordinate system that consists of two axes, a* and b*, situated at right angles to each other and thus defining the color tone. The third axis in this system is brightness (L*) and is perpendicular to the a*b* plane. Thus, each color can be assessed by the L*, a*, b* coordinates (the color here is a point in the space built by the three axes) [6,7,56]. To produce, for example, chips of the same color, a standard (standard) is established and the current production (samples) is compared with it. Thanks to the development of the CIELab system, the difference between the color of the standard and the color of the sample can be calculated from the distance between these two points and recorded as a numerical value. In industry, this difference is marked as ΔE * [57]. Usually, the total color deviation ΔE * is not sufficiently indicative of color consistency, and it is worthwhile to establish additional criteria for the color control to be fully valid and reliable.
The amount of flesh color saturation in the conducted studies was found to be related to its brightness, which was also confirmed by the research of other authors [5,27,50,51]. Wszelaczyńska et al. [8] showed a highly significant correlation between subjective methods of assessing the darkening of raw tuber flesh and the parameters of the CIELab system and the a */b * coefficient. Visible light is only a small fraction of the electromagnetic field; the spectrum with the spectral range from 390 nm (violet) to 750 nm (red), according to Shyam [7], changes even in this narrow visible range the sensitivity of the human eye to color. In the conditions of artificial lighting, in the moderate to strong range, the human eye, according to Marszałek [5], is more sensitive to yellow-green light (around 550 nm). In the opinion of Yoshi [56], color is an impression caused in our brain by electromagnetic radiation in the range of 380–780 nm and affecting the human eye. This author claims that all colors can be divided into achromatic and chromatic colors. The former covers the colors from white through neutral gray to black; they only have one color attribute: luminosity for secondary light sources and luminosity for primary sources. The other colors are chromatic with up to three attributes. Their identification, however, requires greater knowledge of the principles of physics [5,27,57]. We divide colors into chromatic and achromatic, which are characterized by high brightness [57]. In the CIELab system, they are assumed to be the main, vertical ones in solids of colors. A mixture of white light in combination with a monochromatic color produces a chromatic color. In this trial, a mixture of white and monochromatic light was used to determine the brightness of the tested samples and their color saturation.
The results obtained in this research showed that using effective microorganisms (EMs) in potato cultivation significantly increased the dry matter and starch content, and at the same time reduced the content of total sugars, reducing sugars, and sucrose in potato tubers, compared to the standard practice where fungicides were applied three times. However, the management of cultivation practices did not affect the vitamin C component of the tuber’s fresh weight. Opinions on this subject are divided. Vaitkevičienė et al. [4], by examining the effect of biological preparations BP500 and BP501 on potato cultivars, proved that the BP 501 preparation, and the combination of BP 500 and BP 501 preparations, significantly increased the starch content in potato tubers. Kowalska [48], while assessing the influence of two other microbiological preparations (EM Farma Plus and UGmax), did not find any influence on the starch content of the tubers. Wierzbicka and Trawczyński [62], examining the effect of the EM-Farming microbiological preparation on eight potato cultivars, proved these preparations significantly increased the content of nitrogen, copper, iron, and boron in tubers but did not cause changes in the content of phosphorus, potassium, magnesium, calcium, manganese, and zinc. The beneficial effect of using EM practices in the form of reducing the sugar content in tubers and brightening the color of raw tuber flesh has not yet been confirmed in other studies, which necessitates further research and clarification of this effect.
The features of the chemical composition and the color indices of the raw flesh were shown to be significantly related to each other. The L* parameter and the b* parameter were shown to be negatively related to the chemical composition of potato tubers (the content of total sugars, reducing sugars, and sucrose), assuming the values of r = −0.46 and r = −0.27, respectively. However, no significant relationship was found between the tested elements of the chemical composition of tubers with the a* parameter, which describes the flesh color changes in the range from green to red. Demonstrating the significance of these relationships will allow better use of this information in potato processing. Grudzińska and Zgórska [63] proved that the higher the sucrose content in tubers, the higher the reducing sugar content (r = 0.86, R2 = 0.74). Sawicka and Skiba [60] showed significant correlations between the color of fried potato products (crisps) and the content of reducing sugars and sucrose in tubers. They also showed significant relationships between the content of starch in potato tubers and the content of reducing sugars and between the content of reducing sugars and the content of sucrose. Therefore, further research is needed to confirm these relationships and use them in the processing of potatoes into processed products.
Meteorological conditions in the years of research significantly modified the chemical composition of potato tubers. The highest dry matter content was obtained in dry and sunny years. However, the highest levels of starch and sugars were recorded in the year with optimal rainfall distribution. Both excess and deficiency of precipitation were not conducive to the accumulation of vitamin C during the potato growing season, which is in accordance with the opinion of many authors [9,10,49,51].
The interaction of potato variety × cultivation practice × years turned out to be decisive for the phenotypic variability of parameter a* and parameter b*. The genetic factor played the greatest role in the brightness of raw tuber flesh color (L*). The findings of Sawicka and Dolatowski [50] and Wang-Pruski and Nowak [55] confirmed the diversified share of potato quality traits in phenotypic variability. The results of the research described here can be used in the decision-making system for breeding new potato varieties.
According to Badura [20], Zydlik and Zydlik [53], and Janas [1], the different reactions to EMs in the years of the study resulted both from the different course of the weather in the years and the different impact of soil conditions, which were not uniform because soil variability is unavoidable in field conditions. In poor soils, in their opinion, the microbiological balance may be disturbed.
In the opinion of Paśmionka and Kotarba [21], Condor et al. [64], and Martyniuk and Księżak [65,66], it is difficult to obtain positive effects from using microbiological preparations in field conditions, mainly due to the complex interactions between indigenous soil organisms and the influence of abiotic and biotic factors in the soil environment. Knowing the physiology and biochemistry of color formation and the importance of external factors now allows geneticists and breeders, as well as producers, to decide the color of the raw material [67]. The uniqueness of microorganisms and their ability to biosynthesize, which results from their specific environmental conditions, have contributed to solving particularly difficult environmental problems [68,69,70]. The proper use of native microorganisms has spurred new directions and trends in food science.
The research hypothesis was confirmed that, as a result of the action of microbiological preparations (EM), the quality of tubers improved by changing selected elements of their chemical composition and brightening the flesh of raw tubers. Thanks to this, the potato production technology with the use of effective microorganisms (EM) can be proposed for food processing into refined products.
The conducted research needs to be continued to better elucidate the relationships between the studied features, both in terms of physico-chemistry and microbiology, and to convince scientists and farmers to replace chemical plant protection products with microbiological (EM) preparations safe for the environment.

5. Conclusions

The use of EM technology in potato cultivation contributed to the lightening of tuber flesh in technologies with tuber treatment with EMFarmaTM solution before planting and the application of 3–8 EMFarmaTM and Ema5TM treatments, compared to the 3-time use of fungicides in traditional technology.
The applied cultivation practices with the use of EMs contributed to a significant increase in content of dry matter and starch, and to a significant reduction in the content of total sugar, reducing sugars, and sucrose compared to standard cultivation practices with fungicide use.
Cultivation practices affected the color saturation of raw potato tuber flesh; it changed towards yellow with the technologies in which tubers were treated with EMFarmaTM solution before treatment, and 5–8 applications of EMFarmaTM plus Ema5TM during potato vegetation, compared to the standard cultivation practices.
The variety ‘Tajfun’ turned out to be more suitable for food processing for products refined from potatoes, due to a more favorable chemical composition of tubers (higher dry matter, starch, and vitamin C content and lower total sugar and reducing sugar content) and better values for assessing the brightness of raw tuber flesh.
The tested cultivars showed different reactions to the methods of growing potato plants expressed in the form of a difference in the brightness of their tuber flesh (L*). Only the ‘Bellarosa’ variety reacted to the use of EMs with a significant change in the color of the raw pulp of its tubers. The use of EMFarmaTM water solution as a tuber dressing before planting and 3–8 treatments with the EMFarmaTM and Ema5TM preparations during potato vegetation contributed to a significant color difference in the raw tuber pulp compared to traditional cultivation practices, where only fungicides were used as protection against Phytophthora infestans.
Based on the conducted research, it can be proposed that the L* a* b* color space should be used to assign the color of products in the food industry as a sensitive indicator of the color of raw flesh, which will allow for precise determination of both the brightness of the color (L*) and a* and b* coefficient values, based on nonlinearly compressed CIEXYZ color space coordinates.
Demonstrating the dependence of the color parameters of the tuber flesh on their chemical composition will help to prevent an unfavorable change in the color of raw tuber flesh during processing.

Author Contributions

Conceptualization: P.P., B.K.-M., and B.S.; Methodology: P.P., B.S., and B.K.-M.; Software: M.P.; Validation: B.S. and M.P., Formal analysis: P.P., B.K.-M., and M.P.; Investigation: P.P., B.K.-M.; Data curation: P.P. and M.P.; Writing: P.P. and B.S.; Original draft preparation: P.P., and B.S.; Writing—review and editing: B.S.; Visualization: M.P. and B.K.-M.; Supervision: B.S.; Project administration: P.P.; Funding acquisition: P.P. and B.K.-M. All authors have read and agreed to the published version of the manuscript.

Funding

This research received no external funding.

Institutional Review Board Statement

Not applicable.

Informed Consent Statement

Not applicable.

Data Availability Statement

The study did not report any data.

Conflicts of Interest

The authors declare no conflict of interest.

Abbreviation

EMeffective microorganisms

References

  1. Janas, R. Possibilities of using in organic production systems of cultivated crops. Prowl. Inż. Roln. 2009, 3, 111–119. [Google Scholar]
  2. Vaitkevičienė, N. The Effect of Biodynamic Preparations on the Accumulation of Biologically Active Compounds in the Tubers of Different Genotypes of Ware Potatoes. Ph.D. Thesis, Agricultural Sciences, Agronomy (01A), Aleksandras Stulginskij University, Akademija, Kaunas, Lithuania, 2016; p. 212. [Google Scholar]
  3. Vaitkevičienė, N.; Kulaitienė, J.; Jarienė, E.; Levickienė, D.; Danilčenko, H.; Średnicka-Tober, D.; Rembiałkowska, E.; Hallmann, E. Characterization of bioactive compounds in Colored potato (Solanum tuberosum L.) cultivars grown with conventional, organic, and biodynamic methods. Sustainability 2020, 12, 2701. [Google Scholar] [CrossRef] [Green Version]
  4. Vaitkevičienė, N.; Jarienė, E.; Danilčenko, H.; Sawicka, B. Effect of biodynamic preparations on the content of some mineral elements and starch in tubers of three colored potato cultivars. J. Elem. 2016, 21, 927–935. [Google Scholar] [CrossRef]
  5. Marszałek, K. The Study of Coordinates of Optical Filter Color with the Help of the MCalc Multilayer Calculation Program; Version 4.0.6; AGH University of Science and Technology, Thin Layer Technology Laboratory: Krakow, Poland, 2011; pp. 1–10. [Google Scholar]
  6. Ganczarski, J. CIE XYZ. 2004, p. 45. Available online: https://docplayer.pl/ (accessed on 23 September 2021).
  7. Shyam, N.J. Chapter 2. Colour Measurements and Modeling. In Non-Destructive Evaluation of Food Quality; Springer: Berlin/Heidelberg, Germany, 2010; pp. 17–40. [Google Scholar] [CrossRef]
  8. Wszelaczyńska, E.; Wichrowska, D.; Pińska, M.; Rogozińska, I. Evaluation of enzymatic browning degree of edible potato tubers induced by herbicides, mechanical damages and storage by means of instrumental and sensory methods. Pol. J. Food Nutr. Sci. 2007, 57, 163–166. [Google Scholar]
  9. Kołodziejczyk, M. Effect of nitrogen fertilization and microbial populations on potato yielding. PSE 2014, 60, 379–386. [Google Scholar]
  10. Kołodziejczyk, M. Effect of nitrogen fertilization and microbial preparations on quality and storage losses in edible potato. Acta Agrophys. 2016, 23, 67–78. [Google Scholar]
  11. Pszczółkowski, P.; Sawicka, B. The effect of application of biopreparations and fungicides on the yield and selected parameters of seed value of seed potatoes. Acta Agrophys. 2018, 25, 239–255. [Google Scholar] [CrossRef] [Green Version]
  12. Gałązka, A.; Kocoń, A. Evaluation of the effectiveness of preparations with beneficial microorganisms on the enzymatic activity of soil. Stud. Rep. IUNG PIB 2015, 45, 143–154. [Google Scholar] [CrossRef]
  13. Szembowski, B. Experiences of the farm in Trankwice with the EM—Farming TM biotechnology. In Natural Probiotic Microorganisms; Publishing House of the Ecosystem Association: Licheń, Poland, 2009; pp. 56–58. [Google Scholar]
  14. Roztropowicz, S.; Czerko, Z.; Głuska, A.; Goliszewski, W.; Gruczek, T.; Lis, B.; Lutomirska, B.; Nowacki, W.; Rykaczewska, K.; Sowa-Niedziałkowska, G.; et al. Methodic of Observation, Measurements and Sample Take in Agricultural Experiments with Potato; Plant Breeding Acclimatization Institute, Section Jadwisin: Jadwisin, Poland, 1999; p. 50. [Google Scholar]
  15. Higa, T. A Revolution in Protecting Our Planet; Development Foundation, SGGW: Warsaw, Poland, 2003; p. 132. [Google Scholar]
  16. Stępień, A.; Adamiak, E. Effective microorganisms (EM-1) and their influence on the occurrence of cereal disease. Progr. Plant Prot. 2009, 49, 2027–2030. [Google Scholar]
  17. Higa, T. Effective Microorganism: A New Dimension for Nature Farming. In Proceedings of the Second International Conference on Kyusei Nature Farming, Washington, DC, USA; 1994; pp. 20–22. [Google Scholar]
  18. Allahverdiyev, S.R.; Kırdar, E.; Gunduz, G.; Kadimaliyev, D.; Revin, V.; Filonenko, V.; Rasulova, D.A.; Abbasova, Z.I.; Gani-Zade, S.I.; Zeynalova, E.M. Effective Microorganisms (EM) Technology in Plants. Technology 2011, 14, 103–106. [Google Scholar]
  19. Boligłowa, E.; Gleń, K. Assessment of effective microorganism activity (EM) in winter wheat protection against fungal diseases. Ecol. Chem. Eng. A 2008, 15, 23–27. [Google Scholar]
  20. Badura, L. Do we know all the conditions for the functioning of microorganisms in terrestrial ecosystems? Cosmos. Probl. Nauk Biol. 2004, 53, 3–4, 264–265, 373–379. [Google Scholar]
  21. Paśmionka, I.; Kotarba, K. Possible application of effective microorganisms in environmental protection. Cosmos. Probl. Nauk Biol. 2015, 64, 173–184. [Google Scholar]
  22. Czopek, K.; Staniak, M.; Marcinek, B. Effect of preparations containing effective microorganisms for growth and development of floss flower (Ageratum Houstonianum Mill.). Fragm. Agron. 2018, 35, 7–14. [Google Scholar]
  23. Ji, B.; Hu, H.; Zhao, Y.; Mu, X.; Liu, K.; Li, C. Effects of deep tillage and straw returning on soil microorganism and enzyme activities. Sci. World J. 2014, 7, 1–12. [Google Scholar] [CrossRef]
  24. Wei, Q.; Liu, J.; Peng, Y.; Xu, J.; Liao, L.; Yang, S. Storing and removing nitrogen in drainage from paddy field by using aquatic crops wetland. Paddy Water Environ. 2020, 18, 2661. [Google Scholar] [CrossRef]
  25. Pszczółkowski, P.; Sawicka, B. Effect of the fungicides, microbiological preparations and extracts with herbs on the yield of potato. Fragm. Agron. 2018, 35, 81–93. [Google Scholar]
  26. CIE. Part 4: CIE 1976 L*a* b* Colour Space. In Colorimetry; CIE DS 014-4.3/E:2007; CIE Central Bureau: Vienna, Austria, 2007; pp. 1–12. [Google Scholar]
  27. Brainard, D.H.; Cottaris, N.P.; Radonji, A. The perception of color and material in naturalistic tasks. bioRxiv 2018. [Google Scholar] [CrossRef] [Green Version]
  28. Baryłko-Pikielna, N.; Matuszewska, I. Sensory Food Research. Basics—Methods—Applications, 2nd ed.; Scientific Publishers PTTŻ: Krakow, Poland, 2014; p. 375. ISBN 978-83-935421-3-0. [Google Scholar]
  29. AOAC. Official AOAC International Analysis Methods, 20th ed.; Issue 20; AOAC International: Rockville, MD, USA, 2016; p. 3172. ISBN 0935584870. [Google Scholar]
  30. Mocek, A. Soil Science; State Scientific Publisher: Warszawa, Poland, 2015; p. 571. [Google Scholar]
  31. Ryzak, M.; Bartmiński, P.; Bieganowski, A. Methods of determination of granulometric distribution of mineral soils. Acta Agrophysica Rozprawy i Monografie 2009, 175, 97. [Google Scholar]
  32. Polish Standard. PN-R-BS 0403. Chemical and Agricultural Analysis of Soil Sampling; Polish Committee for Standardization: Warsaw, Poland, 1997. [Google Scholar]
  33. KQ/PB-34; Version 4; Polish Accreditation Center: Warsaw, Poland, 2021.
  34. Polish Standard. PN-R-04023. Chemical and Agricultural Analysis of Soil. Determination of Available Phosphorus Content in Mineral Soils; Polish Committee for Standardization: Warsaw, Poland, 1996. [Google Scholar]
  35. Polish Standard. PN-R-04022 1996 + AZ1 2002. Chemical and Agricultural Analysis of Soil. Determination of Available Potassium Content in Mineral Soils; Polish Committee for Standardization: Warsaw, Poland, 2002. [Google Scholar]
  36. Polish Standard. PN-R-04020 1994 + AZ1 2004. Chemical and Agricultural Analysis of Soil; Polish Committee for Standardization: Warsaw, Poland, 1994. [Google Scholar]
  37. Polish Standard. PN-R-04017. Content of Copper Soluble in HCl in Mineral Soil; Polish Committee for Standardization: Warsaw, Poland, 1992. [Google Scholar]
  38. Polish Standard. PN-R-04019. Content of Manganese Soluble in HCl in Mineral Soil; Polish Committee for Standardization: Warsaw, Poland, 1993. [Google Scholar]
  39. Polish Standard. PN-R-04021. The Content of Iron Soluble in HCl in Mineral Soil; Polish Committee for Standardization: Warsaw, Poland, 1994. [Google Scholar]
  40. Natural Resources Conservation Service Soils. Soil Texture Calculator. United States Department of Agriculture. Available online: https://www.nrcs.usda.gov/wps/portal/nrcs/detail/soils/survey/?cid=nrcs142p2_054167 (accessed on 20 July 2021).
  41. Skowera, B.; Kopcińska, J.; Kopeć, B. Changes in thermal and precipitation conditions in Poland in 1971–2010. Ann. Warsaw Univ. Life Sci. 2014, 46, 153–162. [Google Scholar] [CrossRef]
  42. SAS Institute Inc. SAS/STAT® 9.2 User’s Guide; SAS Institute Inc.: Cary, NC, USA, 2008. [Google Scholar]
  43. Koronacki, J. Statistics, for Students of Technical and Natural Sciences; Scientific and Technical Publishing House: Warsaw, Poland, 2009; p. 491. [Google Scholar]
  44. Pszczółkowski, P.; Sawicka, B.; Danilčenko, H.; Jarienė, E. The role of microbiological preparations in improving the quality of potato tubers. In Proceedings of the International Scientific Conference “New Trends in food Safety and Quality”, Aleksandras Stulginskis University, Akademija, Lithuania, 5–7 October 2017; pp. 22–23. [Google Scholar]
  45. Wojcieszyńska, D.; Wilczek, A. Phenolic compounds of natural origin. Sci. Technol. 2006, 1, 6–12. Available online: https://www.kiosk24.pl/download.html (accessed on 20 July 2021).
  46. Sawicka, B.; Pszczółkowski, P.; Noaema, A.H.; Krochmal-Marczak, B.; Kiełtyka-Dadasiewicz, A. Effective Microorganisms in Agriculture and Food Processing Modern Research on the State of the Environment and the Therapeutic Use of Plants; Chwil, M., Skoczylas, M.M., Eds.; Publishing House University of Life Sciences in Lublin: Lublin, Poland, 2019; pp. 45–64. [Google Scholar] [CrossRef]
  47. Korzeniowska, K. Possibilities of using plant extracts containing phenolic compounds in organic farming. Chem. Ind. 2017, 1, 100–104. [Google Scholar] [CrossRef]
  48. Kowalska, J. Effect of fertilization and microbiological bio-stimulators on healthiness and yield of organic potato. Prog. Plant Prot. 2016, 56, 230–235. [Google Scholar] [CrossRef]
  49. Khayatnezhad, M.; Shahriari, R.; Gholamin, R.; Jamaati-e-Somarin, S.; Zabihi-e-Mahmoodabad, R. Correlation and path analysis between yield and yield components in potato (Solanum tuberosum L.). Middle East J. Sci. Res. 2011, 7, 17–21. [Google Scholar]
  50. Sawicka, B.; Dolatowski, Z. Variability of the flesh darkening in tubers of new potato cultivars under the influence of ultrasounds. Probl. Prog. Agric. Sci. 2007, 517, 639–649. [Google Scholar]
  51. Frydecka-Mazurczyk, A.; Zgórska, K. Optical colour measurement of potato products. Acta Hortic. 2003, 600, 717–722. [Google Scholar] [CrossRef]
  52. Valarini, P.J.; Diaz Alvarez, M.C.; Gasco, J.M.; Guerrero, F.; Tokeshi, H. Assessment of soil properties by organic matter and EM- microorganism incorporation. Rev. Bras. Cienc. Solo. 2003, 27, 519–525. [Google Scholar] [CrossRef] [Green Version]
  53. Zydlik, P.; Zydlik, Z. Impact of biological effective microorganism [EM] preparations on some physico-chemical properties of soil land vegetative growth of apple- tree rootstocks. Nauka Przyr. Technol. 2008, 2, 1–8. [Google Scholar]
  54. Krochmal-Marczak, B.; Sawicka, B.; Kiełtyka-Dadasiewicz, A.; Bienia, B. Influence of storage and climatic conditions on the quality tuber flesh potato cultivated in the organic system. Fragm. Agron. 2016, 33, 44–54. [Google Scholar]
  55. Wang-Pruski, G.; Nowak, J. Potato after-cooking darkening. Am. J. Potato Res. 2004, 81, 7–16. Available online: http://www.findarticles.com/p/articles/mi_qa4069/is_200401/ai_n9402757 (accessed on 24 September 2021). [CrossRef]
  56. Yoshi, O. Spectral color measurement. In Colorimetry: Understanding the CIE System; Schanda, J., Ed.; Wiley; John Wiley & Sons, Inc. Publication: Hoboken, NJ, USA, 2007. [Google Scholar]
  57. Schanda, J. CIE colorimetry. In Colorimetry: Understanding the CIE System; Schanda, J., Ed.; Wiley; John Wiley & Sons, Inc.: Hoboken, NJ, USA, 2007; p. 459. [Google Scholar] [CrossRef]
  58. Bienia, B.; Sawicka, B.; Krochmal-Marczak, B. Culinary quality of tubers of selected potato varieties depending on the foliar fertilization used. Acta Sci. Pol. Agric. 2020, 19, 123–136. [Google Scholar] [CrossRef]
  59. Sawicka, B. Dates of creation and development Phytophthora infestans [Mont.] De Bary in the changing conditions of the farmland. Acta Agroph 2005, 6, 537–547. [Google Scholar]
  60. Sawicka, B.; Skiba, D. Fluctuation of flesh darkening of raw and cooking tubers Helianthus tuberosus L. Ann. UMCS E Agric. 2009, 64, 15–22. [Google Scholar] [CrossRef]
  61. Spyrka, B.W. Influence of habitat conditions on the formation and size on mechanical damages of potato tubers for food processing industry. Ph.D. Thesis, Wrocław University of Environmental and Life Sciences, Wrocław Poland, 2013; p. 166. Available online: https://www.dbc.wroc.pl/Content/23989/Spyrka_B_doktor_110_DBC.pdf?handler=pdf (accessed on 24 September 2021). (In Polish).
  62. Wierzbicka, A.; Trawczyński, C. Effect of irrigation and soil’s microorganisms on the macro and micronutrient contents in organic potato tubers. Fragm. Agron. 2011, 28, 139–148. [Google Scholar]
  63. Grudzińska, M.; Zgórska, K. Effect of sugar content in potato tubers on colour of chips. Żywność Nauka Technol. Jakość 2008, 5, 107–115. [Google Scholar]
  64. Condor, A.F.; Perez, P.G.; Lokare, C. Effective Microorganisms: Myth or reality. Rev. Peru. Biol. 2006, 14, 315–319. [Google Scholar]
  65. Martyniuk, S. Effective and ineffective microbiological preparations used in the protection and cultivation of plants and reliable and unreliable methods of their assessment. Post. Mikrobiol. 2011, 50, 321–328. [Google Scholar]
  66. Martyniuk, S.; Księżak, J. Evaluation of pseudomicrobial biopreparations used in plant cultivation. Pol. J. Agron. 2011, 6, 27–33. [Google Scholar]
  67. Saggin, R.; Coupland, J.N. Non-contact ultrasonic measurements in food materials. Food Res. Int. 2001, 34, 865–870. [Google Scholar] [CrossRef]
  68. Liu, J.X.; Yao, J.; Yan, B.J.; Shi, Z.Q.; Wang, X.Q.; Yu, J.Q. Mulberry Leaf Supplement for Sheep Fed Ammoniated Rice Straw; Animal Production and Health, FAO: Rome, Italy, 2002; Volume 147, pp. 189–201. Available online: http://www.fao.org/3/x9895e/x9895e0i.htm (accessed on 24 September 2021).
  69. Sawicka, B.; Pszczółkowski, P.; Danilčenko, H.; Jariene, E. Impact of ultrasound on the physicochemical properties of potato tubers. Agron. Sci. 2020, 75, 85–104. [Google Scholar] [CrossRef]
  70. Allahverdiev, S.R.; Minkova, N.O.; Yarigin, D.V.; Gündüz, G. The Silent Heroes: Effective microorganisms. Orman. Derg. 2015, 10, 24–28. [Google Scholar]
Figure 1. Colors in the CIEL Lab system. Source: Own study based on Marszałek [5].
Applsci 11 08959 g001
Figure 2. Abstract graphic of the experiment.
Applsci 11 08959 g002
Figure 3. Distribution of average air temperatures and precipitation against the long-term average (1989–2014) according to the Agrometeorological Station in Uhnin.
Applsci 11 08959 g003
Figure 4. Shades of color brightness of raw tuber flesh cv. ‘Bellarosa’ depending on cultivation practices. (A)—3 applications of fungicide, (B)—3 applications, (C)—5 applications, and (D)—8 applications of effective organisms (EmFarmaTM plus Ema5TM).
Applsci 11 08959 g004
Figure 5. Shades of color brightness of raw tuber flesh cv. ‘Tajfun’ depending on cultivation practices. (A)—3 applications of fungicide, (B)—3 applications, (C)—5 applications, and (D)—8 applications of effective organisms (EmFarmaTM plus Ema5TM).
Applsci 11 08959 g005
Figure 6. Influence of cultivation practices and cultivars on brightness of potato tuber flesh (L*) (scale 0–100, 0 (black) to 100 (white)) [5,26]. Cultivation practices: A—3 application of fungicide, B—3 applications, C—5 application and D—8 applications of effective organisms (EmFarmaTM plus Ema5TM).
Applsci 11 08959 g006
Figure 7. Effects of cultivation practices and cultivars on the value of a* parameter of raw tubers. Cultivation practices: A—3 application of fungicide, B—3 applications, C—5 applications, and D—8 applications of effective organisms (EmFarmaTM plus Ema5TM).
Applsci 11 08959 g007
Figure 8. Effects of cultivation practices and cultivars on the value of b* parameter of raw tubers. Cultivation practices: A—3 applications of fungicide, B—3 applications, C—5 applications, and D—8 applications of effective organisms (EmFarmaTM plus Ema5TM).
Applsci 11 08959 g008
Table 1. Doses of fungicides applied in standard cultivation practices, 2015–2017.
201520162017
mandipropamid 0.150 kg·ha−1
benalaksyl 0.160 kg·ha−1 + mankozeb 1.3 kg·ha−1
famoksat 0.175 kg·ha−1 + cymoksanil 0.175 kg·ha−1
mandipropamid
0.150 kg·ha−1
benalaksyl 0.160 kg·ha−1 + mankozeb 1.3 kg·ha−1
famoksat 0.175 kg·ha−1+ cymoksanil 0.175 kg·ha−1
mandipropamid 0.150 kg ha−1
benalaksyl 0.160 kg·ha−1 + mankozeb 1.3 kg·ha−1
famoksat 0.175 kg·ha−1+ cymoksanil 0.175 kg·ha−1
Source: own research.
Table 2. A description of potato cultivars.
Characteristics/CultivarBellarosaTajfun
Maturity timeearlymedium early
Flesh coloryellowyellow
Skin colorroseyellow
Tuber shaperound ovaloval
Cooking type *ABB-BC
Resistance to late blight on a 9° scalesusceptible (2°)susceptible (5°)
Resistance to PVY on a 9° scaleresistant (8°)field resistant (7°)
Resistance to PLRV on a 9° scalemedium resistant (5.5°)resistant (8°)
Resistance to nematoderesistant to the potato cyst nematode Ro1.quite resistant to the potato cyst nematode
* Culinary type: A—salad, B—general purpose, C—mealy.
Table 3. Soil characteristics before establishing the experiment.
Year of ResearchMacronutrient Content [mg·100 g−1 Soil]Humus Content [g·kg−1]pH [KCL]Micronutrient Content
[mg·kg−1 Soil]
PKMgCuMnZnFeB
20158.910.97.80.945.97.5131840.137607.24
20168.39.17.01.065.84.9233756.739255.28
201710.69.86.31.036.68.9916641.136006.04
Mean9.39.97.01.02-7.0227446.037626.17
Source: Analysis by District Chemical and Agricultural Station in Lublin.
Table 4. Values of the Sielianinov hydrothermal coefficient (2015–2017).
MonthYear
201520162017
April2.31.62.1
May3.01.01.5
June0.91.50.4
July0.81.82.2
August0.10.70.4
September2.80.31.9
Source: The Agrometeorological Station in Uhnin; * hydrothermal coefficient was calculated according to the formula: k = 10 P t   [41], where P is the sum of the monthly precipitation in mm, Σt is monthly total air temperature > 0 °C. Ranges of values of this index were classified as follows: extremely dry, 0.0 ≤ k < 0.4; very dry, 0.7 ≤ k < 0.4; dry, 1.0 ≤ k < 0.7; rather dry, 1.3 ≤ k < 1.0; optimal, 1.6 ≤ k < 1.3; rather humid, 2.0 ≤ k < 1.6; wet, 2.5 ≤ k < 2.0; very humid, 3.0 ≤ k < 2.5; extremely humid, 3.0 > k.
Table 5. Color parameters of raw tubers of potato in the CIE Lab* system.
SpecificationL*a*b*
Cultivation practices **A75.23b ± 1.203.26a ± 0.0540.69b ± 0.67
B79.39a ± 2.573.20a ± 0.0843.25a ± 1.04
C78.63a ± 0.682.54c ± 0.0642.88a ± 0.49
D80.63a ± 1.622.81b ± 0.1343.46a ± 1.71
Cultivars‘Bellarosa’79.3a ± 1.032.58b ± 0.1441.04b ± 0.57
‘Tajfun’77.6b ± 1.863.32a ± 0.1043.90a ± 0.51
Years201578.80a ± 0.162.70b ± 0.2041.40b ± 0.23
201676.40b ± 2.103.02a ± 0.1342.45b ± 0.85
201780.20b ± 1.223.14a ± 0.0743.55a ± 1.18
Parameter L*—brightness, parameter a*—green to red color, parameter b*—blue to yellow color, ** Cultivation practices: A—3 applications of fungicide, B—3 applications, C—5 applications, and D—8 applications of effective organisms (EmFarmaTM plus Ema5TM).
Table 6. Effects of cultivation practices, cultivars, and years on the on L* parameter of raw tubers.
Experimental Factors201520162017
Cultivation practices **A76.52a ± 1.2772.25a ± 1.1476.90a ± 2.72
B78.78a ± 0.8578.26a ± 4.2181.14a ± 3.36
C78.95a ± 1.6176.59a ± 1.7580.36a ± 2.25
D80.97a ± 1.0778.50a ± 3.5782.41a ± 3.34
HSD p0.05ns ***
Cultivars‘Bellarosa’79.00a ± 0.4476.20a ± 0.4882.80a ± 3.64
‘Tajfun’78.60a ± 0.4276.60a ± 3.1377.60b ± 1.85
HSD p0.052.1
L*—parameter, ** A—3 applications of fungicide, B—3 applications, C—5 applications, and D—8 applications of effective organisms (EmFarmaTM plus Ema5TM); *** not significant at p0.05.
Table 7. Effects of cultivation practices, cultivars, and years on the a* parameter of raw tubers.
Experimental Factors201520162017
Cultivation practices **A3.02a ± 0.143.30a ± 0.113.45a ± 0.07
B2.96ab ± 0.123.28a ± 0.133.38a ± 0.10
C2.26b ± 0.082.64b ± 0.102.71b ± 0.09
D2.55a ± 0.162.88a ± 0.083.00a ± 0.13
HSD p0.05ns ***
Cultivars‘Bellarosa’2.45b ± 0.092.48b ± 0.052.81b ± 0.04
‘Tajfun’2.94a ± 0.033.57a ± 0.073.47a ± 0.18
HSD p0.05 0.6
Parameter a*—green to red color, ** A—3 applications of fungicide, B—3 applications, C—5 applications, and D—8 applications of effective organisms (EmFarmaTM plus Ema5TM); *** not significant at p0.05.
Table 8. Effects of cultivation practices, cultivars, and years on the b* parameter.
Experimental Factors201520162017
Cultivation practices **A39.85a ± 0.2340.49a ± 1.0441.72a ± 1.57
B42.56a ± 0.1642.84.a ± 1.7444.34a ± 1.25
C41.50a ± 0.2842.36a ± 1.1643.58a ± 1.81
D41.70a ± 0.6544.11a ± 0.8344.56a ± 1.37
HSD p0.05ns ***
Cultivars‘Bellarosa’40.80a ± 0.0340.90b ± 0.6941.40b ± 2.24
‘Tajfun’42.00a ± 0.4944.00a ± 0.9245.70a ± 1.19
HSD p0.052.1
Parameter *b—blue to yellow color; **—A—3 applications of fungicide, B—3 applications, C—5 applications, and D—8 applications of effective organisms (EmFarmaTM plus Ema5TM); *** not significant at p0.05
Table 9. Influence of cultivation practices, varieties, and years on the content of DM, starch, total sugars, reducing sugars, and saccharose.
SpecificationDM
(%)
Starch (%)Vitamin C
(mg·kg−1)
Total
Sugars (%)
Reducing Sugars (%)Saccharose
(%)
Cultivation
practices *
A22.3b ± 0.115.2b ± 0.214.8 a ± 0.10.66 a ± 0.020.37 a ± 0.020.29 a ± 0.02
B22.7a ± 0.115.6a ± 0.315.1 a ± 0.10.60 b ± 0.010.34 b ± 0.010.26 b ± 0.01
C22.7a ± 0.215.5ab ± 0.314.9 a ± 0.10.60 b ± 0.020.34 b ± 0.010.26 b ± 0.01
D22.6ab ± 0.115.4ab ± 0.114.9 a ± 0.10.60 b ± 0.010.34 b ± 0.010.26 b ± 0.01
HSD p0.050.40.4ns **0.050.030.03
Cultivars’Bellarosa’21.1b ± 0.114.2b ± 0.211.9 b ± 0.10.65 a ± 0.020.37 a ± 0.020.28 a ± 0.02
‘Tajfun’24.1a ± 0.316.6a ± 0.118.0 a ± 0.10.58 b ± 0.010.33 b ± 0.010.25 b ± 0.01
HSD p0.050.20.20.20.030.020.01
Years201523.0a ± 0.215.1b ± 0.213.9 b ± 0.10.57 b ± 0.010.32 b ± 0.010.25 b ± 0.01
201621.7b ± 0.315.6a ± 0.314.1 b ± 0.10.87 a ± 0.020.49 a ± 0.020.38 a ± 0.02
201723.1a ± 0.215.6a ± 0.216.7 a ± 0.10.41 c ± 0.010.23 c ± 0.010.18 c ± 0.01
HSD p0.050.30.30.30.040.030.02
* A—3 applications of fungicide, B—3 applications, C—5 applications, and D—8 applications of effective organisms (EmFarmaTM plus Ema5TM); ** not significant at p0.05.
Table 10. Influence of cultivation practices, cultivars, and years on DM, starch, and vitamin C content.
Experimental FactorsDM (%)Starch (%)Vitamin C
(mg·kg−1)
Years
201520162017201520162017201520162017
Cultivation practices *A22.7a21.4b22.7a14.9a15.4a15.3a13.7b13.9b16.7a
B23.3a21.8b23.1a15.2a15.8a15.9a14.2b14.5b16.7a
C23.2a21.8b23.2a15.2a15.7a15.7a13.9b14.1b16.6a
D23.2a21.6b23.1a15.1a15.6a15.6a13.9b14.1b16.6a
HSD p0.051.2ns **1.3
Cultivars‘Bellarosa’21.4b20.3b21.6b14.5b14.2b13.9b10.3b12.3b13.0b
‘Tajfun’24.7a23.0a24.4a15.7a17.0a17.3a17.5a16.0a20.4a
HSD p0.050.60.60.7
* A—3 applications of fungicide, B—3 applications, C—5 applications, and D—8 applications of effective organisms (EmFarmaTM plus Ema5TM); ** not significant at p0.05.
Table 11. Influence of cultivation practices, cultivars, and years on total sugars, reducing sugars, and saccharose.
Experimental FactorsTotal Sugars (%)Reducing Sugars (%)Saccharose (%)
Years
201520162017201520162017201520162017
Cultivation practices *A0.62b0.93a0.45c0.35b0.52a0.26b0.27b0.40a0.20b
B0.55b0.86a0.39c0.31b0.49a0.22b0.24b0.37a0.17b
C0.55b0.86a0.40c0.31b0.48a0.22b0.24b0.37a0.17b
D0.56b0.86a0.40c0.32b0.48a0.22b0.24b0.37a0.17b
HSD p0.050.160.100.09
Cultivars‘Bellarosa’0.62a0.92a0.42a0.35a0.52a0.24a0.27a0.40a0.18a
‘Tajfun’0.52b0.83b0.40a0.30b0.47b0.22a0.23b0.36b0.17a
HSD p0.050.080.050.04
* A—3 applications of fungicide, B—3 applications, C—5 applications, and D—8 applications of effective organisms (EmFarmaTM plus Ema5TM).
Table 12. Influence of varieties, cultivation practices, years, and their interactions on the color parameters of raw potato flesh, DM, starch, total sugars, reducing sugars, saccharose and their percentage share of total variance.
TraitSignificance of the InfluencePercentage of Variance Share in the Total Variance
(Phenotypical One)
VarietiesYearsCultivation PracticesVarieties × Cultivation PracticesCultivations Practices × YearsVarieties × Cult. Practice × YearsVarietiesYearsCultivation PracticesVarieties × Cultivation PracticesCultivations Practices × YearsVarieties × Cultivation Practices × Years
L*************22.815.78.723.011.217.8
a************23.36.29.615,315.729.2
b***********17.58.56.415.916.834.9
DM************5.78.611.422.834.317.1
Starch*******ns**5.48.210.923.63.436.9
Vitamin C****ns******6.39.42.825.137.618.8
Total sugars************10.215.320.340.761.030.5
Reducing sugars***********5.78.811.422.934.117.0
Saccharose**********4.77.09.418.728.114.0
* Significant at p ≤ 0.05; ** significant at p ≤ 0.01.
Table 13. Descriptive statistics of chemical composition of tubers and color in the CIELab system of raw tuber flesh.
Specificationx1x2x3x4x5x6y1y2y3
Average22.5815.430.620.350.2714.9277.383.0142.02
Median22.3514.990.590.330.2614.5177.383.1341.90
Standard deviation1.651.350.200.110.093.433.430.612.55
Kurtosis1.42−1.55−1.38−1.38−1.38−1.210.48−0.54−0.35
Skewness0.050.300.370.370.370.260.12−0.52−0.38
Range5.004.050.600.340.2610.7617.372.3811.20
Minimum19.9013.570.360.200.1610.0569.551.6335.51
Maximum24.9017.630.960.540.4220.8186.924.0146.71
RSD (%)7.298.7432.3732.3732.3722.994.4320.316.06
x1—DM, x2—starch, x3—total sugars; x4—reducing sugars; x5—saccharose; x6—vitamin C; y1—L*, y2—a*; y3—b*.
Table 14. Pearson’s simple correlation coefficients.
Specificationx1x2x3x4x5x6y1y2y3
x11.00
x20.77 **1.00
x3−0.53 **−0.121.00
x4−0.53 **−0.120.99 **1.00
x5−0.53 **−0.120.98 **0.99 **1.00
x60.88 **0.83 **−0.40 *−0.40 **−0.40 **1.00
y10.01−0.21−0.46 **−0.46 **−0.46 **−0.121.00
y20.030.200.110.110.110.23−0.251.00
y30.130.24−0.27 *−0.27 *−0.27 *0.31 *0.37 *0.34 *1.00
x1—DM, x2—starch, x3—total sugars; x4—reducing sugars; x5—saccharose; x6—vitamin C; y1—L*, y2—a*; y3—b*. * significant at p ≤ 0.05; ** significant at p ≤ 0.01.
Table 15. Relationships between raw tuber flesh color indices and their quality elements.
Dependent VariablesRegression EquationSignificance LevelCoefficient of Determination (%)
y1Y1 = 89.134 − 10.36x1 − 0.359x40.00166.42
y2Y2= 2.798 − 0.339x10.03531.07
y3Y3= 44.125 − 3.471x10.02237.78
x1—DM, x2—starch, x3—total sugar; x4—reducing sugars; x5—saccharose; x6—vitamin C; y1—L*, y2—a*; y3—b.
Publisher’s Note: MDPI stays neutral with regard to jurisdictional claims in published maps and institutional affiliations.

