
Responses of Hydrodynamics and Saline Water Intrusion to Typhoon Fongwong in the North Branch of the Yangtze River Estuary


Abstract
:1. Introduction
2. Numerical Model
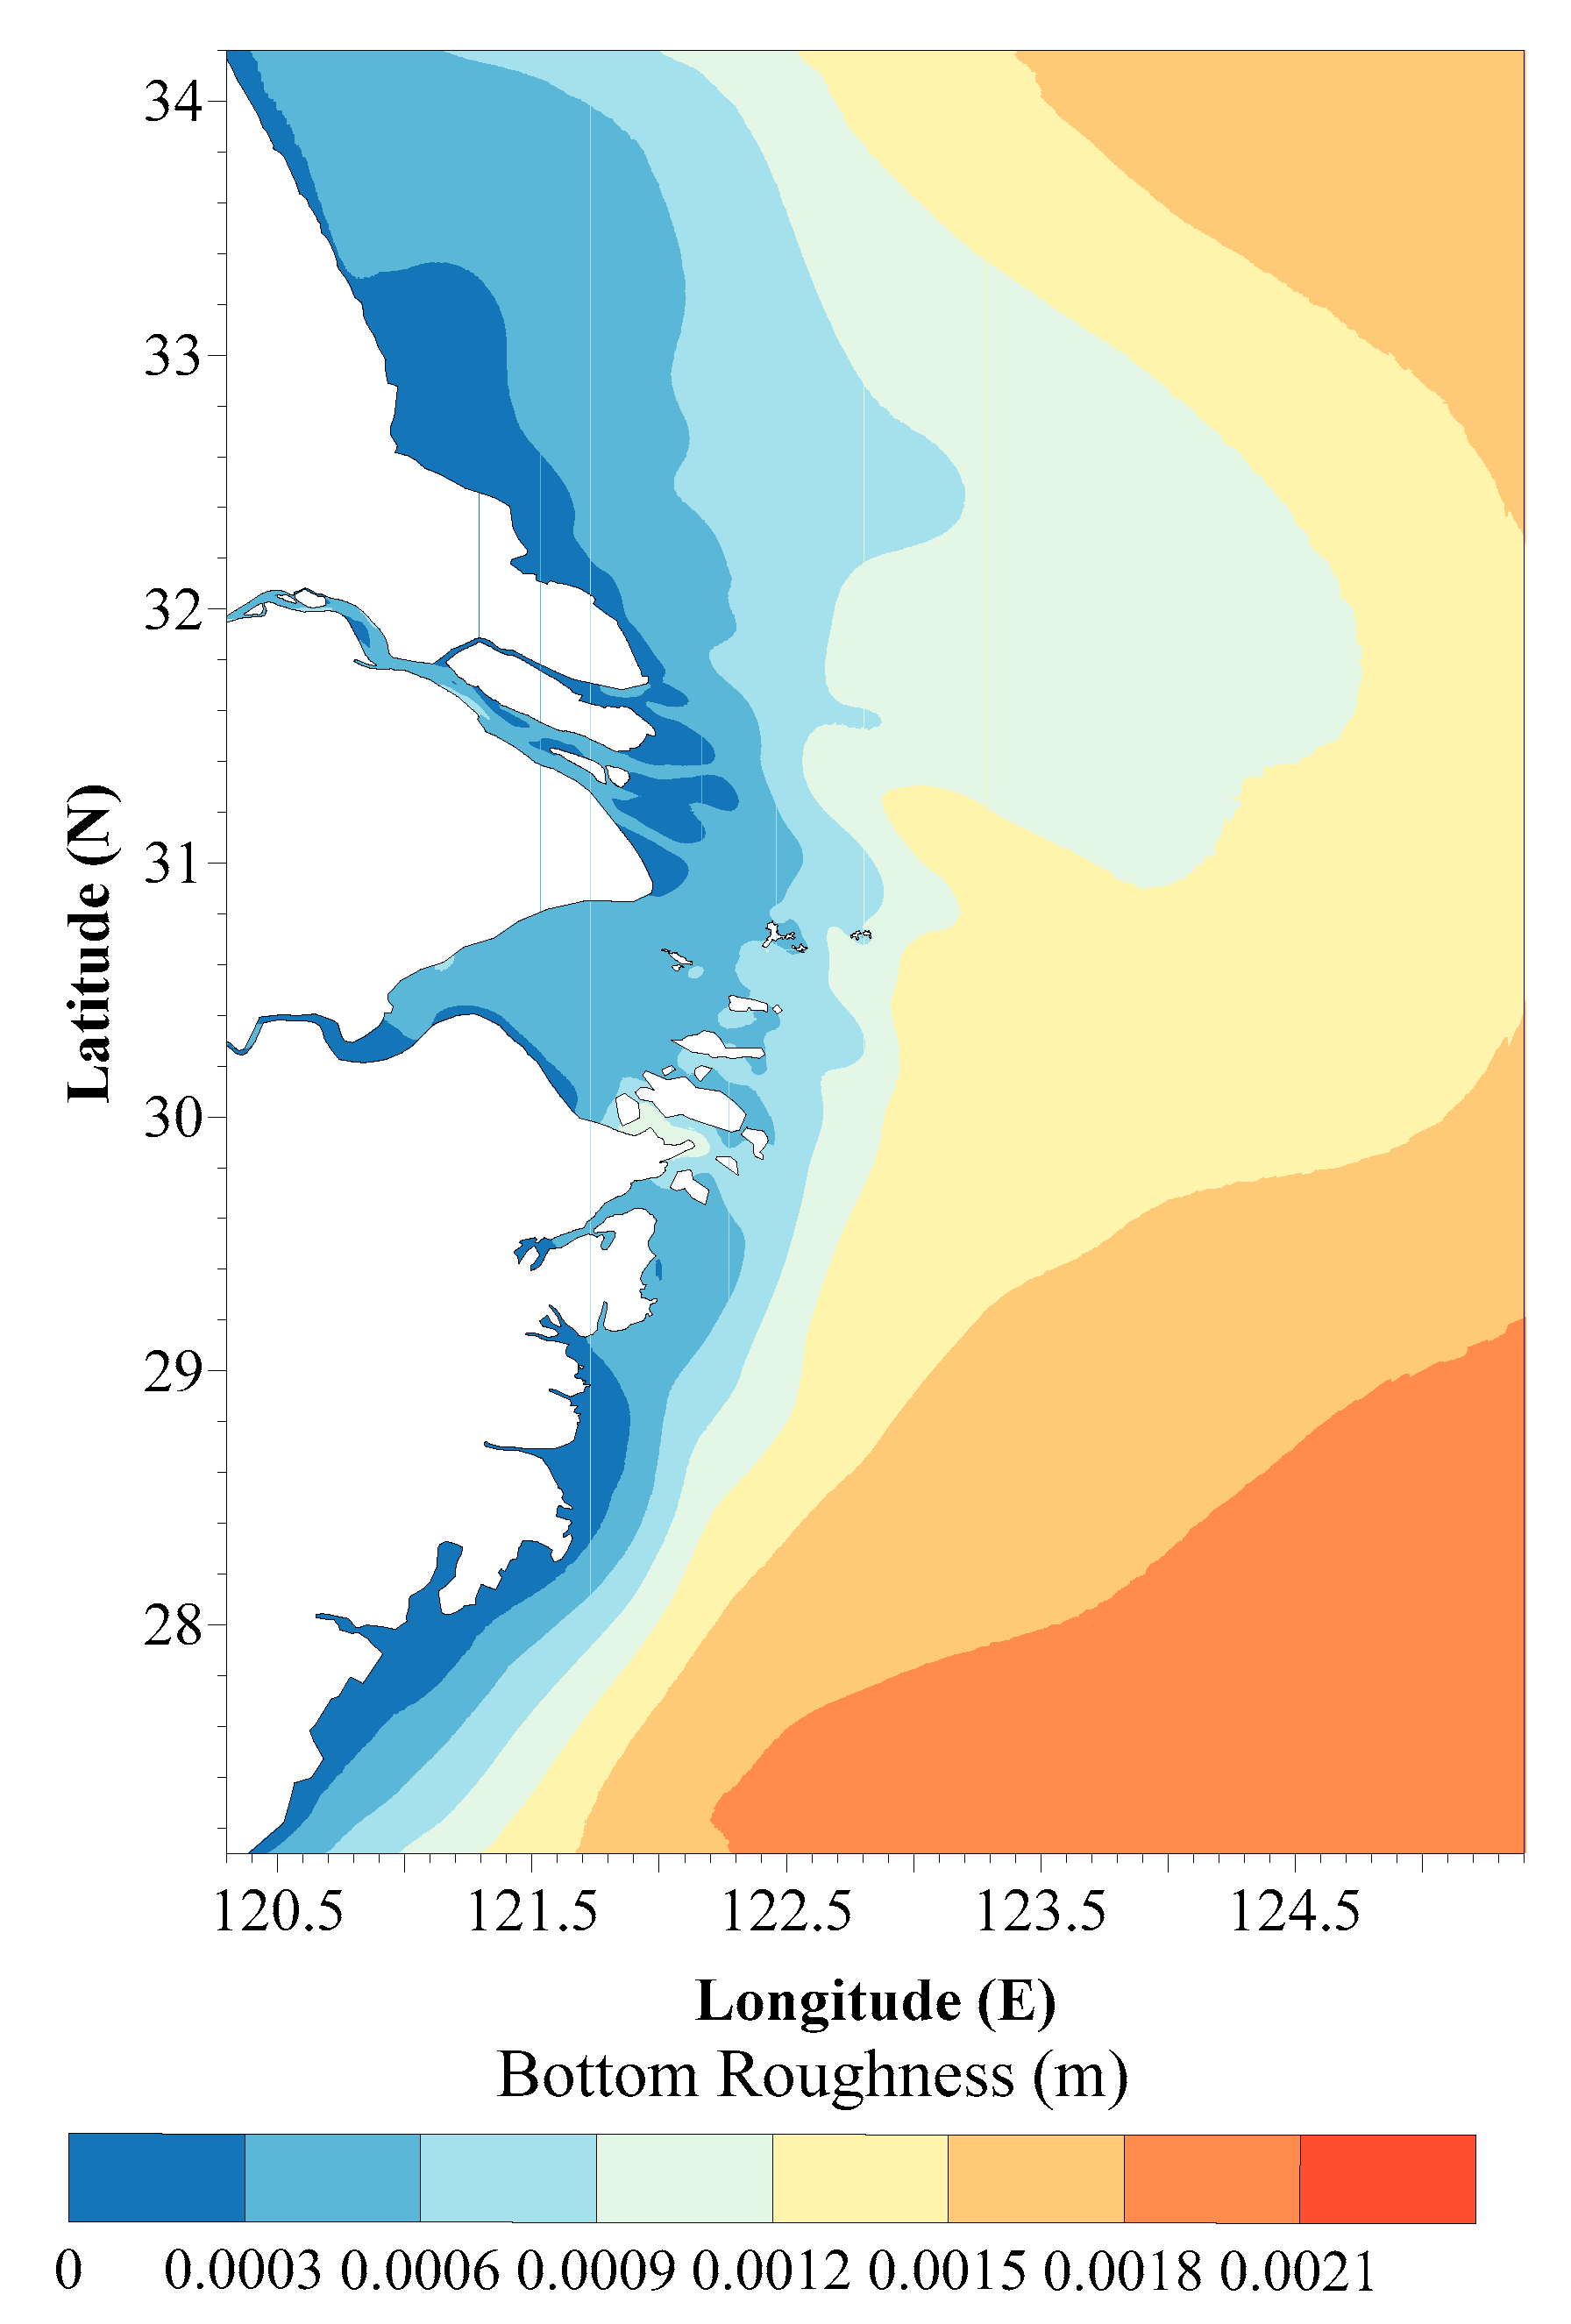
2.1. Model Setup
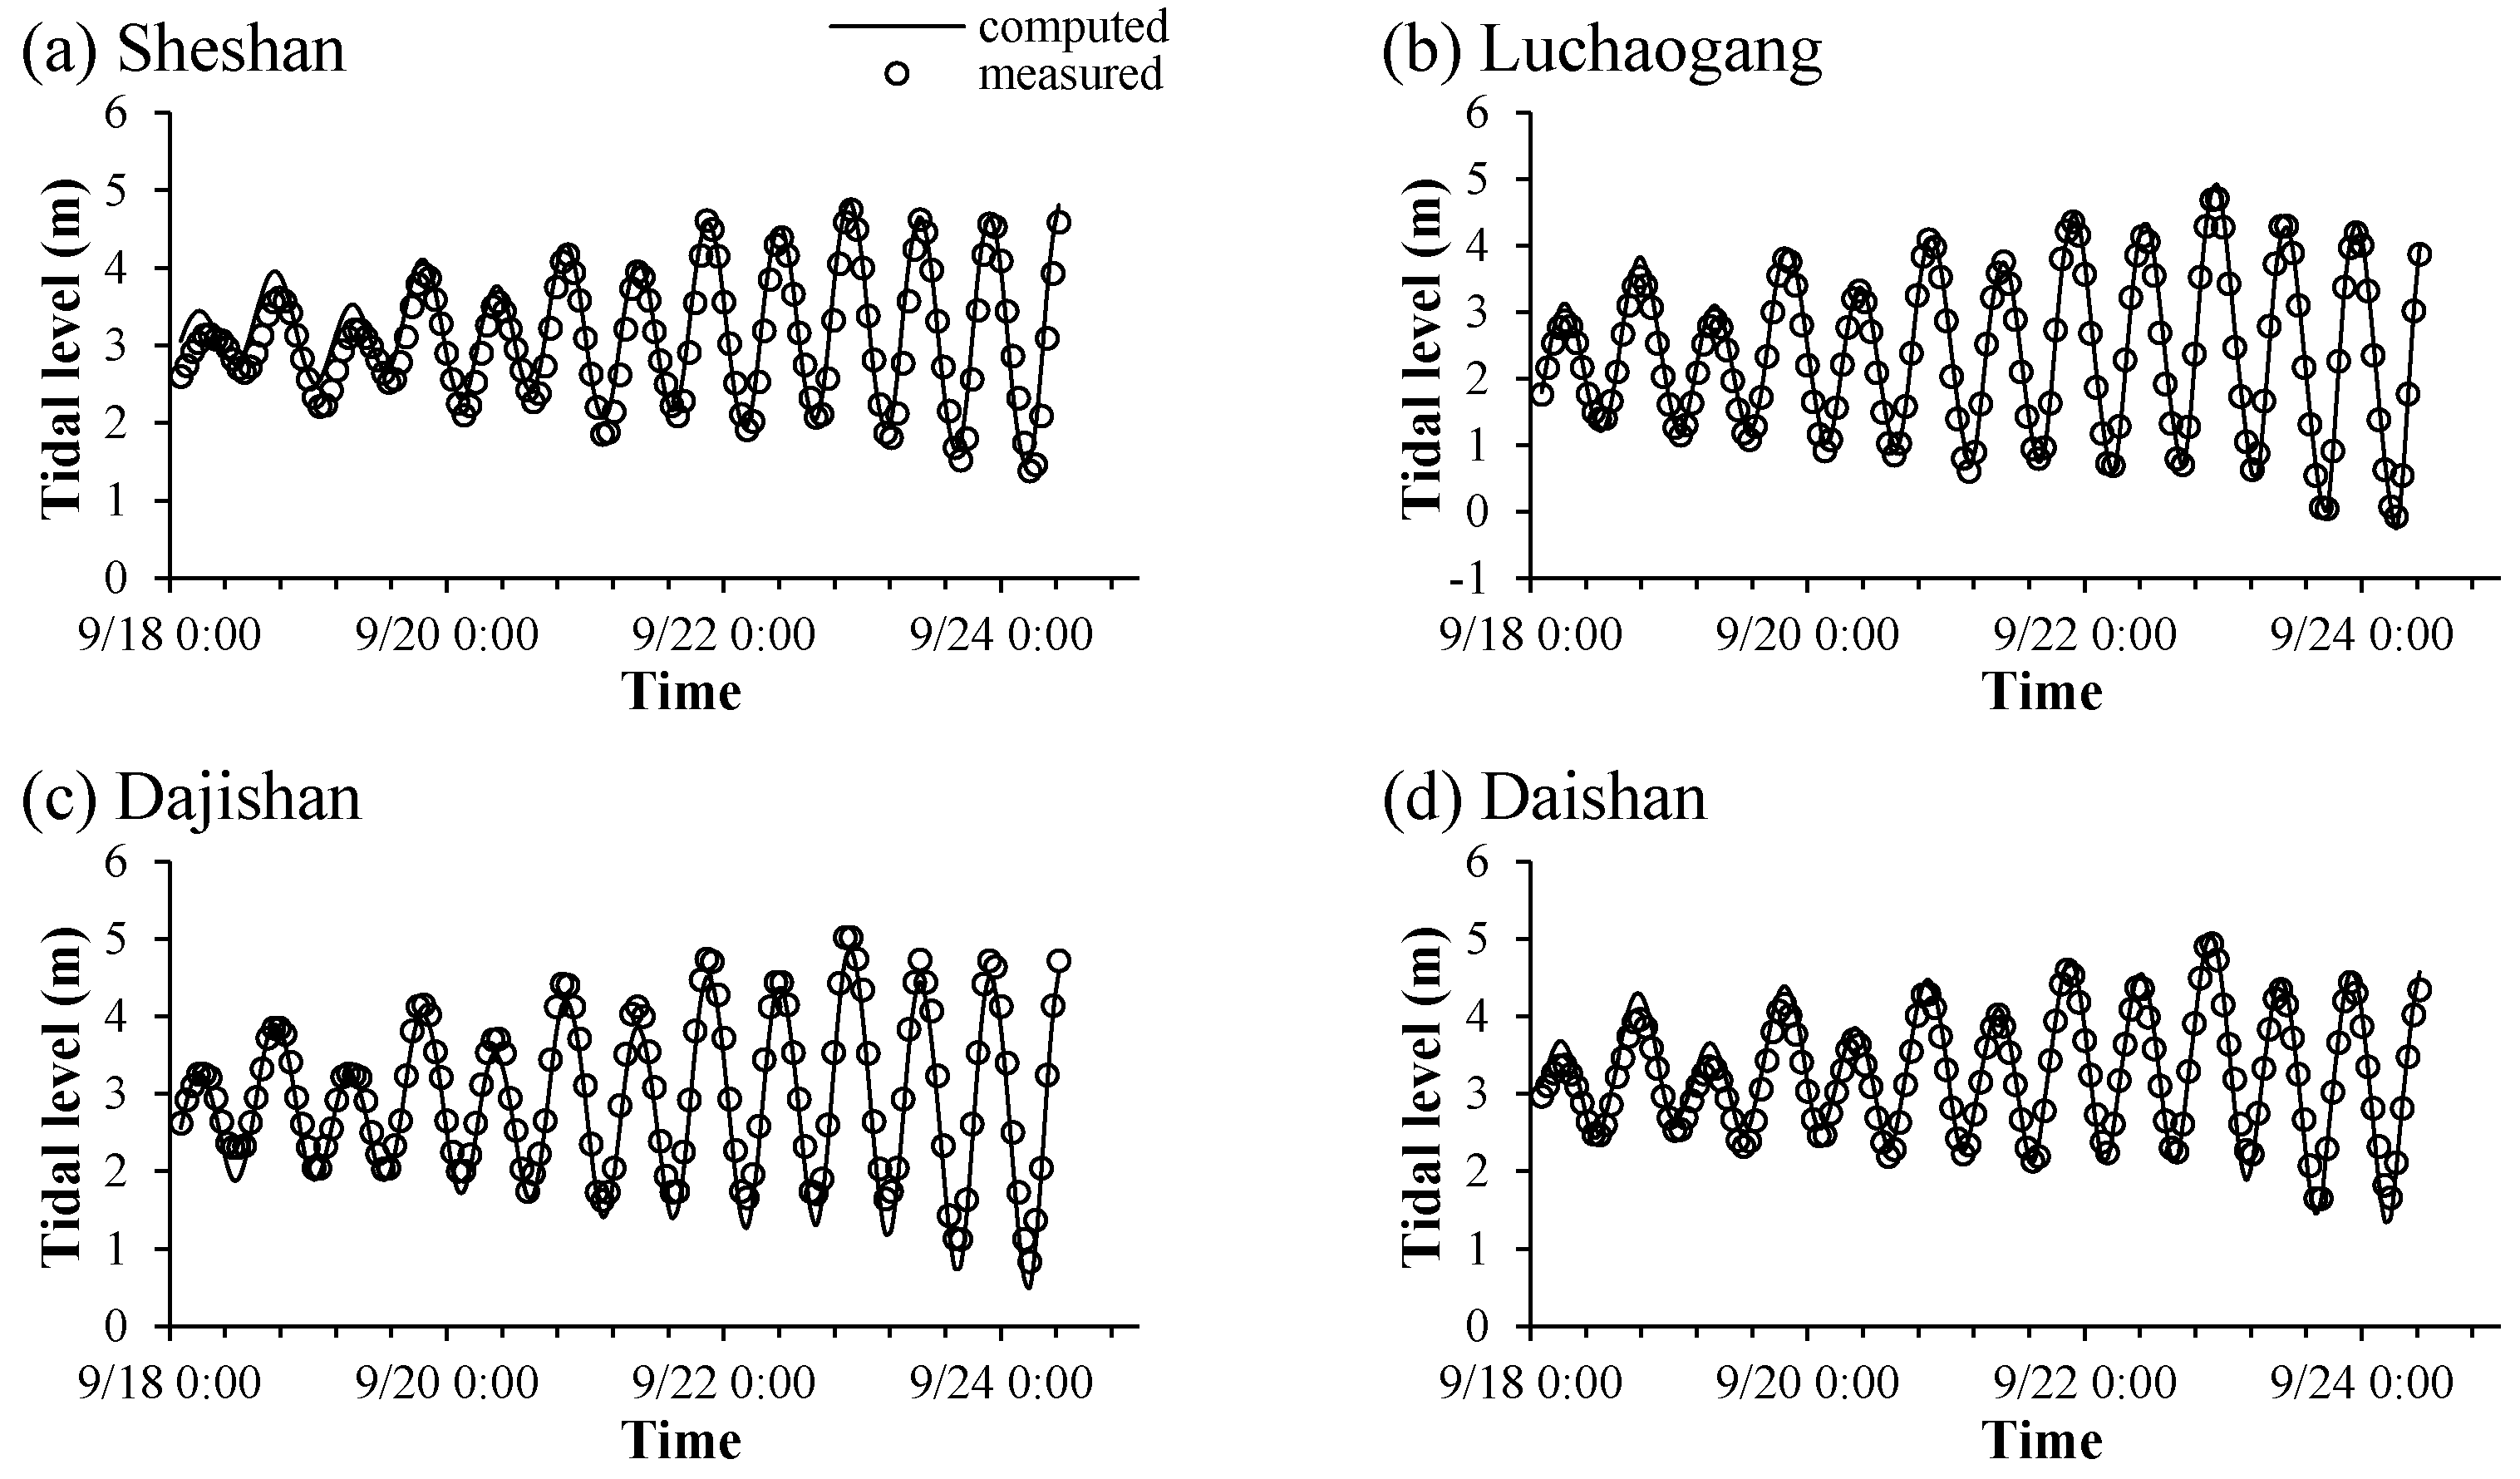
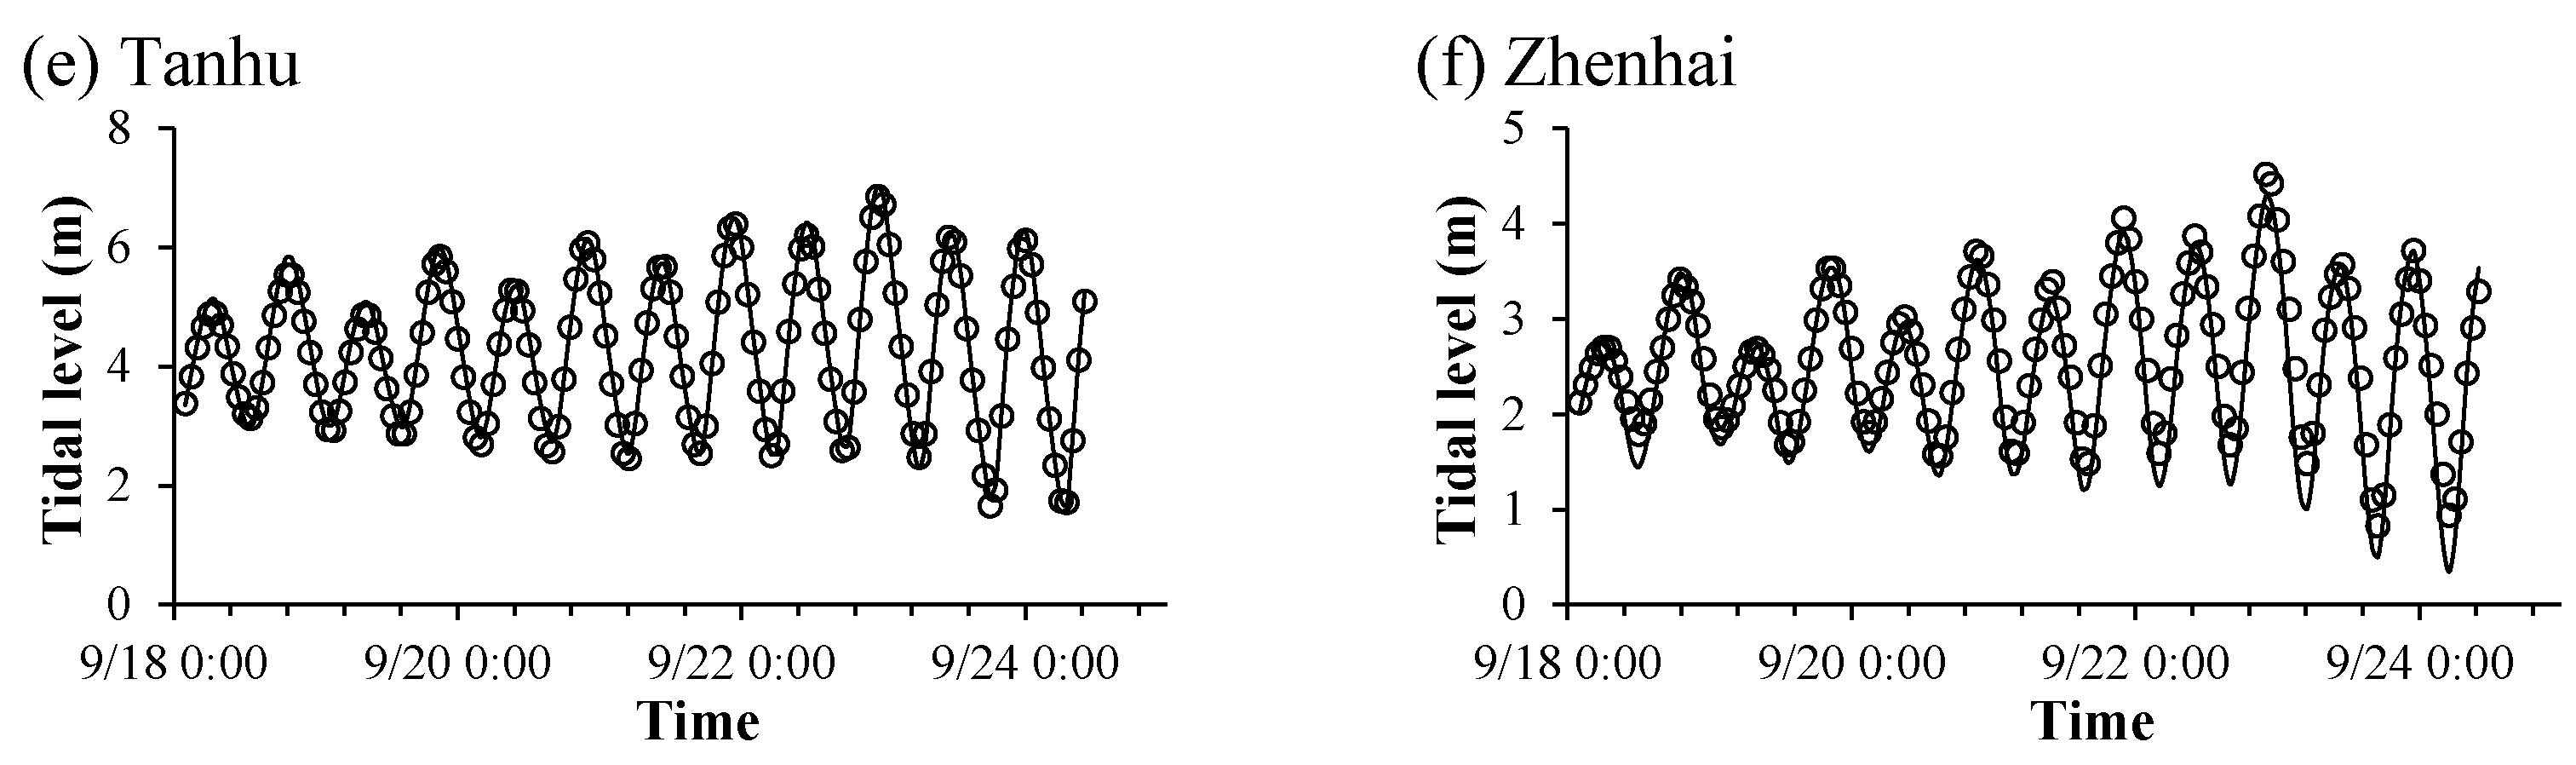
2.2. Model Verification
3. Results
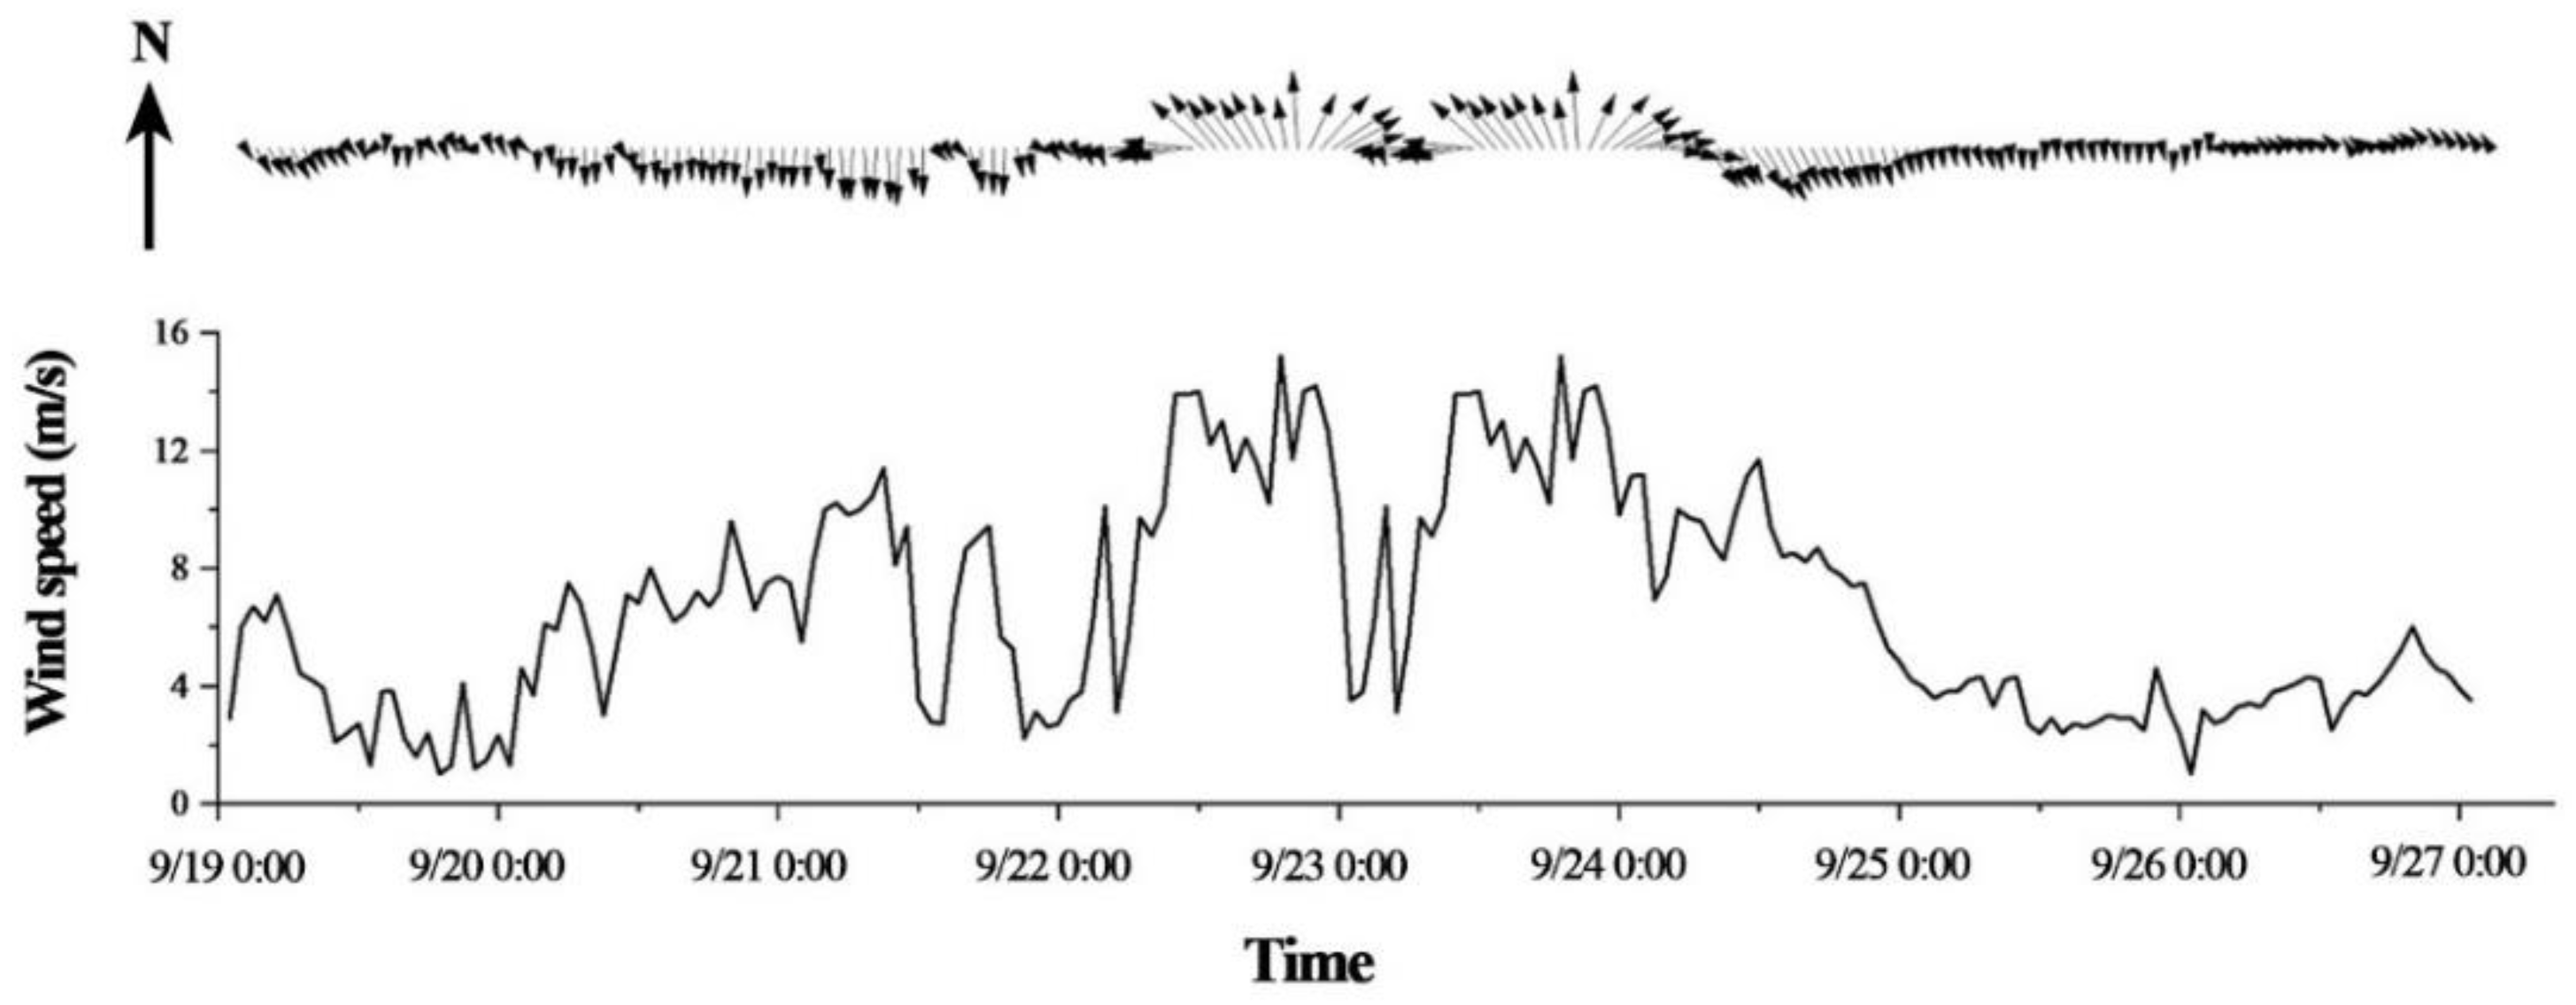
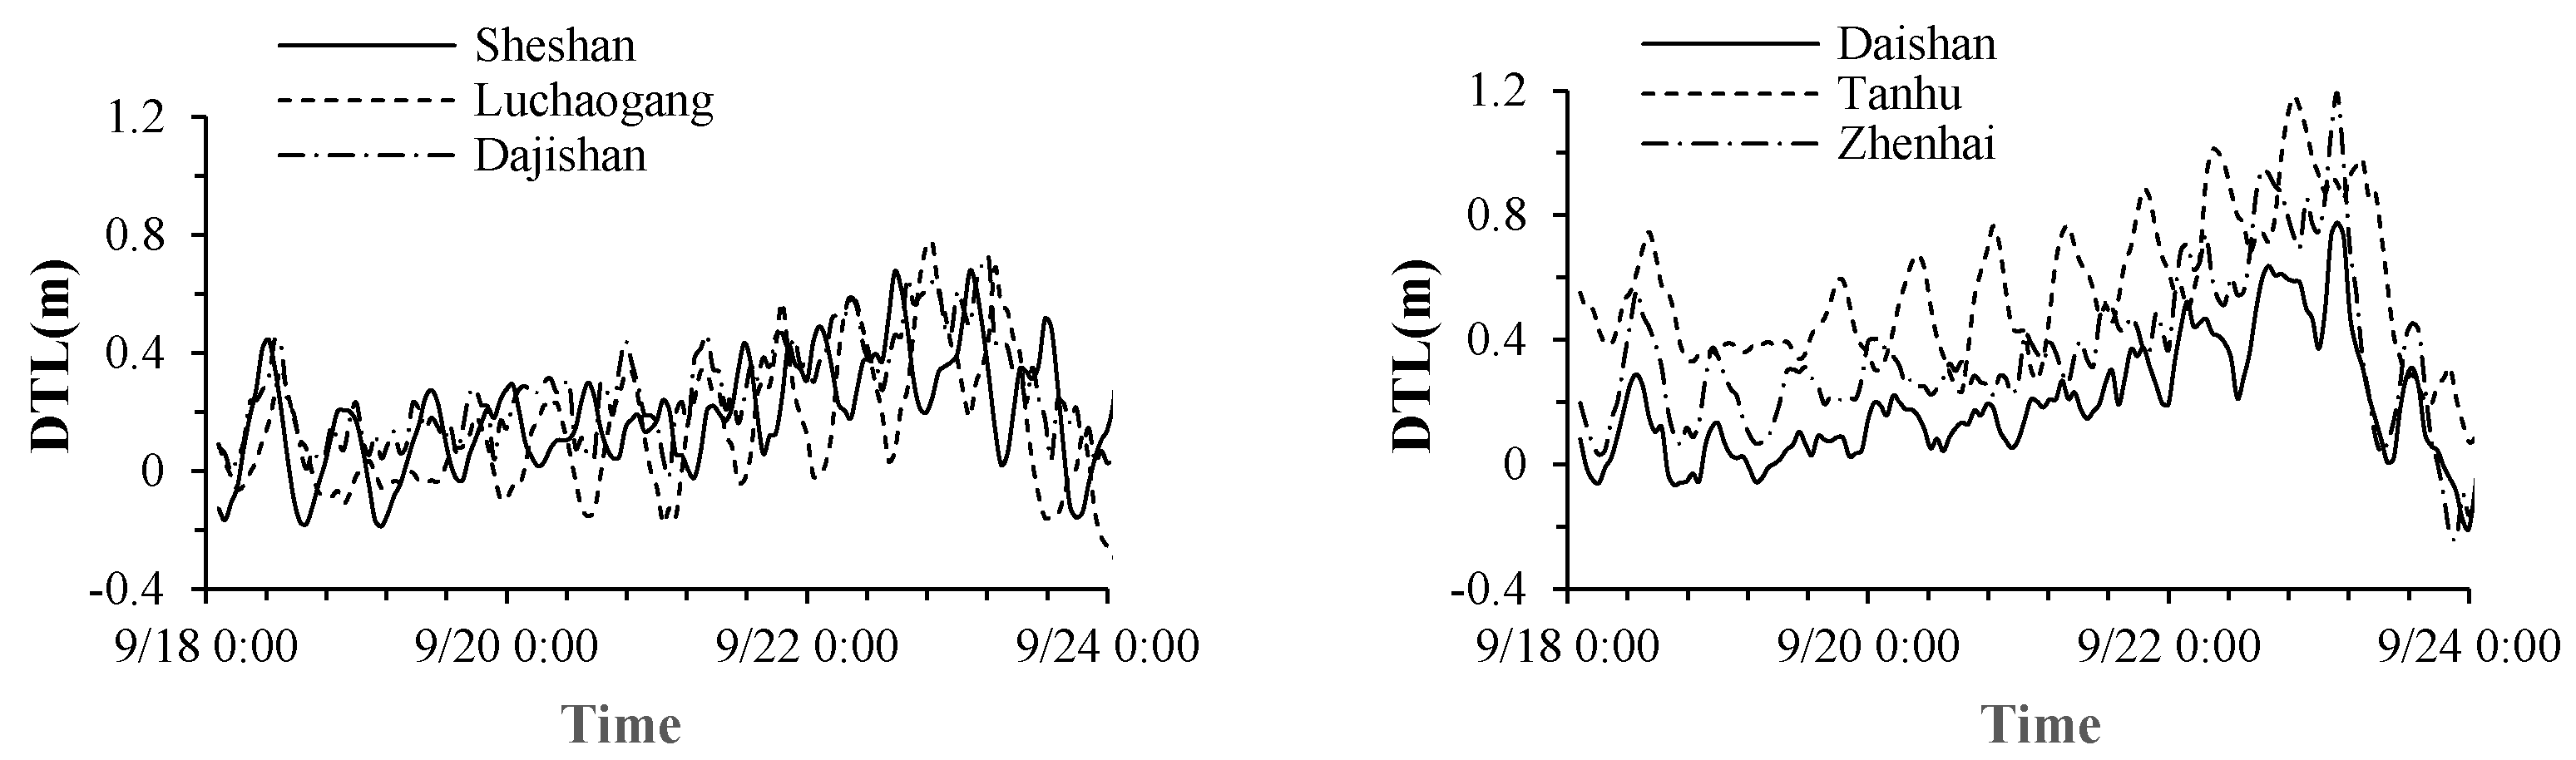
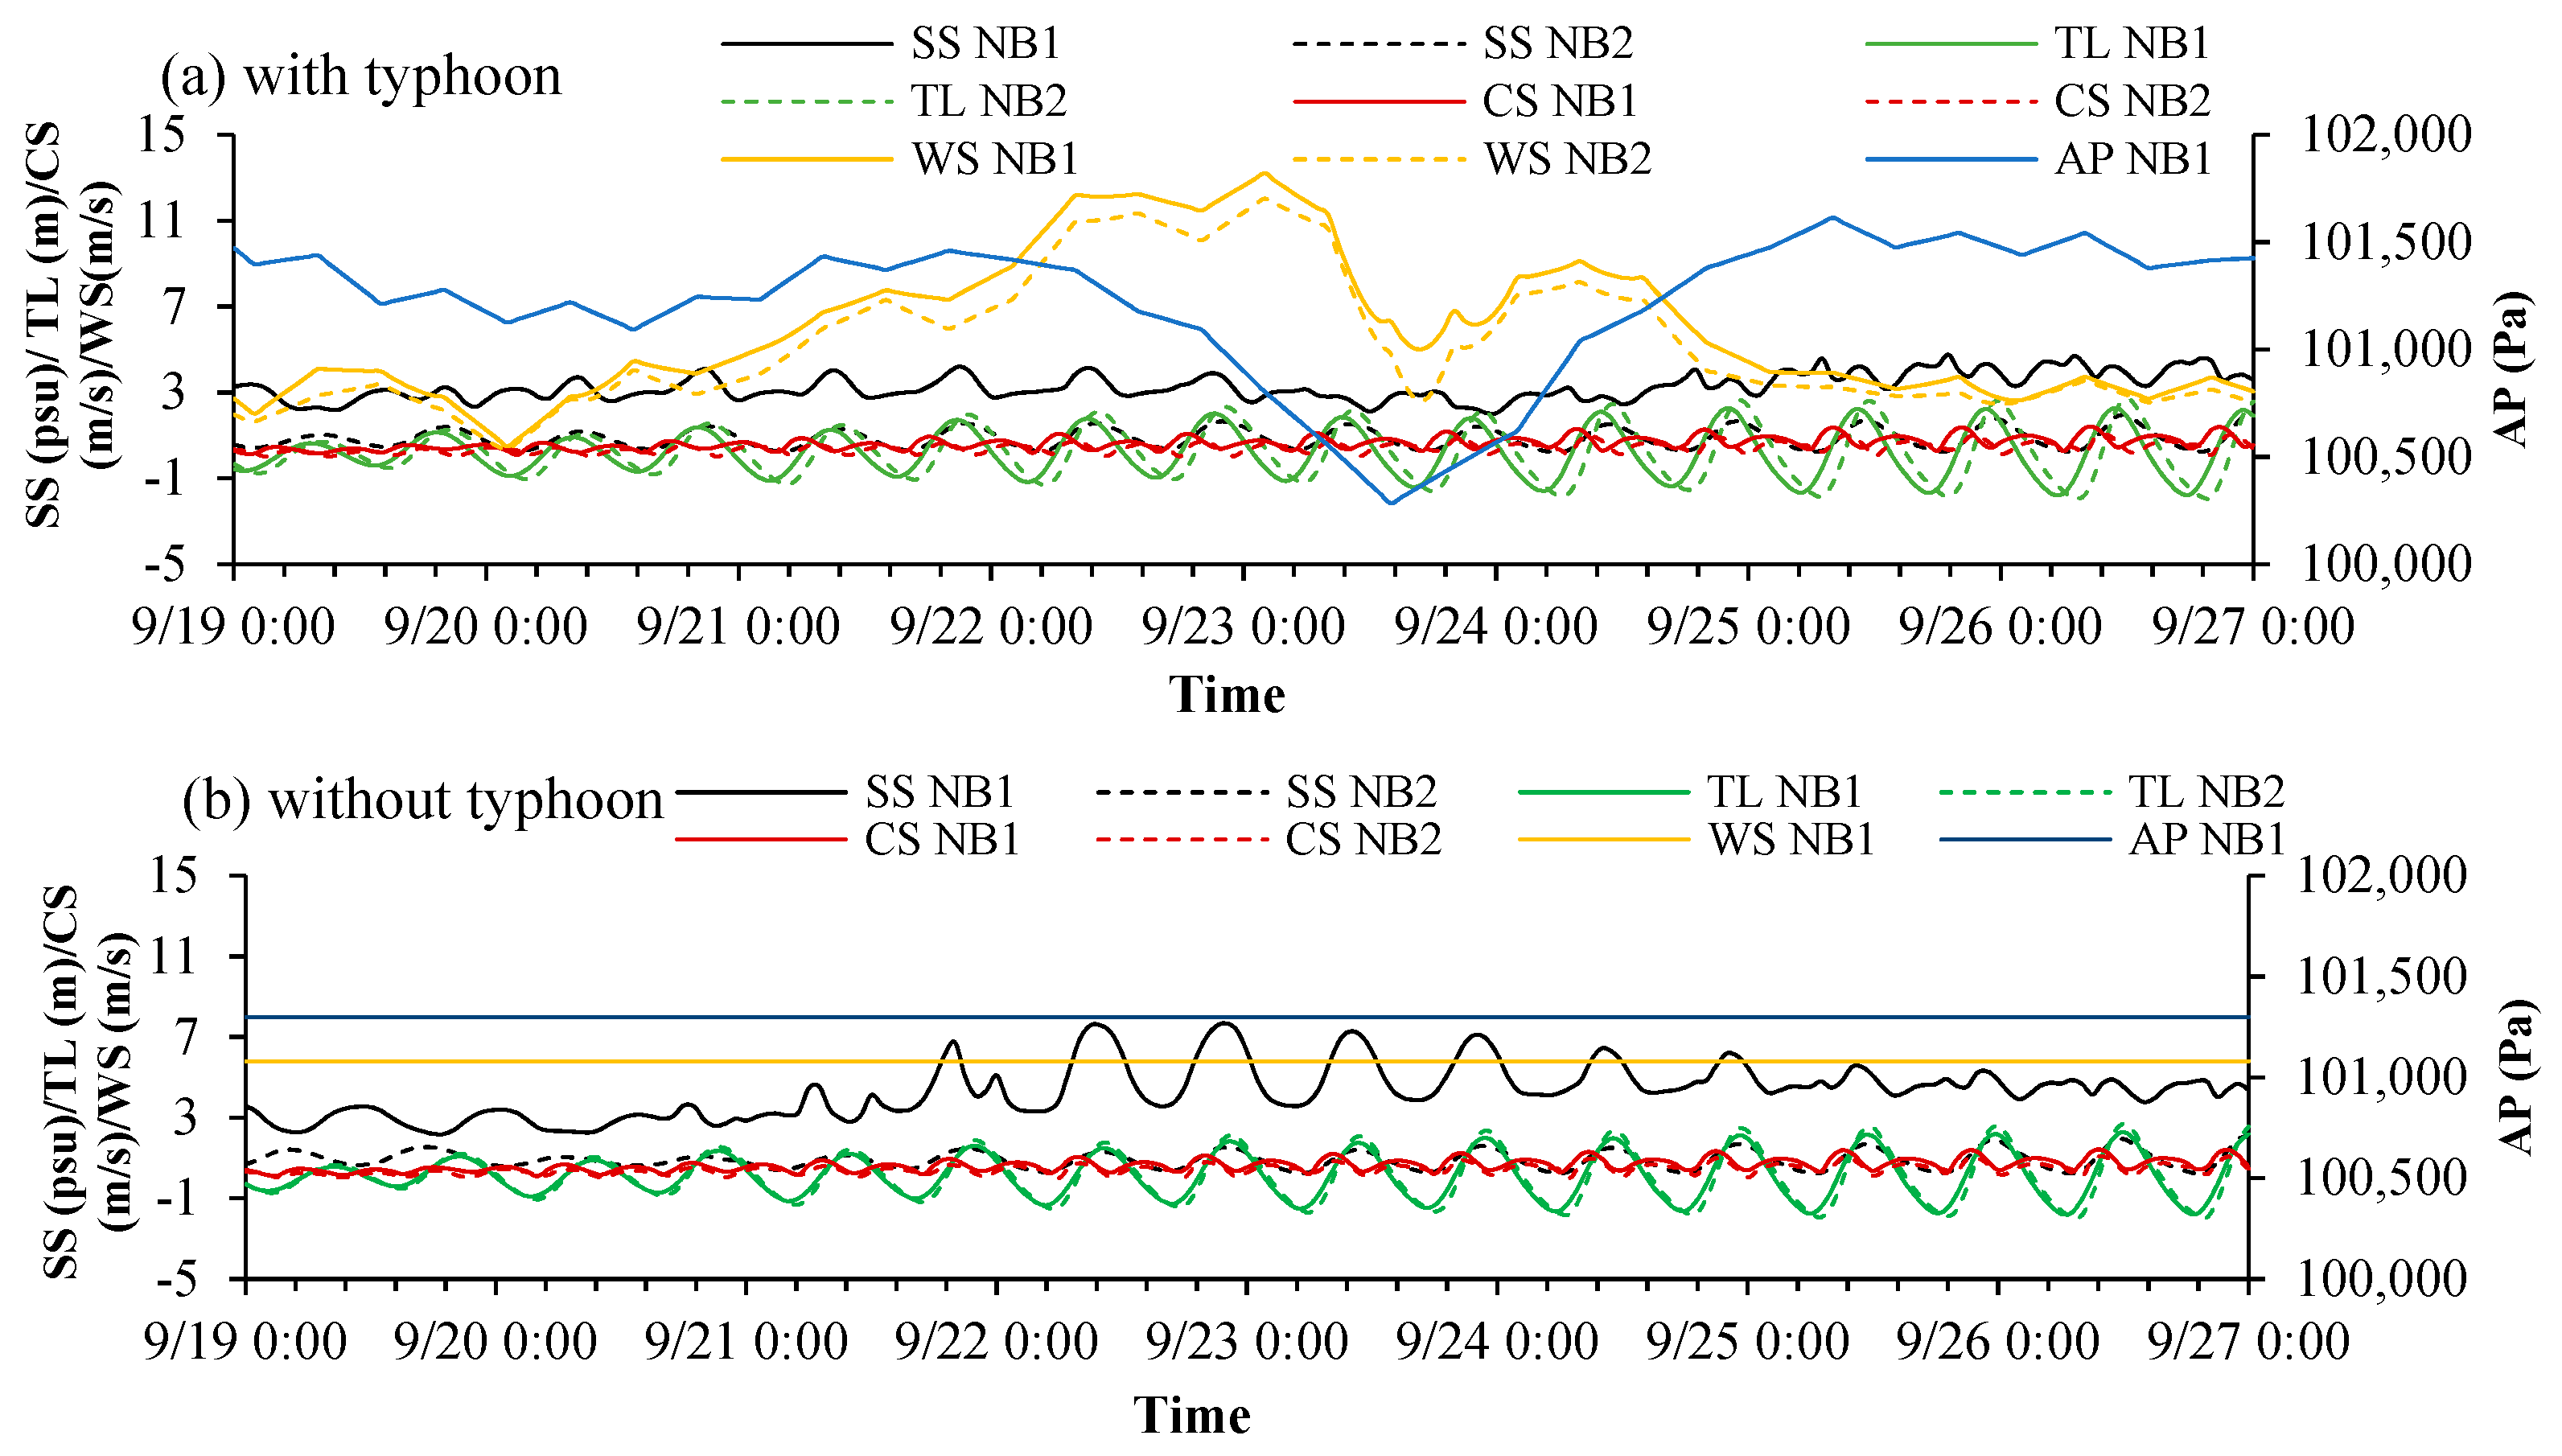
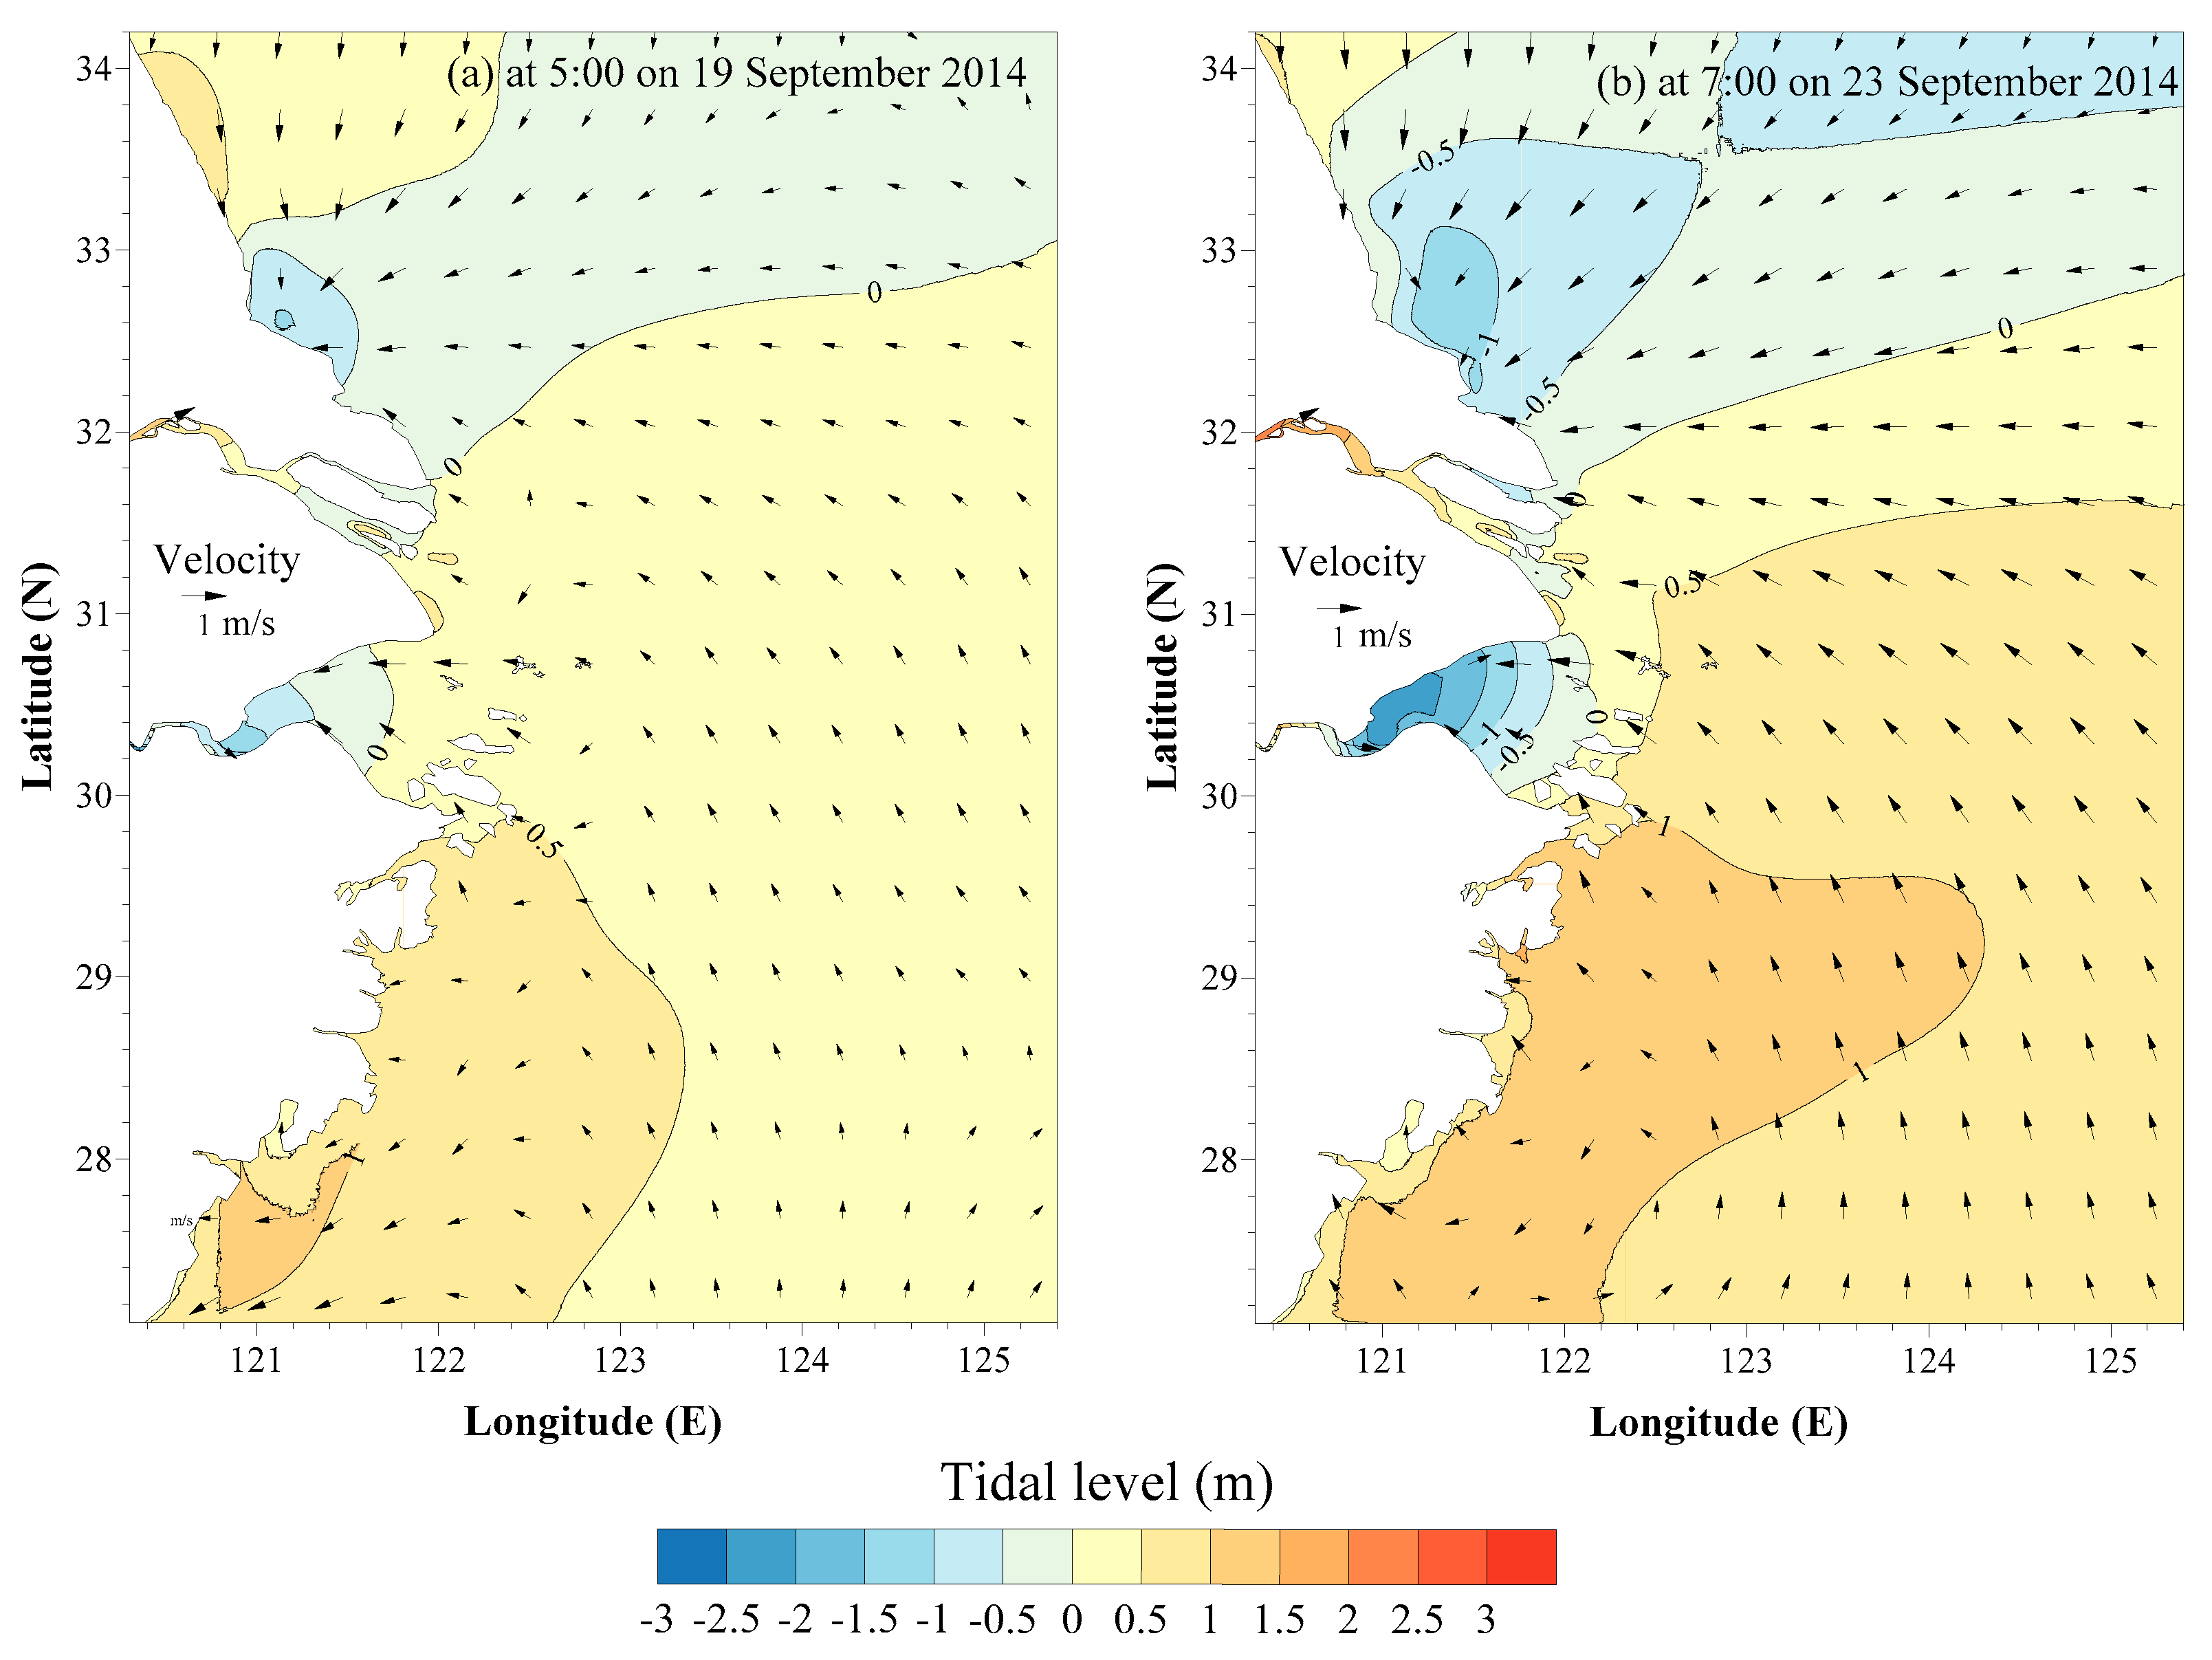
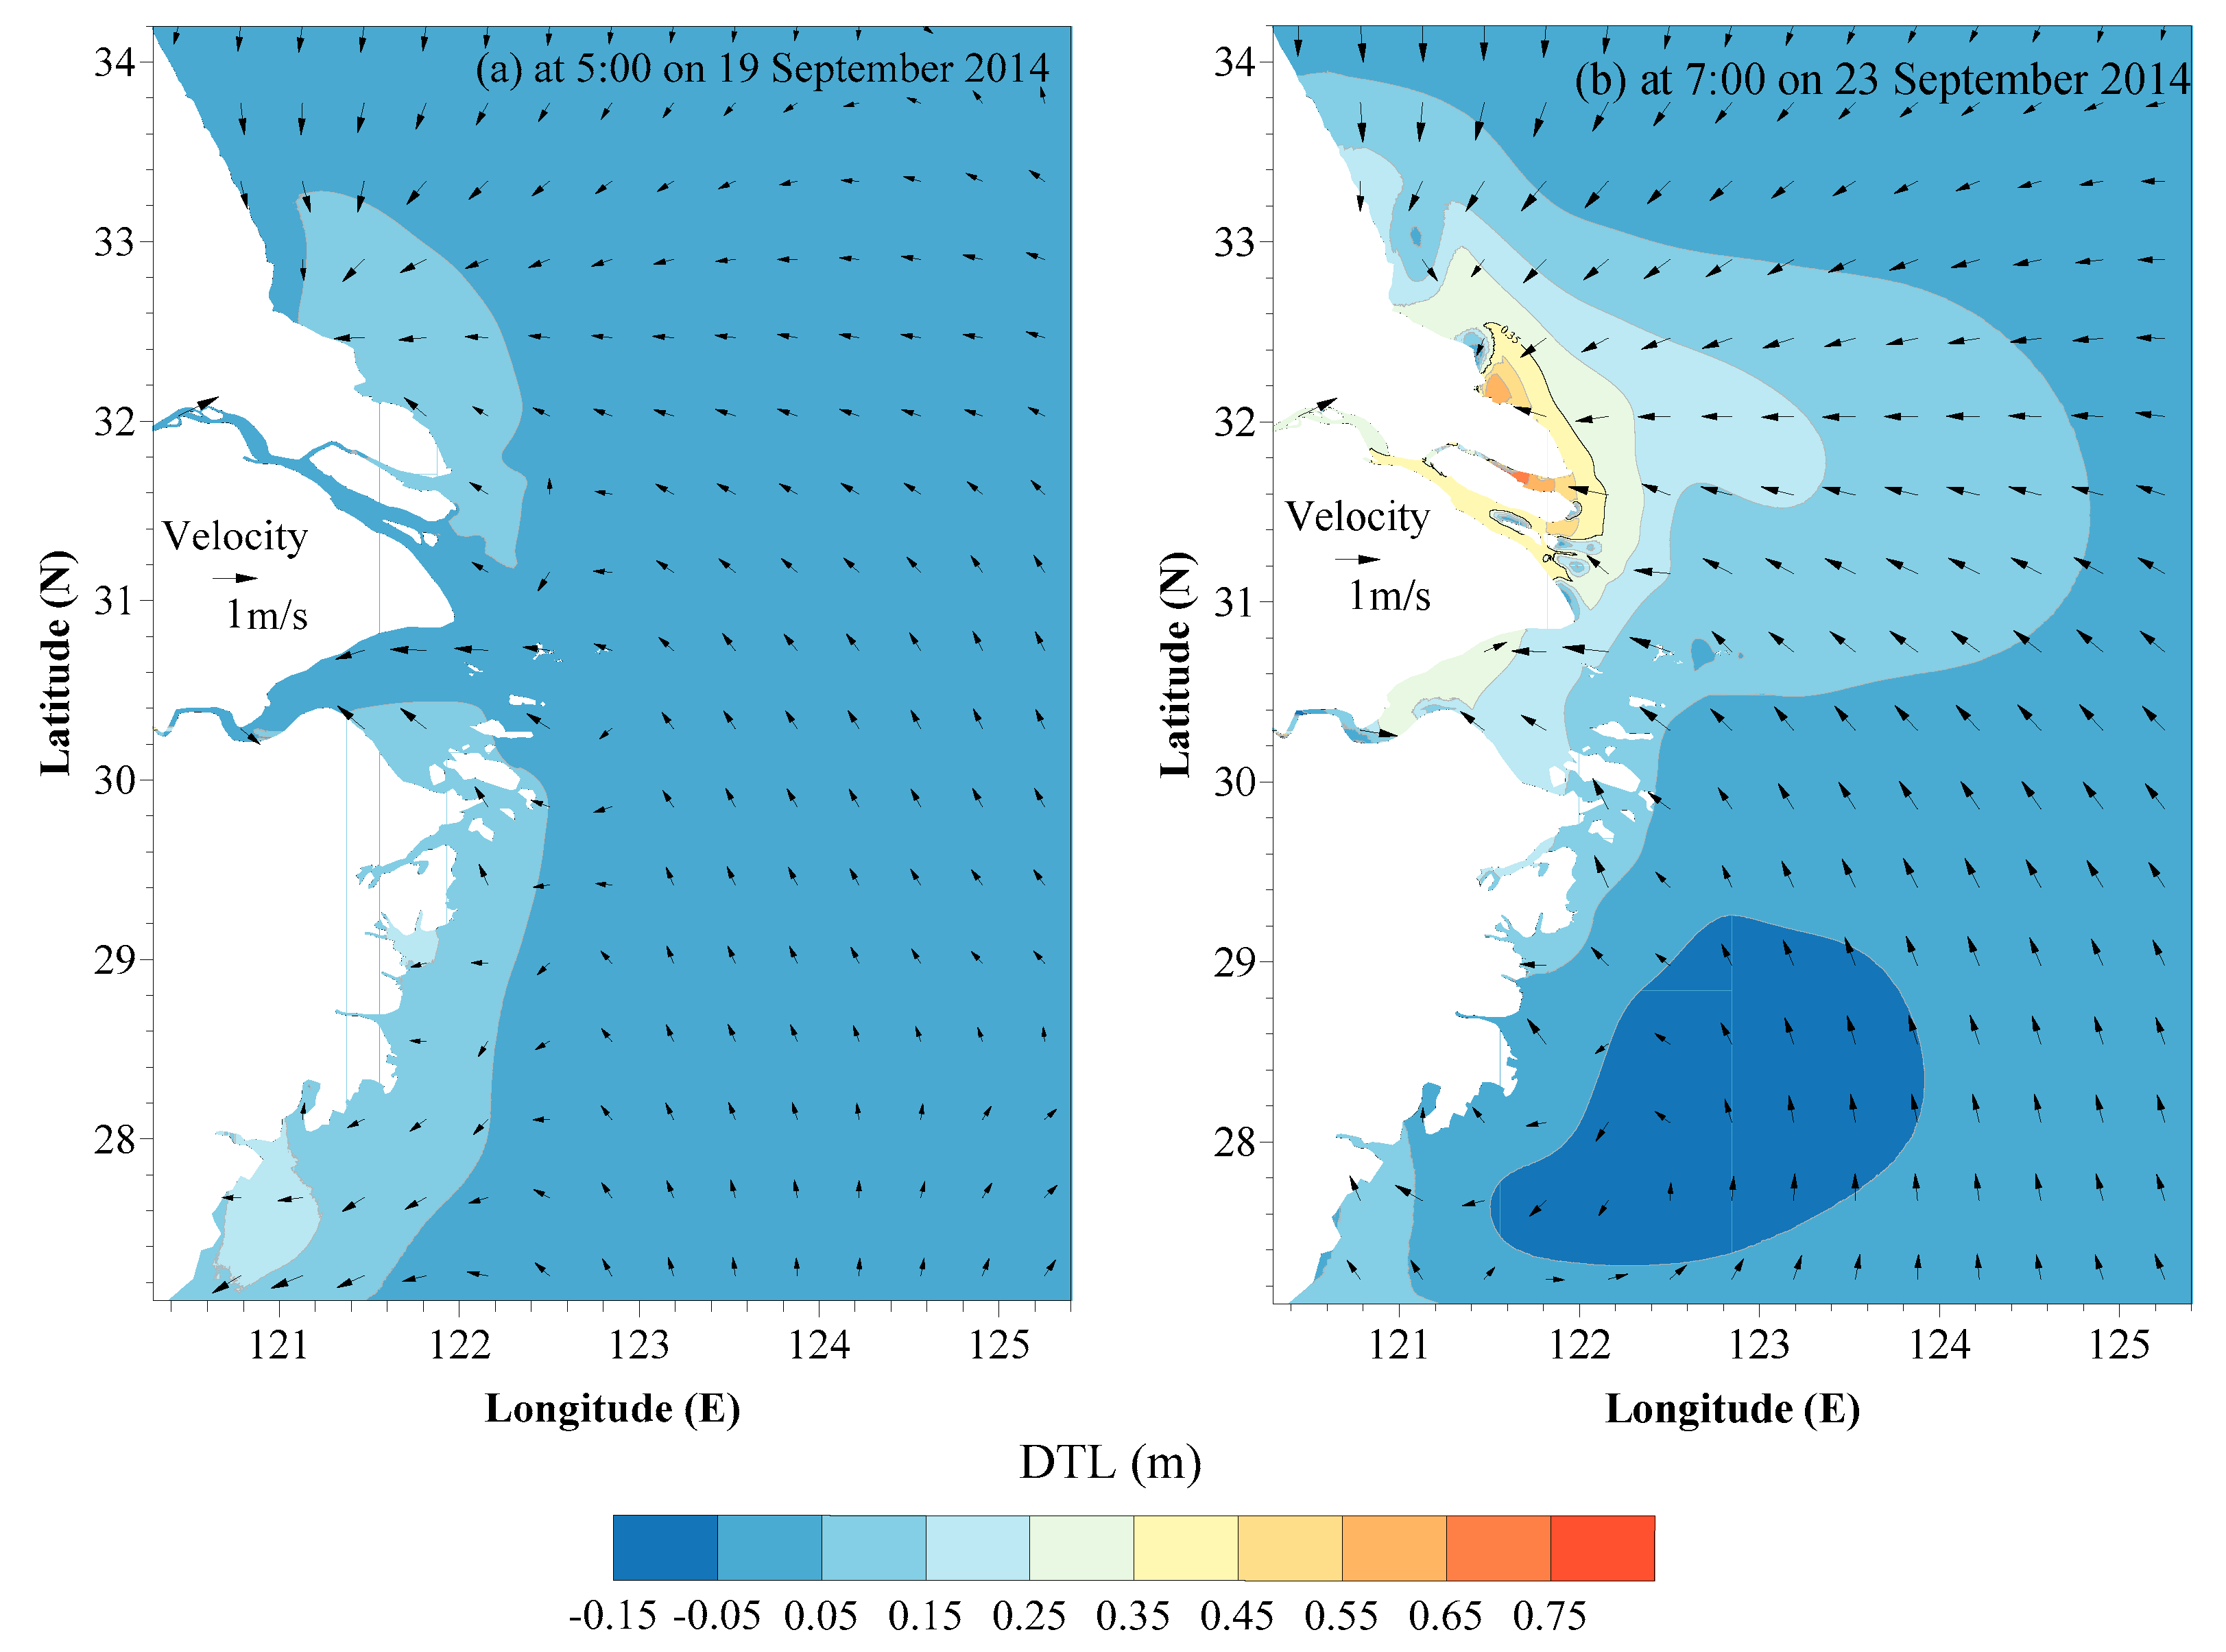
3.1. Tidal Level Changes by the Typhoon
3.2. Spatial–Temporal Distribution of Current Velocity
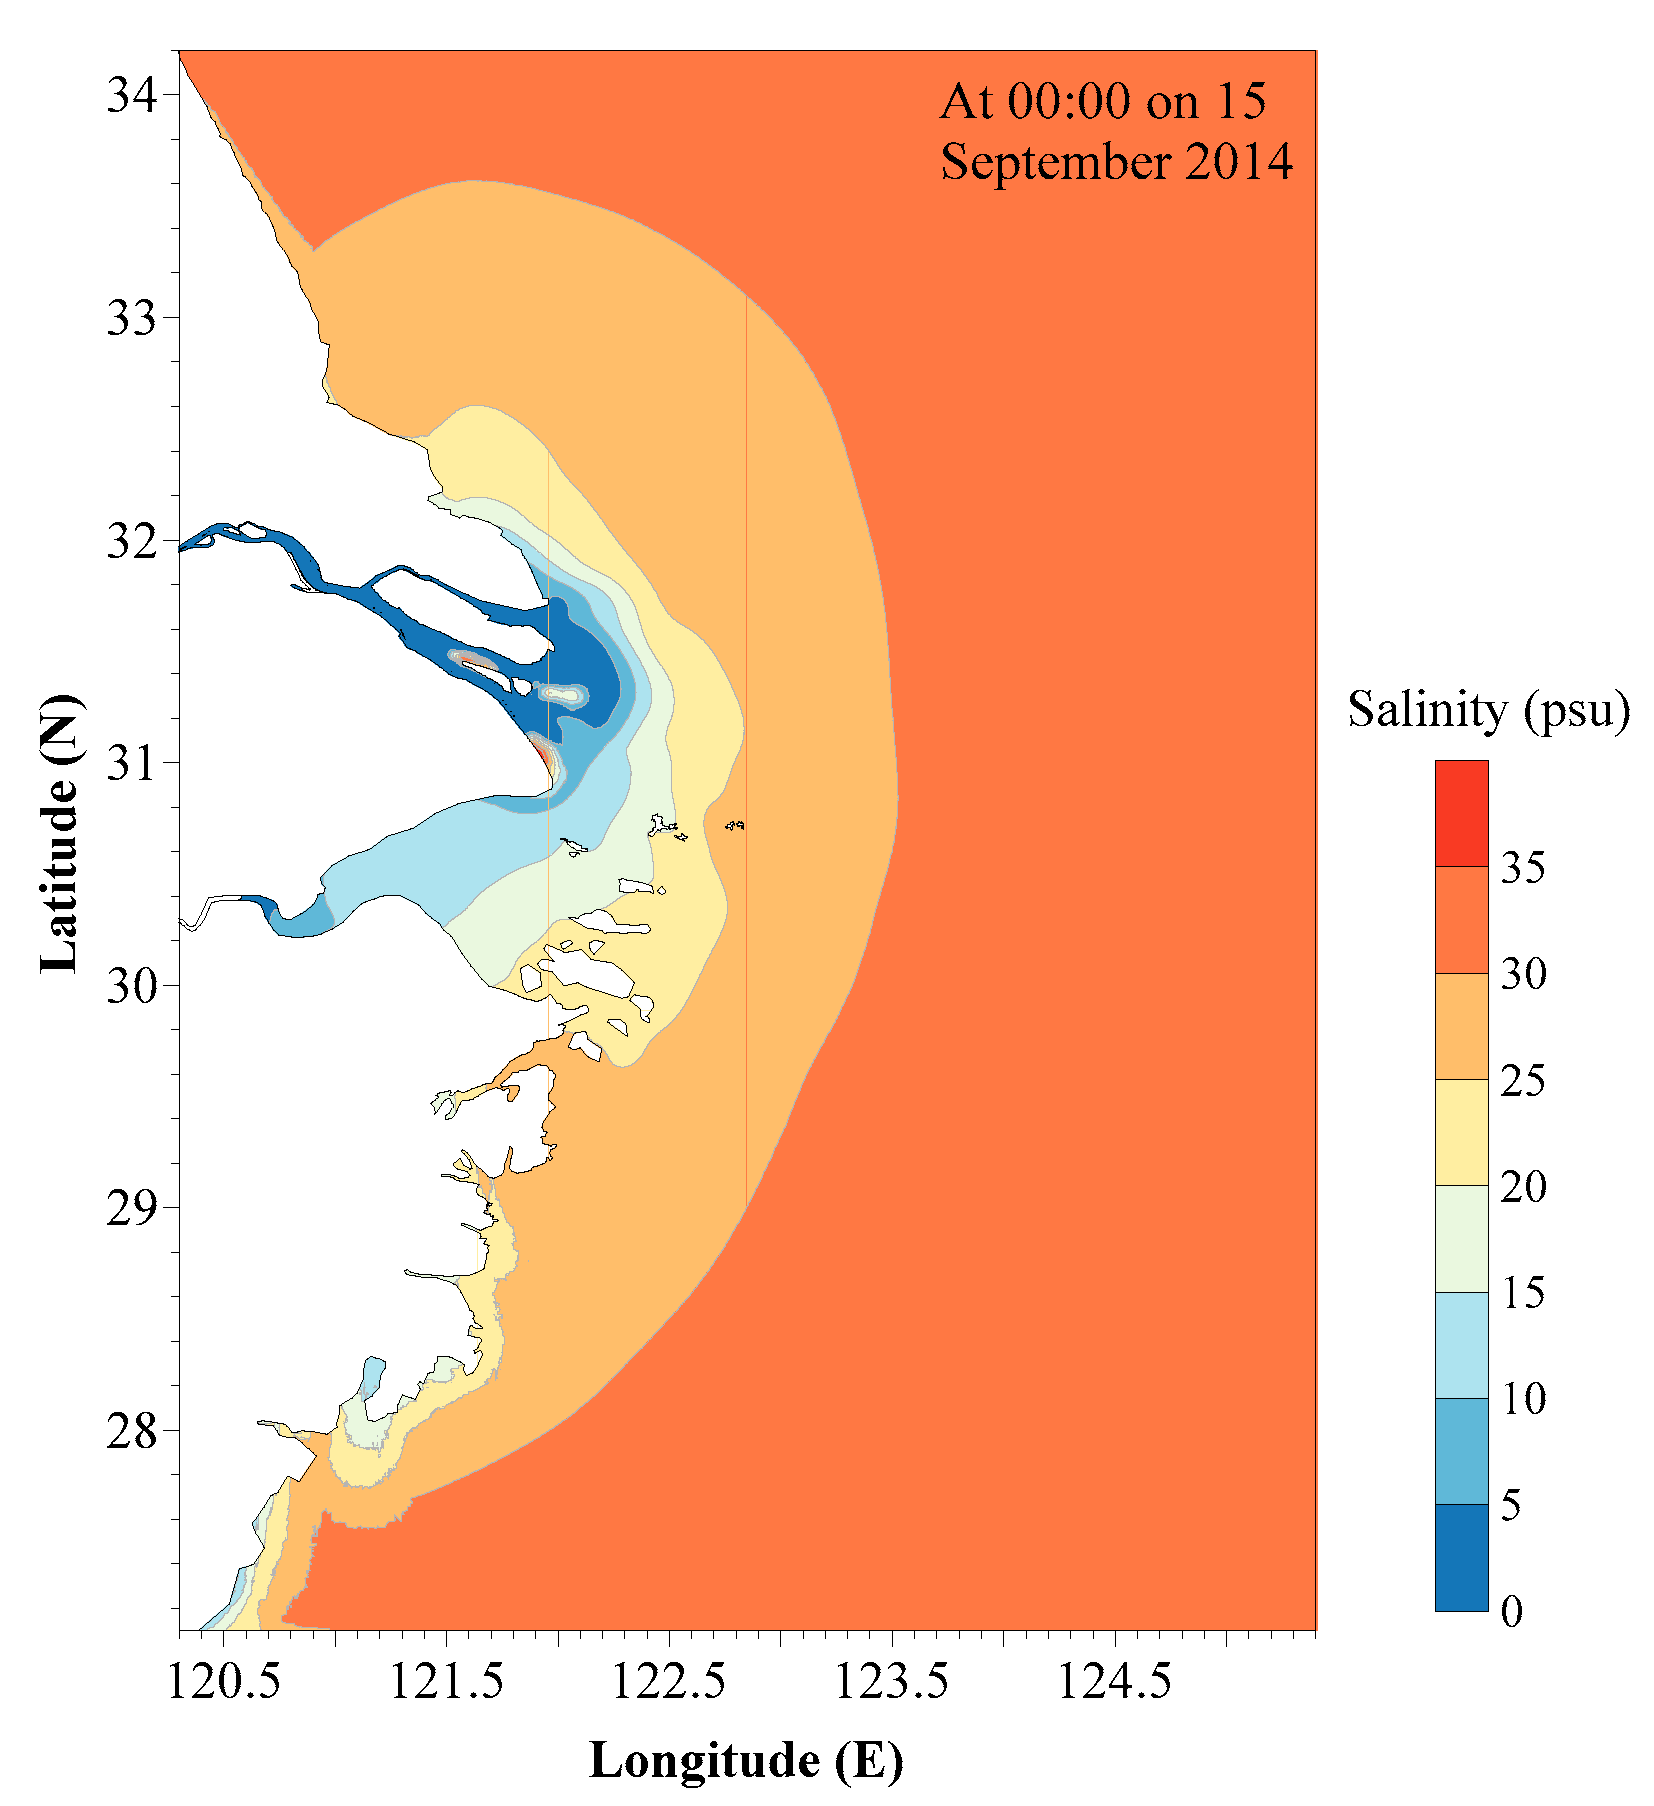
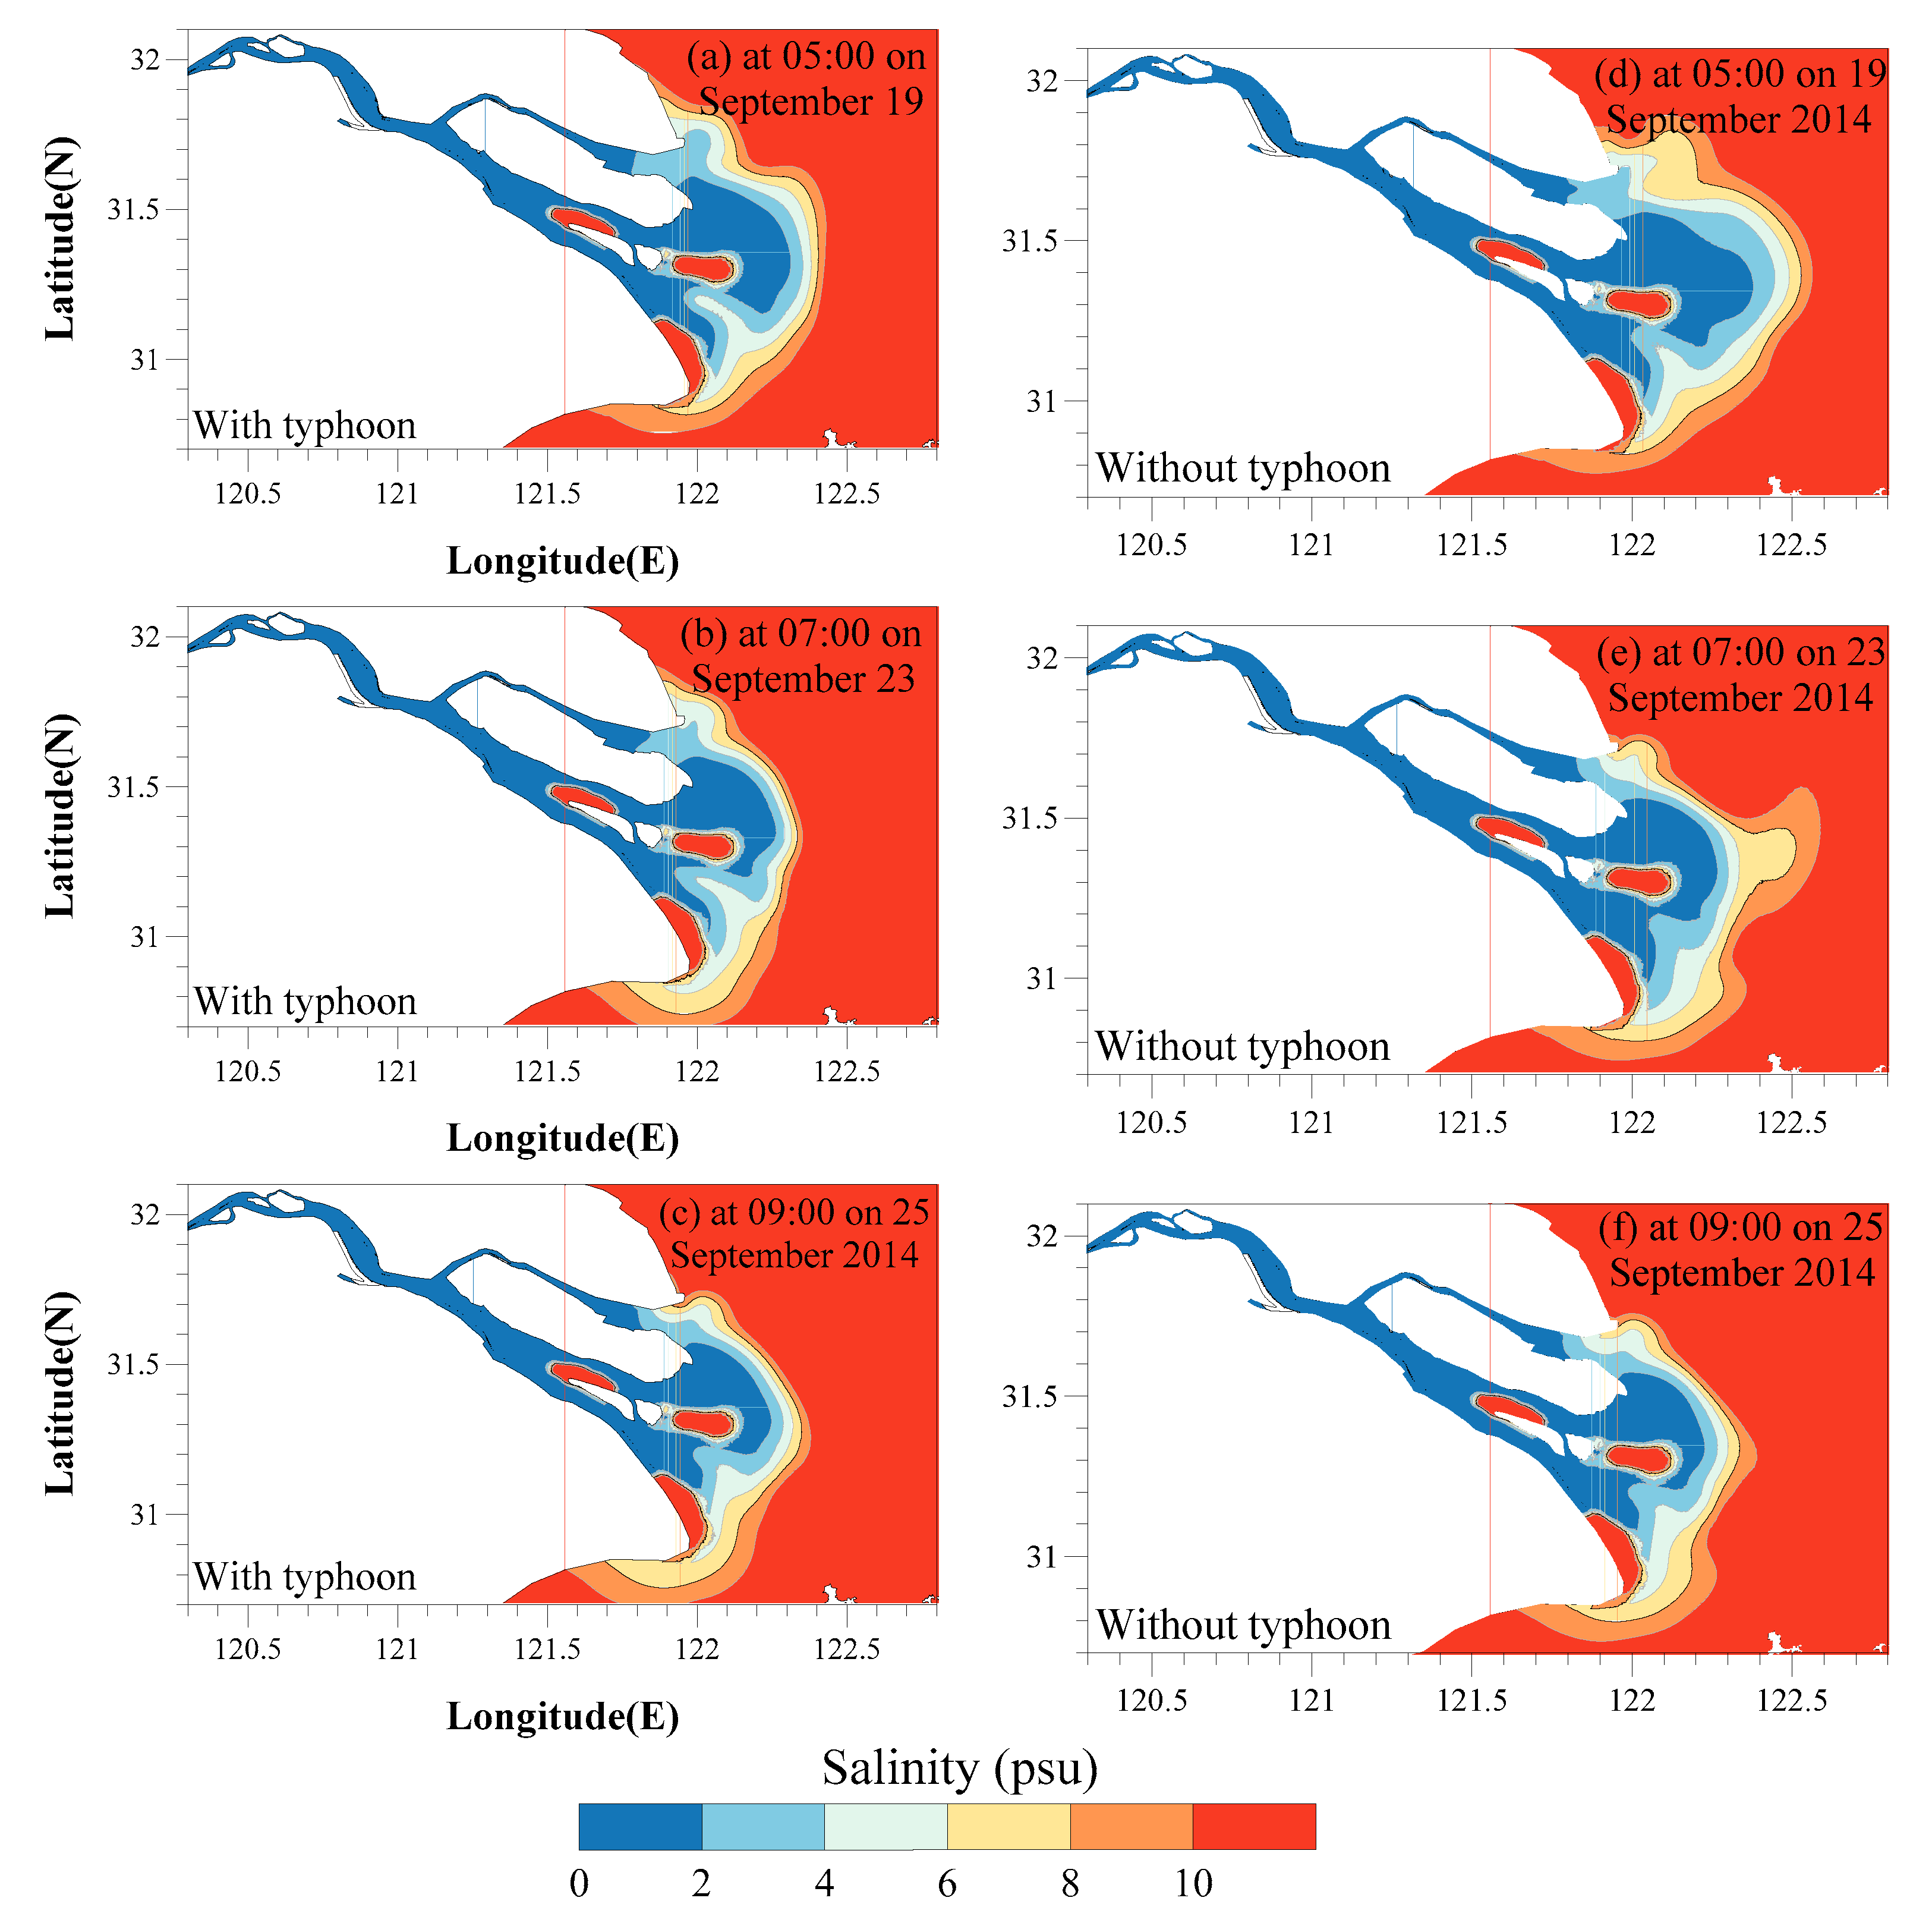
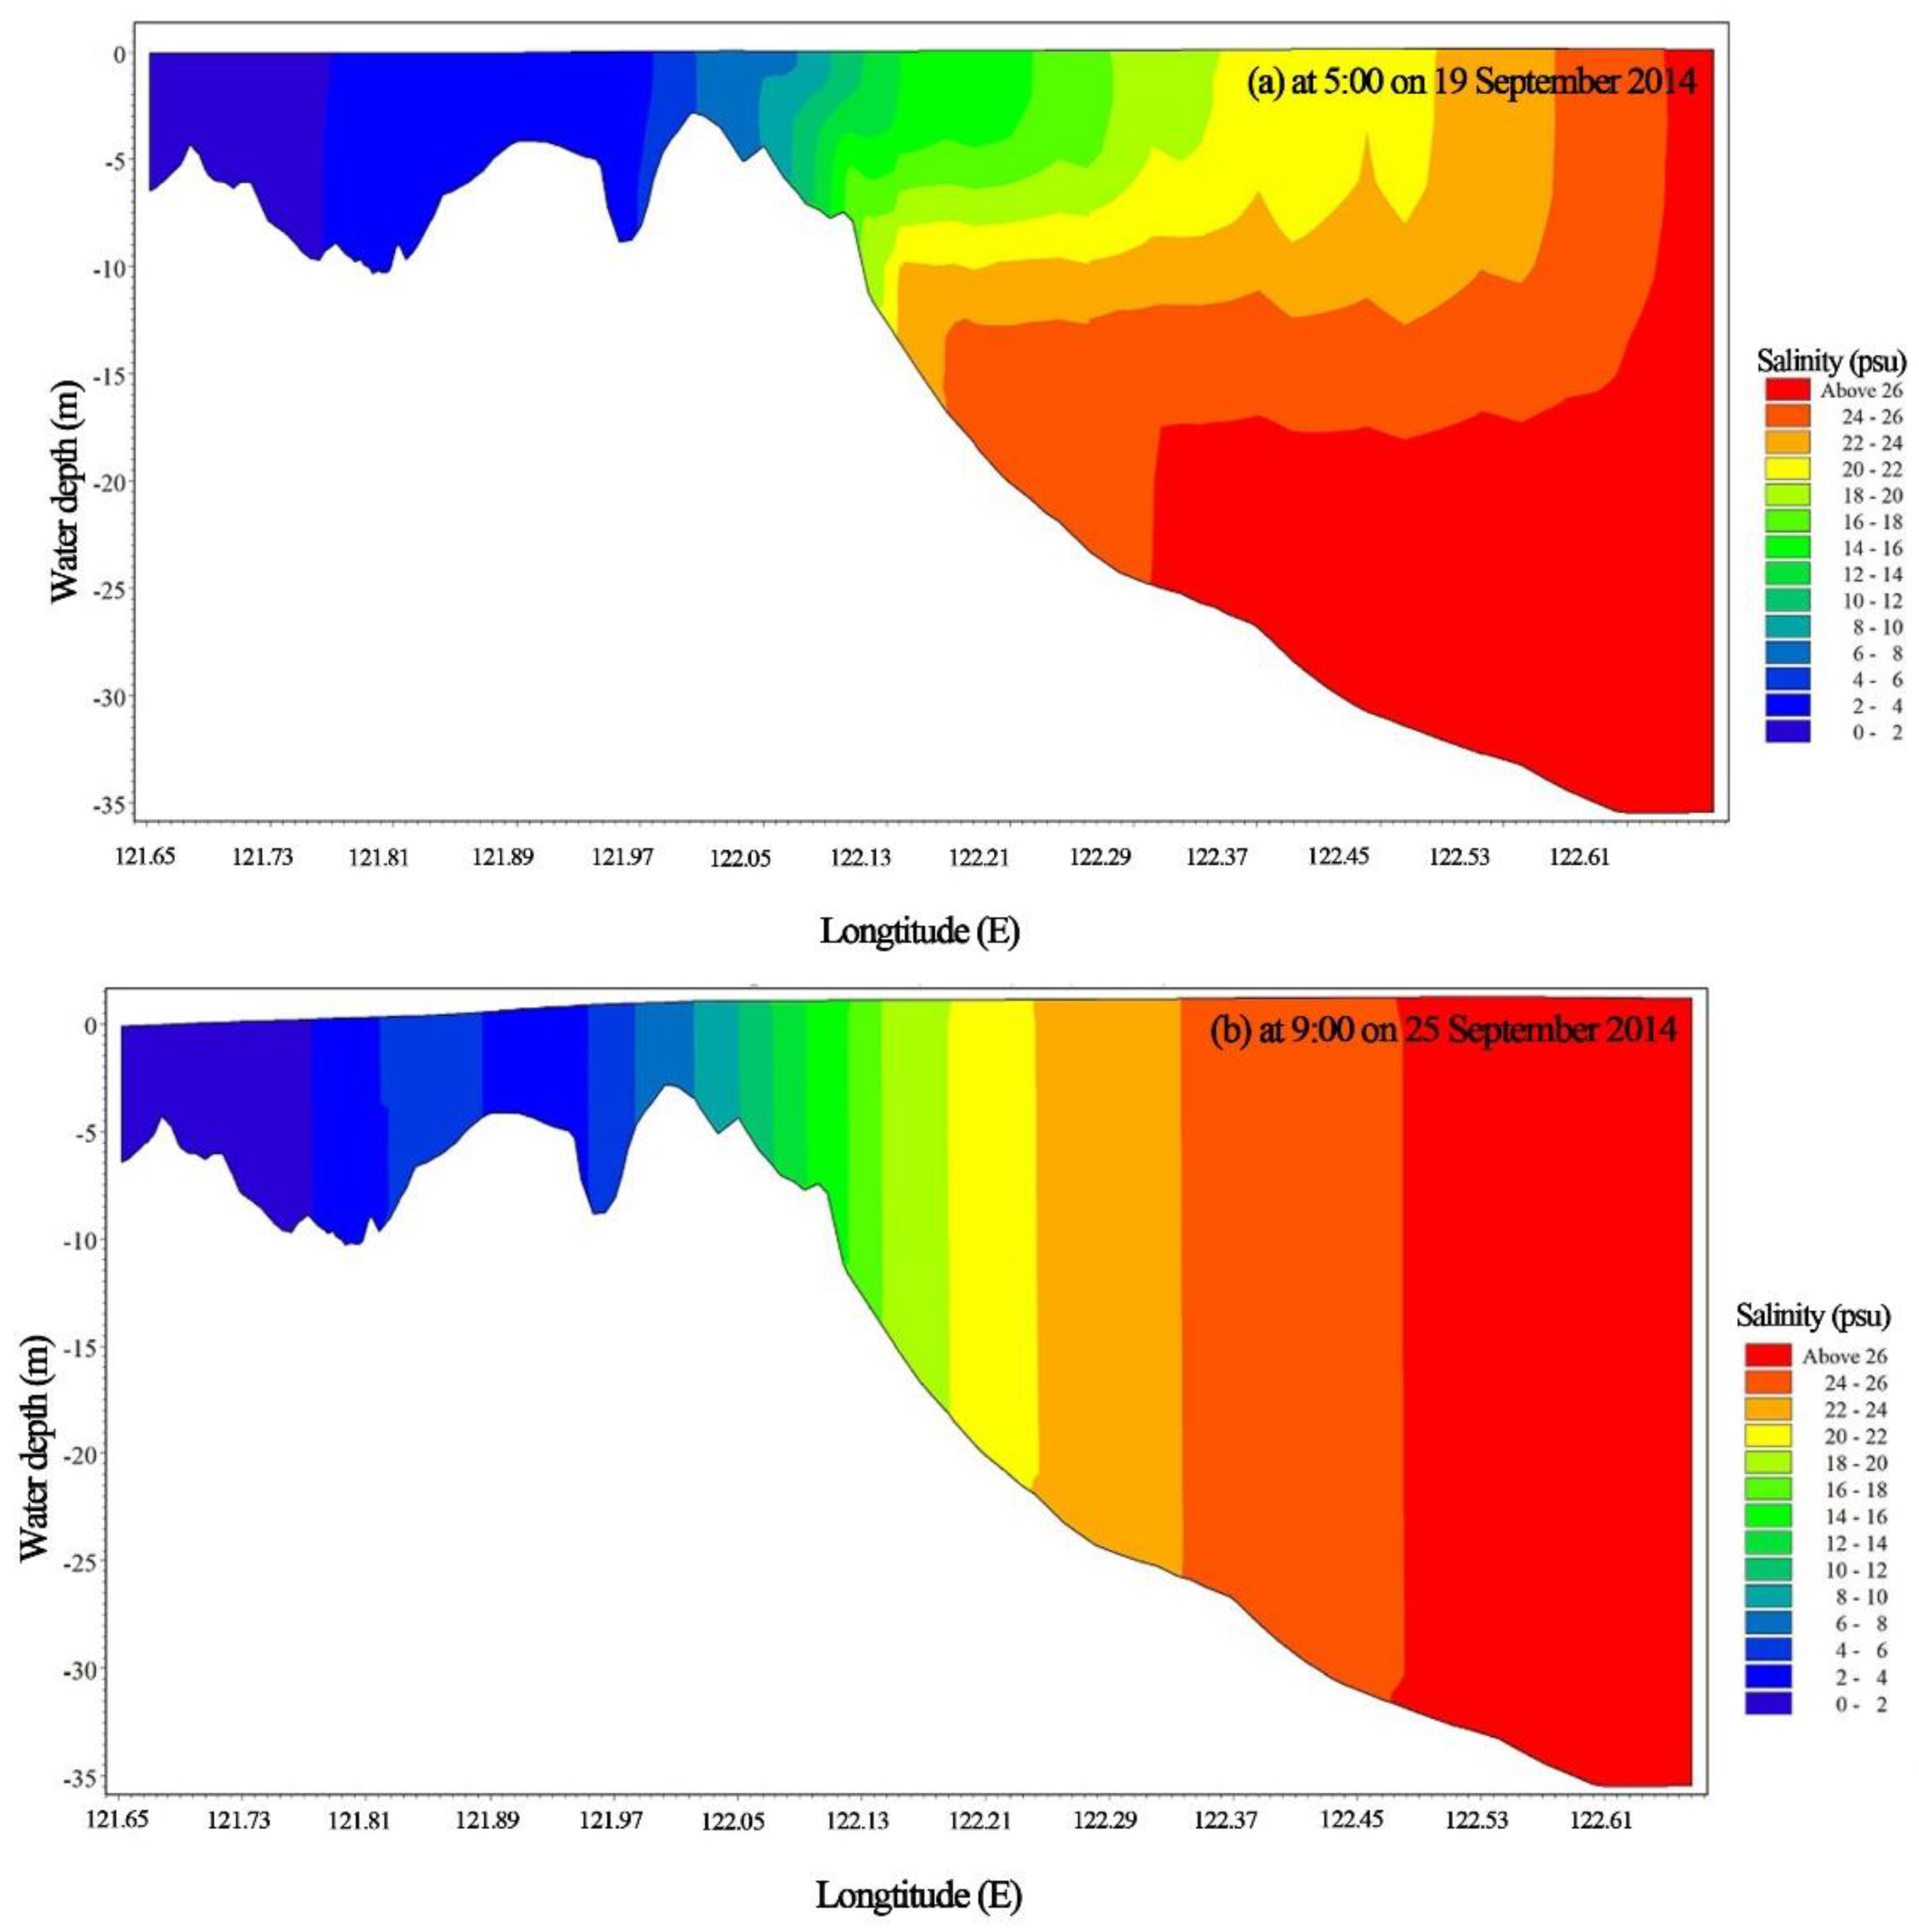
3.3. Salinity Structure Change by the Typhoon
4. Discussion
5. Conclusions
Author Contributions
Funding
Institutional Review Board Statement
Informed Consent Statement
Data Availability Statement
Acknowledgments
Conflicts of Interest
References
- Akter, R.; Asik, T.Z.; Sakib, M.; Akter, M.; Sakib, M.N.; Al Azad, A.S.M.A.; Maruf, M.; Haque, A.; Rahman, M.M. The dominant climate change event for salinity intrusion in the GBM Delta. Climate 2019, 7, 69. [Google Scholar] [CrossRef] [Green Version]
- Bhuiyan, M.; Dutta, D. Assessing impacts of sea level rise on river salinity in the Gorai river network, Bangladesh. Estuar. Coast. Shelf Sci. 2012, 96, 219–227. [Google Scholar] [CrossRef]
- Prandle, D. Saline intrusion in partially mixed estuaries. Estuar. Coast. Shelf Sci. 2004, 59, 385–397. [Google Scholar] [CrossRef]
- Jeong, S.; Yeon, K.; Hur, Y.; Oh, K. Salinity intrusion characteristics analysis using EFDC model in the downstream of Geum River. J. Environ. Sci. 2010, 22, 934–939. [Google Scholar] [CrossRef]
- MacCready, P.; Geyer, W.R. Advances in estuarine physics. Annu. Rev. Mar. Sci. 2010, 2, 35–58. [Google Scholar] [CrossRef] [Green Version]
- Ijaz, M.W.; Mahar, R.B.; Ansari, K.; Siyal, A.A. Optimization of salinity intrusion control through freshwater and tidal inlet modifications for the Indus River Estuary. Estuar. Coast. Shelf Sci. 2019, 224, 51–61. [Google Scholar] [CrossRef]
- Sherin, V.R.; Durand, F.; Papa, F.; Islam, A.S. Recent salinity intrusion in the Bengal delta: Observations and possible causes. Cont. Shelf Res. 2020, 202, 104–142. [Google Scholar] [CrossRef]
- Monismith, S.G.; Kimmerer, W.; Burau, J.R.; Stacey, M.T. Structure and flow-induced variability of the subtidal salinity field in northern San Francisco Bay. J. Phys. Oceanogr. 2002, 32, 3003–3019. [Google Scholar] [CrossRef] [Green Version]
- Banas, N.S.; Huckey, B.M.; MacCreaddy, P.; Newton, J.A. Dynamics of Willapa Bay, Washington: A highly unsteady partially mixed estuary. J. Phys. Oceanogr. 2004, 34, 2413–2427. [Google Scholar] [CrossRef] [Green Version]
- Lerczak, J.A.; Geyer, W.R.; Ralston, D.K. The temporal response of the length of a partially stratified estuary to changes in river flow and tidal amplitude. J. Phys. Oceanogr. 2009, 39, 915–933. [Google Scholar] [CrossRef] [Green Version]
- Gong, W.; Shen, J. The response of salt intrusion to changes in river discharge and tidal mixing during the dry season in the Modaomen Estuary, China. Cont. Shelf Res. 2011, 31, 769–788. [Google Scholar] [CrossRef]
- Larson, M.; Bellanca, R.; Jonsson, L.; Chen, C.; Shi, P. A model of the 3D circulation, salinity distribution, and transport pattern in the Pearl River Estuary, China. J. Coast. Res. 2005, 21, 896–908. [Google Scholar] [CrossRef]
- Morelissen, R.; Bijlsma, A.C.; Tapley, M.J. A dedicated tidal stream atlas of the stratified tidal flows near Stonecutters Bridge, Hong Kong, based on 3D numerical simulations with HLES. J. Hydro-Environ. Res. 2010, 3, 224–231. [Google Scholar] [CrossRef]
- Kuang, C.P.; Lee, J.H.W. Physical hydrography and algal bloom transport in Hong Kong waters. China Ocean. Eng. 2005, 19, 539–556. [Google Scholar]
- Lee, J.H.W.; Harrison, P.J.; Kuang, C.P.; Yin, K. Eutrophication dynamics in Hong Kong waters: Physical and biological interactions. In The Environment in Asia Pacific Harbours; Springer: Dordrecht, The Netherlands, 2006; pp. 187–206. [Google Scholar]
- Turrell, W.R.; Brunn, J.; Simpson, J.H. Salt intrusion and secondary flow in a shallow, well-mixed estuary. Estuar. Coast. Shelf Sci. 1996, 42, 153–169. [Google Scholar] [CrossRef]
- Bowen, M.M.; Geyer, W.R. Salt transport and the time-dependent salt balance of a partially stratified estuary. J. Geophys. Res. 2003, 108, 3185. [Google Scholar] [CrossRef]
- Ralston, D.K.; Geyer, W.R.; Lerczak, J.A. Structure, variability, and salt flux in a strongly forced salt wedge estuary. J. Geophys. Res. 2010, 115, 1–21. [Google Scholar] [CrossRef] [Green Version]
- MacCready, P. Estuarine adjustment. J. Phys. Oceanogr. 2007, 37, 2133–2145. [Google Scholar] [CrossRef] [Green Version]
- Lewis, R.E.; Lewis, J.O. The principal factors contributing to the flux of salt in a narrow, partially stratified estuary. Estuar. Coast. Mar. Sci. 1983, 16, 599–626. [Google Scholar] [CrossRef]
- MacCready, P. Estuarine adjustment to changes in river flow and tidal mixing. J. Phys. Oceanogr. 1999, 29, 708–726. [Google Scholar] [CrossRef]
- Monismith, S.G. An experimental study of the upwelling response of stratified reservoirs to surface shear stress. J. Fluid Mech. 1986, 171, 407–439. [Google Scholar] [CrossRef]
- Scully, M.E.; Friedrichs, C.; Brubaker, J. Control of estuarine stratification and mixing by wind-induced straining of the estuarine density field. Estuaries 2005, 28, 321–326. [Google Scholar] [CrossRef]
- Lange, X.; Klingbeil, K.; Burchard, H. Inversions of estuarine circulation are frequent in a weakly tidal estuary with variable wind forcing and seaward salinity fluctuations. J. Geophys. Res. Ocean. 2020, 125, 1–18. [Google Scholar] [CrossRef]
- Yin, K.; Zhang, J.; Qian, P.Y.; Jian, W.; Huang, L.; Chen, J.; Wu, M.C.S. Effect of wind events on phytoplankton blooms in the Pearl River estuary during summer. Cont. Shelf Res. 2004, 24, 1909–1923. [Google Scholar] [CrossRef]
- Kuang, C.; Lee, J.H.W.; Harrison, P.J.; Yin, K. Effect of wind speed and direction on summer tidal circulation and vertical mixing in Hong Kong waters. J. Coast. Res. 2001, 27, 74–86. [Google Scholar] [CrossRef]
- Chen, S.H.; Sanford, L.P. Axial wind effects on stratification and Longitudinal salt transport in an Idealized, partially mixed estuary. J. Phys. Oceanogr. 2009, 39, 1905–1920. [Google Scholar] [CrossRef]
- Li, C.; Eddie, W.; Brian, W.; Blanchard, H. Storm surge induced flux through multiple tidal passes of Lake Pontchartrain estuary during Hurricanes Gustav and Ike. Estuar. Coast. Shelf Sci. 2010, 87, 517–525. [Google Scholar] [CrossRef]
- Sheng, Y.P.; Alymov, V.; Paramygin, V.A. Simulation of storm surge, wave, currents, and inundation in the Outer Banks and Chesapeake Bay during Hurricane Isabel in 2003: The importance of waves. J. Geophys. Res. 2010, 115, 1–27. [Google Scholar] [CrossRef]
- Gong, W.; Chen, Y.; Zhang, H.; Chen, Z. Effects of wave–current interaction on salt intrusion during a typhoon event in a highly stratified estuary. Estuaries Coasts 2018, 41, 1904–1923. [Google Scholar] [CrossRef]
- Chen, J.; Jiang, C.; Wu, Z.; Long, Y.; Deng, B.; Liu, X. Numerical investigation of fresh and salt water distribution in the Pearl River Estuary during a typhoon using a fully coupled atmosphere-wave-ocean model. Water 2019, 11, 646. [Google Scholar] [CrossRef] [Green Version]
- Akter, R.; Sakib, M.; Rahman, M.; Sumaiya, S.; Haque, A.; Rahman, M.M.; Islam, R. Climatic and cyclone induced storm surge impact on salinity intrusion along the Bangladesh coast. In Proceedings of the 6th International Conference on the Application of Physical Modeling in Coastal and Port Engineering and Science, Ottawa, ON, Canada, 10–13 May 2016; pp. 11–13. [Google Scholar]
- Asik, T.Z.; Al Azad, A.A.; Akter, R.; Sakib, M.; Haque, A.; Rahman, M.M. Generating a plausible future of salinity intrusion due to mora-like cyclone along the coast of Bangladesh. In Proceedings of the 21st IAHR-APD Congress, Yogyakarta, Indonesia, 2–5 September 2018; pp. 737–745. [Google Scholar]
- Tajima, Y.; Lapidez, P.J.; Camelo, J.; Satio, M.; Matsuba, Y.; Shimozono, T.; Bautista, D.; Turiano, M.; Cruz, E. Post-Disaster survey of storm surge and waves along the coast of Batanes, the Philippines, caused by super typhoon Meranti/Ferdie. Coast. Eng. J. 2017, 59, 1750009-1–1750009-11. [Google Scholar] [CrossRef] [Green Version]
- Pan, M.; Kong, J.; Luo, Z.; Lv, Z. Influence of typhoon path on salt water intrusion in the Modaomen Waterway, China. J. Coast. Res. 2018, 85, 936–940. [Google Scholar] [CrossRef]
- Li, C.; Eddie, W.; Joao, L.R. In situ measurements of saltwater flux through tidal passes of Lake Pontchartrain estuary by Hurricanes Gustav and Ike in September 2008. Geophys. Res. Lett. 2009, 36, L19609. [Google Scholar] [CrossRef]
- Goodrich, D.M.; Boicourt, W.C.; Hamilton, P.; Pritchard, D.W. Wind-Induced destratification in Chesapeake Bay. J. Phys. Oceanogr. 1987, 17, 2232–2240. [Google Scholar] [CrossRef] [Green Version]
- Blumberg, A.E.; Goodrich, D.M. Modeling of wind induced destratification in Chesapeake Bay. Estuaries 1990, 13, 236–249. [Google Scholar] [CrossRef]
- Li, M.; Zhong, L.J.; Boicourt, W.C. Simulations of Chesapeake Bay estuary: Sensitivity to turbulence mixing parameterizations and comparison with observations. J. Geophys. Res. 2005, 110, C12004. [Google Scholar] [CrossRef]
- Wu, H.; Zhu, J.; Shen, J.; Wang, H. Tidal modulation on the Changjiang River plume in summer. J. Geophys. Res. 2011, 116, 1–21. [Google Scholar] [CrossRef] [Green Version]
- Wu, H.; Shen, J.; Zhu, J.; Zhang, J.; Li, L. Characteristics of the Changjiang plume and its extension along the Jiangsu Coast. Cont. Shelf Res. 2014, 76, 108–123. [Google Scholar] [CrossRef]
- Dai, Z.; Du, J.; Li, J.; Li, W.; Chen, J. Runoff characteristics of the Changjiang River during 2006: Effect of extreme drought and the impounding of the three Gorges Dam. Geophys. Res. Lett. 2008, 35, 1–6. [Google Scholar] [CrossRef]
- Kuang, C.; Chen, W.; Gu, J.; Su, T.C.; Song, H.; Ma, Y.; Dong, Z. River discharge contribution to sea-level rise in the Yangtze River Estuary, China. Cont. Shelf Res. 2017, 134, 63–75. [Google Scholar] [CrossRef]
- Chen, X.; Zong, Y. Major impacts of sea-level rise on agriculture in the Yangtze delta area around Shanghai. Appl. Geogr. 1999, 19, 69–84. [Google Scholar] [CrossRef]
- Qiu, C.; Zhu, J. Assessing the influence of sea level rise on salt transport processes and estuarine circulation in the Changjiang River Estuary. J. Coast. Res. 2015, 31, 661–670. [Google Scholar] [CrossRef]
- Chen, W.; Chen, K.; Kuang, C.; Zhu, D.; He, L.; Mao, X.; Liang, H.; Song, H. Influence of sea level rise on saline water intrusion in the Yangtze River Estuary. China. Appl. Ocean. Res. 2016, 54, 12–25. [Google Scholar] [CrossRef]
- Dai, Z.; Liu, J. Impacts of large dams on downstream fluvial sedimentation: An example of the Three Gorges Dam (TGD) on the Chang jiang (Yangtze River). J. Hydrol. 2013, 480, 10–18. [Google Scholar] [CrossRef]
- Pan, Z.; Liu, H. Extreme storm surge induced coastal inundation in Yangtze Estuary regions. J. Hydrodyn. 2019, 31, 1127–1138. [Google Scholar] [CrossRef]
- Zhang, Z.; Wu, H.; Yin, X.; Qiao, F. Dynamical response of Changjiang river plume to a severe typhoon with surface wave-induced mixing. J. Geophys. Res. Ocean. 2018, 123, 9369–9388. [Google Scholar] [CrossRef]
- DHI Group. Mike 21 & Mike 3 FLOW MODEL FM: Hydrodynamic and Transport Module Scientific Documentation; DHI Group: Hørsholm, Denmark, 2021. [Google Scholar]
- Launder, B.; Spalding, D. The numerical computation of turbulent flows. Comput. Methods Appl. Mech. Eng. 1974, 3, 269–289. [Google Scholar] [CrossRef]
- Luo, X.; Chen, Z. Numerical simulation study of effect of runoff and tide on the Changjiang River Mouth saltwater intrusion. Coast. Eng. 2005, 24, 1–6. [Google Scholar]
- Willmott, C.J. On the validation of models. Phys. Geogr. 1981, 2, 184–194. [Google Scholar] [CrossRef]
- Haralambidou, K.; Sylaios, G.; Tsihrintzis, V.A. Salt-Wedge propagation in Mediterranean micro-tidal river mouth. Estuar. Coast. Shelf Sci. 2010, 90, 1. [Google Scholar] [CrossRef]
- Wang, T.; Geyer, W.R.; MacCready, P. Total exchange flow, entrainment, and diffusive salt flux in estuaries. J. Phys. Oceanogr. 2017, 47, 1205–1220. [Google Scholar] [CrossRef]


| Quantity | Station | Skill | Performance | |||||
|---|---|---|---|---|---|---|---|---|
| Tidal level | Sheshan | 1.00 | Excellent | |||||
| Luchaogang | 1.00 | Excellent | ||||||
| Dajishan | 1.00 | Excellent | ||||||
| Daishan | 1.00 | Excellent | ||||||
| Tanhu | 1.00 | Excellent | ||||||
| Zhenhai | 1.00 | Excellent | ||||||
| Current velocity | Stations | Surface | Bottom | Surface | Bottom | |||
| NGN4SD (speed) | 1.00 | 0.95 | Excellent | Excellent | ||||
| NGN4SD (direction) | 1.00 | 1.00 | Excellent | Excellent | ||||
| CS3SD (speed) | 0.97 | 0.96 | Excellent | Excellent | ||||
| CS3SD (direction) | 1.00 | 1.00 | Excellent | Excellent | ||||
| NC6D (speed) | 1.00 | 0.93 | Excellent | Excellent | ||||
| NC6D (direction) | 1.00 | 1.00 | Excellent | Excellent | ||||
| Profile | Surface | Middle | Bottom | Surface | Middle | Bottom | ||
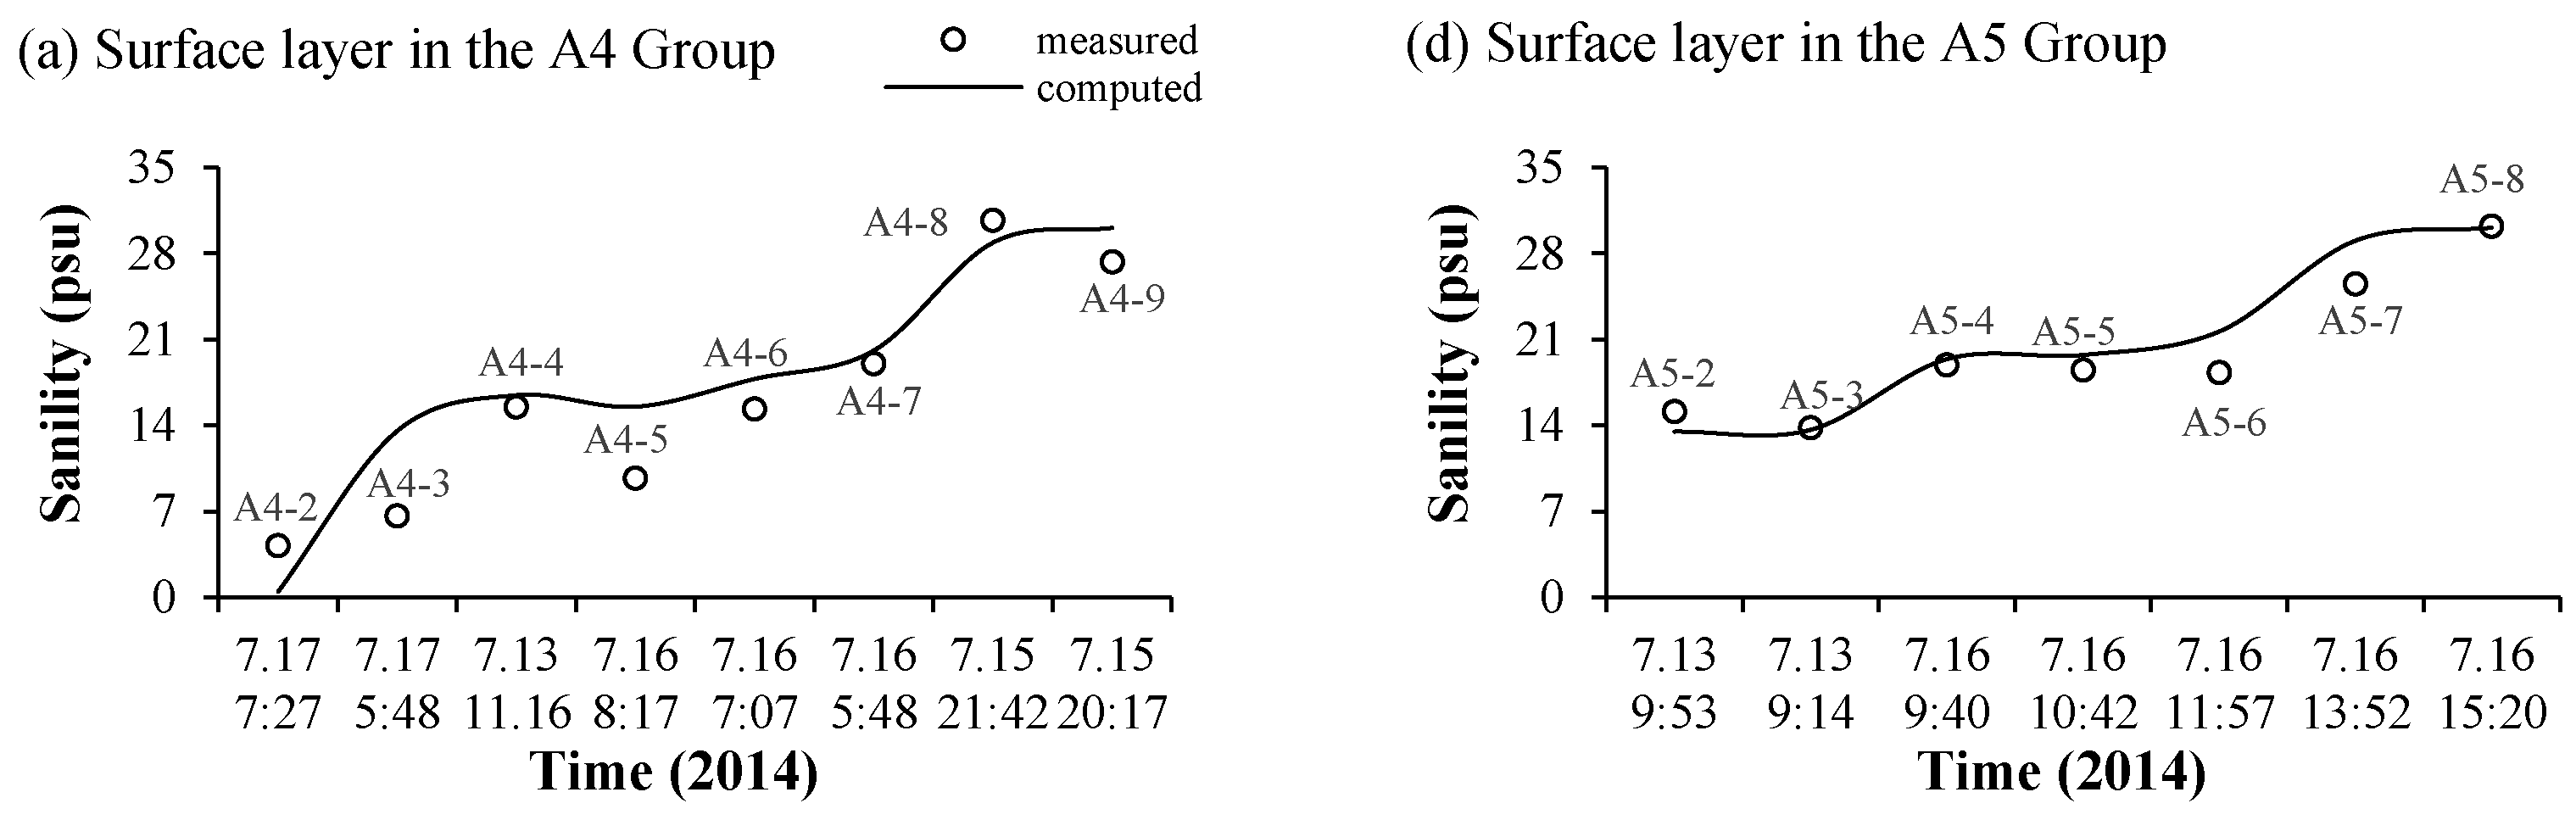
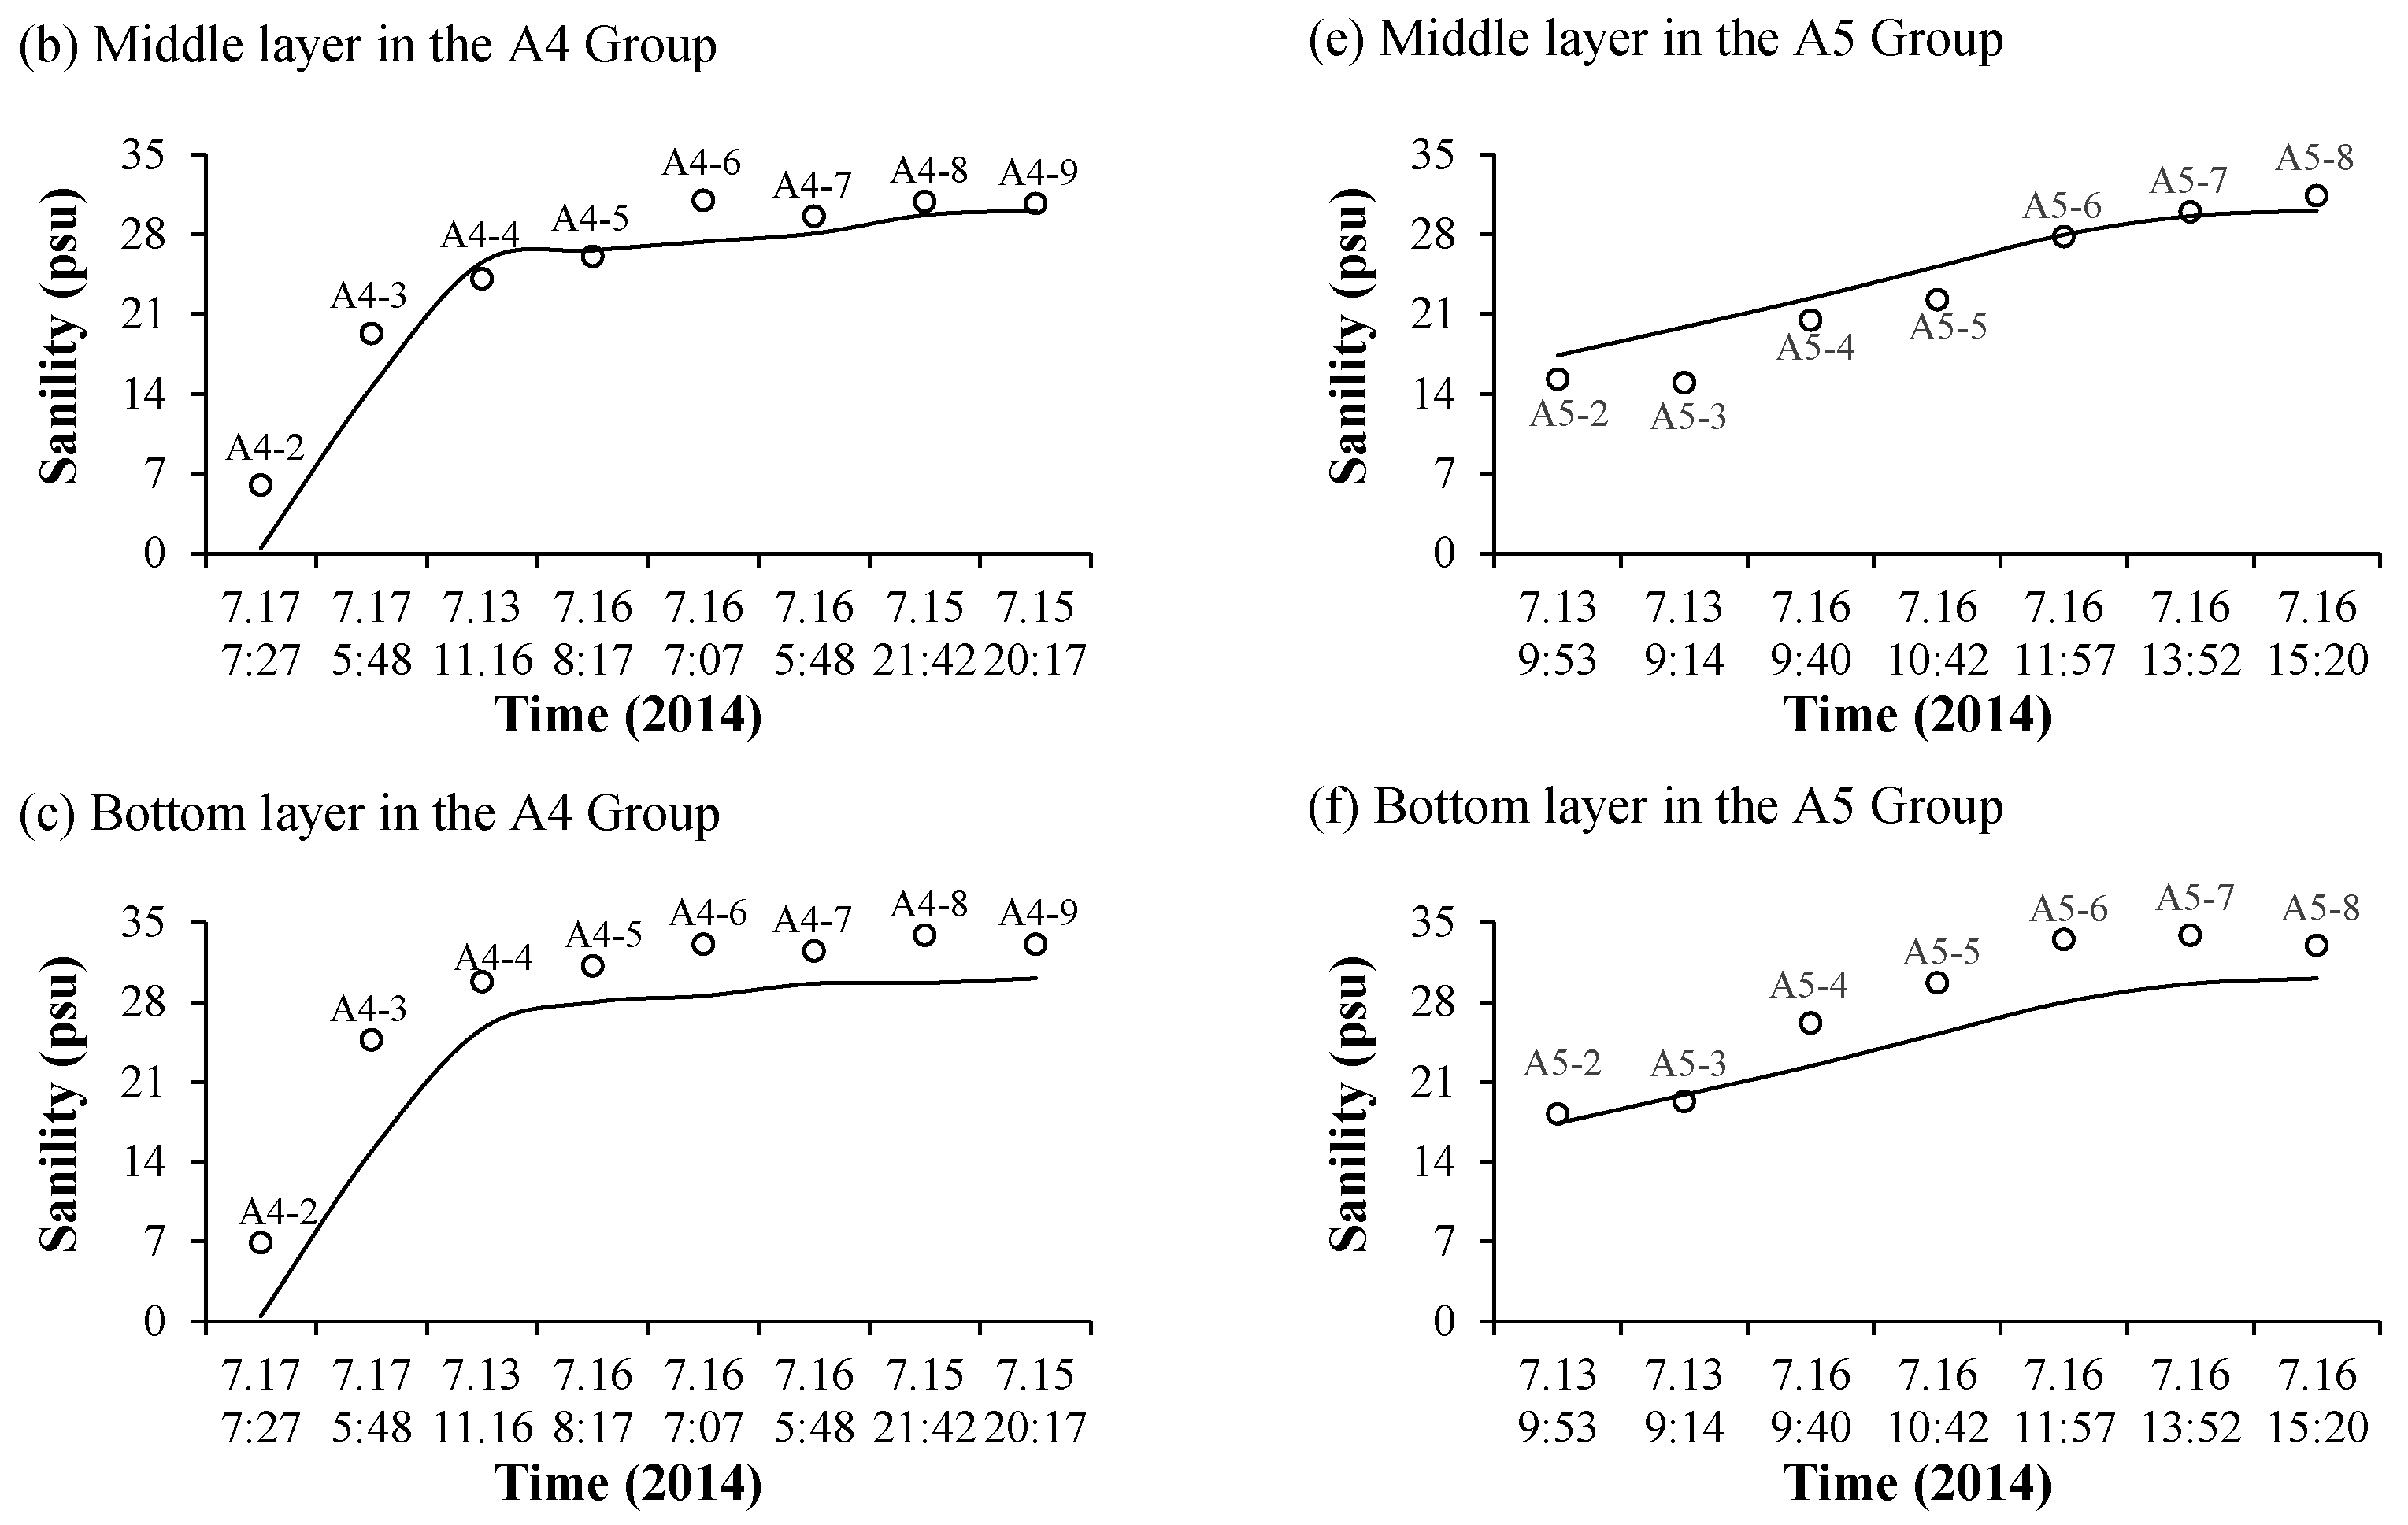
| Salinity | A3 | 0.82 | 0.63 | 0.70 | excellent | very good | excellent | |
| A4 | 0.95 | 0.92 | 0.97 | excellent | excellent | excellent | ||
| A5 | 0.97 | 0.90 | 0.95 | excellent | excellent | excellent | ||
| A6 | 0.51 | 0.32 | 0.78 | very good | good | excellent | ||
| A7 | 0.98 | 0.91 | 0.89 | excellent | excellent | excellent | ||
| A8 | 0.79 | 0.68 | 0.63 | excellent | excellent | very good | ||
| ns | Point 1 | Point 2 | Point 3 | Point 4 | Point 5 | Point 6 | Point 7 | Point 8 | Point 9 | Point 10 | Point 11 |
|---|---|---|---|---|---|---|---|---|---|---|---|
| 19 September | 0.050 | 0.011 | 0 | 0.003 | 0.381 | 0.240 | 0.510 | 0.528 | 0.390 | 0.263 | 0.231 |
| 25 September | −0.025 | −0.015 | −0.003 | 0.003 | −0.007 | −0.005 | −0.002 | −0.002 | −0.001 | 0 | 0 |
| Scenario | NB | SB | Split Ratio of the NB | |||
|---|---|---|---|---|---|---|
| Flood Discharge/m3 | Ebb Discharge/m3 | Flood Discharge/m3 | Ebb Discharge/m3 | Flood | Ebb | |
| Typhoon | 39,908,656.93 | 19,885,622.09 | 845,086,196.6 | 3,673,630,447 | 4.51% | 0.54% |
| Normal wind force | 28,182,935.52 | 36,591,983.35 | 823,104,668.9 | 3,673,645,087 | 3.31% | 0.99% |
Publisher’s Note: MDPI stays neutral with regard to jurisdictional claims in published maps and institutional affiliations. |
© 2021 by the authors. Licensee MDPI, Basel, Switzerland. This article is an open access article distributed under the terms and conditions of the Creative Commons Attribution (CC BY) license (https://creativecommons.org/licenses/by/4.0/).
Share and Cite
Kuang, C.; Chen, K.; Wang, J.; Wu, Y.; Liu, X.; Xia, Z. Responses of Hydrodynamics and Saline Water Intrusion to Typhoon Fongwong in the North Branch of the Yangtze River Estuary. Appl. Sci. 2021, 11, 8986. https://doi.org/10.3390/app11198986
Kuang C, Chen K, Wang J, Wu Y, Liu X, Xia Z. Responses of Hydrodynamics and Saline Water Intrusion to Typhoon Fongwong in the North Branch of the Yangtze River Estuary. Applied Sciences. 2021; 11(19):8986. https://doi.org/10.3390/app11198986
Chicago/Turabian StyleKuang, Cuiping, Kuo Chen, Jie Wang, Yunlong Wu, Xu Liu, and Zilong Xia. 2021. "Responses of Hydrodynamics and Saline Water Intrusion to Typhoon Fongwong in the North Branch of the Yangtze River Estuary" Applied Sciences 11, no. 19: 8986. https://doi.org/10.3390/app11198986
APA StyleKuang, C., Chen, K., Wang, J., Wu, Y., Liu, X., & Xia, Z. (2021). Responses of Hydrodynamics and Saline Water Intrusion to Typhoon Fongwong in the North Branch of the Yangtze River Estuary. Applied Sciences, 11(19), 8986. https://doi.org/10.3390/app11198986