Article

Photo Identification of Individual Salmo trutta Based on Deep Learning

by
Marius Pedersen
*,†,‡ and
Ahmed Mohammed
Department of Computer Science, Norwegian University of Science and Technology, 7034 Trondheim, Norway
*
Author to whom correspondence should be addressed.
Current address: Teknologiveien 22, 2802 Gjøvik, Norway.
These authors contributed equally to this work.
Appl. Sci. 2021, 11(19), 9039; https://doi.org/10.3390/app11199039
Submission received: 16 August 2021 / Revised: 20 September 2021 / Accepted: 22 September 2021 / Published: 28 September 2021
(This article belongs to the Section Computing and Artificial Intelligence)

Abstract

:
Individual fish identification and recognition is an important step in the conservation and management of fisheries. One of most frequently used methods involves capturing and tagging fish. However, these processes have been reported to cause tissue damage, premature tag loss, and decreased swimming capacity. More recently, marine video recordings have been extensively used for monitoring fish populations. However, these require visual inspection to identify individual fish. In this work, we proposed an automatic method for the identification of individual brown trouts, Salmo trutta. We developed a deep convolutional architecture for this purpose. Specifically, given two fish images, multi-scale convolutional features were extracted to capture low-level features and high-level semantic components for embedding space representation. The extracted features were compared at each scale for capturing representation for individual fish identification. The method was evaluated on a dataset called NINA204 based on 204 videos of brown trout and on a dataset TROUT39 containing 39 brown trouts in 288 frames. The identification method distinguished individual fish with 94.6% precision and 74.3% recall on a NINA204 video sequence with significant appearance and shape variation. The identification method takes individual fish and is able to distinguish them with precision and recall percentages of 94.6% and 74.3% on NINA204 for a video sequence with significant appearance and shape variation.

1. Introduction

There is a need for effective in situ fish monitoring methods with aims to confirm the presence of a single species, track changes of threatened species, or document long-term changes in entire communities [1]. The adaption of technology in such areas is expanding as the use of video recording systems becomes widespread. Video recording has a number of advantages, such as being less labor intensive [2], capable of covering large areas of habitats, and it can be used in areas that are difficult to cover by other methods [3,4]. Video recordings have an advantage in that a viewer is able to pause, rewind, or forward the video, thereby also increasing accuracy and precision [5]. The use of video methods also has advantages over electrofishing, as this can cause injury or death to the fish [6] and has also been shown to alter the reproductive behaviors of fish [7]. The use of video recordings has been applied over the world; examples include the Wenatchee River (USA) [8], Tallapoosa River (USA) [9], Mekong River (Laos) [10], Ongivinuk River (USA) [11], Ebro River (Spain) [12], Uur River (Mongolia) [13], and Gudbrandsdalslågen (Norway) [14]. Robust and reliable systems would provide important information about population counts and movement [15], and therefore, there is a need for further research to enable the use of automatic systems.
Video recordings, including those from fish ladders, are in many cases manually viewed [16], such as in the work by [8,10]. Visual inspection with the goal to classify or identify individual fish with experts has disadvantages compared to automatic systems, such as being dependent on an expert observer [16], learning can also impact accuracy of an observer [8], and being more costly [17] and time-consuming [8]. For continuous video recording, the review time is extensive, as well as prone to fatigue of the observer. Event-based recording, when recording starts due to an event, for example, a fish passing a sensor, has been shown to be less labor intensive and exhibit fewer recording errors [18]. Nonetheless, there is a need for automatic methods to analyze video recordings efficiently and at a low cost.
Ladder counters using video recording systems have been popular, and videos have been manually inspected to detect escaped farmed Atlantic salmon [19], the migration of Atlantic salmon Salmo salar and sea trout Salmo trutta morpha trutta [20], but also to estimate population size [21]. Research has been carried out to automate the inspection and include counting the number of fish [22], detecting stocked fish [23], and classifying species [24]. Deep learning has been shown to be a promising method of estimating length, girth, and weight [25,26]. These are valuable tools for monitoring populations, and have been shown to provide good precision. However, they do not recognize individual fish.
The identification of individual animals, including fish, has traditionally been carried out with capture–mark–recapture methods, where one inserts a physical mark or tag [27]. For fish, these methods can include visible implant tags, fin-clipping, cold branding, tattoos, and external tag identifiers attached by metal wire, plastic, or string [28,29,30]. These methods have been successfully used for different identification tasks. However, there are drawbacks to using these methods. In large-scale studies, they become expensive and time-consuming methods. The methods can also be difficult to use with juvenile fish or small fish. Tags also have the drawback that they can be lost, destroyed, or vanish. In addition, the main concern is the physical and behavioral influence it brings to the marked individuals [31]. In a study by Persat [32] it was stated that fish tagging methods, such as jaw tagging and coded tags, normally do not last longer than 9 months and may cause wounds, infections, increase mortality and cause the slow growth of the individual. One should thoroughly consider when to ‘tag or not to tag’ a fish [33], and guidelines have been made for the surgical implantation of acoustic transmitters [34]. The limitations of traditional capture–mark–recapture methods unveil the need for the non-invasive recognition of individual fish.
In this paper, we propose a deep learning image-based system for the photo recognition of individual brown trouts, Salmo trutta. The goal is to be able to match, based on a photo of an individual brown trout, the same brown trout in a set of other images.

2. Materials and Methods

2.1. Identification Method
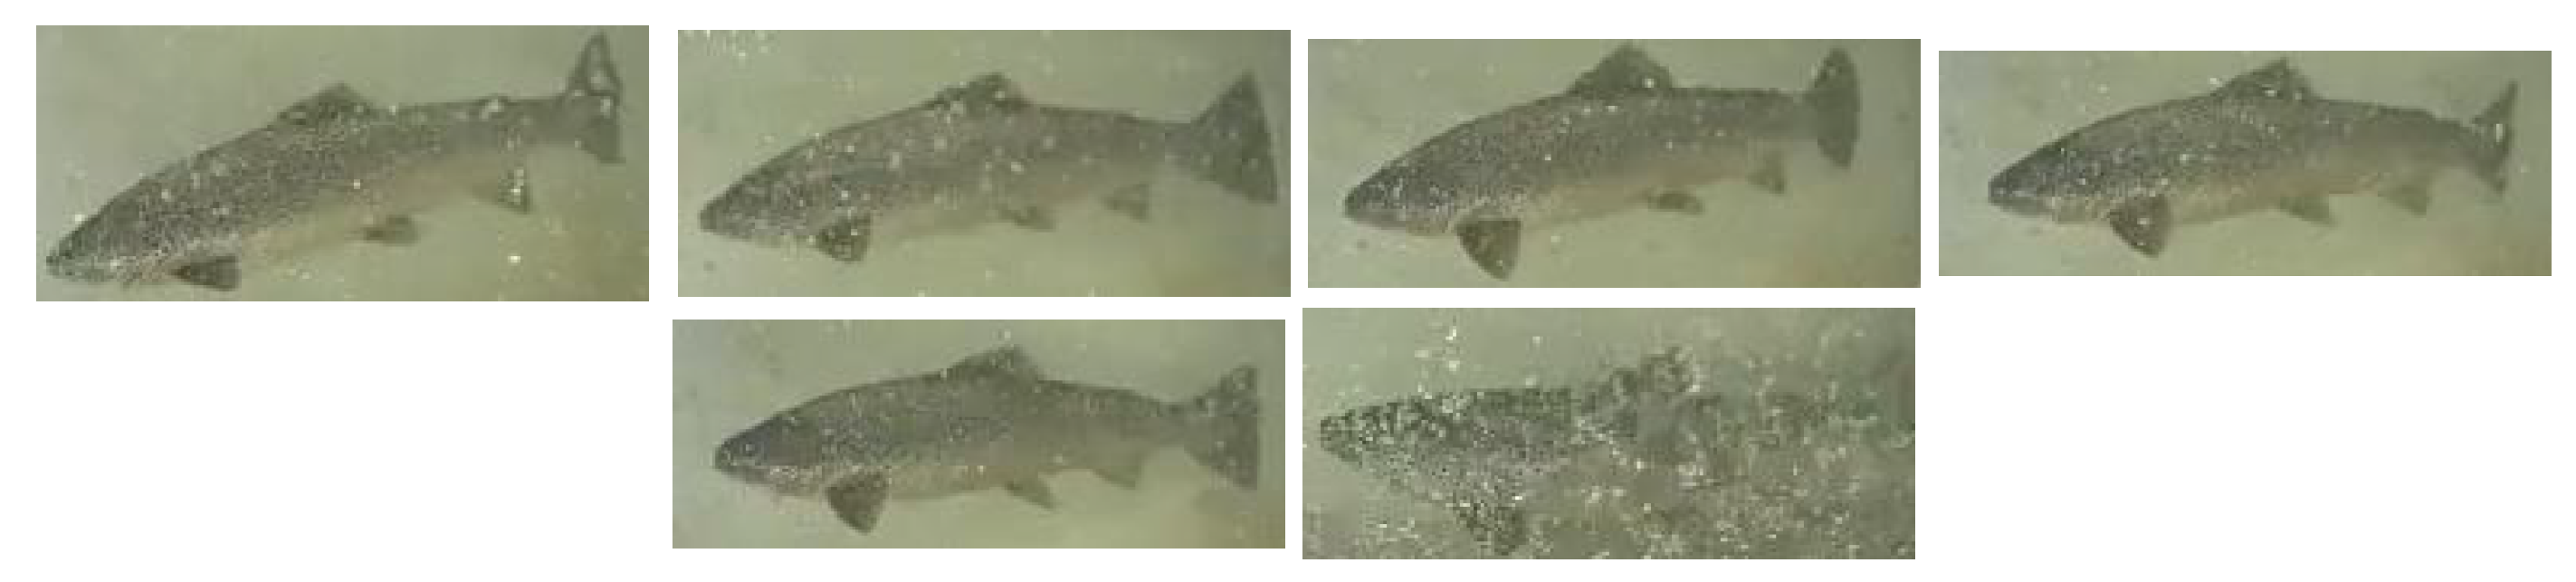
Research in deep learning has contributed to advances in a number of applications; those related to this paper include animal tracking [35] and animal recognition [36,37]. Our starting point was similar to recognition in other applications [38], where we extracted features from different layers of the encoder network. An encoder network is a deep neural network that takes an input image and generates a high-dimensional feature vector. The fish recognition model is shown in Figure 1. The input to the identification method was a pair of fish images (Fish A and Fish B in Figure 1). The encoder was composed of stacked convolutional layers. Encoder features were extracted with EfficientNet [39] since networks that performed better on the ImageNet dataset were capable of learning better transferable representations [40]. The layers at the beginning of the encoder network captured primitive image features, such as edges and textures, while deeper layers capture rich global information.
To further explore the spatial features and improve fish recognition performance, the automated identification method needs to incorporate high-level information about the fish and semantic information in the scene, and low-level information about the details in the textures, patterns, as well as an integration of various contexts extracted at different scales. Bidirectional feature pyramid networks (BiFPNs) [41] were extracted with the EfficientNet ( ϕ = 0 ) encoder network (Figure 1). BiFPN leveraged a convolutional neural network (CNN) to extract bidirectional feature maps with different resolutions. The feature maps in earlier layers captured the textural and color detail information in the local regions, while the feature maps in deep layers captured the fish semantic information of the whole fish image.
Based on the BiFPN representations of a fish, the problem of fish identification was reduced to a problem of matching low-level and high-level features between the two input images. It is necessary to identify a given fish correctly when it swims from right to left with viewpoint, scale, size, and appearance variations (Figure 2). For this, we employed the cosine similarity ϕ i , j between the corresponding BiFPN of the left and right input images (Figure 1). Cosine similarity has been shown to be effective in [42]. We used fish i and j to explain how the distance features were computed. Given the encoder network, BiFPN features at scale s were extracted for fish i, f i s , and j, f j s (Figure 1). The size of each feature f depended on the depth of the network and we used the last five features for compact representation. Given the above notation, the cosine distance feature at each scale was given by Equation (1):
ϕ i , j s = f i s , f j s f i s , f i s 1 2 f j s , f j s 1 2
where ϕ i , j s was the spatial cosine distance at each scale s. We concatenated the corresponding cosine distance from each scale Φ i , j = { ϕ i , j 0 } s = 0 s = 4 to form the final fused correspondence representation Φ i , j . We applied fully connected layers to encode the correspondence representation Φ i , j with a vector of size 64 × 4 and was then passed to a sigmoid layer. Mathematically, this can be represented as follows:
p ( I i , I j ) = S max ( 0 , W Φ i , j + b )
where S is a sigmoid function, and W and b are the weights and biases of the fully connected network. The output of the network, p ( I i , I j ) , is normalized between [ 0 , 1 ] as a post-processing step. We represented the final probability p that the two images in the pair, I i and I j , p ( I i , I j ) were of the same fish, as shown in Equation (3).
P r e d i c t i o n = i d e n t i c a l f i s h , if 0.5 p ( I i , I j ) 1 N o t i d e n t i c a l f i s h , if 0 p ( I i , I j ) 0.5
We optimized this framework by minimizing the widely used cross-entropy loss over a training set of N pairs:
L ( p , q ) = 1 N n = 1 N q n log ( p n ) + ( 1 q n ) log ( 1 p n )
where q n is the 0/1 output label for the input pair, which represents the same fish or not.

2.2. Dataset

Our dataset was provided by the Norwegian Institute for Nature Research and was the same basis material as used by Myrum et al. [23]. It contained 204 video clips captured in a fish ladder, where 101 videos were of stocked brown trout and 103 videos were of wild brown trout. Each video clip contained only one fish. The videos were referred to as the NINA204 dataset. The video clips were 24 s with a resolution of 320 × 240 pixels. The videos had different qualities, they varied in terms of illumination level, illumination uniformity, and they contained distortions such as air bubbles and algae. We annotated the videos with a rectangular bounding box around each fish using the Computer Vision Annotation Tool [43]. As these clips had multiple frames of the same brown trout, we were sure that it was the same individual, being a ground truth for our analysis. We selected video clips excluding small fish, juvenile fish, and clips where the we could not obtain enough images of full fish (excluding images of partial fish). Our dataset contained 49 unique, randomly chosen fish in the training set, with a total of 1943 images and 48 fish in the test set, and in the validation set, 1479 images, respectively. To train and validate the network, we created matched pairs for a given fish at frame T with { T + Δ t : Δ t Z } and random unmatched pairs. For all our experiments, Δ t was varied from one to five frames. For robust evaluation, we sampled the test set and created 16,269 unique matched (8K) and unmatched pairs (8K).
We also tested our method on a similar dataset to that of Zhao et al. [44], referred as TROUT39 dataset. This dataset was labeled in the same way as the previous dataset. Experts from the Norwegian Institute of Nature Research verified that it contained the same individual brown trouts, resulting in a ground truth for our analysis. The dataset contained 39 brown trouts with a total of 288 frames taken with a high-definition camera. Note that these images were taken outside the water and vary significantly from the dataset used to train the network.

2.3. Implementation Details

Our model was implemented using Pytorch library on a single NVIDIA GeForce GTX 1080 GPU. Due to the different image sizes in the dataset, we first cropped large boundary margins and resized all images into fixed dimensions with a spatial size of 512 × 512 before feeding to both encoders, and finally normalized them to [ 0 , 1 ] . We used Adam [45] as an optimizer with a batch size of 4 and the learning rate α set to 0.0001 . The EfficientNet [39] encoder network is initialed with pre-trained ImageNet weights for fine-tuning.

2.4. Training Procedure

To train the network, we started by creating matched and unmatched image pairs. Matched image pairs are images showing the same fish at a different time in the video. Unmatched image pairs are two different randomly generated fish pairs. Matched and unmatched image pairs are labeled as “1” and “0”, respectively. Given a sample from matched and unmatched pairs with their corresponding label, we optimized the loss function defined in Equation (4) and monitored the validation loss. To increase the robustness and reduce overfitting of our model, we increased the amount of training data by applying a random rotation of angle (45°, 90°, 135°) and random vertical and horizontal flips. The network was trained by gradually increasing the difficulty of matched pairs from Δ t = 0 to Δ t = 5 , where t is frames. This enabled the network to learn from simple to significant appearance variations between consecutive frames.

2.5. Evaluation Metrics

We evaluated the effectiveness of each method using precision (P), recall (R), F1-score (F1), accuracy (A), Likelihood Ratio Positive (LR+) [46], and specificity (Spec) metrics, which are defined below:
A = N T P + N T N N T P + N T N + N F P + N F N , P = N T P N T P + N F P , R = N T P N T P + N F N ,
F 1 = 2 P R P + R , S p e c = N T N N T N + N F P , L R + = T R P F P R
where N T P and N T N are the number of true positives and negatives and N F P and N F N are the number of false positives and negatives, respectively. Furthermore, T P R and F P R represent the true positive rate (i.e., recall) and false positive rate defined as N F P N F P + N T N , respectively. Accuracy (A) describes the difference between the correctly predicted and actual value. Precision (P) represents how well the model was able to predict positive cases, while Recall (R) represents how well the model predicted actual positives by labeling them as positive. F1-score was a good measure for the balance between precision and recall. Specificity (Spec) represented the proportion of negatives that were correctly predicted. An Accuracy, Precision, Recall, F1 score, or specificity of 1 was considered perfect, while 0 was the lowest possible. Similarly, a method with 100 LR+ indicates would indicate a 100-fold increase in the odds of identical fish being in a matched pair.

3. Results

We presented the baseline results of the identification method on multiple experimental setups and compared them with histogram of oriented gradient (HOG) [47], rotation invariant local binary pattern (LBP) [48] feature-based methods. For each fish, HOG and LBP features were extracted and the histogram intersection was used to train a linear support vector machine classifier [49]. The HOG features were computed with eight orientations with 32 pixels per block, giving 2048 feature dimension. Thirty six rotation invariant LBP features were computed with a radius of 3 at each pixel and the resulting texture image was represented with a histogram of 512 dimension. The identification method was performed in multiple stages. First, we evaluated the method for geometric variations such as flipping and rotation. To do so, given an image and its transformation, we predicted the performance whether the two brown trouts were identical or not. For the NINA204 dataset, an F1-score of 0.974 was obtained for T + 0 and the F1-score decreased to 0.832 for T + 5 (Table 1). Our proposed method performed better than HOG and LBP at all times in all performance metrics.
Furthermore, we evaluated the identification method on the TROUT39 dataset. The TROUT39 dataset was significantly different from NINA204, as the pictures were taken in open-air with a high-definition camera. We obtained an overall performance of 0.592 in the F1-score (Table 2). Sample visual results are given in Table 3.

4. Discussion

There is a vast amount of literature related to fish in underwater images, both in freshwater and saltwater. This includes detection and tracking [50], the recognition of species [15], fish behavior [51], quantifying fish habitat [52], and more. However, with regard to the automatic recognition of individual fish, to the best of our knowledge, the only attempt has been made by Zhao et al. in [44,53]. Zhao et al. [44] proposed two different methods that concerned on the head region of brown trouts. The first method was based on local density features, where the image was binarized and divided into blocks. For each block, the number of spots were counted. The other proposed method was based on a list of common features, usually called a codebook. The codebook represented different information from the input image. Haurum et al. [53] proposed a method for the re-identification of zebrafish using metric learning, where they learned a distance function based on features.
To achieve the non-invasive recognition of fish, the fish need to have unique features, and these features need to stay present throughout the lifetime of the individual. The proposed identification method was robust to transformation, with an F1-score of 0.974 . Furthermore, we performed the evaluation from easier ( T + 1 ) to more difficult cases ( T + 5 ) with significant appearances, lighting, and shape variations. With T + 5 examples, the identification method was able to perform fish identification with an F1-score of 0.832 . Sample visual results for correctly recognized fishes are given in Table 4 and failure cases are shown in Table 5. Fish identification in the wild was difficult especially under high turbidity and orientation changes (Table 5).
In the TROUT39 dataset, the performance loss compared to NINA204 dataset was expected, as the training data source is significantly different from the testing data source. The identification method was able to differentiate pictures of brown trouts taken at different time instances (Table 3).
Although not directly comparable, Zhao et al. [44] showed an accuracy of 0.649 and 0.740 on images from the TROUT39 dataset in their publication. This was around the same as the proposed method, which had an accuracy of 0.718 (Table 2). It is important to note that the method from Zhao et al. only used the head region of the brown trouts, while our identification method was based on the entire brown trout.
The results indicated that our method is able to perform even when the testing data are significantly different from the training data. The TROUT39 dataset was different from the NINA204 set, as the images were taken outside of the water, making the testing data different from the training data. Despite this, our identification method was able to achieve an accuracy of 0.718.
A comparison to other applications where re-identification was used showed that our accuracy of 0.974 for T + 0 and 0.874 for T + 5 in the NINA204 dataset and 0.718 for TROUT39 was similar to that obtained for other animals. The method used in [54] obtained an accuracy of 0.92 for chimpanzees, while [55] obtained 0.938 for individual lemurs, 0.904 and for golden monkeys, and 0.758 for chimpanzees.
Our approach was non-invasive, avoiding the limitations of capture–mark–recapture methods. Being able to identify individual fish automatically from photos can be seen as desirable due to its lower cost and reduced workload, compared to, for example, capture and re-capture methods. However, criticism exists in regard to density estimation from camera traps, especially for animals that lack obvious natural markings [56]. This was also the case for the proposed identification method, in that it required fish species with natural markings. Automatic methods, if robust, can be a way to complement visual identification by humans. Identification by observers using camera traps can have inter-observer variation [57]. Misidentification due to subjective natural markers has also been stated as a problem [56].
Such a non-invasive system has potential in the monitoring of fish, for example, migration patterns, or to be used to analyze behavior. The proposed method could allow one to analyze the behavior of individuals, for example, being able to detect the number of times a specific fish passes downstream or upstream in a fish ladder. It could also be useful for monitoring weight growth patterns and health conditions, which are crucial for optimizing cultivation factors such as temperature, fish density, and breeding frequency. It can also be used for population estimation, as it can be used to avoid counting the same fish multiple times.
Future work should include an evaluation of this method using additional video data sets. In the NINA204 dataset, images are extracted from a video clip within a time-limited section. Investigating how robust the method is to longer time intervals is a natural extension of this work. The dataset used can be seen as limited compared to what is used for evaluation in other computer vision tasks, and a larger dataset would strengthen the evaluation. Future work may also include the additional evaluation of the identification method using both brown trouts and other species such as European grayling, Thymallus thymallus) or European whitefish, Coregonus lavaretus. Additional work could also be carried out to make it more robust to different water turbidity levels. One can also study the method of combining deep learning abstract features with traditional manual features.

5. Conclusions

In this paper, we developed a deep convolutional architecture for the identification of individual fish. We employed a deep multi-scale bidirectional feature pyramid network to capture low-level features and high-level semantic components for embedding space representation. Based on the pyramid matching strategy, we designed a metric learning feature representation to capture robust representation to solve the fish identification problem. We demonstrated the effectiveness and promise of our method by reporting extensive evaluations on two different datasets containing brown trouts, Salmo trutta. In the NINA204 dataset, comparisons were made in the same environment, while in the TROUT39 dataset, comparison was made between different environments.

Author Contributions

Conceptualization, M.P. and A.M.; methodology, M.P. and A.M.; validation, M.P. and A.M.; formal analysis, M.P. and A.M.; writing—original draft preparation, M.P. and A.M.; writing—review and editing, M.P. and A.M. All authors have read and agreed to the published version of the manuscript.

Funding

This research received no external funding.

Acknowledgments

We would like to thank Børre Dervo and Jon Museth at the Norwegian Institute for Nature Research for the dataset and Mithunan Sivakumar for assistance in labeling the dataset.

Conflicts of Interest

The authors declare no conflict of interest.

References

  1. Radinger, J.; Britton, J.R.; Carlson, S.M.; Magurran, A.E.; Alcaraz-Hernández, J.D.; Almodóvar, A.; Benejam, L.; Fernández-Delgado, C.; Nicola, G.G.; Oliva-Paterna, F.J.; et al. Effective monitoring of freshwater fish. Fish Fish. 2019, 20, 729–747. [Google Scholar] [CrossRef] [Green Version]
  2. Lucas, M.C.; Baras, E. Methods for studying spatial behaviour of freshwater fishes in the natural environment. Fish Fish. 2000, 1, 283–316. [Google Scholar] [CrossRef]
  3. Ferrari, R.; McKinnon, D.; He, H.; Smith, R.N.; Corke, P.; González-Rivero, M.; Mumby, P.J.; Upcroft, B. Quantifying multiscale habitat structural complexity: A cost-effective framework for underwater 3D modelling. Remote Sens. 2016, 8, 113. [Google Scholar] [CrossRef] [Green Version]
  4. Brown, C.J.; Broadley, A.; Adame, M.F.; Branch, T.A.; Turschwell, M.P.; Connolly, R.M. The assessment of fishery status depends on fish habitats. Fish Fish. 2019, 20, 1–14. [Google Scholar] [CrossRef] [Green Version]
  5. Davies, T.D.; Kehler, D.G.; Meade, K.R. Retrospective Sampling Strategies Using Video Recordings to Estimate Fish Passage at Fishways. N. Am. J. Fish. Manag. 2007, 27, 992–1003. [Google Scholar] [CrossRef]
  6. Snyder, D.E. Invited overview: Conclusions from a review of electrofishing and its harmful effects on fish. Rev. Fish Biol. Fish. 2003, 13, 445–453. [Google Scholar] [CrossRef]
  7. Stewart, C.T.; Lutnesky, M.M. Retardation of reproduction in the Red Shiner due to electroshock. N. Am. J. Fish. Manag. 2014, 34, 463–470. [Google Scholar] [CrossRef]
  8. Hatch, D.R.; Schwartzberg, M. Wenatchee River salmon escapement estimates using video tape technology in 1990. CRITFC Tech. Rep. 1991, 91, 29. [Google Scholar]
  9. Martin, B.M.; Irwin, E.R. A Digital Underwater Video Camera System for Aquatic Research in Regulated Rivers. N. Am. J. Fish. Manag. 2010, 30, 1365–1369. [Google Scholar] [CrossRef]
  10. Hawkins, P.; Hortle, K.; Phommanivong, S.; Singsua, Y. Underwater video monitoring of fish passage in the Mekong River at Sadam Channel, Khone Falls, Laos. River Res. Appl. 2018, 34, 232–243. [Google Scholar] [CrossRef]
  11. Hetrick, N.J.; Simms, K.M.; Plumb, M.P.; Larson, J.P. Feasibility of Using Video Technology to Estimate Salmon Escapement in the Ongivinuk River, a Clear-Water Tributary of the Togiak River; US Fish and Wildlife Service, King Salmon Fish and Wildlife Field Office: King Salmon, AK, USA, 2004.
  12. Aparicio, E.; Pintor, C.; Durán, C.; Carmona Catot, G. Fish passage assessment at the most downstream barrier of the Ebro River (NE Iberian Peninsula). Limnetica 2012, 31, 37–46. [Google Scholar]
  13. Esteve, M.; Gilroy, D.; McLennan, D.A. Spawning behaviour of taimen (Hucho taimen) from the Uur River, Northern Mongolia. Environ. Biol. Fishes 2009, 84, 185–189. [Google Scholar] [CrossRef]
  14. Arnekleiv, J.V.; Kraabøl, M.; Museth, J. Efforts to aid downstream migrating brown trout (Salmo trutta L.) kelts and smolts passing a hydroelectric dam and a spillway. In Developments in Fish Telemetry; Springer: Berlin/Heidelberg, Germany, 2007; pp. 5–15. [Google Scholar]
  15. Lee, D.J.; Archibald, J.K.; Schoenberger, R.B.; Dennis, A.W.; Shiozawa, D.K. Contour matching for fish species recognition and migration monitoring. In Applications of Computational Intelligence in Biology; Springer: Berlin/Heidelberg, Germany, 2008; pp. 183–207. [Google Scholar]
  16. Finstad, B.; Ulvan, E.M.; Jonsson, B.; Ugedal, O.; Thorstad, E.B.; Hvidsten, N.A.; Hindar, K.; Karlsson, S.; Uglem, I.; Økland, F. Forslag til overvåkingssystem for sjøørret. NINA Rapp. 2011, 689, 1–53. [Google Scholar]
  17. Eder, K.; Thompson, D.; Caudill, C.; Loge, F. Video Monitoring of Adult Fish Ladder Modifications to Improve Pacific Lamprey Passage at the McNary Dam Oregon Shore Fishway; Technical Report; Army Coprs of Engineers: Walla Walla District, WA, USA, 2011. [Google Scholar]
  18. Daum, D.W. Monitoring fish wheel catch using event-triggered video technology. N. Am. J. Fish. Manag. 2005, 25, 322–328. [Google Scholar] [CrossRef]
  19. Svenning, M.A.; Lamberg, A.; Dempson, B.; Strand, R.; Hanssen, Ø.K.; Fauchald, P. Incidence and timing of wild and escaped farmed Atlantic salmon (Salmo salar) in Norwegian rivers inferred from video surveillance monitoring. Ecol. Freshw. Fish 2017, 26, 360–370. [Google Scholar] [CrossRef]
  20. Orell, P. Video Monitoring of the River Neidenelva Salmon and Sea-Trout Migrations in 2006–2011; Working Papers of the Finnish Game and Fisheries Institute 8/2012; Finnish Game and Fisheries Research Institute: Helsinki, Finland, 2012. [Google Scholar]
  21. Lamberg, A.; Strand, R. Overvåking av anadrome laksefisk i Urvoldvassdraget i Bindal i 2008: Miljøeffekter av lakseoppdrettsanlegg i Bindalsfjorden. In Vilt og Fiskeinfo Rapport; Technical Report, Number 6; Vilt og Fiskeinfo AS: Ranheim, Norway, 2009. [Google Scholar]
  22. Cadieux, S.; Michaud, F.; Lalonde, F. Intelligent system for automated fish sorting and counting. In Proceedings of the 2000 IEEE/RSJ International Conference on Intelligent Robots and Systems (IROS 2000) (Cat. No. 00CH37113), Takamatsu, Japan, 31 October–5 November 2000; Volume 2, pp. 1279–1284. [Google Scholar]
  23. Myrum, E.; Nørstebø, S.A.; George, S.; Pedersen, M.; Museth, J. An Automatic Image-Based System for Detecting Wild and Stocked Fish. In Proceedings of the Norsk Informatikkonferanse, Narvik, Norway, 25–27 November 2019. [Google Scholar]
  24. Pengying, T.; Pedersen, M.; Hardeberg, J.Y.; Museth, J. Underwater Fish Classification of Trout and Grayling. In Proceedings of the 15th International Conference on Signal Image Technology & Internet Based Systems, Naples, Italy, 26–29 November 2019; pp. 268–273. [Google Scholar]
  25. Bravata, N.; Kelly, D.; Eickholt, J.; Bryan, J.; Miehls, S.; Zielinski, D. Applications of deep convolutional neural networks to predict length, circumference, and weight from mostly dewatered images of fish. Ecol. Evol. 2020, 10, 9313–9325. [Google Scholar] [CrossRef]
  26. Zhao, S.; Zhang, S.; Liu, J.; Wang, H.; Zhu, J.; Li, D.; Zhao, R. Application of machine learning in intelligent fish aquaculture: A review. Aquaculture 2021, 540, 736724. [Google Scholar] [CrossRef]
  27. Gamble, L.; Ravela, S.; McGarigal, K. Multi-scale features for identifying individuals in large biological databases: An application of pattern recognition technology to the marbled salamander Ambystoma opacum. J. Appl. Ecol. 2008, 45, 170–180. [Google Scholar] [CrossRef]
  28. Koehn, J.D. Why use radio tags to study freshwater fish. In Fish Movement and Migration; Hancock, D.A., Smith, D., Koehn, J.D., Eds.; Arthur Rylah Institute for Environmental Research: Heidelberg, Australia, 2000; pp. 24–32. [Google Scholar]
  29. Merz, J.E. Seasonal feeding habits, growth, and movement of steelhead trout in the lower Mokelumne River, California. Calif. Fish Game 2002, 88, 95–111. [Google Scholar]
  30. Dietrich, J.P.; Cunjak, R.A. Evaluation of the impacts of Carlin tags, fin clips, and Panjet tattoos on juvenile Atlantic salmon. N. Am. J. Fish. Manag. 2006, 26, 163–169. [Google Scholar] [CrossRef]
  31. Powell, R.A.; Proulx, G. Trapping and marking terrestrial mammals for research: Integrating ethics, performance criteria, techniques, and common sense. ILAR J. 2003, 44, 259–276. [Google Scholar] [CrossRef] [Green Version]
  32. Persat, H. Photographic identification of individual grayling, Thymallus thymallus, based on the disposition of black dots and scales. Freshw. Biol. 1982, 12, 97–101. [Google Scholar] [CrossRef]
  33. Cooke, S.J.; Nguyen, V.M.; Murchie, K.J.; Thiem, J.D.; Donaldson, M.R.; Hinch, S.G.; Brown, R.S.; Fisk, A. To tag or not to tag: Animal welfare, conservation, and stakeholder considerations in fish tracking studies that use electronic tags. J. Int. Wildl. Law Policy 2013, 16, 352–374. [Google Scholar] [CrossRef]
  34. Brown, R.S.; Cooke, S.J.; Wagner, G.N.; Eppard, M.B. Methods for Surgical Implantation of Acoustic Transmitters in Juvenile Salmonids; Prepared for the US Army Corps of Engineers, Portland District. Contract DE-AC25e76RL01830; National Technical Information Service, US Department of Commerce: Springfield, VA, USA, 2010.
  35. Ravoor, P.C.; Sudarshan, T. Deep Learning Methods for Multi-Species Animal Re-identification and Tracking—A Survey. Comput. Sci. Rev. 2020, 38, 100289. [Google Scholar] [CrossRef]
  36. Okafor, E.; Pawara, P.; Karaaba, F.; Surinta, O.; Codreanu, V.; Schomaker, L.; Wiering, M. Comparative study between deep learning and bag of visual words for wild-animal recognition. In Proceedings of the 2016 IEEE Symposium Series on Computational Intelligence (SSCI), Athens, Greece, 6–9 December 2016; pp. 1–8. [Google Scholar]
  37. Nguyen, H.; Maclagan, S.J.; Nguyen, T.D.; Nguyen, T.; Flemons, P.; Andrews, K.; Ritchie, E.G.; Phung, D. Animal recognition and identification with deep convolutional neural networks for automated wildlife monitoring. In Proceedings of the 2017 IEEE International Conference on Data Science and Advanced Analytics (DSAA), Tokyo, Japan, 19–21 October 2017; pp. 40–49. [Google Scholar]
  38. Zhou, C.; Xu, D.; Chen, L.; Zhang, S.; Sun, C.; Yang, X.; Wang, Y. Evaluation of fish feeding intensity in aquaculture using a convolutional neural network and machine vision. Aquaculture 2019, 507, 457–465. [Google Scholar] [CrossRef]
  39. Tan, M.; Le, Q.V. Efficientnet: Rethinking model scaling for convolutional neural networks. arXiv 2019, arXiv:1905.11946. [Google Scholar]
  40. Kornblith, S.; Shlens, J.; Le, Q.V. Do better imagenet models transfer better? In Proceedings of the IEEE Conference on Computer Vision and Pattern Recognition, Long Beach, CA, USA, 16–17 June 2019; pp. 2661–2671. [Google Scholar]
  41. Tan, M.; Pang, R.; Le, Q.V. Efficientdet: Scalable and efficient object detection. In Proceedings of the IEEE/CVF Conference on Computer Vision and Pattern Recognition, Seattle, WA, USA, 14–19 June 2020; pp. 10781–10790. [Google Scholar]
  42. Garcia, N.; Vogiatzis, G. Learning non-metric visual similarity for image retrieval. Image Vis. Comput. 2019, 82, 18–25. [Google Scholar] [CrossRef] [Green Version]
  43. Computer Vision Annotation Tool. Available online: https://github.com/opencv/cvat (accessed on 1 May 2020).
  44. Zhao, L.; Pedersen, M.; Hardeberg, J.Y.; Dervo, B. Image-based Recognition of Individual Trouts in the Wild. In Proceedings of the 8th European Workshop on Visual Information Processing, Roma, Italy, 28–31 October 2019; pp. 82–87. [Google Scholar]
  45. Kingma, D.P.; Ba, J. Adam: A method for stochastic optimization. arXiv 2014, arXiv:1412.6980. [Google Scholar]
  46. Zhang, T.; Zhang, X.; Ke, X.; Liu, C.; Xu, X.; Zhan, X.; Wang, C.; Ahmad, I.; Zhou, Y.; Pan, D.; et al. HOG-ShipCLSNet: A Novel Deep Learning Network with HOG Feature Fusion for SAR Ship Classification. IEEE Trans. Geosci. Remote Sens. 2021. [Google Scholar] [CrossRef]
  47. Dalal, N.; Triggs, B. Histograms of oriented gradients for human detection. In Proceedings of the 2005 IEEE Computer Society Conference on Computer Vision and Pattern Recognition (CVPR’05), San Diego, CA, USA, 20–26 June 2005; Volume 1, pp. 886–893. [Google Scholar]
  48. Ahonen, T.; Hadid, A.; Pietikäinen, M. Face recognition with local binary patterns. In European Conference on Computer Vision; Springer: Berlin/Heidelberg, Germany, 2004; pp. 469–481. [Google Scholar]
  49. Schölkopf, B.; Smola, A.J.; Williamson, R.C.; Bartlett, P.L. New support vector algorithms. Neural Comput. 2000, 12, 1207–1245. [Google Scholar] [CrossRef] [PubMed]
  50. Lantsova, E.; Voitiuk, T.; Zudilova, T.; Kaarna, A. Using low-quality video sequences for fish detection and tracking. In Proceedings of the 2016 SAI Computing Conference (SAI), London, UK, 13–15 July 2016; pp. 426–433. [Google Scholar]
  51. He, P. Swimming behaviour of winter flounder (Pleuronectes americanus) on natural fishing grounds as observed by an underwater video camera. Fish. Res. 2003, 60, 507–514. [Google Scholar] [CrossRef]
  52. Pratt, T.C.; Smokorowski, K.E.; Muirhead, J.R. Development and experimental assessment of an underwater video technique for assessing fish-habitat relationships. Arch. Für Hydrobiol. 2005, 164, 547–571. [Google Scholar] [CrossRef]
  53. Bruslund Haurum, J.; Karpova, A.; Pedersen, M.; Hein Bengtson, S.; Moeslund, T.B. Re-Identification of Zebrafish using Metric Learning. In Proceedings of the IEEE/CVF Winter Conference on Applications of Computer Vision (WACV) Workshops, Snowmass Village, CO, USA, 1–5 March 2020. [Google Scholar]
  54. Freytag, A.; Rodner, E.; Simon, M.; Loos, A.; Kühl, H.S.; Denzler, J. Chimpanzee faces in the wild: Log-euclidean CNNs for predicting identities and attributes of primates. In German Conference on Pattern Recognition; Springer: Berlin/Heidelberg, Germany, 2016; pp. 51–63. [Google Scholar]
  55. Deb, D.; Wiper, S.; Gong, S.; Shi, Y.; Tymoszek, C.; Fletcher, A.; Jain, A.K. Face recognition: Primates in the wild. In Proceedings of the 2018 IEEE 9th International Conference on Biometrics Theory, Applications and Systems (BTAS), Redondo Beach, CA, USA, 22–25 October 2018; pp. 1–10. [Google Scholar]
  56. Foster, R.J.; Harmsen, B.J. A critique of density estimation from camera-trap data. J. Wildl. Manag. 2012, 76, 224–236. [Google Scholar] [CrossRef]
  57. Kelly, M.J.; Noss, A.J.; Di Bitetti, M.S.; Maffei, L.; Arispe, R.L.; Paviolo, A.; De Angelo, C.D.; Di Blanco, Y.E. Estimating puma densities from camera trapping across three study sites: Bolivia, Argentina, and Belize. J. Mammal. 2008, 89, 408–418. [Google Scholar] [CrossRef]
Figure 1. Fish recognition block diagram. Given input images A and B, image features were extracted at different layers of the deep neural network. The similarity between Fish A and B features was computed using the cosine similarity metric ϕ , which indicated the feature distance between Fish A and B at each scale of the network. FC was a fully connected layer followed by rectified linear activation function (ReLU). The output of ReLU was passed through a Sigmoid function to give a value between 0 and 1, indicating non-identical or identical fishes, respectively.
Applsci 11 09039 g001
Figure 2. Appearance and shape variations of fish ID 344 from a video recording as it swam from right to left frame number 260, 418, 421, 426, 452, and 474, respectively.
Applsci 11 09039 g002
Table 1. Fish recognition performance vs. temporal distance in NINA204 test dataset. Each fish was compared with frames containing the same fish taken at different time step Δ t (frames).
Time + Δ t MethodAccuracyPrecisionRecallF1-ScoreSpecificityLR+
T + 0 Proposed0.9740.9800.9670.9740.98150.894
HOG+SVM [47]0.8070.7710.8770.8210.7353.309
LBP+SVM [48]0.8040.9040.6840.7790.9269.24
T + 1 Proposed0.9670.9780.9540.9660.98047.7
HOG+SVM [47]0.7790.7150.8560.7790.7153.0
LBP+SVM [48]0.7880.8580.6400.7340.9127.27
T + 2 Proposed0.9510.9730.9240.9480.97638.5
HOG+SVM [47]0.7610.7150.8130.7610.7162.86
LBP+SVM [48]0.7540.8410.5830.6880.9046.07
T + 3 Proposed0.9170.9660.8480.9030.97533.92
HOG+SVM [47]0.7520.6910.7780.7320.7312.89
LBP+SVM [48]0.7800.8690.5840.6990.9328.59
T + 4 Proposed0.9030.9610.8130.8810.97431.27
HOG+SVM [47]0.7440.6800.7660.7200.7272.80
LBP+SVM [48]0.7750.8470.5820.6900.9207.27
T + 5 Proposed0.8740.9460.7430.8320.96923.96
HOG+SVM [47]0.7250.6580.7260.6910.7252.64
LBP+SVM [48]0.7570.8330.5290.6470.9236.87
Table 2. TROUT39 dataset recognition performance. Note that the unmatched pairs were randomly generated for evaluation.
MethodAccuracyPrecisionRecallF1-ScoreSpecificityLR+
Proposed0.7180.7660.4830.5920.8911.86
Table 3. Randomly chosen sample fish in the TROUT39 validation dataset that were correctly recognized. Note that the network was trained using under-water videos and the results here show the performance of the identification method for out-of-water fish recognition.
Fish IDImagesPredicted
Brown Trout 1Brown Trout 2Image 1Image 2
Brown Trout 14Brown Trout 23 Applsci 11 09039 i001 Applsci 11 09039 i002Not Identical
Brown Trout 39Brown Trout 39 Applsci 11 09039 i003 Applsci 11 09039 i004Identical
Brown Trout 24Brown Trout 13 Applsci 11 09039 i005 Applsci 11 09039 i006Not Identical
Brown Trout 5Brown Trout 5 Applsci 11 09039 i007 Applsci 11 09039 i008Identical
Brown Trout 10Brown Trout 10 Applsci 11 09039 i009 Applsci 11 09039 i010Identical
Brown Trout 17Brown Trout 17 Applsci 11 09039 i011 Applsci 11 09039 i012Identical
Brown Trout 14Brown Trout 23 Applsci 11 09039 i013 Applsci 11 09039 i014Not Identical
Brown Trout 38Brown Trout 36 Applsci 11 09039 i015 Applsci 11 09039 i016Not Identical
Table 4. Randomly chosen sample fish in NINA204 dataset that were correctly recognized. The identification method was able to recognize difficult cases with significant variation in shape, turbidity, and appearance.
Fish IDImagesPredicted
Fish 1Fish 2Image 1Image 2
Fish8Fish84 Applsci 11 09039 i017 Applsci 11 09039 i018Not Identical
Fish479Fish236 Applsci 11 09039 i019 Applsci 11 09039 i020Not Identical
Fish358Fish358 Applsci 11 09039 i021 Applsci 11 09039 i022Identical
Fish238Fish238 Applsci 11 09039 i023 Applsci 11 09039 i024Identical
Fish144Fish238 Applsci 11 09039 i025 Applsci 11 09039 i026Not Identical
Fish479Fish479 Applsci 11 09039 i027 Applsci 11 09039 i028Identical
Fish449Fish65 Applsci 11 09039 i029 Applsci 11 09039 i030Not Identical
Fish305Fish84 Applsci 11 09039 i031 Applsci 11 09039 i032Not Identical
Table 5. Randomly chosen sample fish in NINA204 dataset that were incorrectly recognized.
Fish IDImagesPredicted
Fish 1Fish 2Image 1Image 2
Fish298Fish298 Applsci 11 09039 i033 Applsci 11 09039 i034Not Identical
Fish248Fish59 Applsci 11 09039 i035 Applsci 11 09039 i036Identical
Fish293Fish293 Applsci 11 09039 i037 Applsci 11 09039 i038Not Identical
Fish183Fish541 Applsci 11 09039 i039 Applsci 11 09039 i040Identical
Fish71Fish71 Applsci 11 09039 i041 Applsci 11 09039 i042Not Identical
Fish299Fish299 Applsci 11 09039 i043 Applsci 11 09039 i044Not Identical
Fish438Fish539 Applsci 11 09039 i045 Applsci 11 09039 i046Identical
Fish153Fish448 Applsci 11 09039 i047 Applsci 11 09039 i048Identical
Publisher’s Note: MDPI stays neutral with regard to jurisdictional claims in published maps and institutional affiliations.

