Article

Elastic Properties Estimation of Masonry Walls through the Propagation of Elastic Waves: An Experimental Investigation

Department of Civil and Environmental Engineering, University of Perugia, Via G. Duranti 93, 06125 Perugia, Italy
*
Author to whom correspondence should be addressed.
Appl. Sci. 2021, 11(19), 9091; https://doi.org/10.3390/app11199091
Submission received: 13 July 2021 / Revised: 18 September 2021 / Accepted: 23 September 2021 / Published: 29 September 2021

Abstract

:
Structural identification is one of the most important steps when dealing with historic buildings. Knowledge of the parameters, which define the mechanical properties of these kinds of structures, is fundamental in preparing interventions aimed at their restoration and strengthening, especially if they have suffered damage due to strong events. In particular, by using non-destructive techniques it is possible to estimate the mechanical characteristics of load-bearing structures without compromising the artistic value of the monumental buildings. In this paper, after recalling the main theoretical aspects, the use of elastic waves propagation through impact tests for the characterization of the masonry walls of a monumental building is described. The impact test allowed us to estimate the elastic characteristics of the homogeneous solid equivalent to masonry material. This confirms the great potential of the non-destructive diagnostics suitable for analyzing important structural parameters without affecting the preservation of historical masonry structures.

1. Introduction

In the framework of architectural restoration of cultural heritage, an accurate knowledge of material properties is essential in order to design proper interventions. The aim of restoration works is to preserve the artifacts and increase the safety and then the life span of existing buildings and their structures. In this context, deep knowledge of the constituent materials, with their interaction with environmental loads and the degradation effects on the mechanical properties, is crucial to diagnostic operations [1,2,3].
Investigations aimed at estimating the mechanical properties of construction materials can be of different types. Working on historical structures, and in particular on architectural heritage, however, it must be considered that the material characterization process requires the use of specific non-destructive techniques (NDT) in order to avoid possible damages. For this reason, in the last decades different approaches were developed to increase the mechanical and physical knowledge of the structures and the constituent materials [4,5,6,7]. Moreover, it must be considered that historical constructions are mainly made from masonry, a complex heterogeneous material whose mechanical behavior is strongly dependent on the properties of the mortars and blocks and by their arrangement. In this framework, the research on appropriate non-destructive techniques, especially related to the on-site tests, for the characterization of masonry is still a challenge [8,9,10,11,12,13,14,15].
Among the NDTs generally used on structural materials, impact, sonic and ultrasonic tests have received particular interest due to the non-invasive methodology and, at the same time, the ability of providing several types of information regarding the material condition. Sonic, ultrasonic and impact tests are based on the analysis of the elastic waves propagation through the material, from which several features can be derived, such as the presence of damages, the status of the degradation, or the estimation of the elastic parameters. Owing to the common assumption made in the sonic tests, which considers the material as elastic, isotropic and homogeneous, most of the works reported in the literature concerning Civil Engineering applications are referred to concrete material. This is due to the small characteristic length of the microstructure with respect to the dimension of the structural element, allowing to consider concrete material as almost homogeneous [16,17,18,19,20,21,22].
The application of sonic and impact tests on masonry material is still today controversial in the scientific community, due to the uncertainties and the strong randomness of masonry in historical constructions. However, several papers can be found in literature, especially regarding the comparison between damaged and undamaged masonry panels, e.g., to verify the effectiveness of restoration works, or to analyze the internal texture, and also detect and localize the presence of voids [23,24,25,26,27,28,29,30,31,32,33].
The aim of this work is to study the use of impact tests on masonry material for the estimation of the elastic parameters by means of classic homogenization approaches for the characterization of heterogeneous media, which are based on the analysis of test windows [34,35,36,37,38,39,40,41,42]. More in detail, the novelty of this study is to investigate the effectiveness of estimating the elastic modulus of the material by analyzing the propagation velocity of the elastic waves with the increase of the structural element dimensions on which the tests are performed. The applications reported in this work are based on the study of both direct and indirect test, i.e., on the analysis of volume (P-wave) and surface (R-wave) elastic waves. After a recall of the main theoretical aspects regarding the elastic wave propagation in isotropic homogenous media (Section 2) and a preliminary investigation on concrete walls, necessary to validate the experimental setup and the post-processing procedure (Section 3), a brickwork masonry wall belonging to a monumental building is studied (Section 4). In Section 5 some remarks of the outcomes obtained by the experimental tests are reported, and Section 6 concludes the paper.

2. Waves Propagation in Isotropic Homogeneous Elastic Media. Basic Theoretical Concepts

In this Section the basic concepts on the theory of wave propagation through linear elastic, isotropic and homogeneous media are given. The main reference is made to the theoretical aspects derived from the seminal books of Kolsky, Ewing and Victorov [43,44,45].
Let us consider an elastic solid media in a Cartesian coordinate system ( x , y , z ) and a generic point with displacement vector ( u , v , w ) , stress tensor components σ i j and body forces ( X , Y , Z ) . Being ρ the mass density, the equations of motion are expressed as
ρ d 2 u d t 2 = ρ X + σ x x x + σ y x y + σ z x z
ρ d 2 v d t 2 = ρ Y + σ x y x + σ y y y + σ z y z
ρ d 2 w d t 2 = ρ Z + σ x z x + σ y z y + σ z z z
For an isotropic elastic solid Equation (1) can be expressed in terms of displacements using Lamé constants, λ and μ , as following
ρ 2 u t 2 = ( λ + μ ) θ x + μ 2 u + ρ X
ρ 2 v t 2 = ( λ + μ ) θ y + μ 2 v + ρ Y
ρ 2 w t 2 = ( λ + μ ) θ z + μ 2 w + ρ Z
in which θ = u x + v y + w z . The expression d 2 d t 2 has been replaced with 2 t 2 as their difference involves squares or products of components assumed to be very small; linearizing the differential equations is possible through this operation.
By introducing a scalar potential φ and a vector potential ψ ( ψ 1 , ψ 2 , ψ 3 ) , with
u = φ x + ψ 3 y ψ 2 z
v = φ y + ψ 1 z ψ 3 x
w = φ z + ψ 2 x ψ 3 y
and neglecting volume forces, the following expression can be obtained
x ( ρ 2 φ t 2 ) + y ( ρ 2 ψ 3 t 2 ) z ( ρ 2 ψ 2 t 2 ) = ( λ + μ ) x 2 φ + μ x 2 φ + μ y 2 ψ 3 μ z 2 ψ 2 .
The previous equation will be satisfied if the functions φ and ψ i are solutions of the equations
2 φ = 1 α 2 2 φ t 2 2 ψ i = 1 β 2 2 ψ i t 2 i = 1 , 2 , 3
in which
α = λ + 2 μ ρ β = μ ρ .
The obtained wave equations indicate that two types of disturbances with different velocities α and β can be propagated through an elastic solid. The first type of waves found, i.e., the expansion waves, are associated with displacements in a direction that is equal to the direction of propagation, consisting of compressions and rarefactions that only lead to volume changes. The second type, i.e., distortion waves, are associated with shifts perpendicular to the direction of propagation, consisting of distortions that involve only changes in shape: for this reason. The two types represent respectively longitudinal and transverse waves. Distortion waves are generally described by three functions, ψ i , which must be solutions of the equation just seen above.
Only two types of elastic waves can be propagated in an infinitely extended isotropic solid. In presence of a boundary surface, however, a third type of wave also occurs: the so called elastic surface waves, due to their rapidly decreasing effect with depth. In order to describe these waves, it is necessary to consider the propagation of a plane wave through an elastic solid with a boundary plane, which is free of tensions. For simplicity, let us consider that the boundary is located in the plane x y with the positive direction of the axis z facing the inner part of the solid, and assuming that the plane waves are traveling in the direction x . Since the displacements will therefore be independent of y it is possible to define two potential functions ϕ and ψ in the following way
u = ϕ x + ψ z and w = ϕ z ψ x .
Considering the displacements independent of y and using the expressions in (7), the equations of motion can be reduced to
ρ x ( 2 ϕ t 2 ) + ρ z ( 2 ψ t 2 ) = ( λ + μ ) x 2 ϕ + μ z 2 ψ ρ z ( 2 ϕ t 2 ) ρ x ( 2 ψ t 2 ) = ( λ + μ ) z 2 ϕ μ x 2 ψ
These two equations will be satisfied if
2 ϕ t 2 = [ λ + 2 μ ρ ] 2 ϕ = c 1 2 2 ϕ 2 ψ t 2 = [ μ ρ ] 2 ψ = c 2 2 2 ψ .
where c 1 and c 2 are the longitudinal and transverse waves velocities, respectively.
Considering a sine wave of frequency p 2 π that propagates in the direction x with velocity c and wavelength 2 π f so that c = p f , it is possible to find a solution for the equations (9) in the form
ϕ = F ( z ) exp [ i ( p t f x ) ] ψ = G ( z ) exp [ i ( p t f x ) ]
where i = 1 and F and G are functions that determine the way in which the wave amplitude changes with z .
By substituting the expression for ϕ in the differential equation of motion, the following expression is obtained
F ( z ) ( f 2 h 2 ) F ( z ) = 0
The general solution of Equation (11) corresponds to
F ( z ) = A exp ( q z ) + A exp ( q z )
where q 2 = f 2 h 2 . The second term in the equation is related to the disturbance that increases with increasing z , and, for the type of wave considered, A must be zero.
Similar results are obtained by substituting the function ψ in the differential equation of motion
G ( z ) ( f 2 k 2 ) G ( z ) = 0
with the general solution expressed in the form
G ( z ) = B exp ( s z )
where s 2 = f 2 k 2 . Hence the expressions (10) for ϕ and ψ become
ϕ = A   exp [ q z + i ( p t f x ) ] ψ = B exp [ s z + i ( p t f x ) ] .
Considering the boundary conditions, for which the stress components σ z z , σ z y and σ z x vanish at the surface where z = 0 , the following relations are obtained
A [ ( λ + 2 μ ) q 2 λ f 2 ] 2 B μ i s f = 0 2 i q f A + ( s 2 + f 2 ) B = 0
from which, by eliminating the ratio A B from Equation (16), squaring both sides and substituting for q and s the previous expressions, the following equation can be derived
16 μ 2 ( f 2 h 2 ) ( f 2 k 2 ) f 4 = [ ( λ + 2 μ ) h 2 + 2 μ f 2 ] 2 ( 2 f 2 k 2 ) 2
then simplified in the form
16 ( 1 h 2 f 2 ) ( 1 k 2 f 2 ) = [ 2 ( λ + 2 μ ) μ 1 h 2 f 2 ] 2 ( 2 k 2 f 2 ) 2 .
By placing the quantities h = p c 1 and k = p c 2 the expression h 2 k 2 = μ λ + 2 μ is obtained, and, through simple passages, it is demonstrated that such ratio can be expressed in terms of only the Poisson ratio ν
μ λ + 2 μ = 1 2 ν 2 2 ν = α 1 2
so that
h = α 1 k .
Thus, considering (20), Equation (18) becomes
16 ( 1 α 1 2 k 2 f 2 ) ( 1 k 2 f 2 ) = ( 2 k 2 f 2 ) 4 .
Including the new variable k 1 for k f , Equation (21) simplifies to
k 1 6 8 k 1 8 + ( 24 16 α 1 2 ) k 1 2 + ( 16 α 1 2 16 ) = 0 .
This expression represents a cubic in k 1 2 and, if the value of ν for the medium is known, the equation may be solved numerically. It should be noted that k 1 = k f = p f c 2 , where p f is the velocity of the surface waves, and c 2 is the velocity of the distortion waves; so k 1 gives the ratio between the velocity of the surface waves and the distortion waves. The velocity of propagation of the surface waves is independent of the frequency p 2 π and depends only on the elastic constants of the material. Therefore, in the formulation there is no dispersion of these waves: the surface plane waves have the characteristic of being able to travel without changing shape.
Using the relations between the Lamé and the engineering constants, that is Young modulus E and Poisson ratio ν , the following expressions of the wave propagation velocities are obtained
V P = E ( 1 ν ) ρ ( 1 + ν ) ( 1 2 ν )
V S = E 2 ρ ( 1 + ν ) = G ρ
V R = 0.87 + 1.12 ν 1 + ν E 2 ρ ( 1 + ν ) = 0.87 + 1.12 ν 1 + ν V S
from the relations
λ = ν E ( 1 + ν ) ( 1 + 2 ν ) μ = E 2 ( 1 + ν ) E = μ ( 3 λ + 2 μ ) λ + μ ν = λ 2 ( λ + μ ) .
Considering a half-space, a schematic illustration of the propagation of waves is reported in Figure 1. From the previous expressions the relation between the propagation velocity of elastic waves and the elastic parameters of the medium in which they propagate can be observed. In this way, by using the expressions (23), the properties of a solid in the case of elastic, homogeneous and isotropic medium can be derived.

3. Materials and Methods

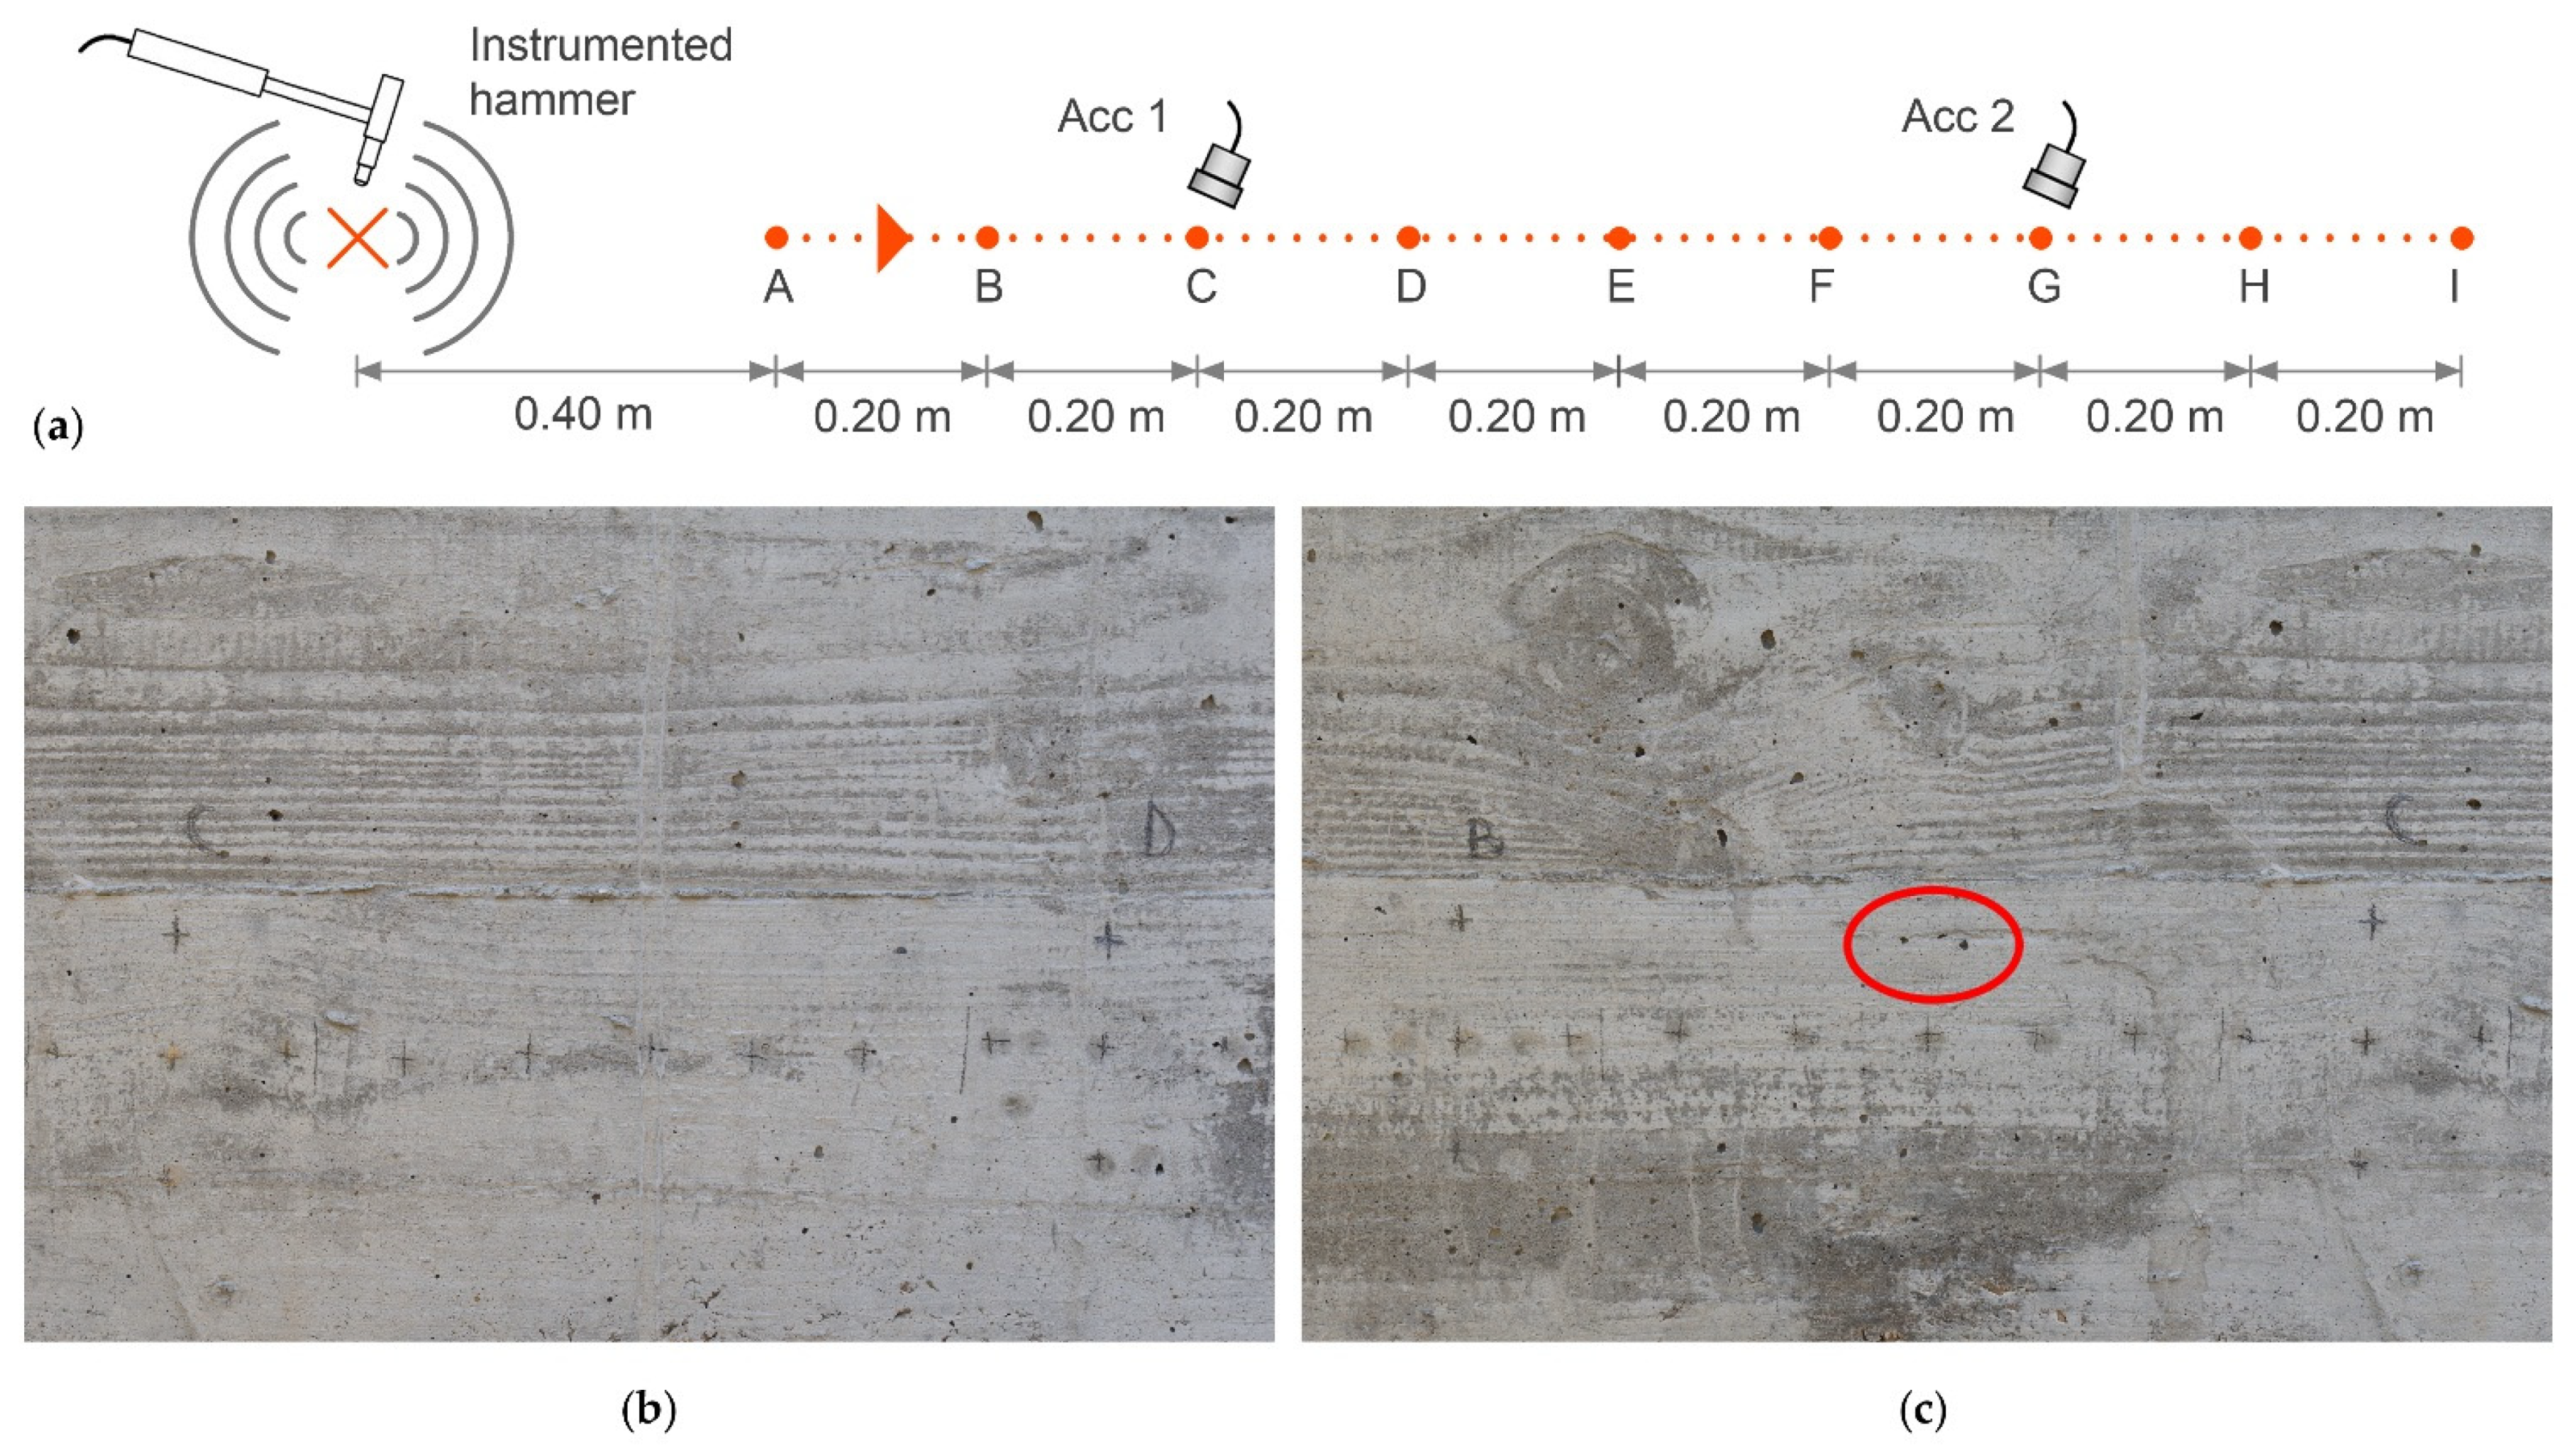
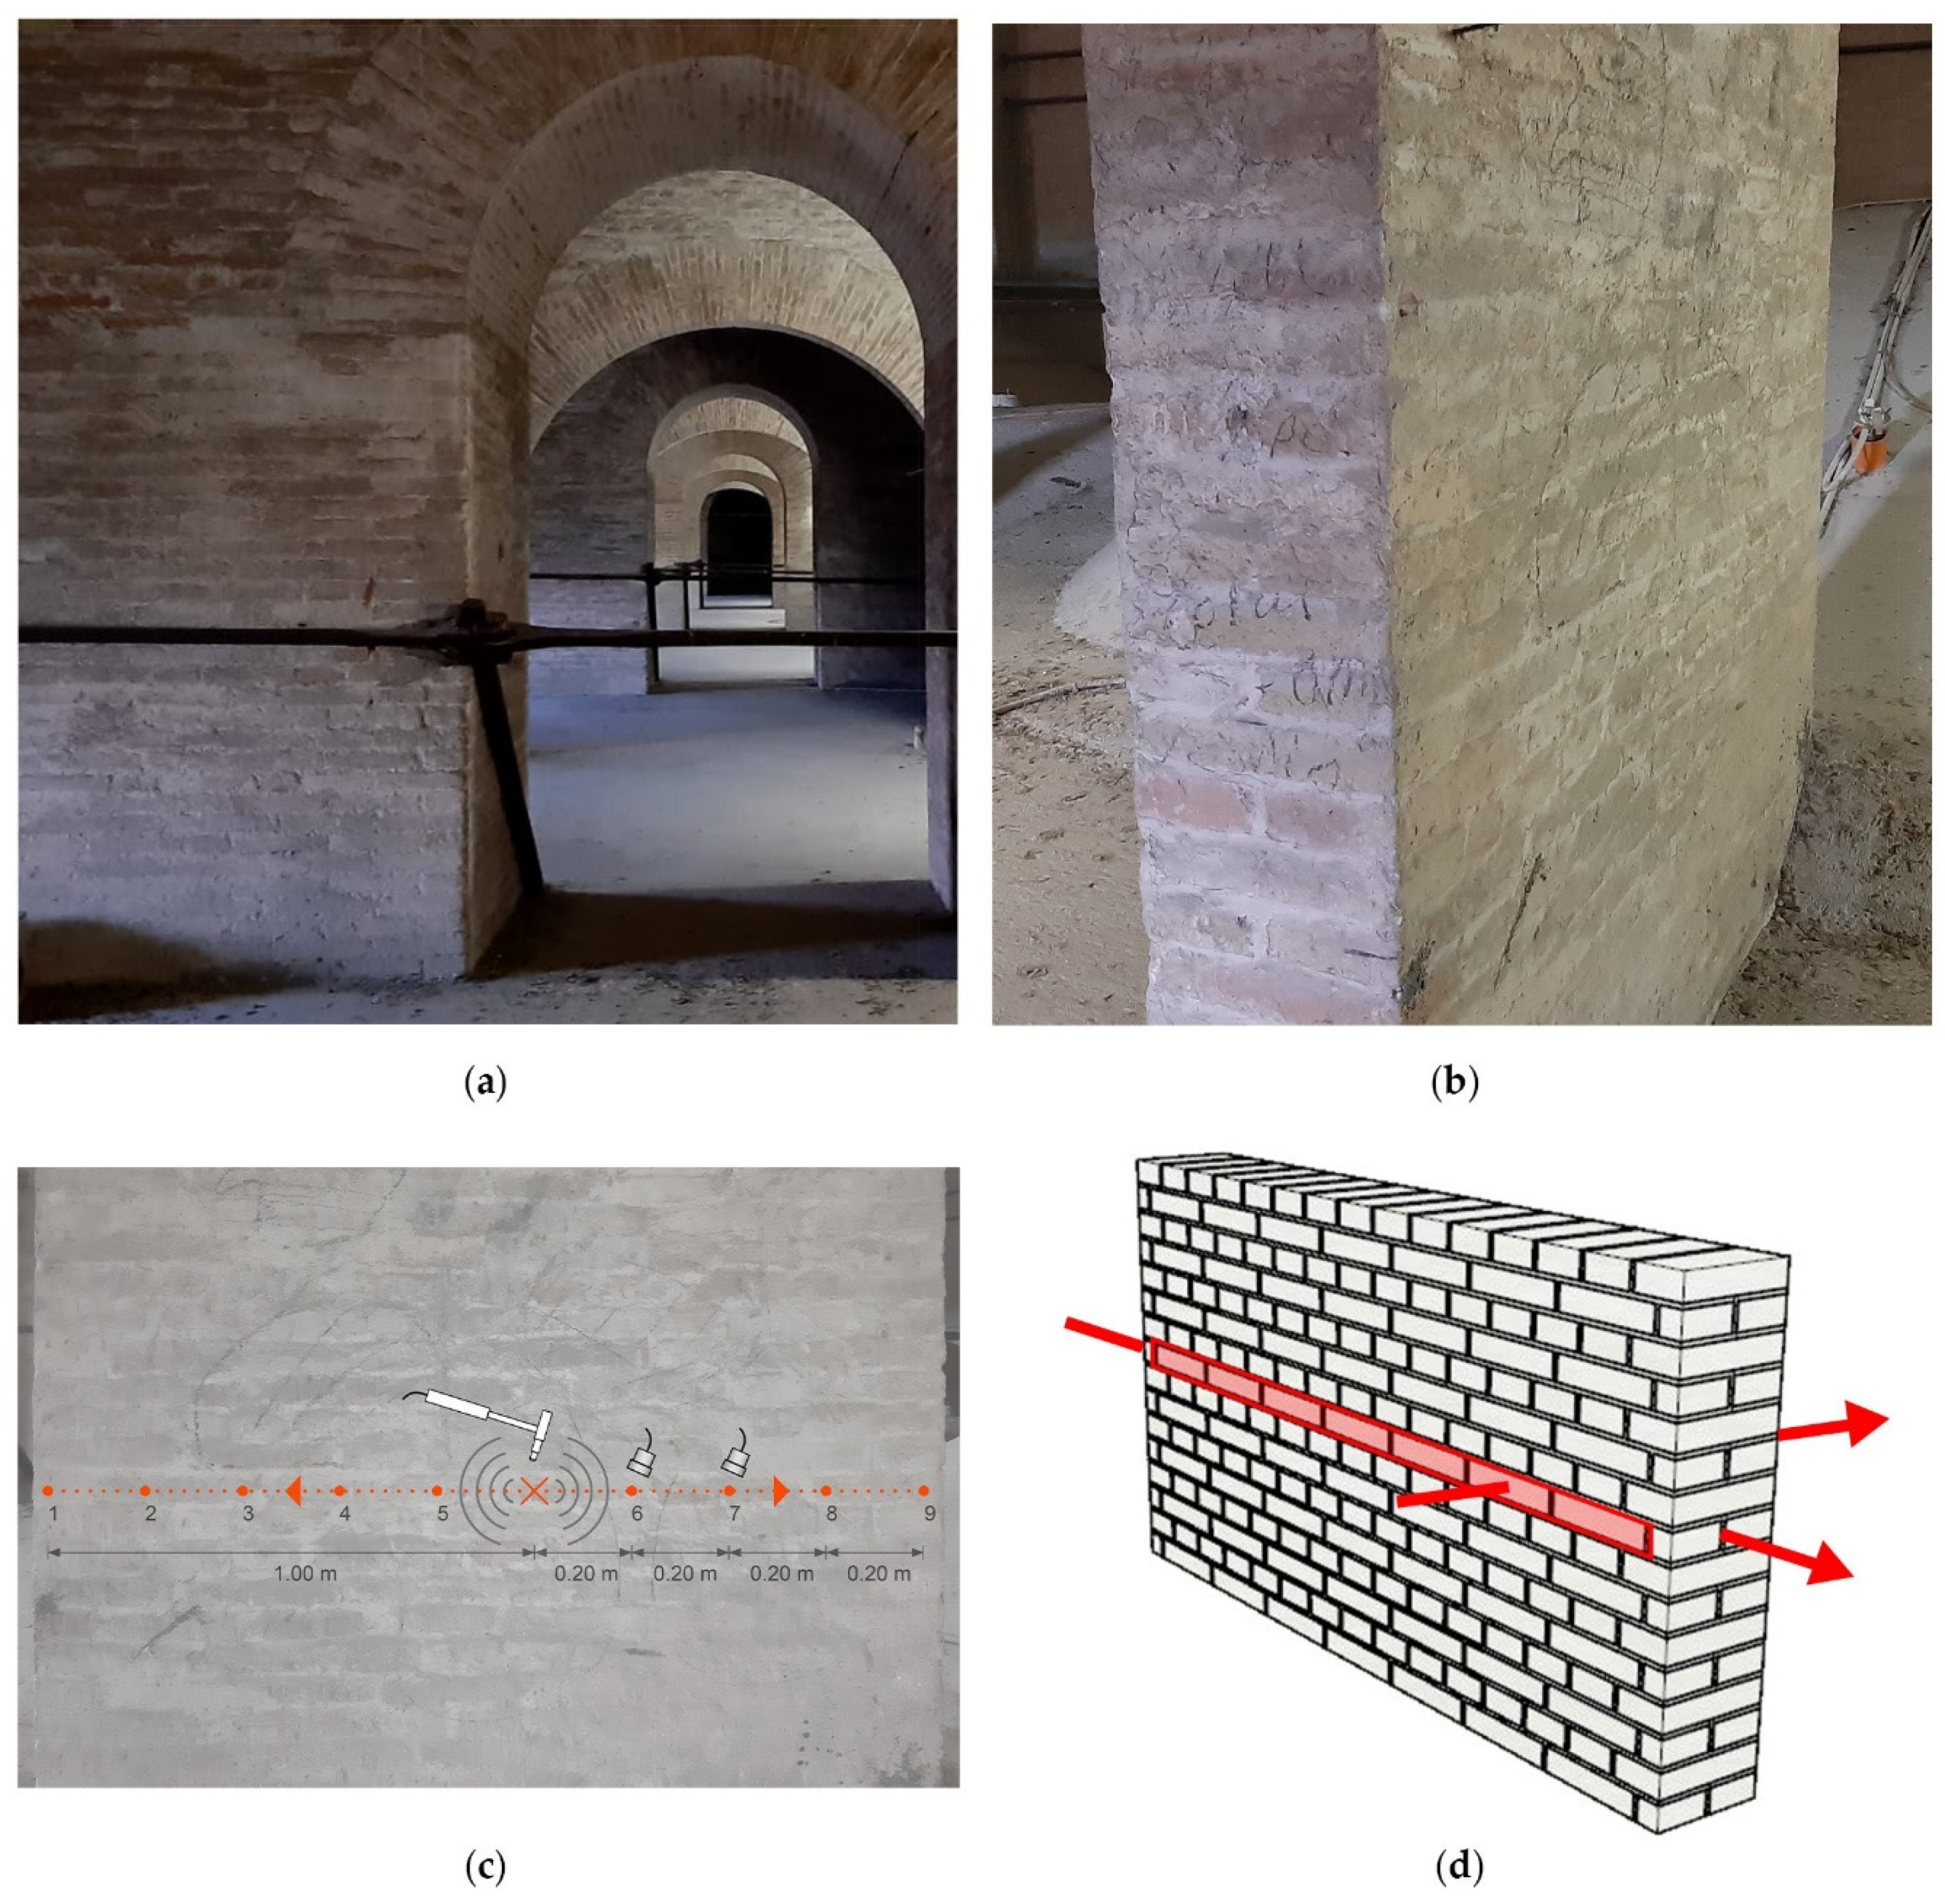
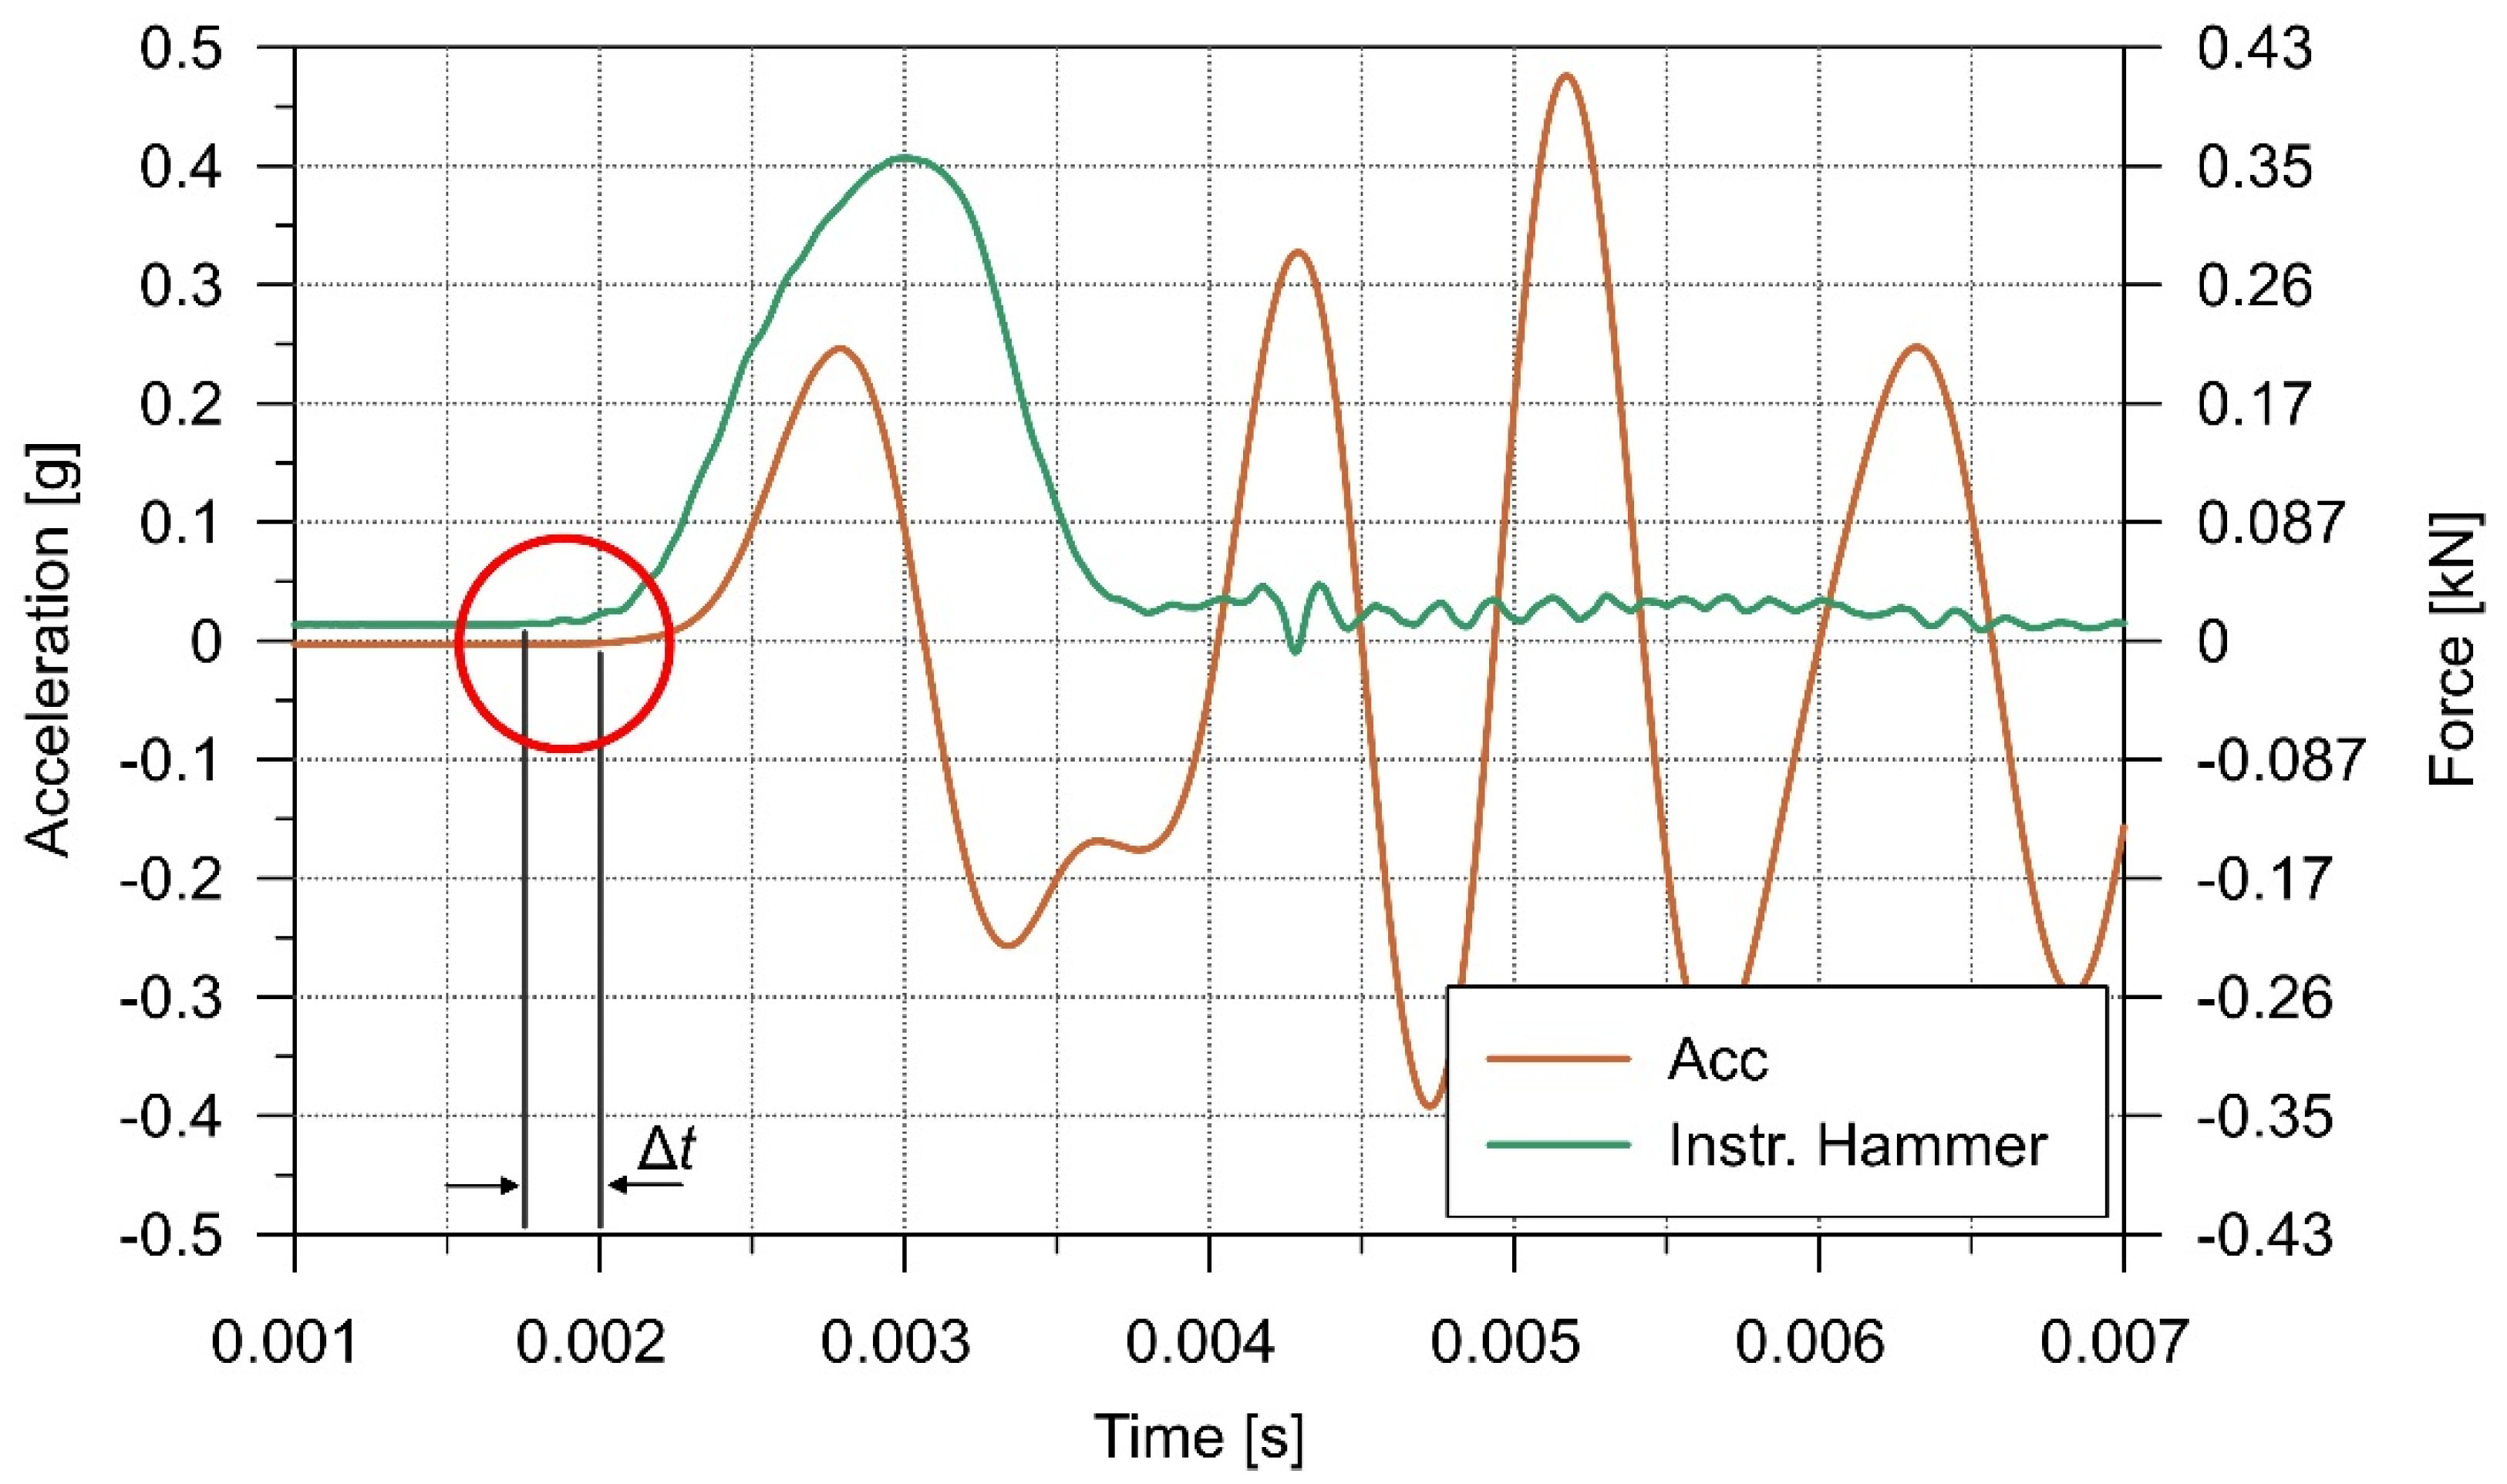
3.1. Experimental Setup and Test Procedure

The impact tests were performed to estimate the propagation velocity of the elastic waves on a grid of predefined points on the sample surface. The tests were carried out using an instrumented impact hammer (model PCB 086D20) for the application of impulsive force on the material surface (Figure 2a) equipped with a dynamic load cell for the digital acquisition of the time-amplitude signal of the impact force, and high-sensitivity uniaxial piezoelectric accelerometers (10 V/g of sensitivity, model PCB 393B12) for the acquisition of the surface vibration induced by the hammer impact (Figure 2b). The data were recorded through an acquisition system (model imc C-SERIES) with a sample rate of 100 kHz, in order to catch the high velocity of the elastic waves.
It should be noted that the propagation of the elastic waves in the material is strongly dependent on the physical and mechanical properties of the material crossed.
The purpose of the tests was to obtain an estimation of the elastic properties of the analyzed material by the calculation of the propagation velocity of the elastic waves through it. As explained in the previous Section, different types of elastic waves can be studied, i.e., volume (P waves) and surface waves (S and R waves). The P waves are analyzed by means of the so-called direct test, with the hammer hitting on the surface of the solid and one accelerometer receiving the wave, as material vibration, measured on a point of the opposite side of the solid. The velocity propagation is calculated as the ratio between the points distance and the time interval taken by the wave from the impact to the receiver. The S and R waves are analyzed through indirect tests, with the hammer hitting on the surface of the solid and two accelerometers receiving the surface waves on two different points aligned with the impact position. In this case the velocity propagation is calculated as the ratio between the distance of the two receivers and the time interval taken by the wave to cover the distance between them.
Following this approach, the tests allowed to estimate the elastic parameters of the medium starting by the assumption of homogeneous and isotropic properties. Working with heterogeneous materials, the procedure can be used to evaluate the elastic properties of the homogenized continuum if specific attention is paid to the microstructure dimensions and the distance on which the wave velocity is calculated.

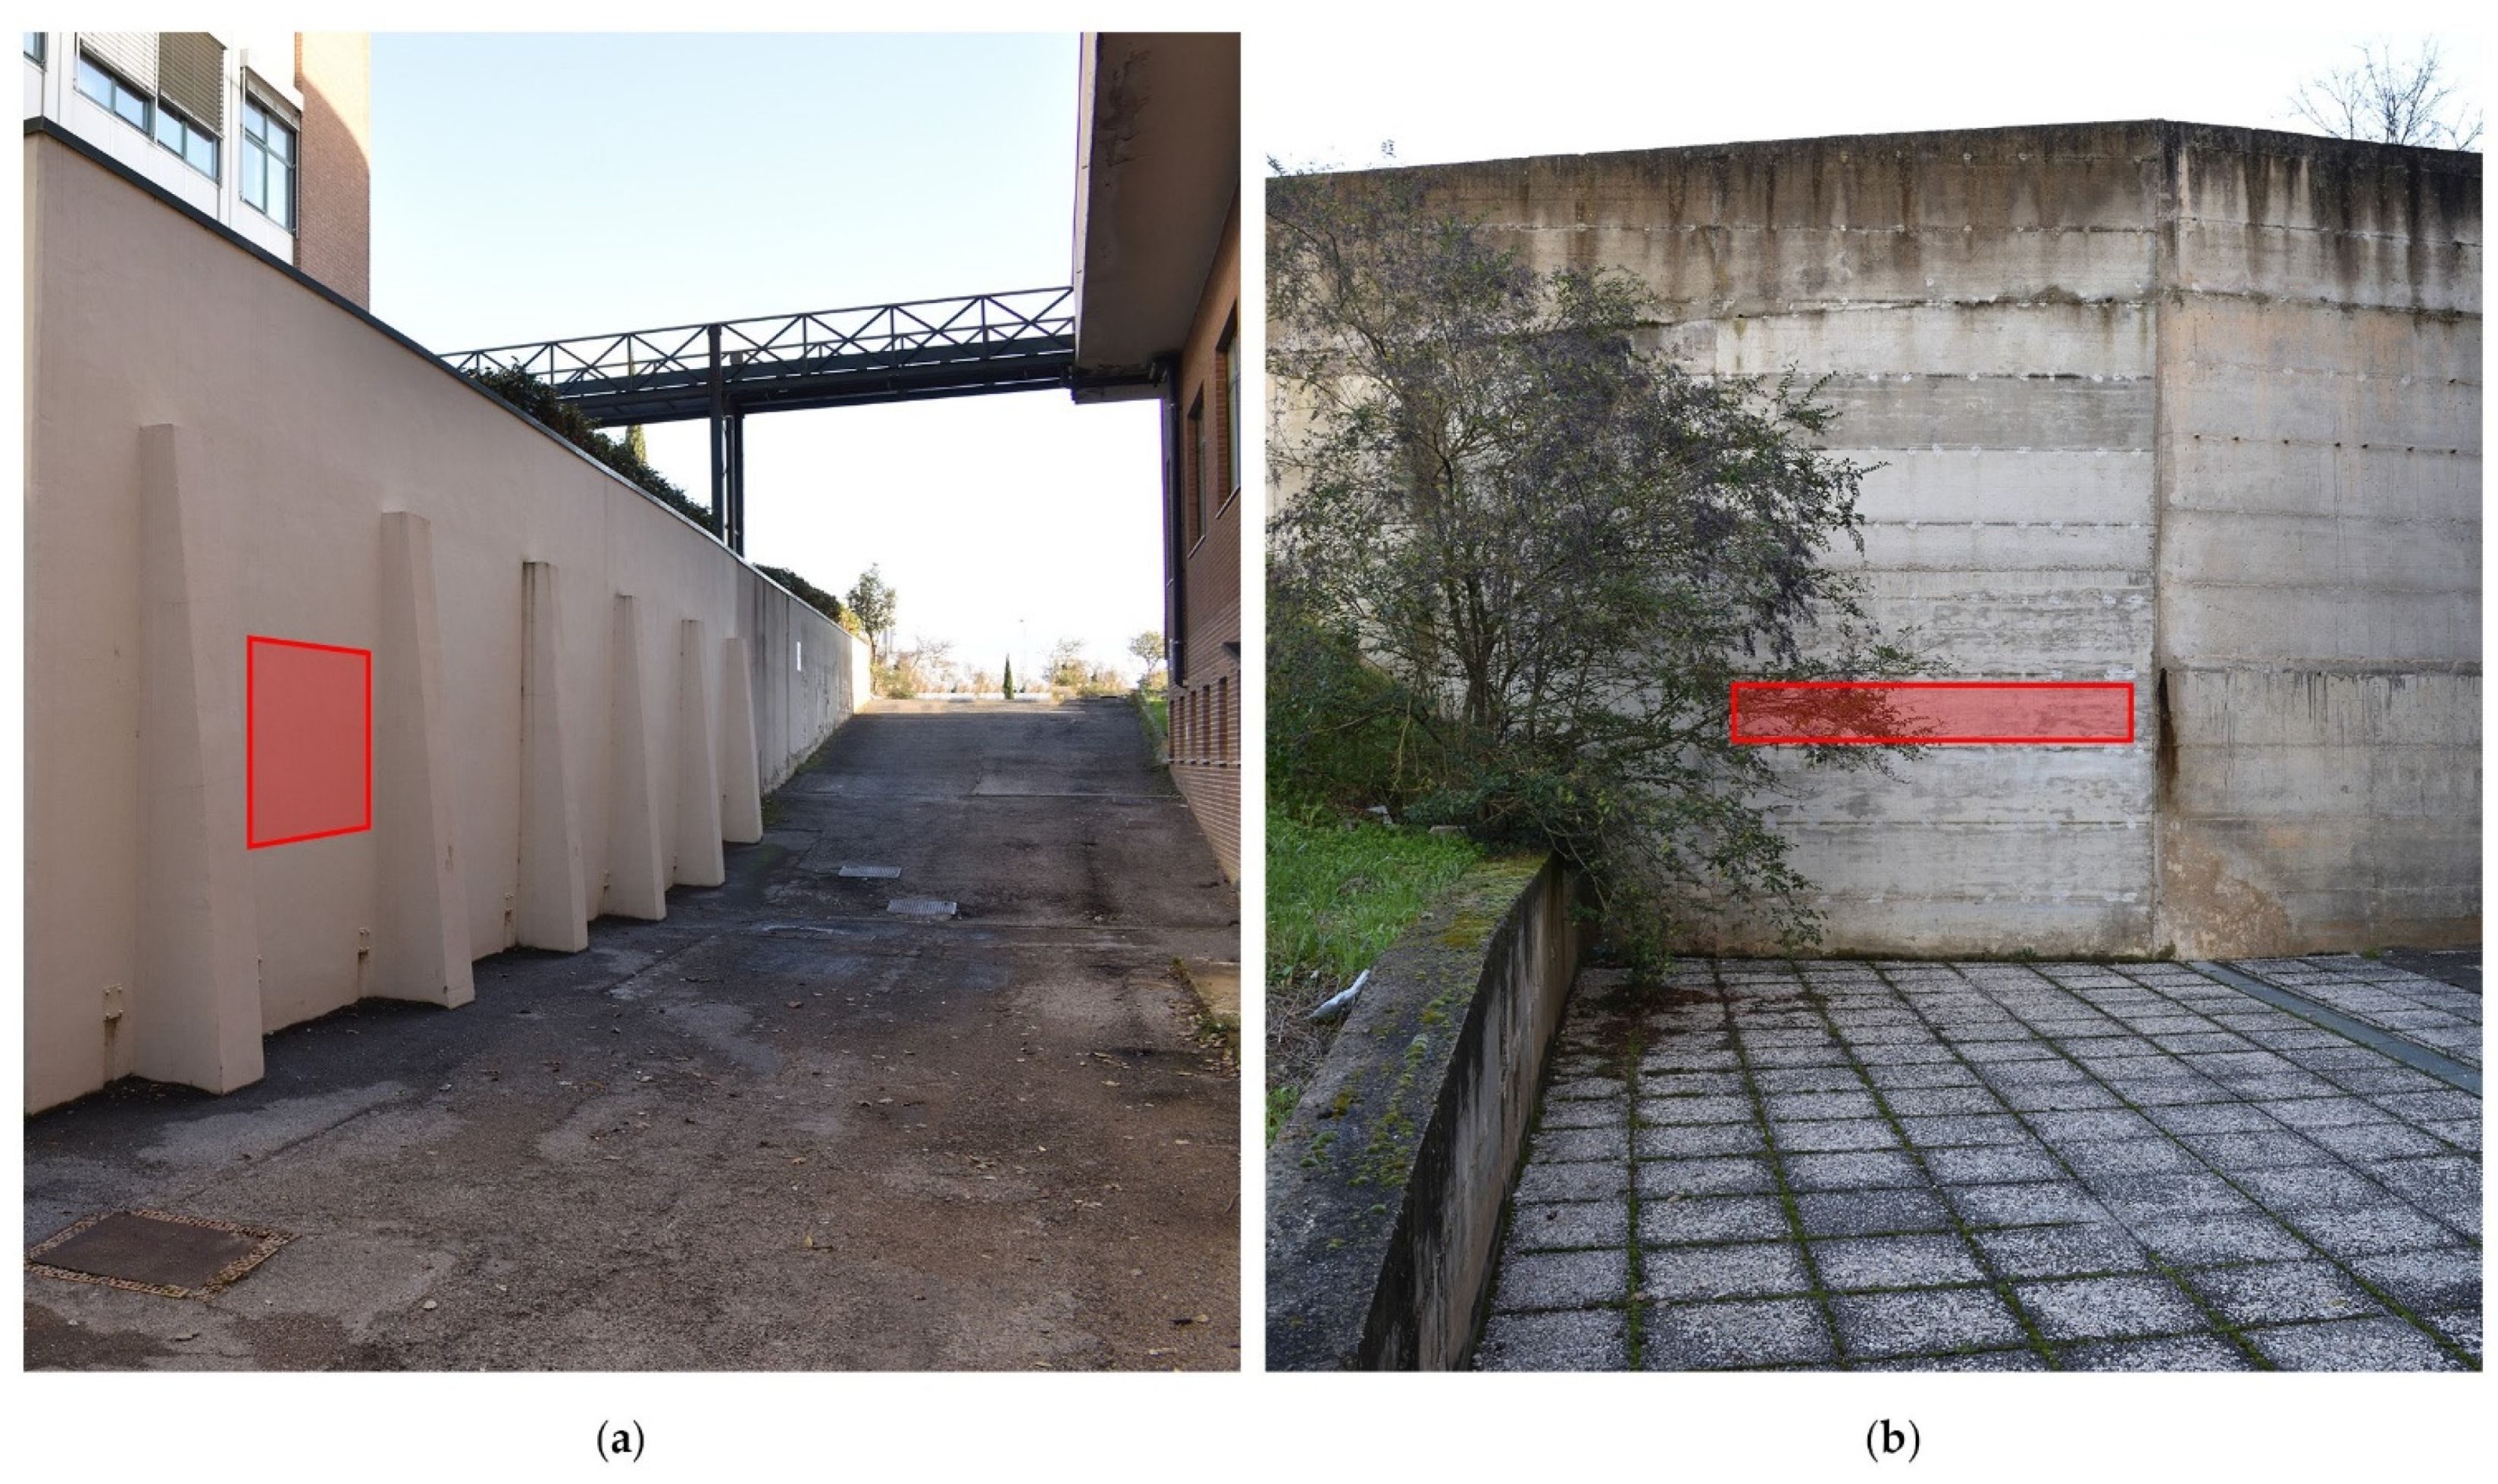
3.2. Preliminary Tests on Concrete Materials

In order to validate the experimental setup, preliminary tests were carried out on two reinforced concrete walls. Being concrete material constituted by a microstructure with a characteristic length generally smaller than the structural dimensions, the impact tests are considered as suitable for its mechanical characterization.
The tests were performed on restrained concrete walls sited in the Engineering Campus of the University of Perugia (Figure 3a,b). Given that the walls were only accessible from one side, the tests focused on the surface waves, i.e., R-waves. This preliminary study was carried out on two different walls (CLS1 and CLS2), characterized by different conditions of the superficial layer that was directly exposed to environmental actions: the first has a smoothed layer while the latter presents raw material also affected by different states of degradation.
In the absence of specific information regarding the physical and mechanical properties of concrete used and the thickness of the walls, any effect related to the geometry or to the presence of internal rebars is intended to be neglected in the expected results.
Regarding CLS1 wall, the tests were carried out by measuring the local accelerations induced by the passage of elastic waves at a distance of 0.4 and 0.6 m of the two accelerometers from the impact given by the hammer, both in horizontal and vertical directions. For each placement of the accelerometers couple, five hits and related waves were recorded. As an example, Figure 4 shows the typical signals obtained by the instrumented hammer (green line) and the two accelerometers. The blue line refers to the accelerometer closest to the source (Acc 1) and the orange line to the farthest (Acc 2). Owing to the small distance between the source and the receivers, the S-waves could not be detected, while the R-waves were clearly identified as indicated by the red circle. The time interval between the two peaks allowed to estimate the propagation velocity of the elastic wave.
Concerning the CLS2 wall, the presence of degraded areas on the surface required to carry out several measurements at different distances between both the source and the accelerometers and between the accelerometers, in order to achieve a more reliable estimation of the homogenized elastic parameters. In Figure 5a the layout of the ten measurement point positions is shown, while Figure 5b,c illustrates the details of the superficial irregularities characterizing the surface of the walls, in which the presence of holes and no smooth surface can be observed. Such a degradation state affected the estimation of the elastic parameters, as highlighted by the results. In particular, the maximum distance between the source and the accelerometers was 2.00 m, while the range of distances between the accelerometers was comprised between 0.20 and 1.60 m. As an example, the graph reported in Figure 6 is related to the data recorded by a couple of accelerometers 0.20 m apart and placed at a distance of 1.60 m between the source and the sensor Acc 1. The small distance between the measurement points determines a detection of a quite high propagation velocity of R-waves, which appears comparable with the measurements made on the CLS1 wall. On the other hand, the large distance between the impact point and the receiver allowed to make evidence of the contribution of the S-wave in the measurement points, as indicated by the red circle.
In Table 1 the outcomes of the experimental tests are summarized in terms of mean and standard deviation of R-waves propagation velocity, of their intervals related to a confidence level of 95% (obtained by using the t-distribution due to the small number of samples) and of the derived elastic modulus range of the material, obtained by the third expression of the system Equation (23)
E = 2   V R 2 ( 1 + ν ) 3 ρ ( 0.87 + 1.12 ν ) 2
in which V R is the R-waves propagation velocity, ν is the Poisson ratio and ρ the material density. Regarding the Poisson ratio and the material density, the values reported in Table 1 are taken from the literature in the absence of specific information. Figure 7 illustrates the convergence trend of the Young modulus mean values ( E ¯ ) and of the interval E ¯ ± Δ E derived by the confidence intervals of the R-wave velocities, with the increase in length of the distance between the measurement points. This aspect makes evidence of the effectiveness of the proposed methodology also for the elastic parameters estimation to be assigned to the equivalent homogenized continuum of a heterogeneous media.
The results highlight that in the case of CLS1, characterized by a material in a good condition and also confirmed by small values of σ V R in relation to a distance between the accelerometers of 0.20 m, the estimation of the elastic modulus can be considered in agreement with the values associated to a standard concrete class around C20/25 and C25/30. According to Eurocode standard [46], the elastic modulus of concrete can be estimated through the following formulation
E = 22 , 000 [ ( f c k + 8 10 ) 0.3 ]
being f c k the characteristic compressive strength expressed in MPa. The application of Equation (26) to C20/25 and C25/30 gives values of Young modulus equal to 29,962 MPa and 31,476 MPa, respectively.
On the other hand, the superficial degradation which characterizes the external layer of CLS2 determines an estimation of the elastic modulus lower than the standard expected values, in agreement with the visual inspections.

4. Estimation of Elastic Parameters on Masonry Panel

4.1. Experimental Tests Layout

In this Section the application of impact tests to estimate the elastic properties of a masonry panel is described. The analyzed masonry wall belongs to the Basilica of Santa Maria degli Angeli, a monumental structure located near Assisi, in central Italy (Figure 8) mainly made from brickwork material [47]. The masonry panel analyzed consists of a slender pillar (about 1.95 × 0.25 m) of a structural buttresses system above the vaults of the lateral aisles, with the function of withstanding the horizontal thrust and the inertial forces derived by the central nave (Figure 9a). The masonry is characterized by a regular pattern with bricks arranged on a double-leaf panel comprising headers and stretchers (Figure 9b). The generic block has dimensions of 25 × 12 × 5.5 cm and mortar joints with a thickness of about 1.1~1.3 cm. The sample was chosen as a typological element, in order to estimate the elastic parameters of the equivalent homogeneous media useful for reliable structural models.
Differently from the concrete case studies described in the previous section, it was possible to carry out both direct and indirect tests. The indirect tests were performed by positioning the accelerometers and the instrumented hammer on one side of the panel. The accelerometers were placed keeping the first in a fixed point, 20 cm apart from the impact point, and the second at a variable distance from the first, starting from a minimum of 20 cm to a maximum of 80 cm with constant steps of 20 cm (Figure 9c). More in detail, the impact point was placed at the center of the wall to avoid wave reflection effects, and the propagation velocity was detected both to the left and the right side of the impact point. As regards the direct tests, it was possible to perform two types of configurations: the first consisted of hitting the wall panel in the center of one of its short sides and measuring the propagated P-waves through its length, corresponding to 1.95 m, on the opposite side (Figure 8d); the second consisted of hitting the wall on one of its long sides to detect the wave in a point placed in the opposite side, evaluating the propagation within its thickness, corresponding to 25 cm in length (Figure 9d). In the second type of test, the hits were given in the same points indicated in the right and left directions, while the accelerometers were positioned precisely on the opposite side of the panel. Owing to the uncertainties of the materials and of the test procedure, also in this case, as for the tests carried out on the concrete walls, five hits were done in each position, to obtain more consistent samples.
The possibility of analyzing the waves propagation in different conditions, i.e., by using both direct and indirect tests, allowed for the estimation of more elastic parameters with respect to the case of concrete walls presented in the previous section. In fact, from the first and third expressions of the system Equation (23), it is possible to estimate both the elastic modulus E and the Poisson ratio ν of the equivalent isotropic elastic medium.

4.2. Analysis of the Results

The results derived by the indirect tests are summarized in Table 2, in which, as for the cases of concrete walls CLS1 and CLS2, the R-wave velocities obtained on several coupled positions of the accelerometers are reported, together with the statistical elaborations. The outcomes show values of the mean velocities that are quite stable for d 0.40   m owing to the periodicity of the texture. In fact, for d = 0.20   m the high value of standard deviation is due to the large range of measured velocities, characterized by lower values of about 300–400 m/s detected near the edges of the wall and maximum values higher than 900 m/s related to a couple of accelerometers placed on the same brick. Figure 10 shows typical signals recorded during the tests applied on the masonry panel. It should be noted as the time interval detected by the two accelerometers in which the passage of the R-wave occurs is greater in this type of material with respect to concrete.
The second type of test investigated the P-waves propagation through the length/thickness of the wall: as illustrated in Figure 9d, the impact points were fixed both in the shorter faces of the panel and in each numbered station of the larger face, as indicated in Figure 9c, with the related receiver accelerometer placed on the opposite side. The P-wave is the faster wave propagated in a solid and therefore the first signal on the recorded curve of the accelerometers gives information on this type of wave. In this test the distance of travel of the waves was the same for all hits and it was equal to 1.95 m for the greater side, and equal to 0.25 m for the test along the thickness. Figure 11 shows typical signals recorded during the tests, where the red circle indicates the instances in which the impact and the arrival of the P-wave were detected. Table 3 summarizes the results in terms of mean velocity of P-waves, standard deviation and range of velocities with a confidence interval of 95%. The results show consistent values of the mean velocity, but smaller distances determine a higher value of standard deviation, due to the heterogeneity and the uncertainties of the material.
As previously asserted, the knowledge of the values of velocity of R- and P-waves gives more information on the elastic parameters of the medium, through which they were propagated. On the assumption that the horizontal plane of the masonry panel analyzed behaves as an elastic, homogeneous and isotropic medium, it was possible to make a first estimation of the masonry elastic parameters, as reported in Table 4. It should be noted that such value is in a good agreement with the range values indicated by the Italian Standard Code for brickwork masonry in poor conditions, stated as 1200–1800 MPa [48].

5. Final Remarks

The aim of testing two materials of different properties, concrete and masonry material, was to show how the propagation of waves was influenced by the nature of the material crossed and clearly detected by means of impact tests. For the concrete a mean value of the propagation velocity four times bigger than the value of masonry was obtained.
When analyzing the results of the indirect tests carried out on the concrete walls, it was observed that the propagation velocity can be affected by several factors, due to the presence of surface irregularities and other kinds of uncertainties that characterize the superficial layer, and also related to the weathering of the material. In this context, the comparison between the results derived from two concrete walls characterized by different states of the external layer has highlighted the possibility of detecting the degradation state of concrete walls in poor conditions, as concerning the external layer.
In the case of the masonry panel, the values obtained are more consistent with the variation of the propagation direction, consisting of smaller values of standard deviations. With respect to the results obtained on concrete, this aspect is probably related to the good condition of the masonry material, both because of the quality of the constituents and their arrangement, and because of the absence of weathering effects. Moreover, the presence of a greater number of joints in some measurements did not significantly affect the results: as expected, due to the periodicity conditions, apart from in the case of distances lower than the length of a single block, the measured velocities were almost constant with the increase of the test window size. Finally, in this case, the possibility of carrying out direct and indirect tests allowed to estimate both the velocity of the P- and R-waves in different propagation directions, achieving a more accurate description of the masonry panel with respect to the case of concrete. In particular, it was possible to estimate both the Young modulus and the Poisson ratio directly from the experimental observations.

6. Conclusions

In the present work the problem of estimating the elastic properties of existing materials for the structural and/or architectural restoration of historic buildings has been addressed. In particular, the work is focused on the effectiveness of estimating the elastic properties of a masonry panel through the propagation study of elastic waves, considering impact tests as promising techniques for the characterization of masonry material, among the non-destructive methods widely used in the cultural heritage.
In the first part of the paper, considering a linear elastic, isotropic and homogeneous medium, the dynamic stress-deformation state of a generic point during the propagation of compression, transverse and surface waves, more commonly known as Rayleigh waves, was deepened, supported by a physical interpretation of the phenomenon.
In the second part, experimental tests were carried out on different materials in order to verify the effectiveness of impact tests in estimating the elastic parameters in heterogeneous materials, also in the presence of evident degradation processes. In particular, the tests were performed on two concrete walls, which can be considered as a quite homogeneous material, and on a masonry panel, a heterogeneous complex material. The results have shown that in the case of concrete walls, where only indirect tests were carried out, the irregularities and the weathering of the external layer significantly affected the results, giving potential information also on the degradation state of concrete on the base of the elastic modulus derived. In the case of the masonry panel, both the elastic modulus and Poisson ratio were estimated thanks to the possibility of performing direct and indirect tests. The applied methodology has led to extremely satisfactory results, in agreement with the values indicated in the scientific literature and standard codes. Further developments of the research will be devoted also to the comparison between the results obtained on undamaged and damaged states of the material, in order to quantify, where possible, the degradation state of a structural element or the strengthening level obtained after a restoration work.
Finally, it should be noted that the interesting results given by the impact tests allows to consider such a methodology as an efficient technique for the on-site investigation of even complex heterogeneous materials and, at the same time, as a practical application of the well-known homogenization techniques developed in the field random materials.

Author Contributions

Experimental setup, validation of results, discussion and all other parts of the paper: J.M., N.C. and V.G. All authors have read and agreed to the published version of the manuscript.

Funding

This research received no external funding.

Acknowledgments

Authors gratefully acknowledge the support received from the Italian Ministry of University and Research, through the PRIN 2017 funding scheme (Prot. 2017HFPKZY—Modelling of constitutive laws for traditional and innovative building materials). Moreover the financial support from the Italian Ministry of University and Research (MUR) in the framework of the Project FISR 2019: “Eco Earth” (code 00245) is gratefully acknowledged.

Conflicts of Interest

The authors declare no conflict of interest.

References

  1. Cavalagli, N.; Kita, A.; Castaldo, V.L.; Pisello, A.L.; Ubertini, F. Hierarchical environmental risk mapping of material degradation in historic masonry buildings: An integrated approach considering climate change and structural damage. Constr. Build. Mater. 2019, 215, 998–1014. [Google Scholar] [CrossRef]
  2. Hao, L.; Herrera-Avellanosa, D.; Del Pero, C.; Troi, A. What are the implications of climate change for retrofitted historic buildings? A literature review. Sustainability 2020, 12, 7557. [Google Scholar] [CrossRef]
  3. Sesana, E.; Gagnon, A.S.; Ciantelli, C.; Cassar, J.; Hughes, J.J. Climate change impacts on cultural heritage: A literature review. Wiley Interdiscip. Rev. Clim. Chang. 2021, 12, e710. [Google Scholar] [CrossRef]
  4. Livingston, R.A. Nondestructive Testing of Historic Structures. Arch. Mus. Inform. 1999, 13, 249–271. [Google Scholar] [CrossRef]
  5. Bosiljkov, V.; Uranjek, M.; Žarnić, R.; Bokan-Bosiljkov, V. An integrated diagnostic approach for the assessment of historic masonry structures. J. Cult. Herit. 2010, 11, 239–249. [Google Scholar] [CrossRef]
  6. Uranjek, M.; Bosiljkov, V.; Žarnić, R.; Bokan-Bosiljkov, V. In situ tests and seismic assessment of a stone-masonry building. Mater. Struct. Mater. Constr. 2012, 45, 861–879. [Google Scholar] [CrossRef]
  7. Gil, E.; Mas, A.; Lerma, C.; Torner, M.E.; Vercher, J. Non-destructive Techniques Methodologies for the Detection of Ancient Structures under Heritage Buildings. Int. J. Archit. Herit. 2021, 15, 1457–1473. [Google Scholar] [CrossRef]
  8. Milani, G.; Esquivel, Y.W.; Lourenço, P.B.; Riveiro, B.; Oliveira, D.V. Characterization of the response of quasi-periodic masonry: Geometrical investigation, homogenization and application to the Guimarães castle, Portugal. Eng. Struct. 2013, 56, 621–641. [Google Scholar] [CrossRef] [Green Version]
  9. Jasiński, R.; Drobiec, Ł.; Mazur, W. Validation of Selected non-destructive methods for determining the compressive strength of masonry units made of autoclaved aerated concrete. Materials 2019, 12, 389. [Google Scholar] [CrossRef] [Green Version]
  10. Sánchez-Aparicio, L.J.; Bautista-De Castro, Á.; Conde, B.; Carrasco, P.; Ramos, L.F. Non-destructive means and methods for structural diagnosis of masonry arch bridges. Autom. Constr. 2019, 104, 360–382. [Google Scholar] [CrossRef]
  11. Biscarini, C.; Catapano, I.; Cavalagli, N.; Ludeno, G.; Pepe, F.A.; Ubertini, F. UAV photogrammetry, infrared thermography and GPR for enhancing structural and material degradation evaluation of the Roman masonry bridge of Ponte Lucano in Italy. NDT E Int. 2020, 115, 102287. [Google Scholar] [CrossRef]
  12. Curulli, A.; Montesperelli, G.; Ronca, S.; Cavalagli, N.; Ubertini, F.; Padeletti, G.; Vecchio Ciprioti, S. A multidisciplinary approach to the mortars characterization from the Town Walls of Gubbio (Perugia, Italy). J. Therm. Anal. Calorim. 2020, 142, 1721–1737. [Google Scholar] [CrossRef]
  13. Gusella, V.; Cluni, F.; Liberotti, R. Feasibility of a thermography nondestructive technique for determining the quality of historical frescoed masonries: Applications on the templar church of San Bevignate. Appl. Sci. 2021, 11, 281. [Google Scholar] [CrossRef]
  14. Jasiński, R.; Stebel, K.; Kielan, P. Use of the AE effect to determine the stresses state in AAC masonry walls under compression. Materials 2021, 14, 3459. [Google Scholar] [CrossRef]
  15. Pepi, C.; Cavalagli, N.; Gusella, V.; Gioffrè, M. An integrated approach for the numerical modeling of severely damaged historic structures: Application to a masonry bridge. Adv. Eng. Softw. 2021, 151, 102935. [Google Scholar] [CrossRef]
  16. Qixian, L.; Bungey, J.H. Using compression wave ultrasonic transducers to measure the velocity of surface waves and hence determine dynamic modulus of elasticity for concrete. Constr. Build. Mater. 1996, 10, 237–242. [Google Scholar] [CrossRef]
  17. Carino, N.J. The Impact-Echo Method: An Overview. In Proceedings of the World Structural Engineering Congress, ASCE NIST, Gaithersburg, MD, USA, 21–23 May 2001. [Google Scholar]
  18. Sansalone, M.; Carino, N.J. Impact-Echo: A Method for Flaw Detection in Concrete Using Transient Stress Waves, NBSIR 86-3452; US Department of Commerce, National Bureau of Standards, Center for Building Technology, Structures Division: Springfield, VA, USA, 1986. [Google Scholar]
  19. Song, F.; Huang, G.L.; Kim, J.H.; Haran, S. On the study of surface wave propagation in concrete structures using a piezoelectric actuator/sensor system. Smart Mater. Struct. 2008, 17, 055024. [Google Scholar] [CrossRef]
  20. Chalioris, C.E.; Papadopoulos, N.A.; Angeli, G.M.; Karayannis, C.G.; Liolios, A.A.; Providakis, C.P. Damage Evaluation in Shear-Critical Reinforced Concrete Beam using Piezoelectric Transducers as Smart Aggregates. Open Eng. 2015, 5, 373–384. [Google Scholar] [CrossRef]
  21. Karayannis, C.G.; Voutetaki, M.E.; Chalioris, C.E.; Providakis, C.P.; Angeli, G.M. Detection of flexural damage stages for RC beams using Piezoelectric sensors (PZT). Smart Struct. Syst. 2015, 15, 997–1018. [Google Scholar] [CrossRef]
  22. Park, J.Y.; Yoon, Y.G.; Oh, T.K. Prediction of concrete strength with P-, S-, R-wave velocities by support vector machine (SVM) and artificial neural network (ANN). Appl. Sci. 2019, 9, 4053. [Google Scholar] [CrossRef] [Green Version]
  23. Grazzini, A. Sonic and Impact Test for Structural Assessment of Historical Masonry. Appl. Sci. 2019, 9, 5148. [Google Scholar] [CrossRef] [Green Version]
  24. Luchin, G.; Ramos, L.F.; D’Amato, M. Sonic Tomography for Masonry Walls Characterization. Int. J. Archit. Herit. 2020, 14, 589–604. [Google Scholar] [CrossRef]
  25. Cascante, G.; Najjaran, H.; Crespi, P. Novel Methodology for Nondestructive Evaluation of Brick Walls: Fuzzy Logic Analysis of MASW Tests. J. Infrastruct. Syst. 2008, 14, 117–128. [Google Scholar] [CrossRef]
  26. Miranda, L.; Cantini, L.; Guedes, J.; Binda, L.; Costa, A. Applications of Sonic Tests to Masonry Elements: Influence of Joints on the Propagation Velocity of Elastic Waves. J. Mater. Civ. Eng. 2013, 25, 667–682. [Google Scholar] [CrossRef]
  27. Miranda, L.; Cantini, L.; Guedes, J.; Costa, A. Assessment of mechanical properties of full-scale masonry panels through sonic methods. Comparison with mechanical destructive tests. Struct. Control Heal. Monit. 2016, 23, 503–516. [Google Scholar] [CrossRef]
  28. Verstrynge, E.; Lacidogna, G.; Accornero, F.; Tomor, A. A review on acoustic emission monitoring for damage detection in masonry structures. Constr. Build. Mater. 2021, 268, 121089. [Google Scholar] [CrossRef]
  29. Lacidogna, G.; Manuello, A.; Niccolini, G.; Carpinteri, A. Acoustic emission monitoring of Italian historical buildings and the case study of the Athena temple in Syracuse. Archit. Sci. Rev. 2015, 58, 290–299. [Google Scholar] [CrossRef]
  30. Manning, E.; Ramos, L.F.; Fernandes, F.M. Direct Sonic and Ultrasonic Wave Velocity in Masonry under Compressive Stress. In Proceedings of the 9th International Masonry Conference, Guimarães, Portugal, 7–9 July 2014. [Google Scholar]
  31. Valluzzi, M.R.; Cescatti, E.; Cardani, G.; Cantini, L.; Zanzi, L.; Colla, C.; Casarin, F. Calibration of sonic pulse velocity tests for detection of variable conditions in masonry walls. Constr. Build. Mater. 2018, 192, 272–286. [Google Scholar] [CrossRef]
  32. Mesquita, E.; Martini, R.; Alves, A.; Antunes, P.; Varum, H. Non-destructive characterization of ancient clay brick walls by indirect ultrasonic measurements. J. Build. Eng. 2018, 19, 172–180. [Google Scholar] [CrossRef]
  33. Mesquita, E.; Martini, R.; Alves, A.; Mota, L.; Rubens, T.; Antunes, P.; Varum, H. Heterogeneity detection of Portuguese–Brazilian masonries through ultrasonic velocities measurements. J. Civ. Struct. Health Monit. 2018, 8, 847–856. [Google Scholar] [CrossRef]
  34. Šejnoha, J.; Šejnoha, M.; Zeman, J.; Sýkora, J.; Vorel, J. Mesoscopic study on historic masonry. Struct. Eng. Mech. 2008, 30, 99–117. [Google Scholar] [CrossRef]
  35. Lombardo, M.; Zeman, J.; Šejnoha, M.; Falsone, G. Stochastic modeling of chaotic masonry via mesostructural characterization. Int. J. Multiscale Comput. Eng. 2009, 7, 171–185. [Google Scholar]
  36. Cavalagli, N.; Cluni, F.; Gusella, V. Evaluation of a Statistically Equivalent Periodic Unit Cell for a quasi-periodic masonry. Int. J. Solids Struct. 2013, 50, 4226–4240. [Google Scholar] [CrossRef] [Green Version]
  37. Cavalagli, N.; Cluni, F.; Gusella, V. Failure surface of quasi-periodic masonry by means of Statistically Equivalent Periodic Unit Cell approach. Meccanica 2018, 53, 1719–1736. [Google Scholar] [CrossRef] [Green Version]
  38. Cluni, F.; Gusella, V.; Vinti, G. Masonry elastic characteristics assessment by thermographic images. Meccanica 2019, 54, 1339–1349. [Google Scholar] [CrossRef] [Green Version]
  39. Tiberti, S.; Milani, G. 2D pixel homogenized limit analysis of non-periodic masonry walls. Comput. Struct. 2019, 219, 16–57. [Google Scholar] [CrossRef]
  40. Cluni, F.; Costarelli, D.; Gusella, V.; Vinti, G. Reliability increase of masonry characteristics estimation by a sampling algorithm applied to thermographic digital images. Probabilistic Eng. Mech. 2020, 60, 103022. [Google Scholar] [CrossRef]
  41. Tiberti, S.; Milani, G. 3D voxel homogenized limit analysis of single-leaf non-periodic masonry. Comput. Struct. 2020, 229, 106186. [Google Scholar] [CrossRef]
  42. Krejčí, T.; Koudelka, T.; Bernardo, V.; Šejnoha, M. Effective elastic and fracture properties of regular and irregular masonry from nonlinear homogenization. Comput. Struct. 2021, 254, 106580. [Google Scholar] [CrossRef]
  43. Kolsky, H. Stress Waves in Solids, 1st ed.; Oxford University Press: Oxford, UK, 1953. [Google Scholar]
  44. Ewing, W.M.; Jardetzky, W.S.; Press, F. Elastic Waves in Layered Media, 1st ed.; McGraw-Hill: New York, NY, USA, 1957. [Google Scholar]
  45. Viktorov, I.A. Rayleigh and Lamb Waves: Physical Theory and Applications; Plenum Press: New York, NY, USA, 1967. [Google Scholar]
  46. EN 1992-1-1 (2004): Eurocode 2: Design of Concrete Structures—Part 1-1: General Rules and Rules for Buildings; European Committee for Standardization, CEN-CENELEC Management Centre: Brussels, Belgium, 2004.
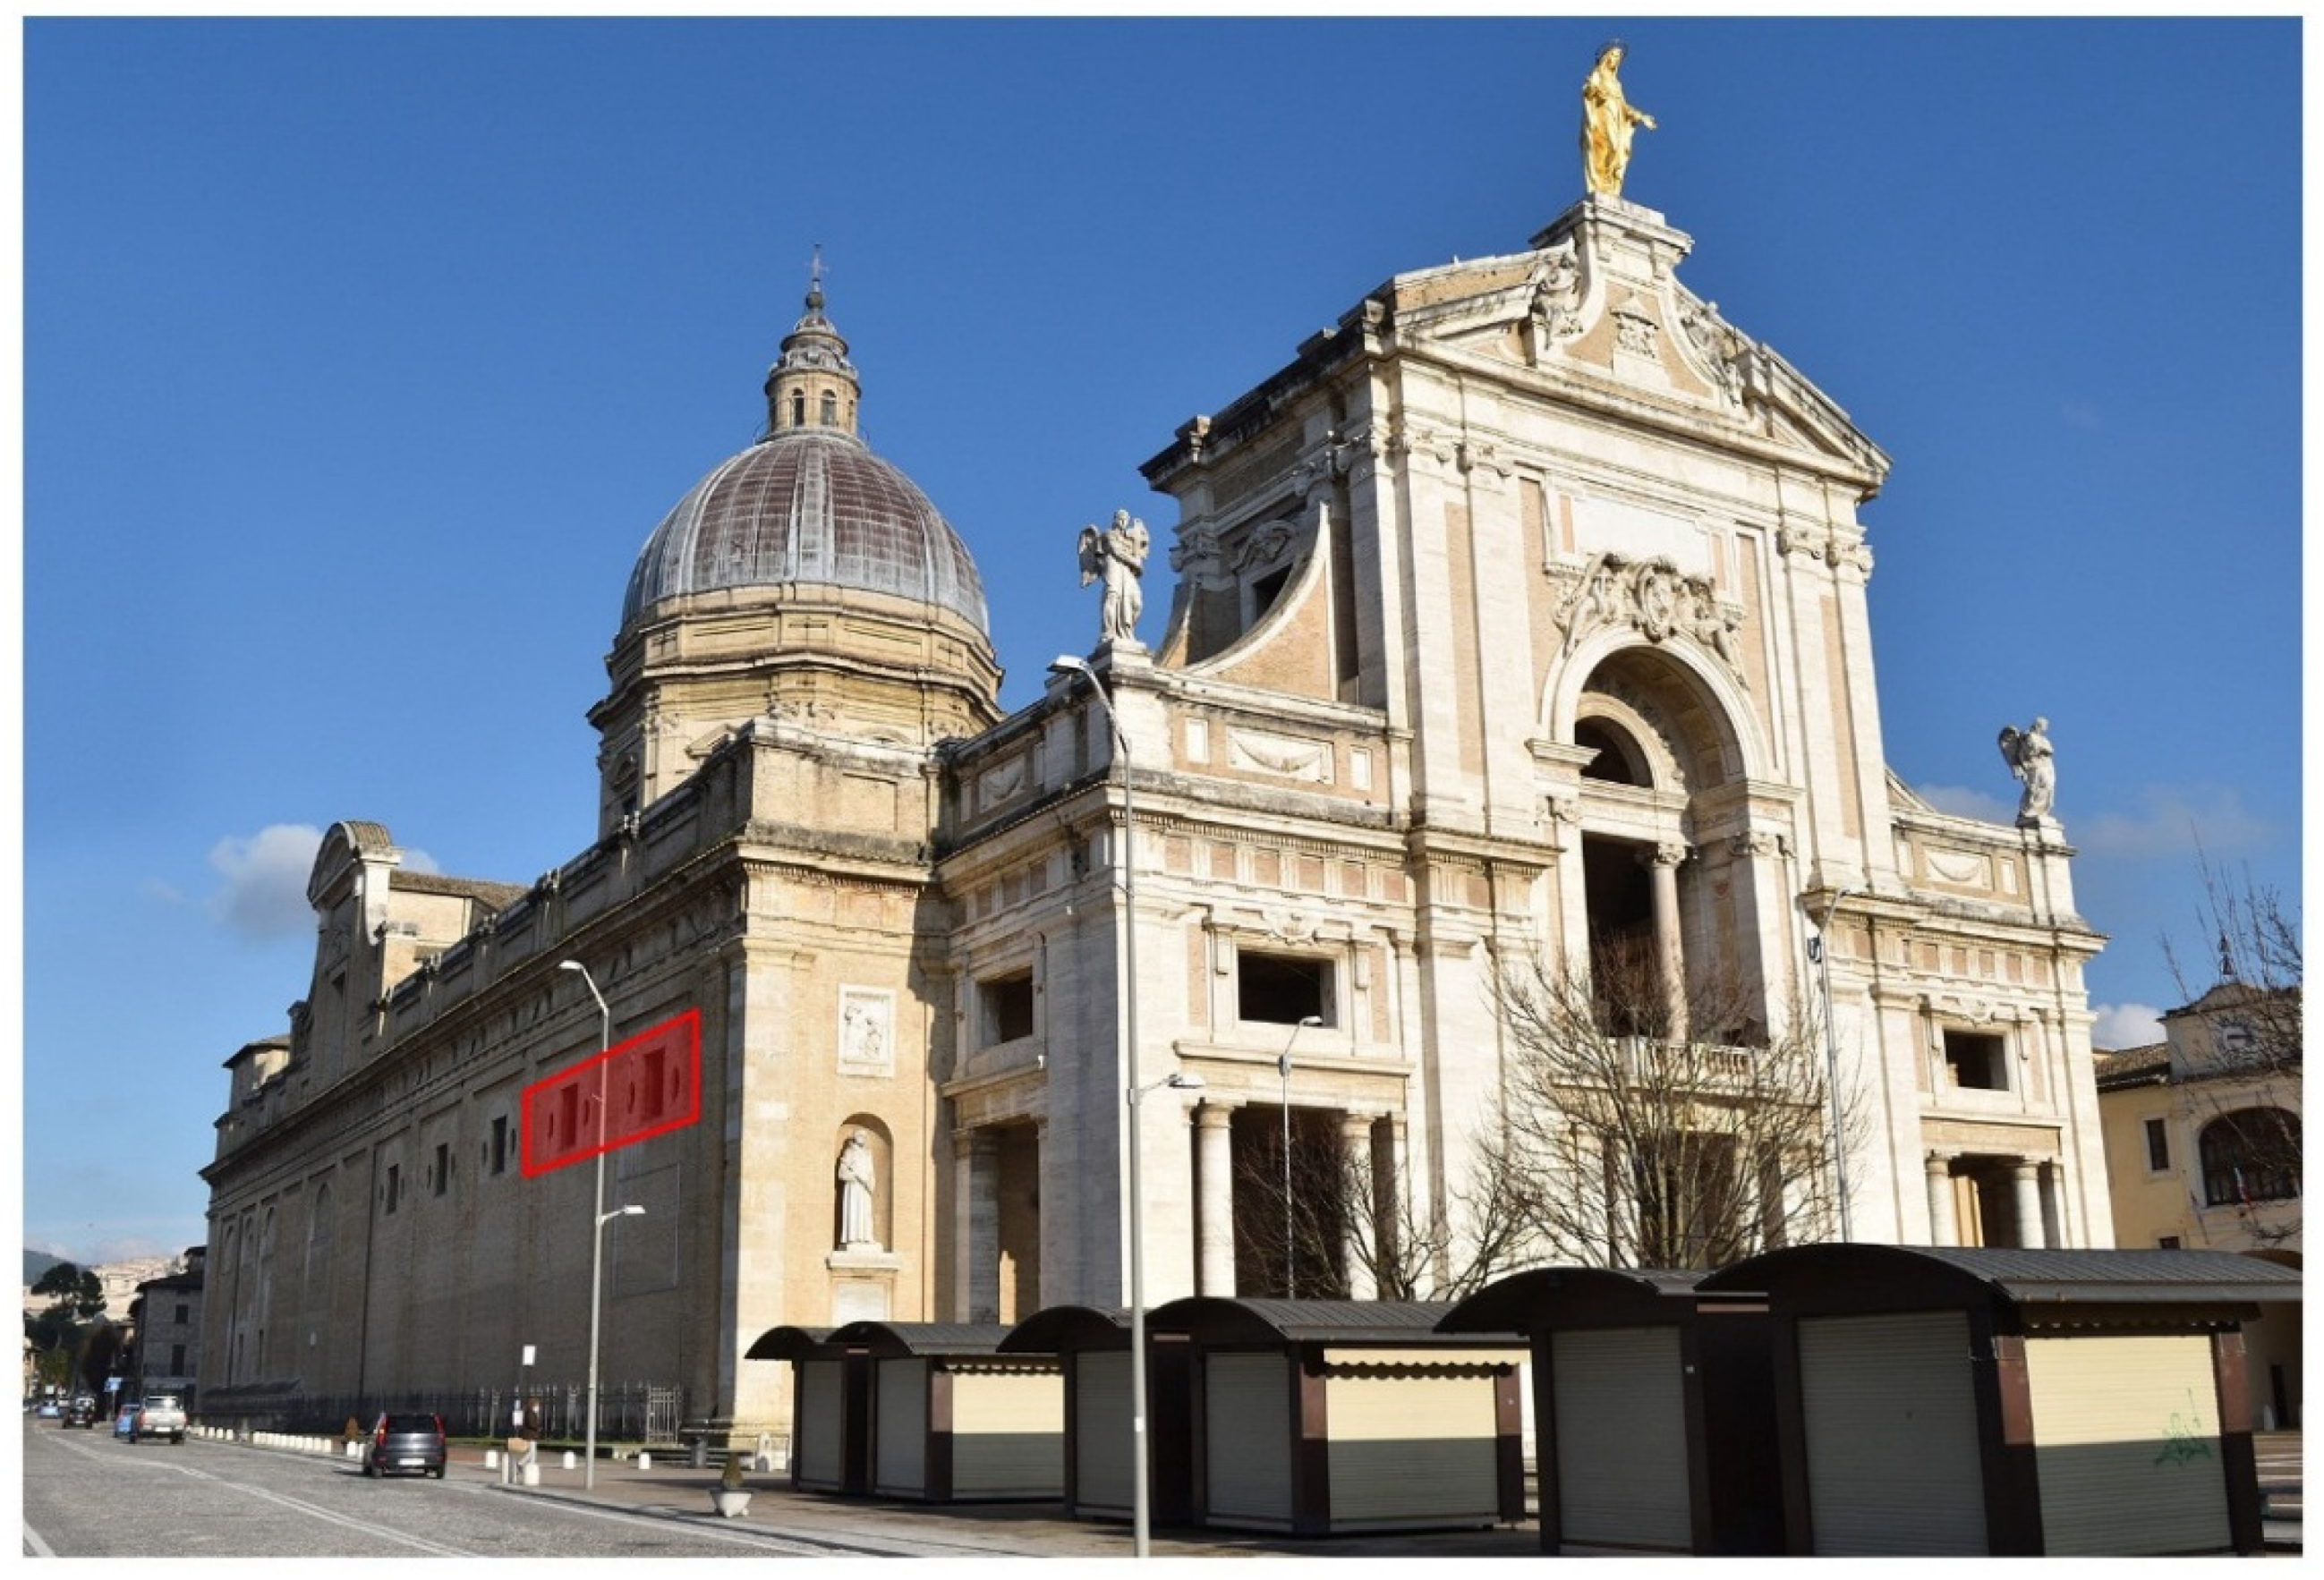
  47. Cavalagli, N.; Gusella, V. Dome of the Basilica of Santa Maria degli Angeli in Assisi: Static and dynamic assessment. Int. J. Archit. Herit. 2015, 9, 157–175. [Google Scholar] [CrossRef]
  48. Italian Ministery of Infrastructure and Transport. Istruzioni per L′applicazione Dell′«Aggiornamento Delle “Norme Tecniche per le Costruzioni”» di cui al Decreto Ministeriale 17 Gennaio 2018. CIRCOLARE 21 Gennaio 2019, n. 7 C.S.LL.PP, (GU n.35 del 11-2-2019-Suppl. Ordinario n. 5); Istituto Poligrafico e Zecca dello Stato: Roma, Italy, 2019. [Google Scholar]
Figure 1. Schematic illustration of wave propagation in a half-space.
Applsci 11 09091 g001
Figure 2. (a) Instrumented hammer PCB 086D20 with head bolt. (b) High-sensitivity piezoelectric uniaxial accelerometers PCB 393B12 used in the tests. (c) Data acquisition system. (d) General view of the experimental setup.
Applsci 11 09091 g002
Figure 3. Tested concrete walls: (a) CLS1 wall with a homogeneous superficial layer of the material; (b) CLS2 wall with raw concrete material characterized by an evident state of degradation.
Applsci 11 09091 g003
Figure 4. Typical values recorded by the accelerometers in the tests on the wall CLS 1. One of the points taken as a reference for the passage of R-waves is highlighted in the graph. The distance between the point of impact and the registration point is 20 cm.
Applsci 11 09091 g004
Figure 5. (a) The layout of the ten measurement point positions; (b) Portion of the tested concrete wall with no imperfections in the way of propagation of the R-wave; (c) Portion of the wall with some imperfections precisely in the way of waves propagation.
Applsci 11 09091 g005
Figure 6. Typical signals recorded on the CLS2 wall by a couple of accelerometers 0.20 m apart and placed at a distance of 1.60 m between the source and the sensor Acc 1. The red circle highlights the passage of the S-waves.
Applsci 11 09091 g006
Figure 7. Young modulus estimation of wall CLS2 with the increase of distance between the two accelerometers: mean values (blue circles) and range values derived by a confidence interval of 95% of the R-wave velocities obtained by indirect test (red and green circles).
Applsci 11 09091 g007
Figure 8. Image of the Basilica of Santa Maria degli Angeli in Assisi; position of buttresses located above the lateral aisles.
Applsci 11 09091 g008
Figure 9. (a) Tested masonry wall: buttresses of the central nave located above the aisle reinforced with steel tie rods added in the latest restoration; (b) Schematic representation of the positioning of the accelerometers on the wall and point of impact of the instrumented hammer; (c) Schematic representation of indirect test configuration denoting the position of the accelerometers and the impact point of the instrumented hammer; (d) Schematic representation of direct test configuration denoting the directions of volume waves propagation.
Applsci 11 09091 g009
Figure 10. Typical values recorded by the accelerometers in the indirect tests on the masonry panel.
Applsci 11 09091 g010
Figure 11. Typical values recorded by the accelerometers in the direct tests on the masonry panel.
Applsci 11 09091 g011
Table 1. Properties of concrete walls CLS1 and CLS2 and impact tests results: mass density ρ; Poisson ratio ν; distance between the measurements points d; number of suitable samples used in the analysis; mean of R-waves velocity V ¯ R ; standard deviation of R-waves velocity σ V R ; Interval of R-waves velocity with a confidence level of 95%; Young modulus E.
Wall ρ
[kg/m3]
ν
[−]
d
[m]
N
Samples
V ¯ R
[m/s]
σ V R
[m/s]
Conf. Int. 95% [m/s]E
[MPa]
CLS124000.20.20142053231±13229,226 ± 3886
CLS224000.20.20412131621±19631,464 ± 6048
0.40371722303±10120,556 ± 2477
0.60341475210±7315,076 ± 1536
0.80291613166±6318,040 ± 1441
1.00241576188±7917,216 ± 1773
1.20191639112±5418,629 ± 1241
1.40141428134±7714,125 ± 1562
1.605149839±4515,547 ± 946
Table 2. Indirect impact tests results: distance between the measurement points d; number of suitable samples used in the analysis; mean of R-waves velocity V ¯ R ; standard deviation of R-waves velocity σ V R ; interval of R-waves velocity with a confidence level of 95%.
d [m]N Samples V ¯ R [m/s] σ V R [m/s] Conf. Int. 95% [m/s]
0.2035626295±101
0.402054099±46
0.601154860±40
0.80352123±43
Table 3. Direct impact tests results: distance between the measurement points d; number of suitable samples used in the analysis; mean of P-waves velocity V ¯ P ; standard deviation of P-waves velocity σ V P ; interval of P-waves velocity with a confidence level of 95%.
d [m]N Samples V ¯ P [m/s] σ V P [m/s] Conf. Int. 95% [m/s]
0.25502072515±146
1.955207445±52
Table 4. Estimation of elastic parameters of masonry panel.
V ¯ R [m/s] V ¯ P [m/s] ν [−]E [MPa]
544 ± 432073 ± 1000.47 ÷ 0.48880 ÷ 1290
Publisher’s Note: MDPI stays neutral with regard to jurisdictional claims in published maps and institutional affiliations.

