Article

Localized Surface Plasmon Fields Manipulation on Nanostructures Using Wavelength Shifting

1
Department of Cogno-Mechatronics Engineering, Pusan National University, Busan 46241, Korea
2
Medical Device Development Center, Daegu-Gyeongbuk Medical Innovation Foundation (DGMIF), Daegu 41061, Korea
*
Author to whom correspondence should be addressed.
Appl. Sci. 2021, 11(19), 9133; https://doi.org/10.3390/app11199133
Submission received: 12 August 2021 / Revised: 18 September 2021 / Accepted: 27 September 2021 / Published: 30 September 2021
(This article belongs to the Special Issue Nano Korea 2021)

Abstract

:
Metallic nanowires have been utilized as a platform for propagating surface plasmon (SPs) fields. To be exploited for applications such as plasmonic circuits, manipulation of localized field propagating pattern is also important. In this study, we calculated the field distributions of localized surface plasmons (LSPs) on the specifically shaped nanostructures and explored the feasibility of manipulating LSP fields. Specifically, plasmonic fields were calculated at different wavelengths for a nanoscale rod array (I-shaped), an array connected with two nanoscale rods at right angles (T-shaped), and an array with three nanoscale rods at 120° to each other (Y-shaped). Three different types of nanostructures are suggested to manipulate the positions of LSP fields collaborating with adjustment of wavelength, polarization, and incident orientation of light source. The results of this study are important not only for the understanding of the wavelength-dependent surface plasmon field localization mechanism but also for the applicability of swept source-based plasmonic techniques or designing a plasmonic circuit.

1. Introduction

A surface plasmon (SP) is a longitudinal electron oscillation formed between a metal and a dielectric interface. SP coupling occurs at a specific energy and momentum, collectively referred to as the SP resonance (SPR) condition. The SPR condition is highly affected by the refractive index in the proximity of the interface. Thus, the SPR phenomenon is widely used in optical sensor design for a high-sensitive chemical or biological target detection [1].
When it applied within or collaborates with noble metallic nanostructures, highly localized SP field can be achieved, which we call LSP. LSP has been widely investigated for various studies, including ultrasensitive chemical or biological sensing which capacitates better sensitivity compared to the conventional SPR sensors [2,3,4,5,6,7,8]. The role of created LSP for sensitivity improvement of a sensor is amplification of the optical response resulted from the minor refractive index changes of sample area. In addition, LSP has received considerable attention for improving imaging resolution down to subwavelength level by being applied for a microscopic system [9,10,11,12,13]. For the image resolution improvement, nanostructures are designed to extremely localize SP field at the nanoscale small gap or region [14,15,16]. The extremely localized field, wherein the full-width half-maximum (FWHM) is below the diffraction limit, excite fluorescent agents at the subwavelength scale. Thus, super-resolution images can be achieved, overcoming diffraction limit, with an imaging reconstruction process [12,17,18]. In practice, the improvements in sensitivity of a sensor and image resolution are primarily determined by the spatial distributions of the LSP fields. Moreover, it has been reported that the LSP fields can be effectively utilized to trap a particle owing to their strong gradient force [19,20,21,22].
It is well-known that the LSP field distributions on metallic nanostructures can be spatially engineered by modulating the conformations or materials of nanostructures. There are some researches that exploiting spatially engineered LSP field distributions. It can be applied for the optical lithographic methods by utilizing the strongly generated varied spatial distributions of LSP fields as a lithographic source at nanoscale. To fabricate accurately the complicated and creative nanostructures as we desired, the spatial distributions of LSP should be thoroughly engineered through selecting appropriate materials or managing conformations and composition of nanostructures [23]. The diversely engineered spatial distributions of LSP fields were also utilized for the biosensing and imaging applications [24,25,26]. Beyond the aforementioned applications exploiting static LSPs field distribution, demands for developing a technique which enables dynamic control the static states of LSP field distributions are increasing. Recently, control of the LSP fields on the metallic waveguides has been introduced for functional plasmonic circuit and drawn great attention [27,28].
In this study, the LSP field distributions on diverse metallic nanostructures were calculated for exploring the feasibility of manipulating LSP fields by modulating the wavelength of the incident light. For that, plasmonic fields generated on a nanoscale rod array (I-shaped), an array connected with two nanoscale rods at right angles (T-shaped), and an array with three nanoscale rods at 120° to each other (Y-shaped) were calculated with four wavelengths of the light source which is commonly used. Three different nanostructures were examined to test feasibility for manipulating position of LSP fields by tuning incident wavelength shifting. The near-field distributions on them at different incident wavelengths were calculated via a rigorous coupling wave analysis (RCWA) method. The results of this study are important not only for the understanding of a wavelength-dependent SP field localization mechanism but also for the applicability of swept-wavelength-based dynamic plasmonic techniques.

2. Materials and Methods

We designed unit structures of I-, T-, and Y-shaped nanostructure arrays as illustrated in Figure 1a. A unit structure of I-shaped nanostructure arrays consists of a gold nanorod with a width and length of 500 nm and 2 μm, respectively, on BK7 glass. A unit structure of the T-shaped nanostructure arrays consists of a nanorod and a nanowire at right angles; the width and length of this nanorod are the same as those of the I-shaped nanostructure, and the vertical nanowire has a width of 300 nm. A unit structure of the Y-shaped nanostructure arrays consists of a zigzag nanowire with a width of 300 nm, an angle of 120°, and a connection between the nanorods that has the same length and width as those of the I-shaped nanostructures. The unit structure in each nanostructure array was determined to be widthand length of 3 μm and 8 μm. The height of each nanostructure was estimated to be 100 nm.
Moreover, we employed a rigorous coupled wave analysis (RCWA) [9,12,29,30,31,32] for theoretical calculation to quantify distributions of near-field electromagnetic fields on I-, T-, and Y-shaped nanostructure arrays when the upward light entered at an incident angle of 60° (in xz-plane) in the TM and TE mode. The energy levels of incident light were selected as the four most widely used wavelengths in near infrared lasers, considering the material and size of the structure (808, 1064, 1310, and 1550 nm). The 15 × 15 spatial harmonic orders were successfully operated to explain the optical near-field characteristics by LSP in each nanostructure array without abnormal divergence.
Based on the theoretical design, fabrication of designed structure was performed in advance to examine whether those structures could be established well as we have designed, although this research is mainly focused on theoretical research. To verify that each nanostructure can be established and employed in functional substrates of various applications, the I-, T-, and Y-shaped nanostructures were designed as presented in Figure 1a. The fabricated structures are shown in Figure 1b. In this study, we employed electron-beam (e-beam) lithography [9,33,34,35,36,37,38,39] to investigate the I-, T-, and Y-shaped nanostructure arrays. Specifically, the I-, T, and Y-shaped nanostructure arrays were fabricated on a BK7 glass substrate with a thickness of 180 μm. To enhance the adhesion between the glass substrate and the gold nanostructure, a 2 nm-thick chrome adhesion layer was deposited. Each nanostructure array was established using e-beam lithography (Tescan, Brno, Czech Republic) with a negative polymer resist (ma-N 2403, Micro Resist Technology, Berlin, Germany). Each nanostructured pattern was converted into a gold nanostructure array with a 100 nm-thick by the thermal evaporation of gold and by lift-off processes using a chemical developer (ma-D 525, Micro Resist Technology). Figure 1b presents the scanning electron microscopy (SEM) images of the I-, T-, and Y-shaped nanostructure arrays fabricated by the afore-mentioned processes.

3. Results

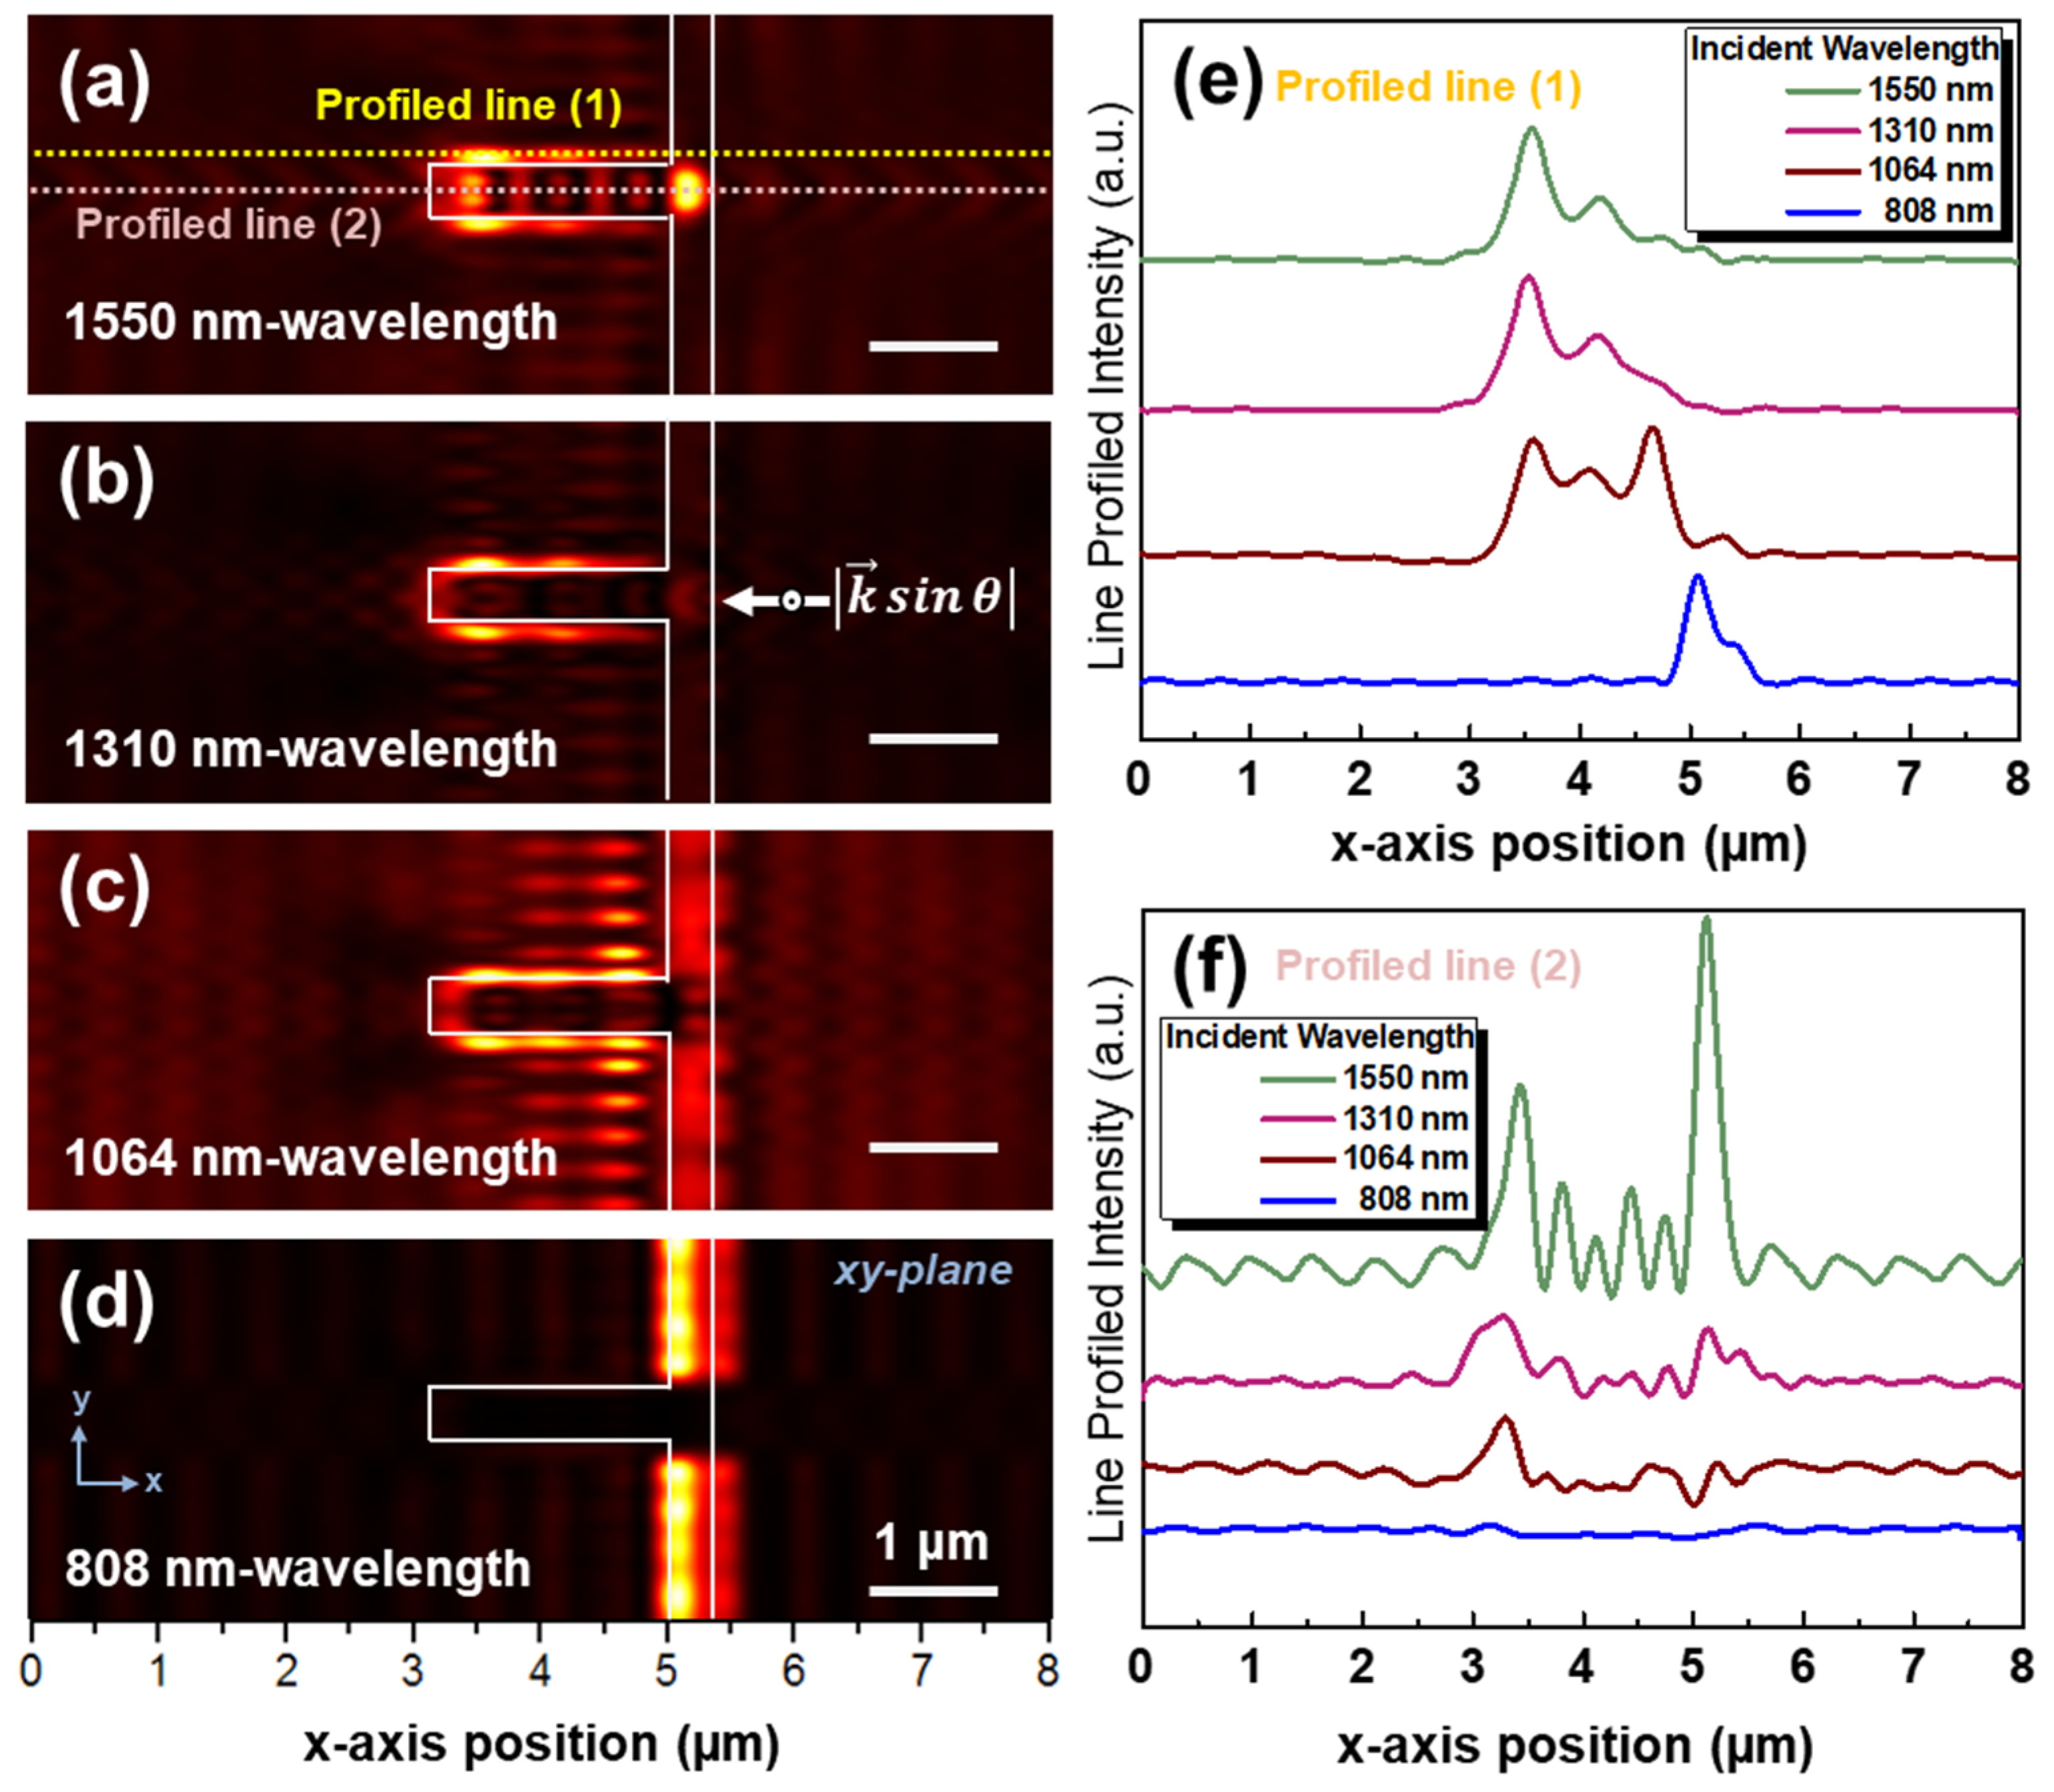
Through the calculations, we quantitatively identified the distributions of localized plasmonic near-field generated on I-, T- and Y-type nanostructure arrays resulting from different wavelength of incident light source. Figure 2 illustrates the calculated distributions of plasmonic near-field when the upward-direction TM mode of four wavelengths light was illuminated to the I-shaped nanostructure arrays. The simulation result indicates that the position of the highly localized electromagnetic field on the structures moves further from the initial incident-light position when the wavelength becomes longer. The enhanced intensity of the localized electromagnetic fields was the largest at a wavelength of 1550 nm. In contrast, the field was localized in the same direction in which the light at 808 nm entered for the profile measurement to the center of the nanorod. When the light was 1064 nm, localized and enhanced electromagnetic fields in both directions occurred in the profile to the center of the nanorod. For sufficiently large wavelengths (1310 and 1550 nm), plasmonic fields were localized in the middle of the opposite direction to the incident light as illustrated in the intensity analysis of Figure 2f.
It was apparent that the electromagnetic field distributions on the T-shaped nanostructure arrays are significantly different from the simulation result of the I-shaped nanostructure arrays as depicted in Figure 3. With the 808-nm light introducing, the localized electromagnetic fields were placed on the nanowire as the T-shaped nanostructures operated on a nanoscale grating. For sufficiently large wavelengths (1330 and 1550 nm), the near-field distribution was moderately similar to the simulation result of the I-shaped nanostructure arrays at center of nanorod. In contrast, the profile analysis at the line (2) which cross the center of nanorod for the 1550 nm incident light indicates that the electromagnetic field was highly localized at the center of T-shaped structure as illustrated in Figure 3a,f.
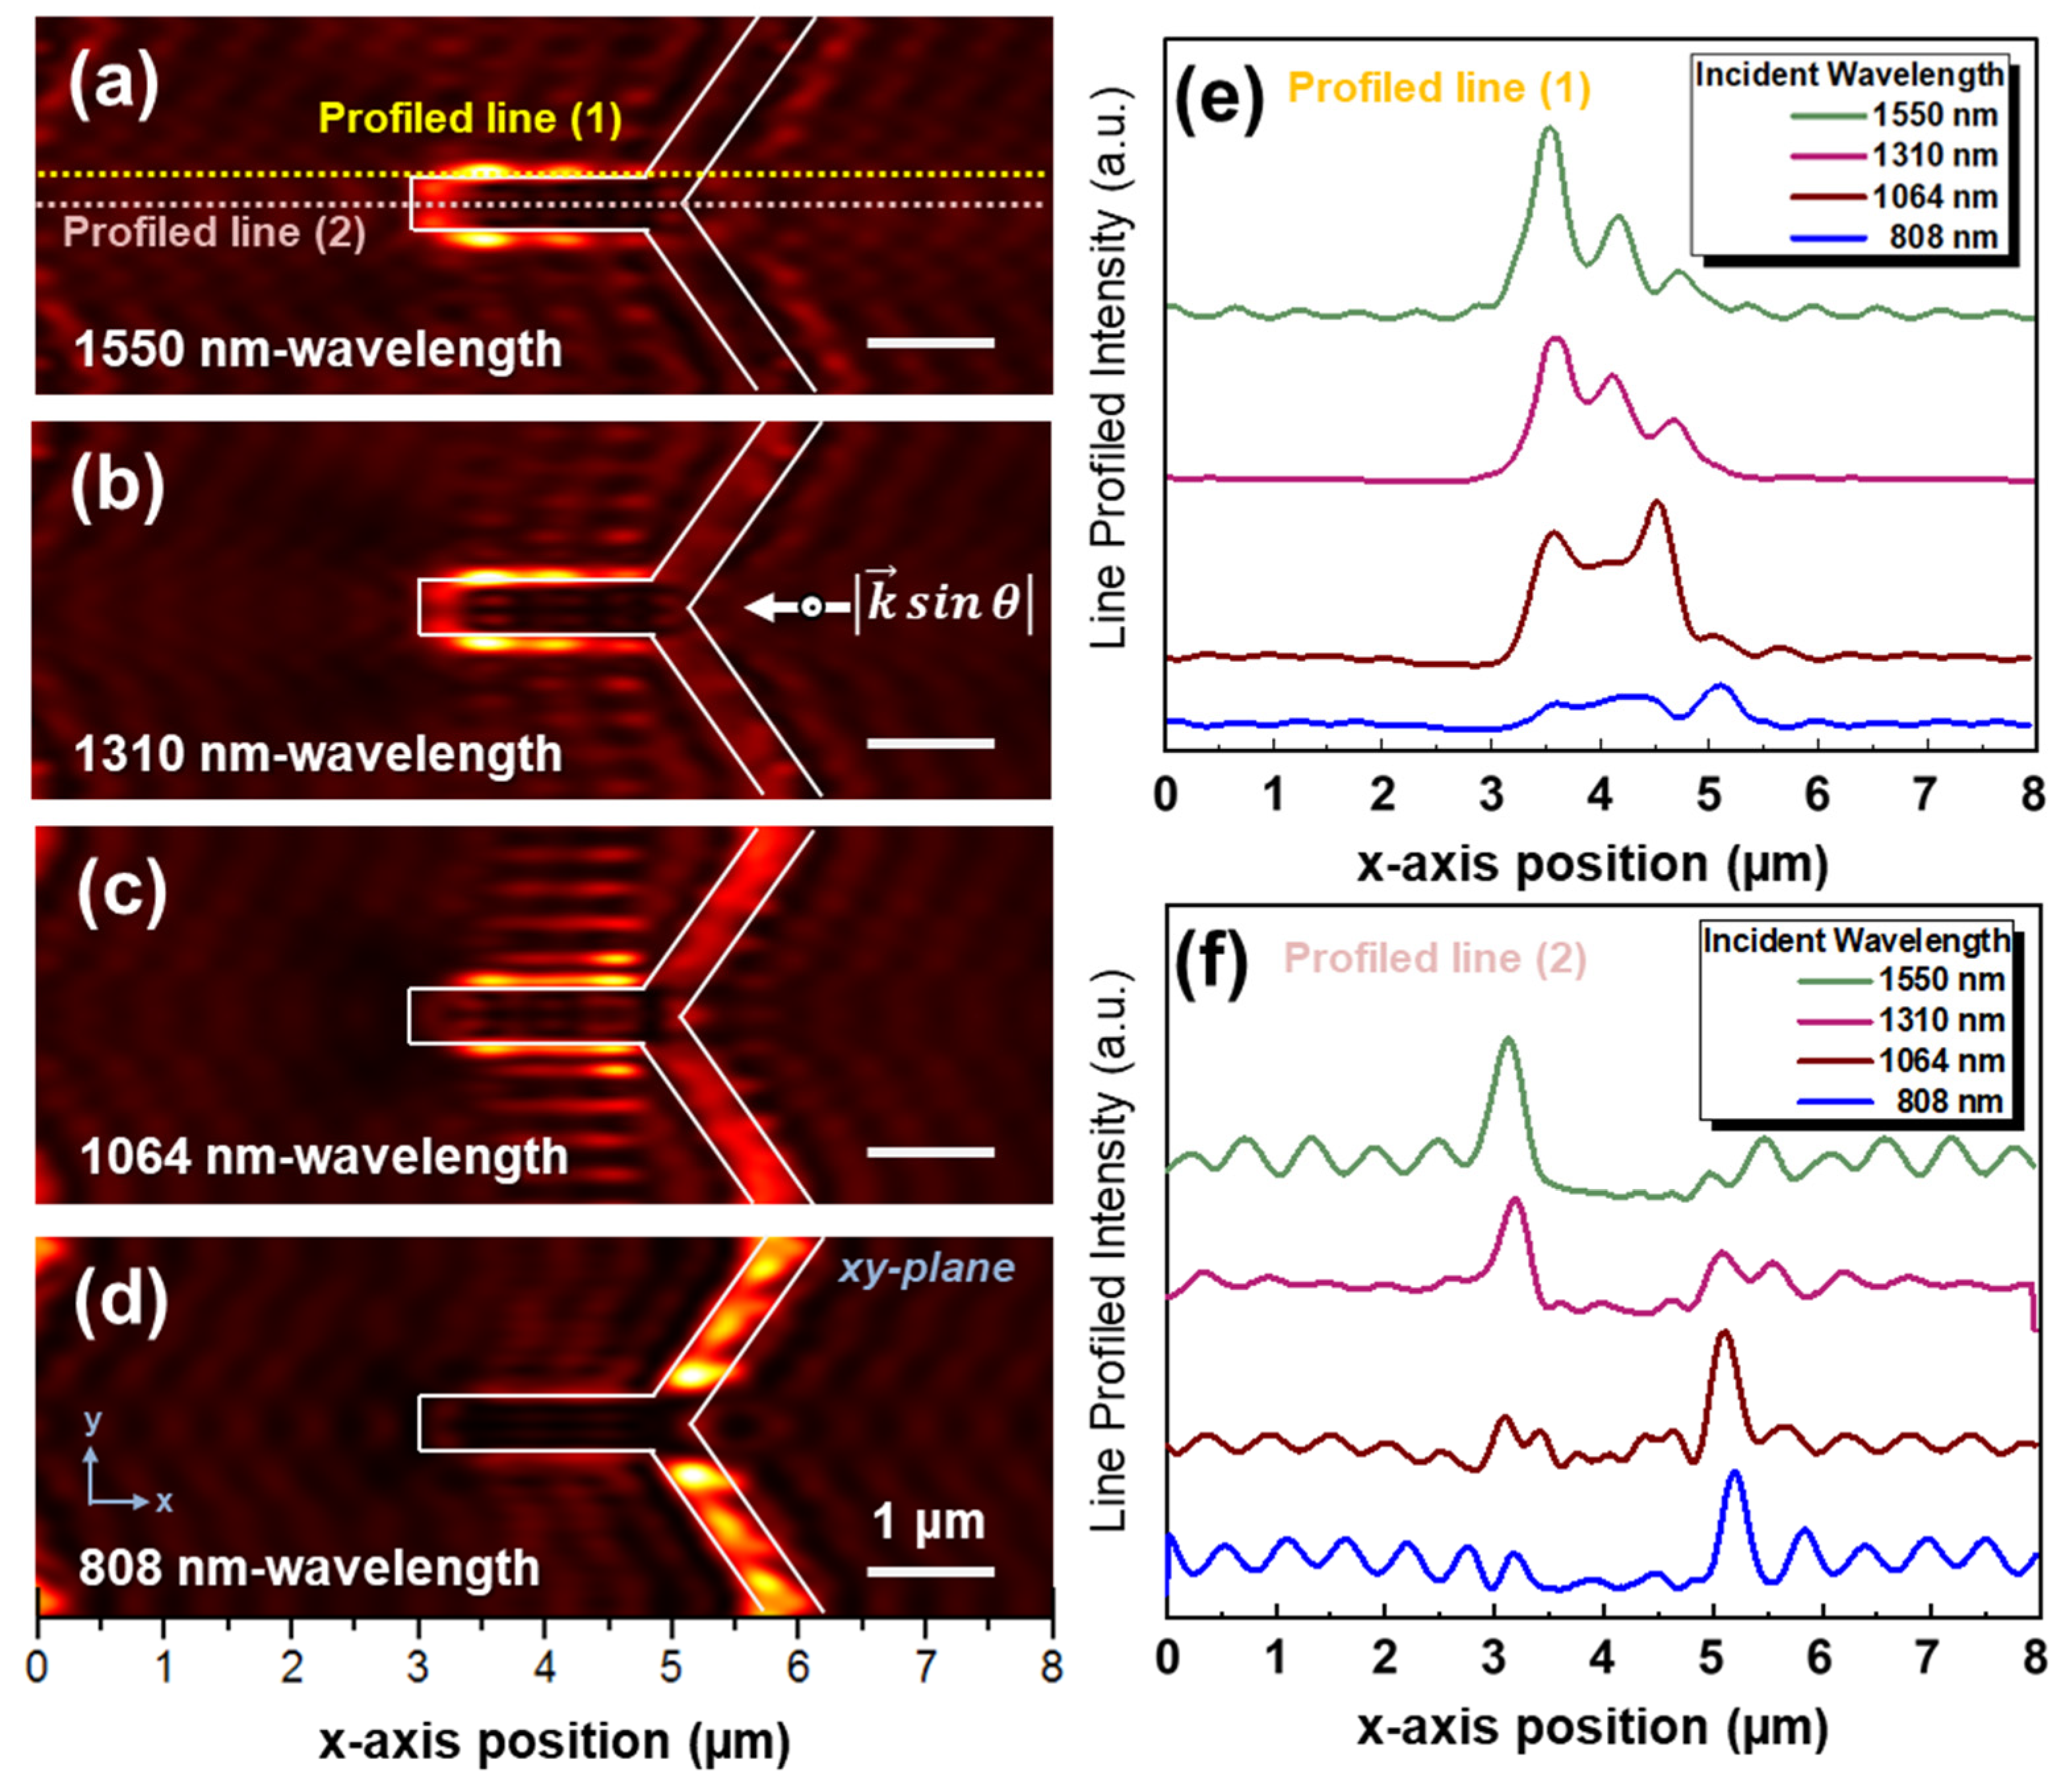
Figure 4 describes the distribution of plasmonic electromagnetic fields on Y-shaped nanostructure arrays when the light at the four selected wavelengths entered. The overall propensity is similar to the T-shaped nanostructure arrays-based simulation result; however, the simulation results for the case of introducing 808 nm-wavelength lights to the Y-shaped array indicates that localized plasmonic fields were placed on the tilted nanorod as described in Figure 4d. Also, there was loss of the localized field at the center of the Y-shaped structure which was observed at the T-shaped structure. The most interesting point is that not only the scanning mode of the confined field along the nanostructure but also the discrete switching mode of the confined field was observed on the Y-shaped nanostructure arrays, and it can be controlled by the wavelength. Depending on the demands for s specific confined field mode, the mode can be tuned by selecting the proper wavelength of incident light.
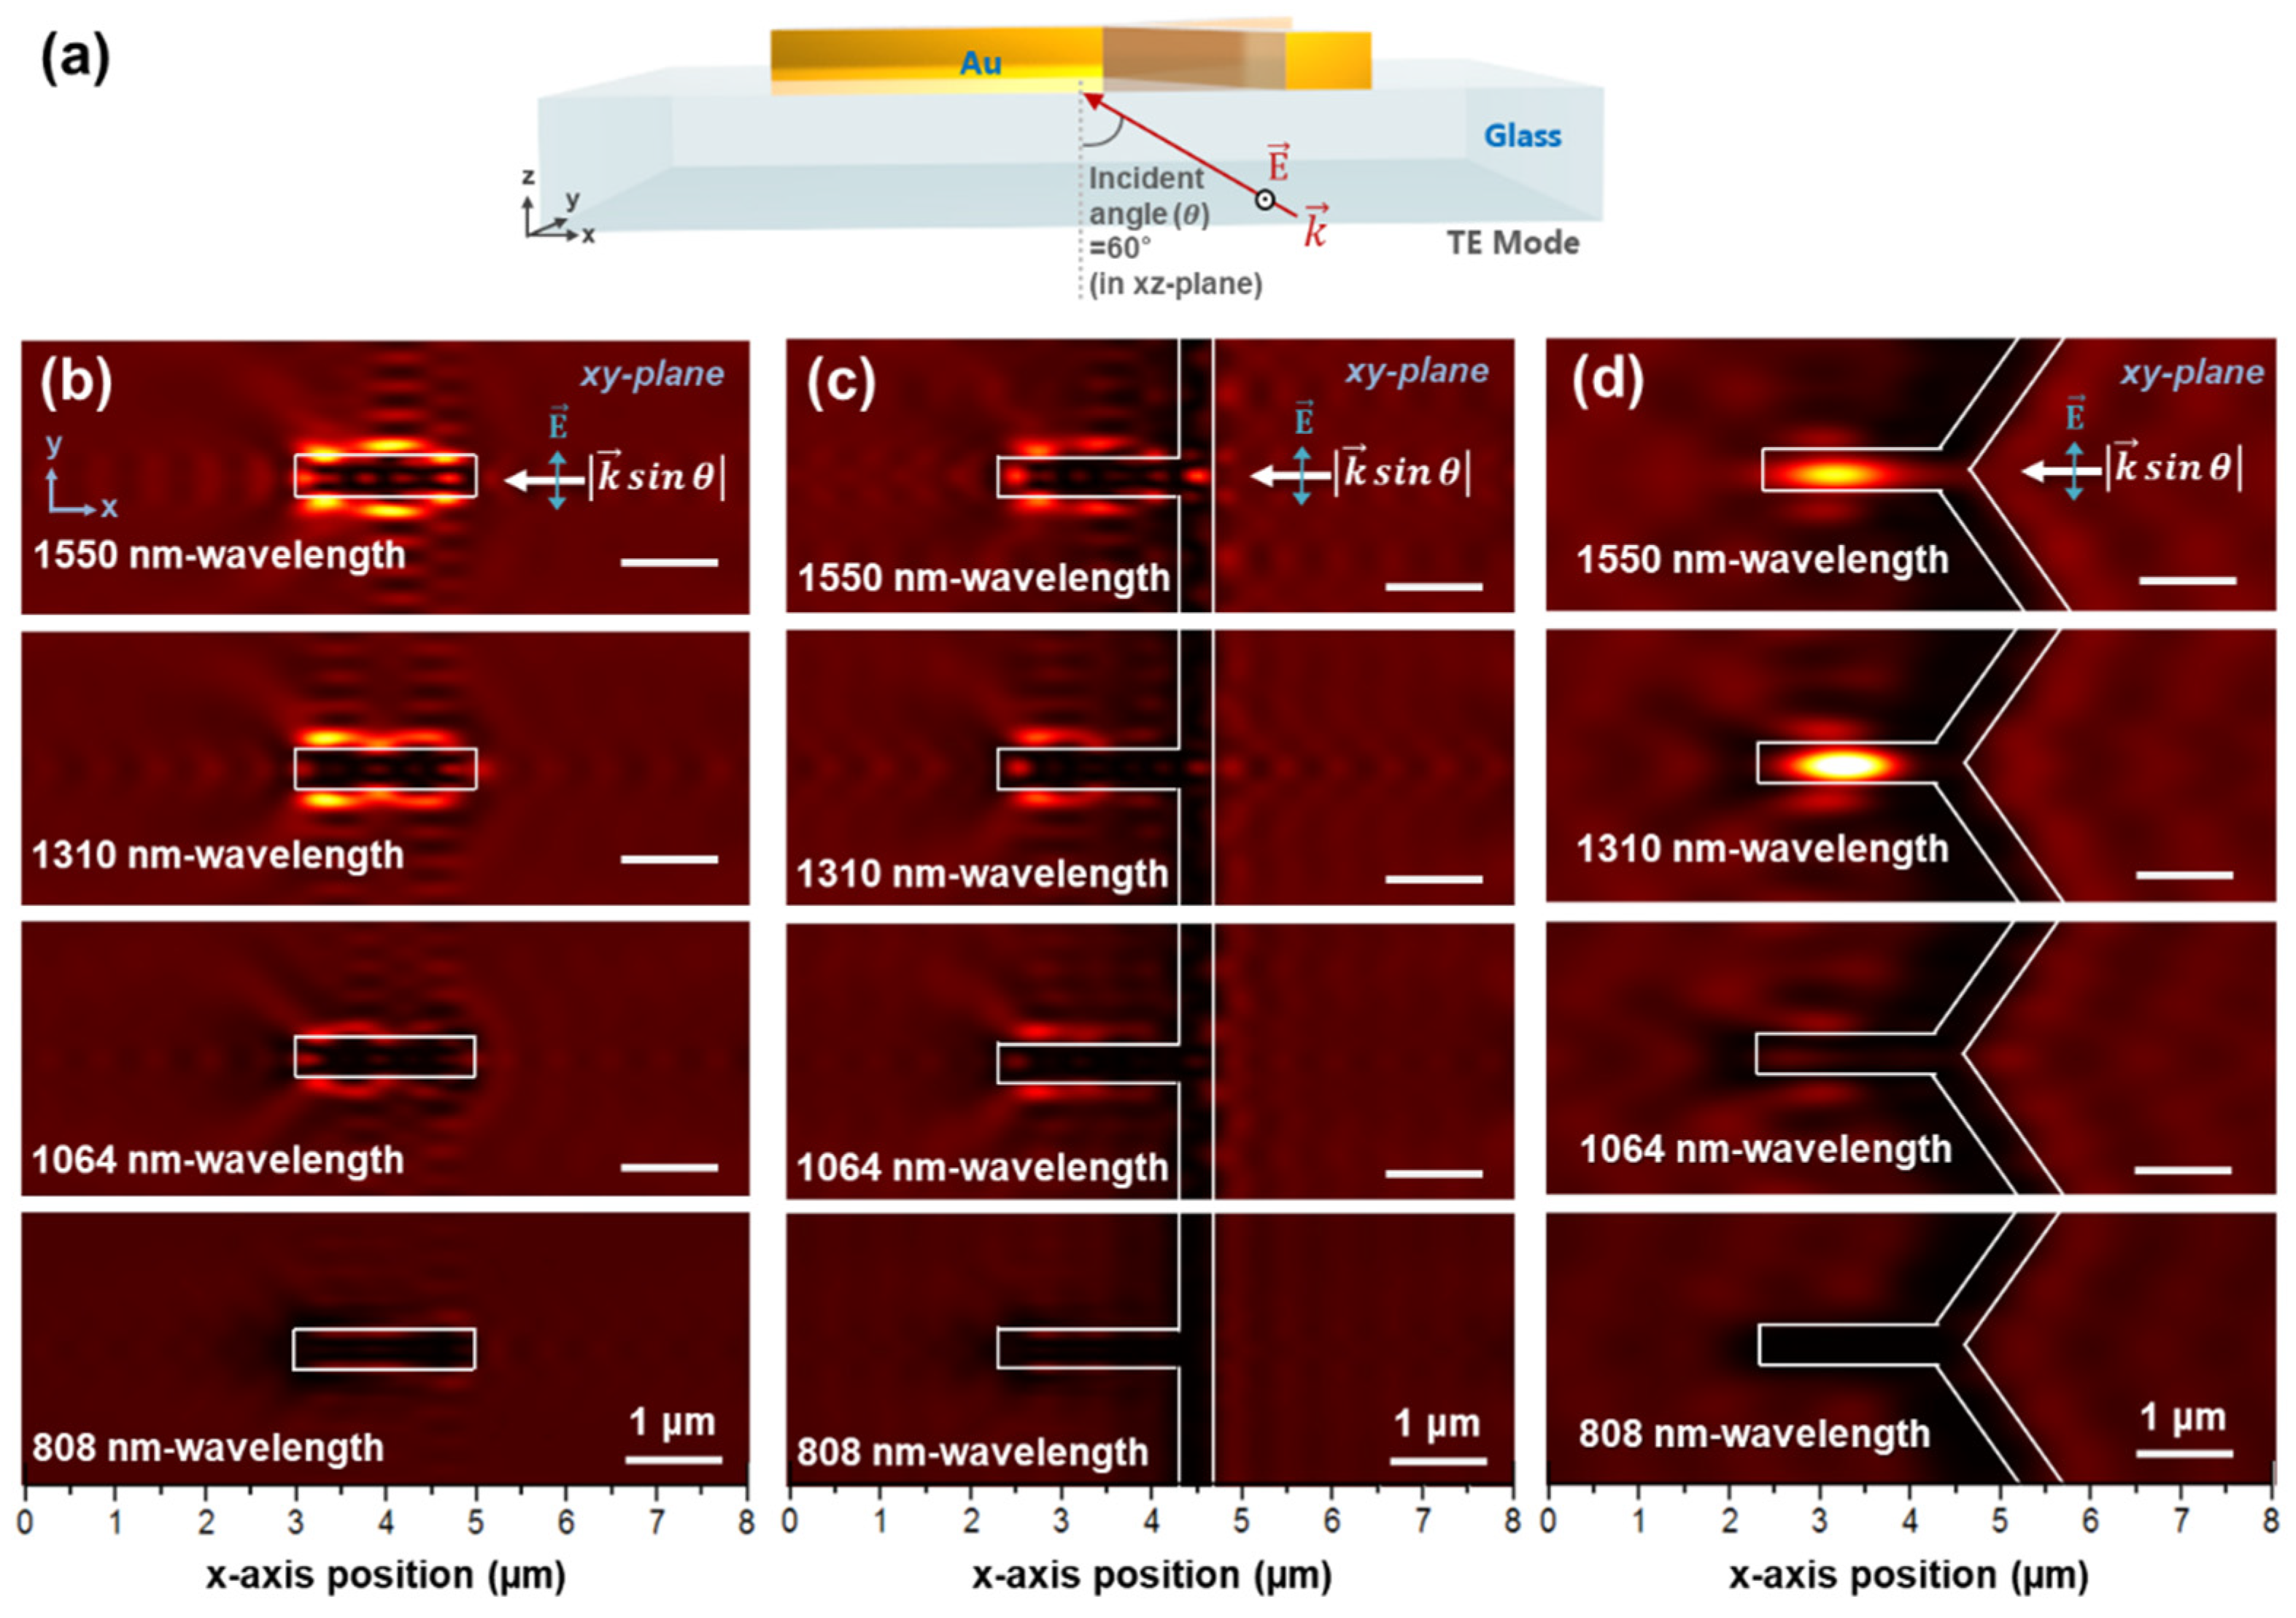
To vary the confined field mode on the same structure array, there is another main variable regarding the incident light source. The polarization of the incident light source also can be considered for achieving additional diverse modes of the confined field on the structures. From the data presented in Figure 2, Figure 3 and Figure 4 are the simulated results with TM mode of incident light at 60 incident angle degrees in xz-plane. However, we performed the further calculation of field confinement on the structure arrays when the structures are illuminated by 4 different wavelengths of TE mode incident light source while maintaining incident angle degree in xz-plane, and the results are presented in Figure 5. Interestingly, a different mode of the generated confined field from that achieved by TM mode was observed using TE mode illumination as shown in Figure 5 as top-view. The results show that with the different polarization of incident field, TE mode in this case, on/off mode of the confined field on the I- and Y-shaped structure depending on the wavelength was observed as shown in Figure 5b,d. The longer wavelength highly confined the field on the structure while off-mode was observed with shorter wavelength in TE mode. On the other hand, hard to find big difference in T-shaped structures.
There could be another way for confined field switching on the structures or scanning of the spatial field along with the structures while maintaining pattern geometry, which is the orientations of the incident light source. It is well known that the resonance condition of ellipsoidal nanoparticles varies depending on their aspect ratio and the orientations of incident light source without any deformation of particles [40] since an additional geometric issue can be provided to the designed structure array without modifying the geometries of the pattern by providing light source orientation. In this regard, orientation of light source was selected for supplying versatile mode achievement. A simulation was executed using diverse orientations of the incident light source while maintaining incident angle as 60° to give extra geometrical input to the structure generating versatile formations of field confinement. The range of incident light orientations which can be indicated in xy-plane was set between 0° to 40° with respect to the x-axis as indicated in the left part of Figure 6. Depending on the orientation, we designated with a lowercase alphabet and the calculated results are shown in the right part of Figure 6a–j. As shown in the results, scanning of the field localization was observed along the structures also the discrete localization of field was found. This scheme can be practically applied for a resolution enhanced imaging collaborating a method introduced in [41] which utilizes multi-channel spatial excitation.
The analysis of plasmonic near-field distributions on the I-, T-, and Y-shaped nanostructure arrays with multiple wavelengths of incident light allowed us to determine two applications using nanostructure arrays: the first is the application of highly sensitive imaging or sensing by plasmonic electromagnetic fields that are localized and enhanced using I-, T- and Y-shaped nanostructure arrays. Functionalized near-infrared fluorescence-staining molecules can be integrated in this application to represent biological or chemical parameters [42,43]. The second application is a high resolved imaging, highly sensitive spectroscopic sensor or plasmonic circuit using plasmonic field changes on nanostructure arrays via wavelengths of incident light. The integration of two or more angular architectures of nanostructure substrates is expected to be employed as a more precise refractive indices sensor when a high-resolution spectroscopic analysis instrument is applied.

4. Discussion

When designing a plasmonic circuit, two factors are considered, which are the propagation and confinement of surface plasmon polaritons (SPPs). As the propagation length and confinement of SPPs are in a complementary relation, we should compromise between the two factors depending on the purpose when designing a plasmonic circuit. Usually, plasmonic waveguides are designed to pursue maximized propagation length, however, confinement of SPPs at a desired position is required rather than propagation length or strength of confinement, for example, when it is employed for switching schemes in plasmonic circuits by providing dynamics on a static circuit, or in few tens of nanometers nanostructure-based circuit parts since it also supports the confined SPPs volume under the diffraction limit.
In this regard, three different nanostructures composed of different orientations of metallic rods, I-, T-, and Y-shaped nanostructures, were prepared as plasmonic platforms to provide more dynamics in the confinement position of the field. The LSPs field distributions on the metallic nanostructures were simulated and explored the feasibility of manipulating the LSPs field using incident-wavelength shifting. The distributions of localized electromagnetic fields were mainly manipulated by four different selected wavelengths of incident light source. The LSP distributions were generated well on the I-, T-, and Y-shaped metallic platforms, interestingly, the LSPs field positions differently depending on the incident wavelength. Notably, the positions of the LSPs field were dramatically switched by the incident wavelength, which means, we could control the position of the propagating surface plasmonic fields at a specific position with a high energy level by incident wavelength switching. By exploiting this scheme, the feasibility of application for the dynamic plasmonic circuits by switching the localized position of SP fields was explored. Moreover, these results enable the building of advanced plasmonic circuits by collaborating with a polarization-dependent plasmonic switching scheme. It could be also suggested for highly sensitive plasmonic sensors and high-performance optical imaging, for instance, plasmonic nanomanipulation-based enhanced Raman spectroscopic sensing and imaging [44,45,46], by spatially illuminating the target sample with illumination volume under diffraction limit which is capable of scanning mode illumination function with a tunable laser source. Tuning of confined fields can be applied for fascinating research based on bio/chemical reaction such as high-throughput light-induced tailoring by utilizing surface chemistry [47].

Author Contributions

Conceptualization, H.S., J.-r.C. and K.K.; methodology, H.S., H.A. and T.K.; software, H.S. and H.A.; validation, H.S. and J.-r.C.; formal analysis, H.S. and J.-r.C.; investigation, H.S., H.A. and T.K.; resources, H.S., H.A. and T.K.; data curation, J.-r.C. and K.K.; writing—original draft preparation, H.S. and J.-r.C.; writing—review and editing, H.S., J.-r.C. and K.K.; visualization, H.S.; supervision, J.-r.C. and K.K.; project administration, K.K.; funding acquisition, K.K. All authors have read and agreed to the published version of the manuscript.

Funding

This research was funded by National Research Foundation of Korea (NRF) (2017M3D1A1039287, 2018R1A4A1025623, 2020R1A2C4002732). This research was supported by Basic Science Research Program through the National Research Foundation of Korea (NRF) funded by the Ministry of Education (2020R1A6A3A13076133).

Institutional Review Board Statement

Not applicable.

Informed Consent Statement

Not applicable.

Data Availability Statement

The data presented in this study are openly available with a presentation of this article as a reference article with a statement of article information (a title, a journal name, and a publisher).

Conflicts of Interest

The authors declare no conflict of interest.

References

  1. Ahn, H.; Song, H.; Choi, J.-r.; Kim, K. A localized surface plasmon resonance sensor using double-metal-complex nanostructures and a review of recent approaches. Sensors 2018, 18, 98. [Google Scholar] [CrossRef] [PubMed] [Green Version]
  2. Gish, D.A.; Nsiah, F.; McDermott, M.T.; Brett, M.J. Localized surface plasmon resonance biosensor using silver nanostructures fabricated by glancing angle deposition. Anal. Chem. 2007, 79, 4228–4232. [Google Scholar] [CrossRef] [PubMed]
  3. Kim, K.; Kim, D.J.; Moon, S.; Kim, D.; Byun, K.M. Localized surface plasmon resonance detection of layered biointeractions on metallic subwavelength nanogratings. Nanotechnology 2009, 20, 315501. [Google Scholar] [CrossRef] [PubMed] [Green Version]
  4. Kim, S.A.; Byun, K.M.; Kim, K.; Jang, S.M.; Ma, K.; Oh, Y.; Kim, D.; Kim, S.G.; Shuler, M.L.; Kim, S.J. Surface-enhanced localized surface plasmon resonance biosensing of avian influenza DNA hybridization using subwavelength metallic nanoarrays. Nanotechnology 2010, 21, 355503. [Google Scholar] [CrossRef] [Green Version]
  5. Valsecchi, C.; Brolo, A.G. Periodic metallic nanostructures as plasmonic chemical sensors. Langmuir 2013, 29, 5638–5649. [Google Scholar] [CrossRef] [PubMed]
  6. Kugel, V.; Ji, H.F. Nanopillars for sensing. J. Nanosci. Nanotechnol. 2014, 14, 6469–6477. [Google Scholar] [CrossRef] [PubMed]
  7. Li, W.; Ren, K.; Zhou, J. Aluminum-based localized surface plasmon resonance for biosensing. Trends Anal. Chem. 2016, 80, 486–494. [Google Scholar] [CrossRef]
  8. Oh, Y.; Kim, K.; Hwang, S.; Ahn, H.; Oh, J.-W.; Choi, J.-r. Recent advances of nanostructure implemented spectroscopic sensors—A brief overview. Appl. Spectrosc. Rev. 2016, 51, 656–668. [Google Scholar] [CrossRef]
  9. Choi, J.-r.; Kim, K.; Oh, Y.; Kim, A.L.; Kim, S.Y.; Shin, J.-S.; Kim, D. Extraordinary transmission based plasmonic nanoarrays for axially super-resolved cell imaging. Adv. Opt. Mater. 2014, 2, 48–55. [Google Scholar] [CrossRef]
  10. Wei, F.; Lu, D.; Shen, H.; Wan, W.; Ponsetto, J.L.; Huang, E.; Liu, Z. Wide field super-resolution surface imaging through plasmonic structured illumination microscopy. Nano Lett. 2014, 14, 4634–4639. [Google Scholar]
  11. Choi, J.-r.; Lee, S.; Kim, K. Plasmon based super resolution imaging for single molecular detection: Breaking the diffraction limit. Biomed. Eng. Lett. 2014, 4, 231–238. [Google Scholar] [CrossRef]
  12. Oh, Y.; Son, T.; Kim, S.Y.; Lee, W.; Yang, H.; Choi, J.-r.; Shin, J.-S.; Kim, D. Surface plasmon-based nanoscopy of intracellular cytoskeletal actin filaments using random nanodot arrays. Opt. Express 2014, 22, 27695–27706. [Google Scholar] [CrossRef] [PubMed]
  13. Fernández-Domínguez, A.I.; Liu, Z.; Pendry, J.B. Coherent four-fold super-resolution imaging with composite photonic–plasmonic structured illumination. ACS Photon. 2015, 2, 341–348. [Google Scholar] [CrossRef]
  14. Lee, W.; Kim, K.; Kim, D. Electromagnetic near-field nanoantennas for subdiffraction-limited surface plasmon-enhanced light microscopy. IEEE J. Sel. Top. Quantum Electron. 2012, 18, 1684–1691. [Google Scholar]
  15. Wertz, E.; Isaacoff, B.P.; Flynn, J.D.; Biteen, J.S. Single-molecule super-resolution microscopy reveals how light couples to a plasmonic nanoantenna on the nanometer scale. Nano Lett. 2015, 15, 2662–2670. [Google Scholar] [CrossRef]
  16. Allen, K.W.; Farahi, N.; Li, Y.; Limberopoulos, N.I.; Walker Jr., D.E.; Urbas, A.M.; Liberman, V.; Astratov, V.N. Super-resolution microscopy by movable thin-films with embedded microspheres: Resolution analysis. Ann. Phys. 2015, 527, 513–522. [Google Scholar] [CrossRef] [Green Version]
  17. Lin, H.; Centeno, S.P.; Su, L.; Kenens, B.; Rocha, S.; Sliwa, M.; Hofkens, J.; Uji-I, H. Mapping of surface-enhanced fluorescence on metal nanoparticles using super-resolution photoactivation localization microscopy. Chem. Phys. Chem. 2012, 13, 973–981. [Google Scholar] [CrossRef]
  18. Ishikawa, S.; Hayasaki, Y. Super-resolution complex amplitude reconstruction of nanostructured binary data using an interference microscope with pattern matching. Opt. Express 2013, 21, 18424–18433. [Google Scholar] [CrossRef]
  19. Tanaka, Y.; Kaneda, S.; Sasaki, K. Nanostructured potential of optical trapping using a plasmonic nanoblock pair. Nano Lett. 2013, 13, 2146–2150. [Google Scholar] [CrossRef] [PubMed]
  20. Thompson, J.D.; Tiecke, T.G.; de Leon, N.P.; Feist, J.; Akimov, A.V.; Gullans, M.; Zibrov, A.S.; Vuleti, V.; Lukin, M.D. Coupling a single trapped atom to a nanoscale optical cavity. Science 2013, 340, 1202–1205. [Google Scholar] [CrossRef] [PubMed]
  21. Kotnala, A.; Gordon, R. Quantification of high-efficiency trapping of nanoparticles in a double nanohole optical tweezer. Nano Lett. 2014, 14, 853–856. [Google Scholar] [CrossRef]
  22. Berthelot, J.; Aćimović, S.S.; Juan, M.L.; Kreuzer, M.P.; Renger, J.; Quidant, R. Three-dimensional manipulation with scanning near-field optical nanotweezers. Nat. Nanotechnol. 2014, 9, 295. [Google Scholar] [CrossRef]
  23. Kim, T.; Ahn, H.; Song, H.; Kim, K.; Choi, J.-r. Comparative study of nanolithography based on extraordinary and diffracted optical transmissions. Opt. Laser Technol. 2019, 119, 105658. [Google Scholar] [CrossRef]
  24. Kim, K.; Yoon, S.J.; Kim, D. Nanowire-based enhancement of localized surface plasmon resonance for highly sensitive detection: A theoretical study. Opt. Express 2006, 14, 12419–12431. [Google Scholar] [CrossRef] [PubMed]
  25. Shen, H.; Guillot, N.; Rouxel, J.; de la Chapelle, M.L.; Toury, T. Optimized plasmonic nanostructures for improved sensing activities. Opt. Express 2012, 20, 21278–21290. [Google Scholar] [CrossRef]
  26. Deng, Y.; Liu, Z.; Song, C.; Hao, P.; Wu, Y.; Liu, Y.; Korvink, Y.G. Topology optimization of metal nanostructures for localized surface plasmon resonances. Struct. Multidiscip. Optim. 2016, 53, 967–972. [Google Scholar]
  27. Wei, H.; Zhang, S.; Tian, X.; Xu, H. Highly tunable propagating surface plasmons on supported silver nanowires. Proc. Natl. Acad. Sci. USA 2013, 110, 4494–4499. [Google Scholar] [CrossRef] [PubMed] [Green Version]
  28. Wang, Z.; Wei, H.; Pan, D.; Xu, H. Controlling the radiation direction of propagating surface plasmons on silver nanowires. Laser Photonics Rev. 2014, 4, 596–601. [Google Scholar] [CrossRef]
  29. Moharam, M.G.; Gaylord, T.K. Rigorous coupled-wave analysis of planar-grating diffraction. J. Opt. Soc. Am. 1981, 71, 811–818. [Google Scholar] [CrossRef]
  30. Byun, K.M.; Kim, S.J.; Kim, D. Design study of highly sensitive nanowire-enhanced surface plasmon resonance biosensors using rigorous coupled wave analysis. Opt. Express 2005, 13, 3737–3742. [Google Scholar]
  31. Wan, C.; Gaylord, T.K.; Bakir, M.S. Rigorous coupled-wave analysis equivalent-index-slab method for analyzing 3D angular misalignment in interlayer grating couplers. Appl. Opt. 2016, 55, 10006–10015. [Google Scholar] [CrossRef] [PubMed]
  32. Wang, Q.; Zhang, D.; Yang, H.; Tao, C.; Huang, Y.; Zhuang, S.; Mei, T. Sensitivity of a label-free guided-mode resonant optical biosensor with different modes. Sensors 2012, 12, 9791–9799. [Google Scholar] [CrossRef] [PubMed]
  33. Tseng, A.A.; Chen, K.; Chen, C.D.; Ma, K.J. Electron beam lithography in nanoscale fabrication: Recent development. IEEE Trans. Electron. Packag. Manuf. 2003, 26, 141–149. [Google Scholar] [CrossRef] [Green Version]
  34. Hicks, E.M.; Zou, S.; Schatz, G.C.; Spears, K.G.; Van Duyne, R.P.; Gunnarsson, L.; Rindzevicius, T.; Kasemo, B.; Käll, M. Controlling plasmon line shapes through diffractive coupling in linear arrays of cylindrical nanoparticles fabricated by electron beam lithography. Nano Lett. 2005, 5, 1065–1070. [Google Scholar] [CrossRef] [PubMed]
  35. Chen, Y. Nanofabrication by electron beam lithography and its applications: A review. Microelectron. Eng. 2015, 135, 57–72. [Google Scholar] [CrossRef]
  36. Hammond, J.; Rosamond, M.; Sivaraya, S.; Marken, F.; Estrela, P. Fabrication of a horizontal and a vertical large surface area nanogap electrochemical sensor. Sensors 2016, 16, 2128. [Google Scholar] [CrossRef] [Green Version]
  37. Ionescu, R.; Aybeke, E.; Bourillot, E.; Lacroute, Y.; Lesniewska, E.; Adam, P.M.; Bijeon, J.L. Fabrication of annealed gold nanostructures on pre-treated glow-discharge cleaned glasses and their used for localized surface plasmon resonance (LSPR) and surface enhanced Raman spectroscopy (SERS) detection of adsorbed (bio) molecules. Sensors 2017, 17, 236. [Google Scholar] [CrossRef] [Green Version]
  38. Manfrinato, V.R.; Stein, A.; Zhang, L.; Nam, C.Y.; Yager, K.G.; Stach, E.A.; Black, C.T. Aberration-corrected electron beam lithography at the one nanometer length scale. Nano Lett. 2017, 17, 4562–4567. [Google Scholar] [CrossRef]
  39. Agrawal, A.; Majdi, J.; Clouse, K.; Stantchev, T. Electron-beam-lithographed nanostructures as reference materials for label-free scattered-light biosensing of single filoviruses. Sensors 2018, 18, 1670. [Google Scholar] [CrossRef] [Green Version]
  40. Khlebtsov, N.G. T-matrix method in plasmonics: An overview. J. Quant. Spectrosc. Radiat. Transf. 2013, 123, 184–217. [Google Scholar] [CrossRef]
  41. Son, T.; Lee, C.; Moon, G.; Lee, D.; Cheong, E.; Kim, D. Enhanced surface plasmon microscopy based on multi-channel spatial light switching for label-free neuronal imaging. Biosens. Bioelectron. 2019, 146, 111738. [Google Scholar] [CrossRef] [PubMed]
  42. Shi, C.; Wu, J.B.; Pan, D. Review on near-infrared heptamethine cyanine dyes as theranostic agents for tumor imaging, targeting, and photodynamic therapy. J. Biomed. Opt. 2016, 21, 050901. [Google Scholar] [CrossRef] [PubMed]
  43. Hong, G.; Antaris, A.L.; Dai, H. Near-infrared fluorophores for biomedical imaging. Nat. Biomed. Eng. 2017, 1, 10. [Google Scholar] [CrossRef]
  44. D’Orlando, A.; Mevellec, J.-Y.; Louarn, G.; Humbert, B. Atomic force microscopy nanomanipulation by confocal Raman multiwavelength spectroscopy: Application at the monitoring of resonance profile excitation changes of manipulated carbon nanotube. J. Phys. Chem. 2020, 124, 2705–2711. [Google Scholar] [CrossRef]
  45. D’Orlando, A.; Bayle, M.; Louarn, G.; Humbert, B. AFM-nano manipulation of plasmonic molecules used as “Nano-Lens” to enhance Raman of individual nano-objects. Materials 2019, 12, 1372. [Google Scholar] [CrossRef] [Green Version]
  46. Heeg, S.; Clark, N.; Vijayaraghavan, A. Probing hotspots of plasmon-enhanced Raman scattering by nanomanipulation of carbon nanotubes. Nanotechnology 2018, 29, 465710. [Google Scholar] [CrossRef]
  47. Simoncelli, S.; Li, Y.; Cortés, E.; Maier, S.A. Nanoscale Control of Molecular Self-Assembly Induced by Plasmonic Hot-Electron Dynamics. ACS Nano 2018, 12, 2184–2192. [Google Scholar] [CrossRef] [Green Version]
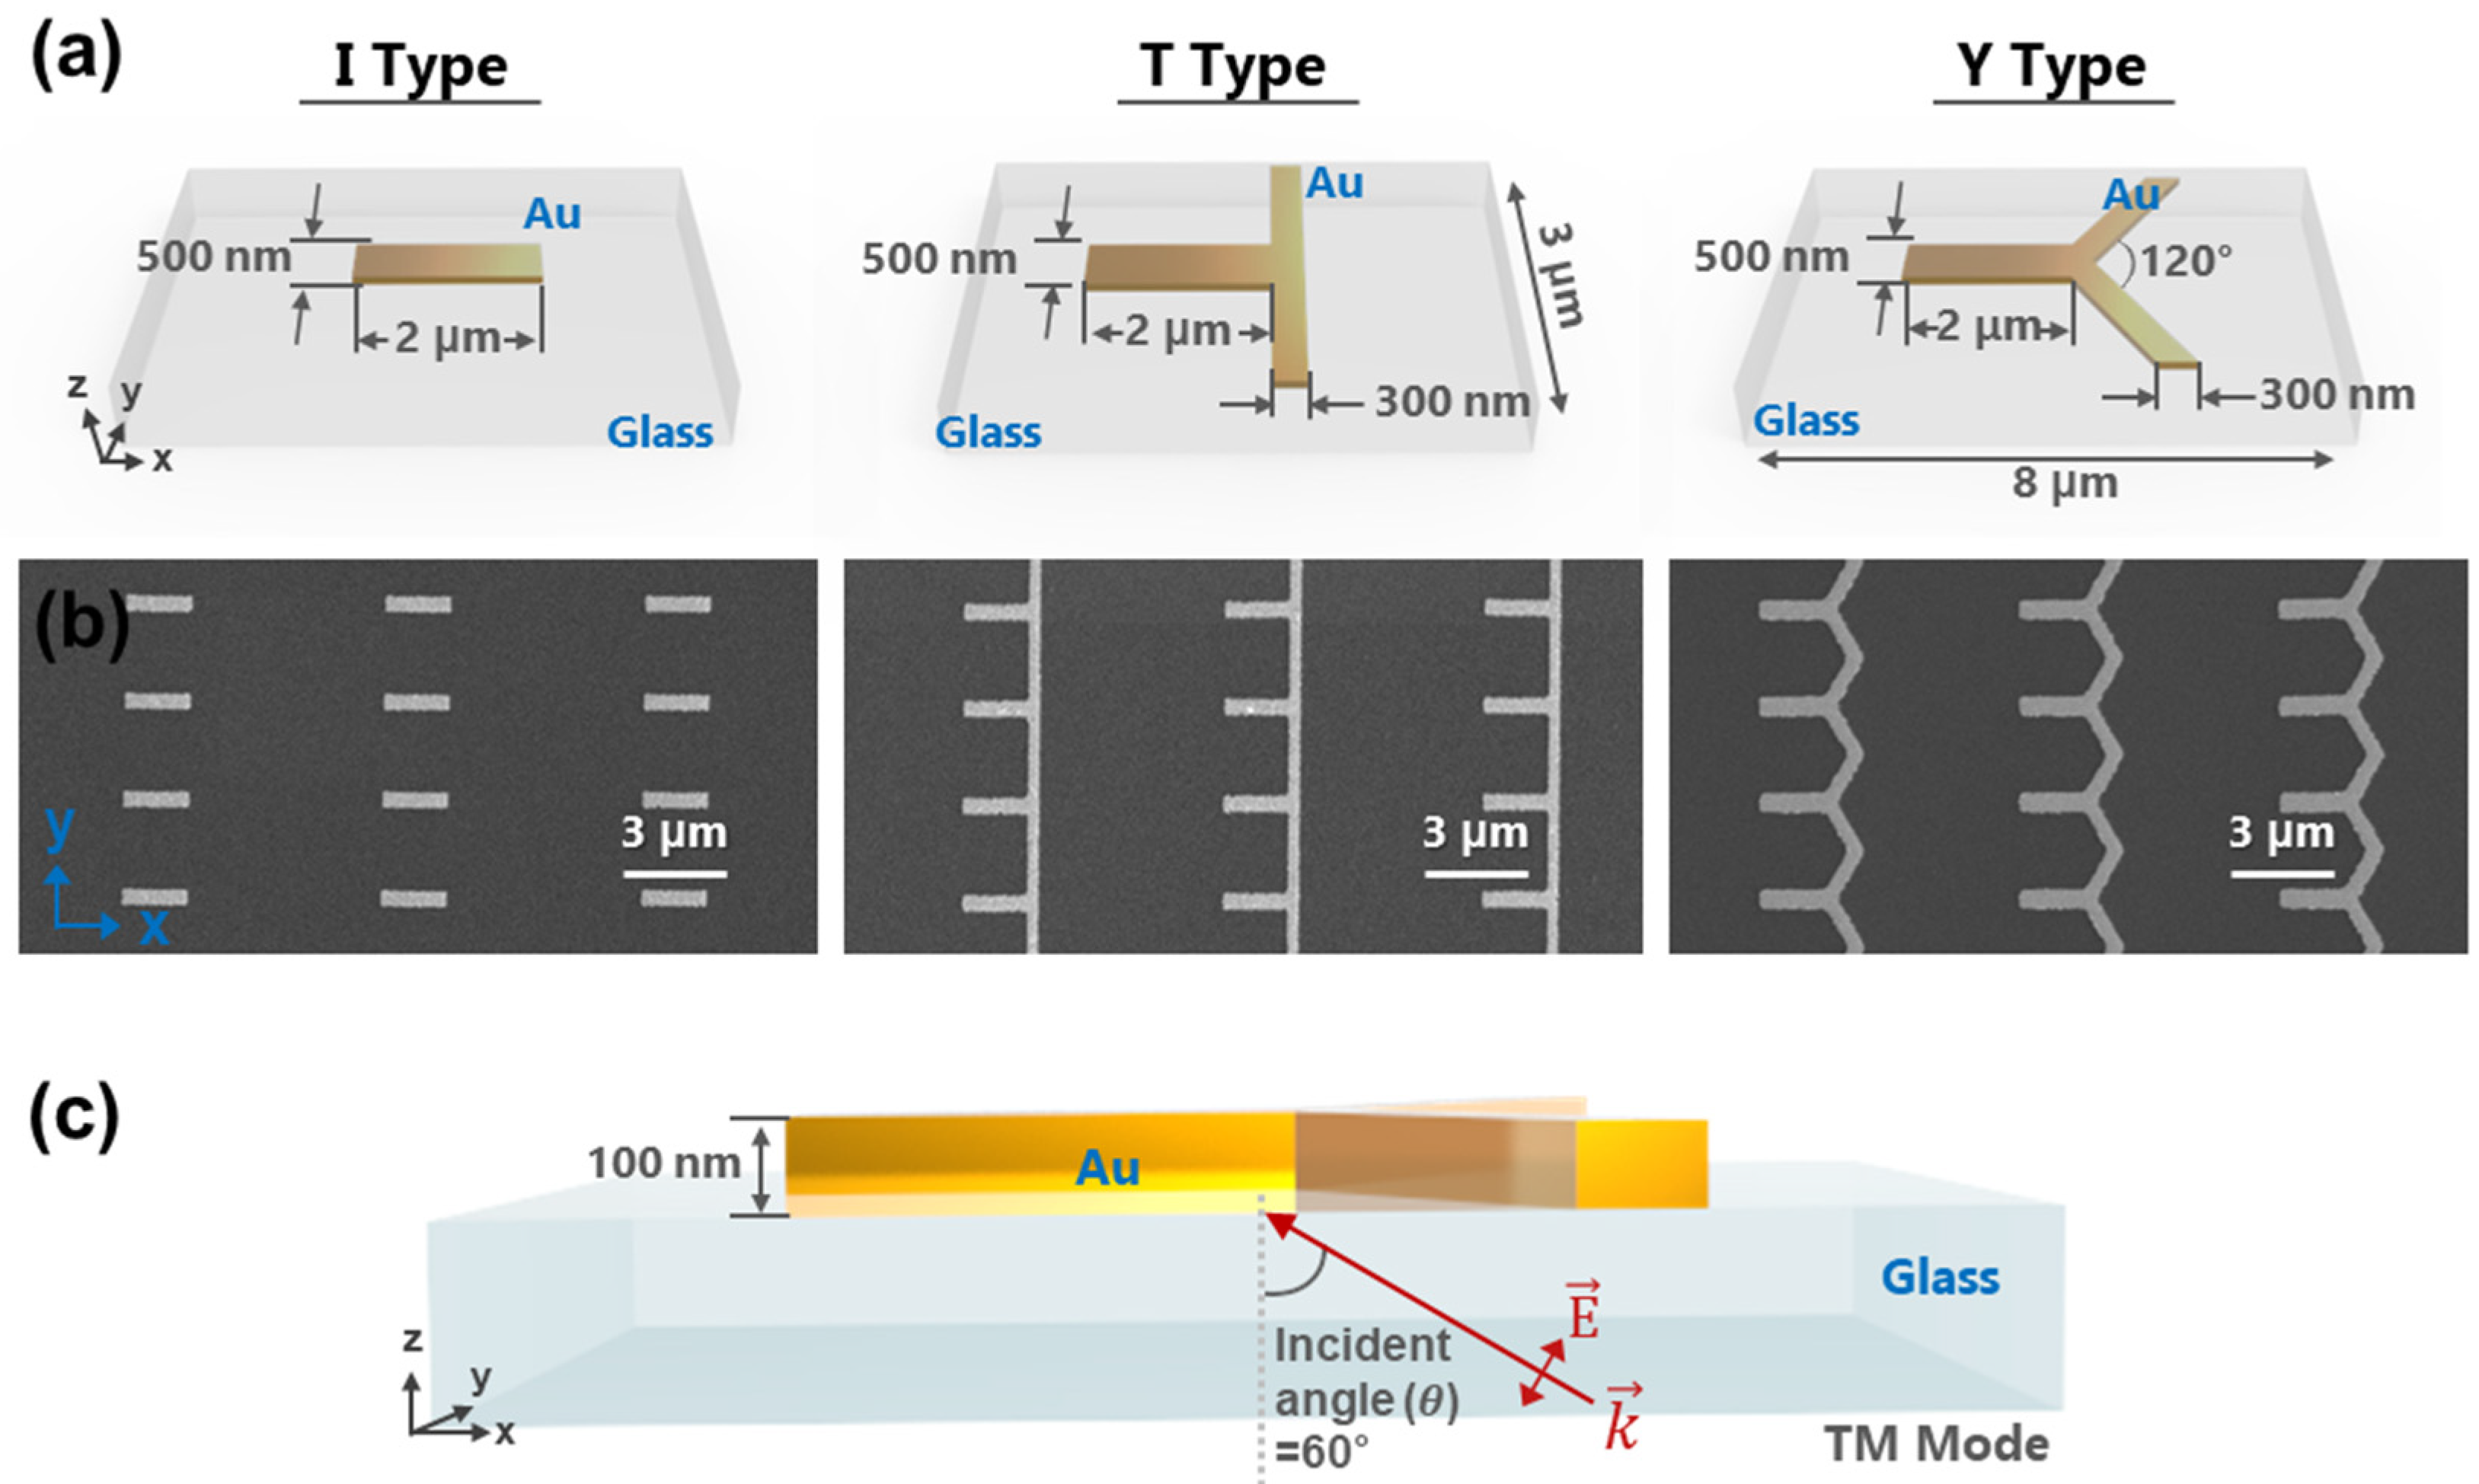
Figure 1. (a) Schematics and specifications of I-, T-, and Y-shaped gold nanostructures applied in numerical simulations of plasmonic fields. The period of each nanostructure was 3-μm long and 8-μm wide. (b) SEM images of I-, T-, and Y-shaped nanostructures fabricated by electron-beam lithography to validate that each nanostructure can be established. (c) Schematic of simulation conditions under which light enters the nanostructures. The thickness of each nanostructure was 100 nm.
Applsci 11 09133 g001
Figure 2. Simulation results of plasmonic near-field electromagnetic fields distributions for I-shaped nanostructure arrays by incident light with wavelengths of (a) 1550, (b) 1310, (c) 1064, and (d) 808 nm. Intensities of localized electromagnetic fields at (e) the edge (profiled line (1)) and (f) the center (profile line (2)). The information of incident light source is indicated in (b).
Applsci 11 09133 g002
Figure 3. Simulation results of plasmonic near-field electromagnetic fields distributions for T-shaped nanostructure arrays by incident light with wavelengths of (a) 1550, (b) 1310, (c) 1064, and (d) 808 nm. Intensities of localized electromagnetic fields at (e) the edge (profiled line (1)) and (f) the center (profile line (2)). The information of incident light source is indicated in (b).
Applsci 11 09133 g003
Figure 4. Simulation results of plasmonic near-field electromagnetic fields distributions for T-shaped nanostructure arrays by incident light with wavelengths of (a) 1550, (b) 1310, (c) 1064, and (d) 808 nm. (e) Intensities of localized electromagnetic fields at (e) the edge (profiled line (1)) and (f) the center (profile line (2)). The information of incident light source is indicated in (b).
Applsci 11 09133 g004
Figure 5. A front view of schematic is shown in (a). The TE mode of incident light at 60 incident angle degree is illustrated. Top view of calculated results of plasmonic near-field electromagnetic fields distributions for (b) I-, (c) T-and (d) Y-shaped nanostructure arrays by TE mode incident light with wavelengths of 1550 nm (first row), 1310 nm (second row), 1064 nm (third row), and 808 nm (fourth row) maintaining 60 angle degree of incident angle (incident angle in xz-plane). The information of incident light source is indicated in (b).
Applsci 11 09133 g005
Figure 6. The effects of the incident light source orientation while maintaining TM mode and the incident angle as 60°. The schematic images of the front and bottom views are shown on the left. In the bottom view, the thick red arrows with respect to the direction of the incident light source and the black of the lowercase label identify the direction of the incident angle on the xy-plane and match the calculation results on the right side marked with the same label (aj). In the calculation data, the angle written in white indicates the orientation of the incident light source in xy-plane which measured from horizontal x-axis.
Applsci 11 09133 g006
Publisher’s Note: MDPI stays neutral with regard to jurisdictional claims in published maps and institutional affiliations.