Featured Application
Microfluidic device for high-throughput drug screening in a complex microenvironment of tumor tissue that allows rapid development of new antineoplastic agents.
Abstract
The aim of our research was to develop a numerical model of microflows occurring in the culture chambers (CC) of a microfluidic device of our construction for high-throughput drug screening. The incompressible fluid flow model is based on the lattice-Boltzmann equation, with an external body force term approximated by the He-Shan-Doolen scheme and the Bhatnagar-Gross-Krook approximation of the collision operator. The model accuracy was validated by the algebraic solution of the Navier–Stokes equation (NSE) for a fully developed duct flow, as well as experimentally. The mean velocity prediction error for the middle-length cross-section of CC was 1.0%, comparing to the NSE algebraic solution. The mean error of volumetric flow rate prediction was 6.1%, comparing to the experimental results. The analysis of flow hydrodynamics showed that the discrepancies from the plug-flow-like velocity profile are observed close to the inlets only, and do not influence cell cultures in the working area of CC. Within its workspace area, the biochip provides stable and homogeneous fully developed laminar flow conditions, which make the procedures of gradient generation, cell seeding, and cell-staining repeatable and uniform across CC, and weakly dependent on perturbations.
1. Introduction
Flows in microsystems, to a large degree, are influenced by boundaries, much more than macro-flows. It is not only because of a large surface-to-volume ratio, but also due to high-velocity gradients that can be easily achieved through microchannels, even in the Stokes flow regime () at low mean fluid velocities ( m/s) [1]. The phenomena are the basis of inertial microfluidic platforms. Additionally, in the intermediate range of laminar flow (~1 < Re < ~100), nonlinear and irreversible motions of fluid and particles [2,3] are observed. Moreover, in the laminar flow regime, geometry-induced flow patterns are commonly observed and employed, e.g., secondary flow in curved channels (Dean flow) for fluid mixing [4] and particle separation [5], or lateral flow, serpentine flow, pinched flow, multi-orifice flow, etc., for cell sorting [6]. The channels’ inlets and outlets can also play a significant role in forming the flow structure, especially in short and wide channels such as cell culture chambers (CC), but there is a lack of analysis in the literature of such effects.
As in our invented microdevice, the advective flow of medium in CC is responsible for gradient generation and can influence cytotoxicity, mortality, and morphology cells [7], we will precisely analyze the hydrodynamics of fluid flow in CC using our computational fluid dynamics (CFD) tool Microflow 3D, that is a lattice-Boltzmann method (LBM) solver designed for flow simulations in microsystems and circulatory systems. Recently, the LBM method has been successfully applied for analysis of the transport of particles and fluids through multichannel microfluidic networks [8] or droplets’ formation and manipulation in lab-on-a-chip microfluidic systems [9,10], and also to analyze the particle inertia and volume fraction effects on colliding particle-pairs in turbulent microflows [11]. The superiority of LBM over other CFD methods lies in the locality of the algorithm. Interactions between nodes are entirely linear, while the method’s non-linearity enters a local collision process within each node [12]. This property makes the LBM very amenable to high-performance computing on parallel architectures, including GPUs [13,14]. The key advantage of LBM from the viewpoint of microfluidics is the adequacy for simulation of mesoscopic physics and multi-scale effects, which are hard to describe macroscopically.
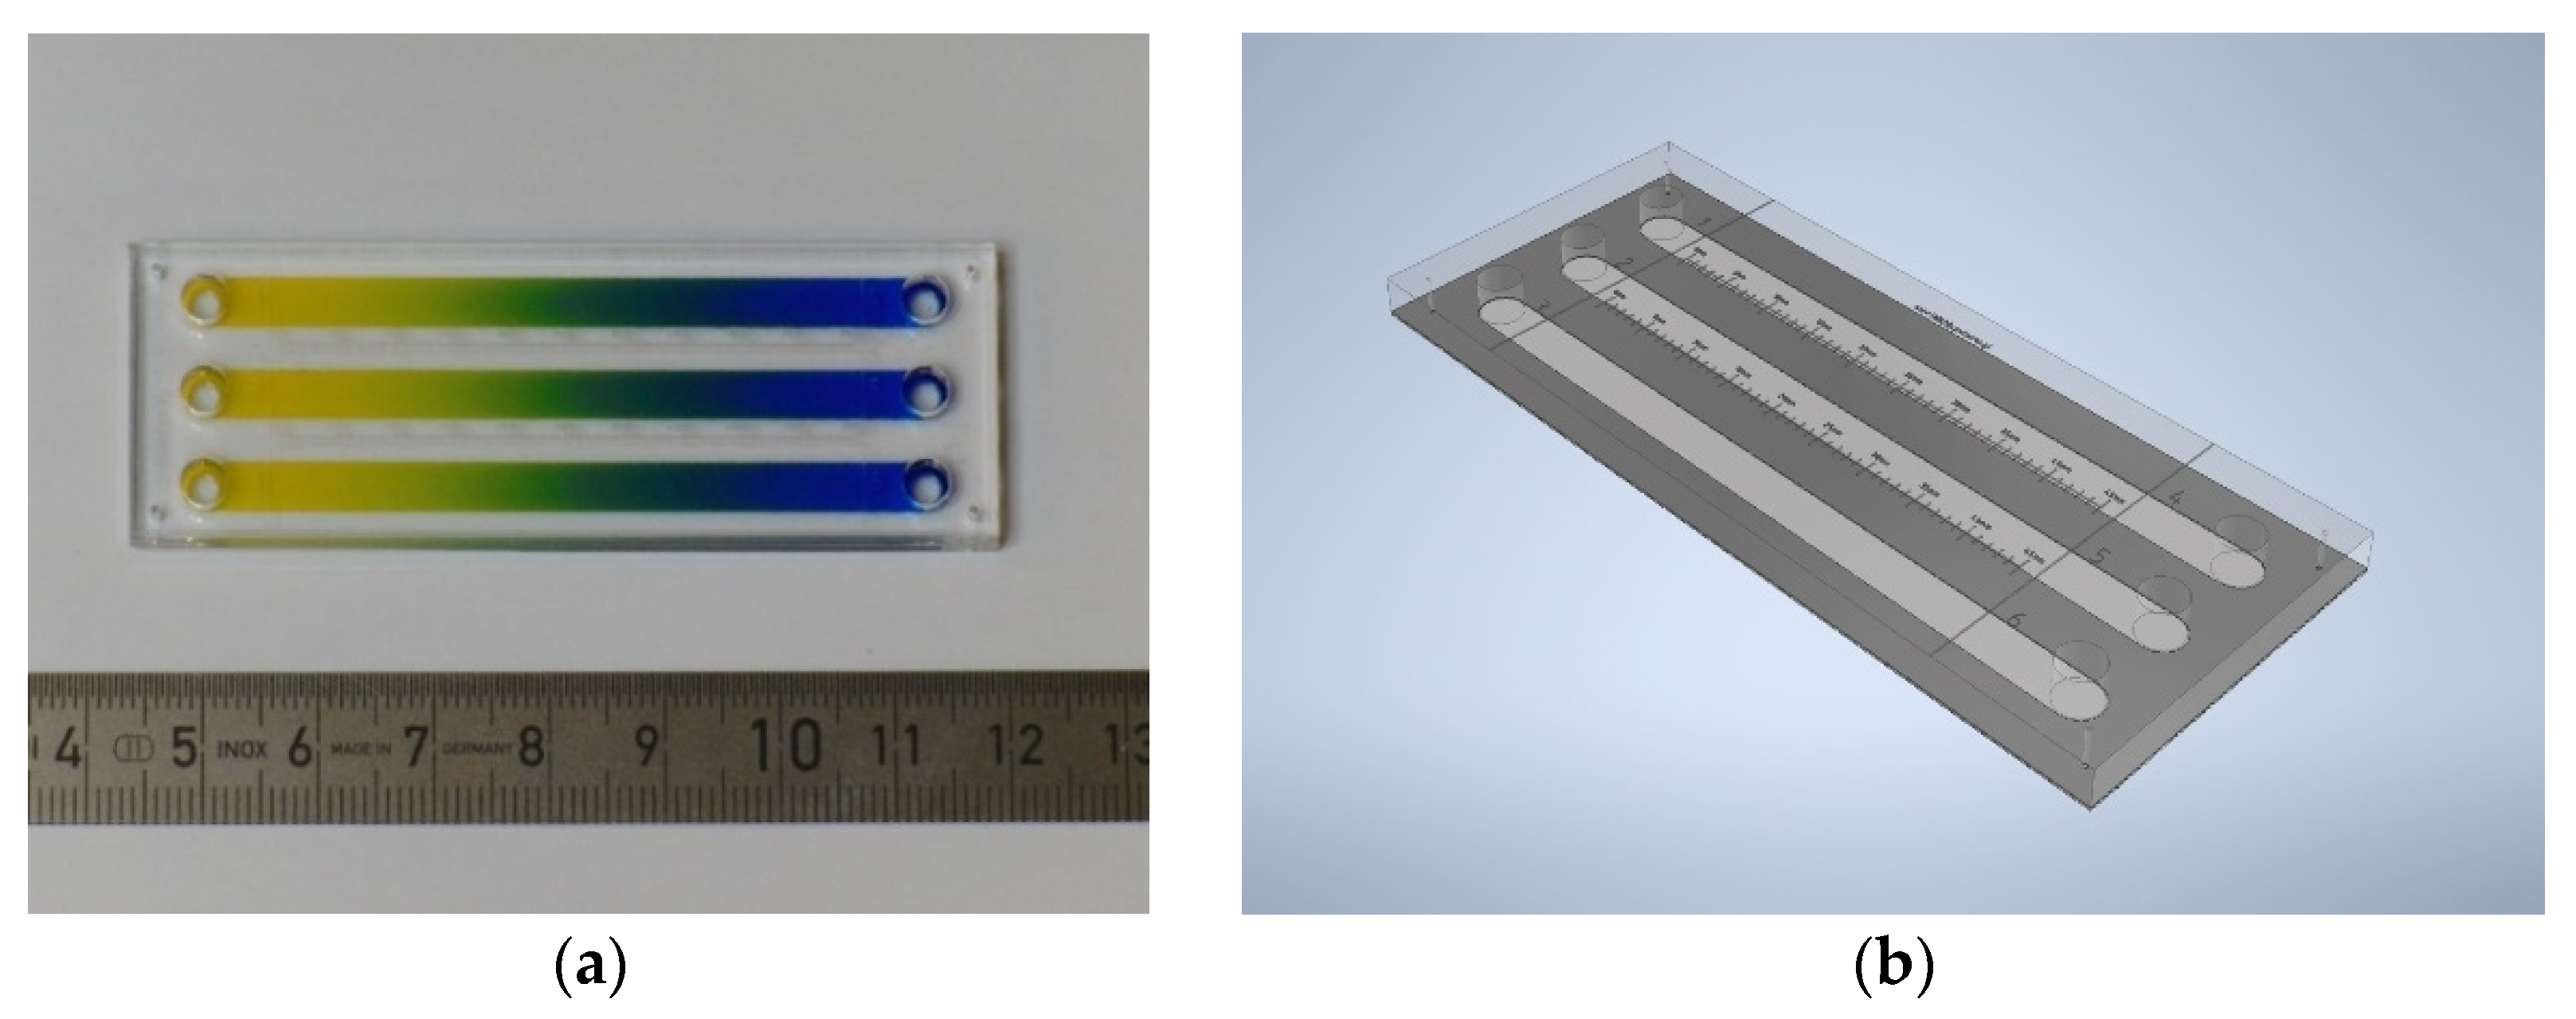
Lab-on-a-chip devices, in particular biochips, have become a powerful analytical tool that brings together multiple disciplines for biomedical research and has the advantages of miniaturization, automation, integration, and portability [15]. They are natural candidates for a future replacement of standard laboratory equipment and protocols in drug development pipelines. Currently, in vivo animal models are commonly used for preclinical drug validation, but only 8% of successful animal trials for cancer drugs translate to successful human clinical trials due to specific differences in physiology and cell biology [16]. Due to ethical issues, high costs, and inconvenience of animals’ breeding, there has been increasing research in mimicking in vivo conditions with micro-physiological systems (MPS), such as tissue-on-a-chip and organ-on-a-chip [17,18]. MPS models are able to recapitulate the function of human organs and tissues with so far unreachable accuracy, which offers a chance of reduction of present high failure rates in drug development pipelines [19]. Recently, we have developed a simple construction biochip for high-throughput drug screening (HTS). The chip mimics a complex microenvironment of tumor tissue with greater accuracy than standard multi-well-plate cultures, offering at the same time even higher throughput with the same ease of use. The biochip with a developed gradient of dyes is presented in Figure 1. The main structural elements of the microsystem are three identical cell culture chambers with dimensions of 59/4.1/0.13 mm (L/W/H). A detailed discussion of chip design as well as analytical and cell culture procedures was presented in the previous publication [20].
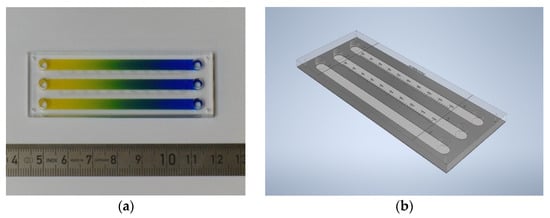
Figure 1.
Microfluidic device for cell culture in a gradient of the active substance: (a) Photography of microdevice with developed counter-current gradients of two dyes in CC. (b) 3D drawing of the microdevice.
The device’s simple operation protocols do not require specialized equipment (actuators, pumps, control valves) or costly automated equipment, such as a pipetting robot. The principle of operation of the device is based on the fast-convective generation of a linear concentration gradient of an active substance along the CC by a simple alternating tilting of the chip. It makes this solution an attractive alternative for standard multi-well-plate cultures broadly used in routine drug screening tests. However, before the device can be put on the market, it is necessary to verify if it meets all the important factors that have been identified by the U.S. Food and Drug Administration (FDA) for devices and procedures used in drug discovery pipelines. One of them is robustness. The robustness of an analytical procedure is a measure of its capacity to remain unaffected by small but deliberate variations in method parameters, and provides an indication of its reliability during normal usage [21,22]. It means that we have to know whether the small perturbations in device operation could significantly affect the analysis precision and test procedure performance. To get it right, we have to analyze and understand the principles of device operation—the hydrodynamics of flow in CC, which is responsible for convective gradient generation, uniformity of cell seeding, and their correct staining.
In this study, we will analyze the hydrodynamics of fluid flow in the device’s CC by performing CFD simulations based on the lattice-Boltzmann model of incompressible flow with an external force term. The simulation results will be validated experimentally and compared to the algebraic solution of the Navier–Stokes equation (NSE) for a fully developed duct flow. The simulation results, along with experimental data, will allow us to thoroughly analyze the flow parameters of our device.
2. Description of Model and Simulation Parameters
Microflow 3D (MF3D) is open-source, distributed under a permissive free software license, and is written in C++ code for transient flow simulations in complex sparse geometries. We developed and distributed it at the Wroclaw University of Science and Technology. The current version, MF3D 1.1, is available for download from http://www.microflow.pwr.edu.pl (accessed on 10 September 2021). The code was validated, and solution accuracy was proven for the microchannel flow test case. Depending on convergence criteria, the mean relative velocity distribution and pressure drop errors for the test case (square duct) are between 0.06–0.14% and about 0.35%, respectively [23]. These error levels result from the accuracy of the mapping of geometry and are readily acceptable for engineering simulations.
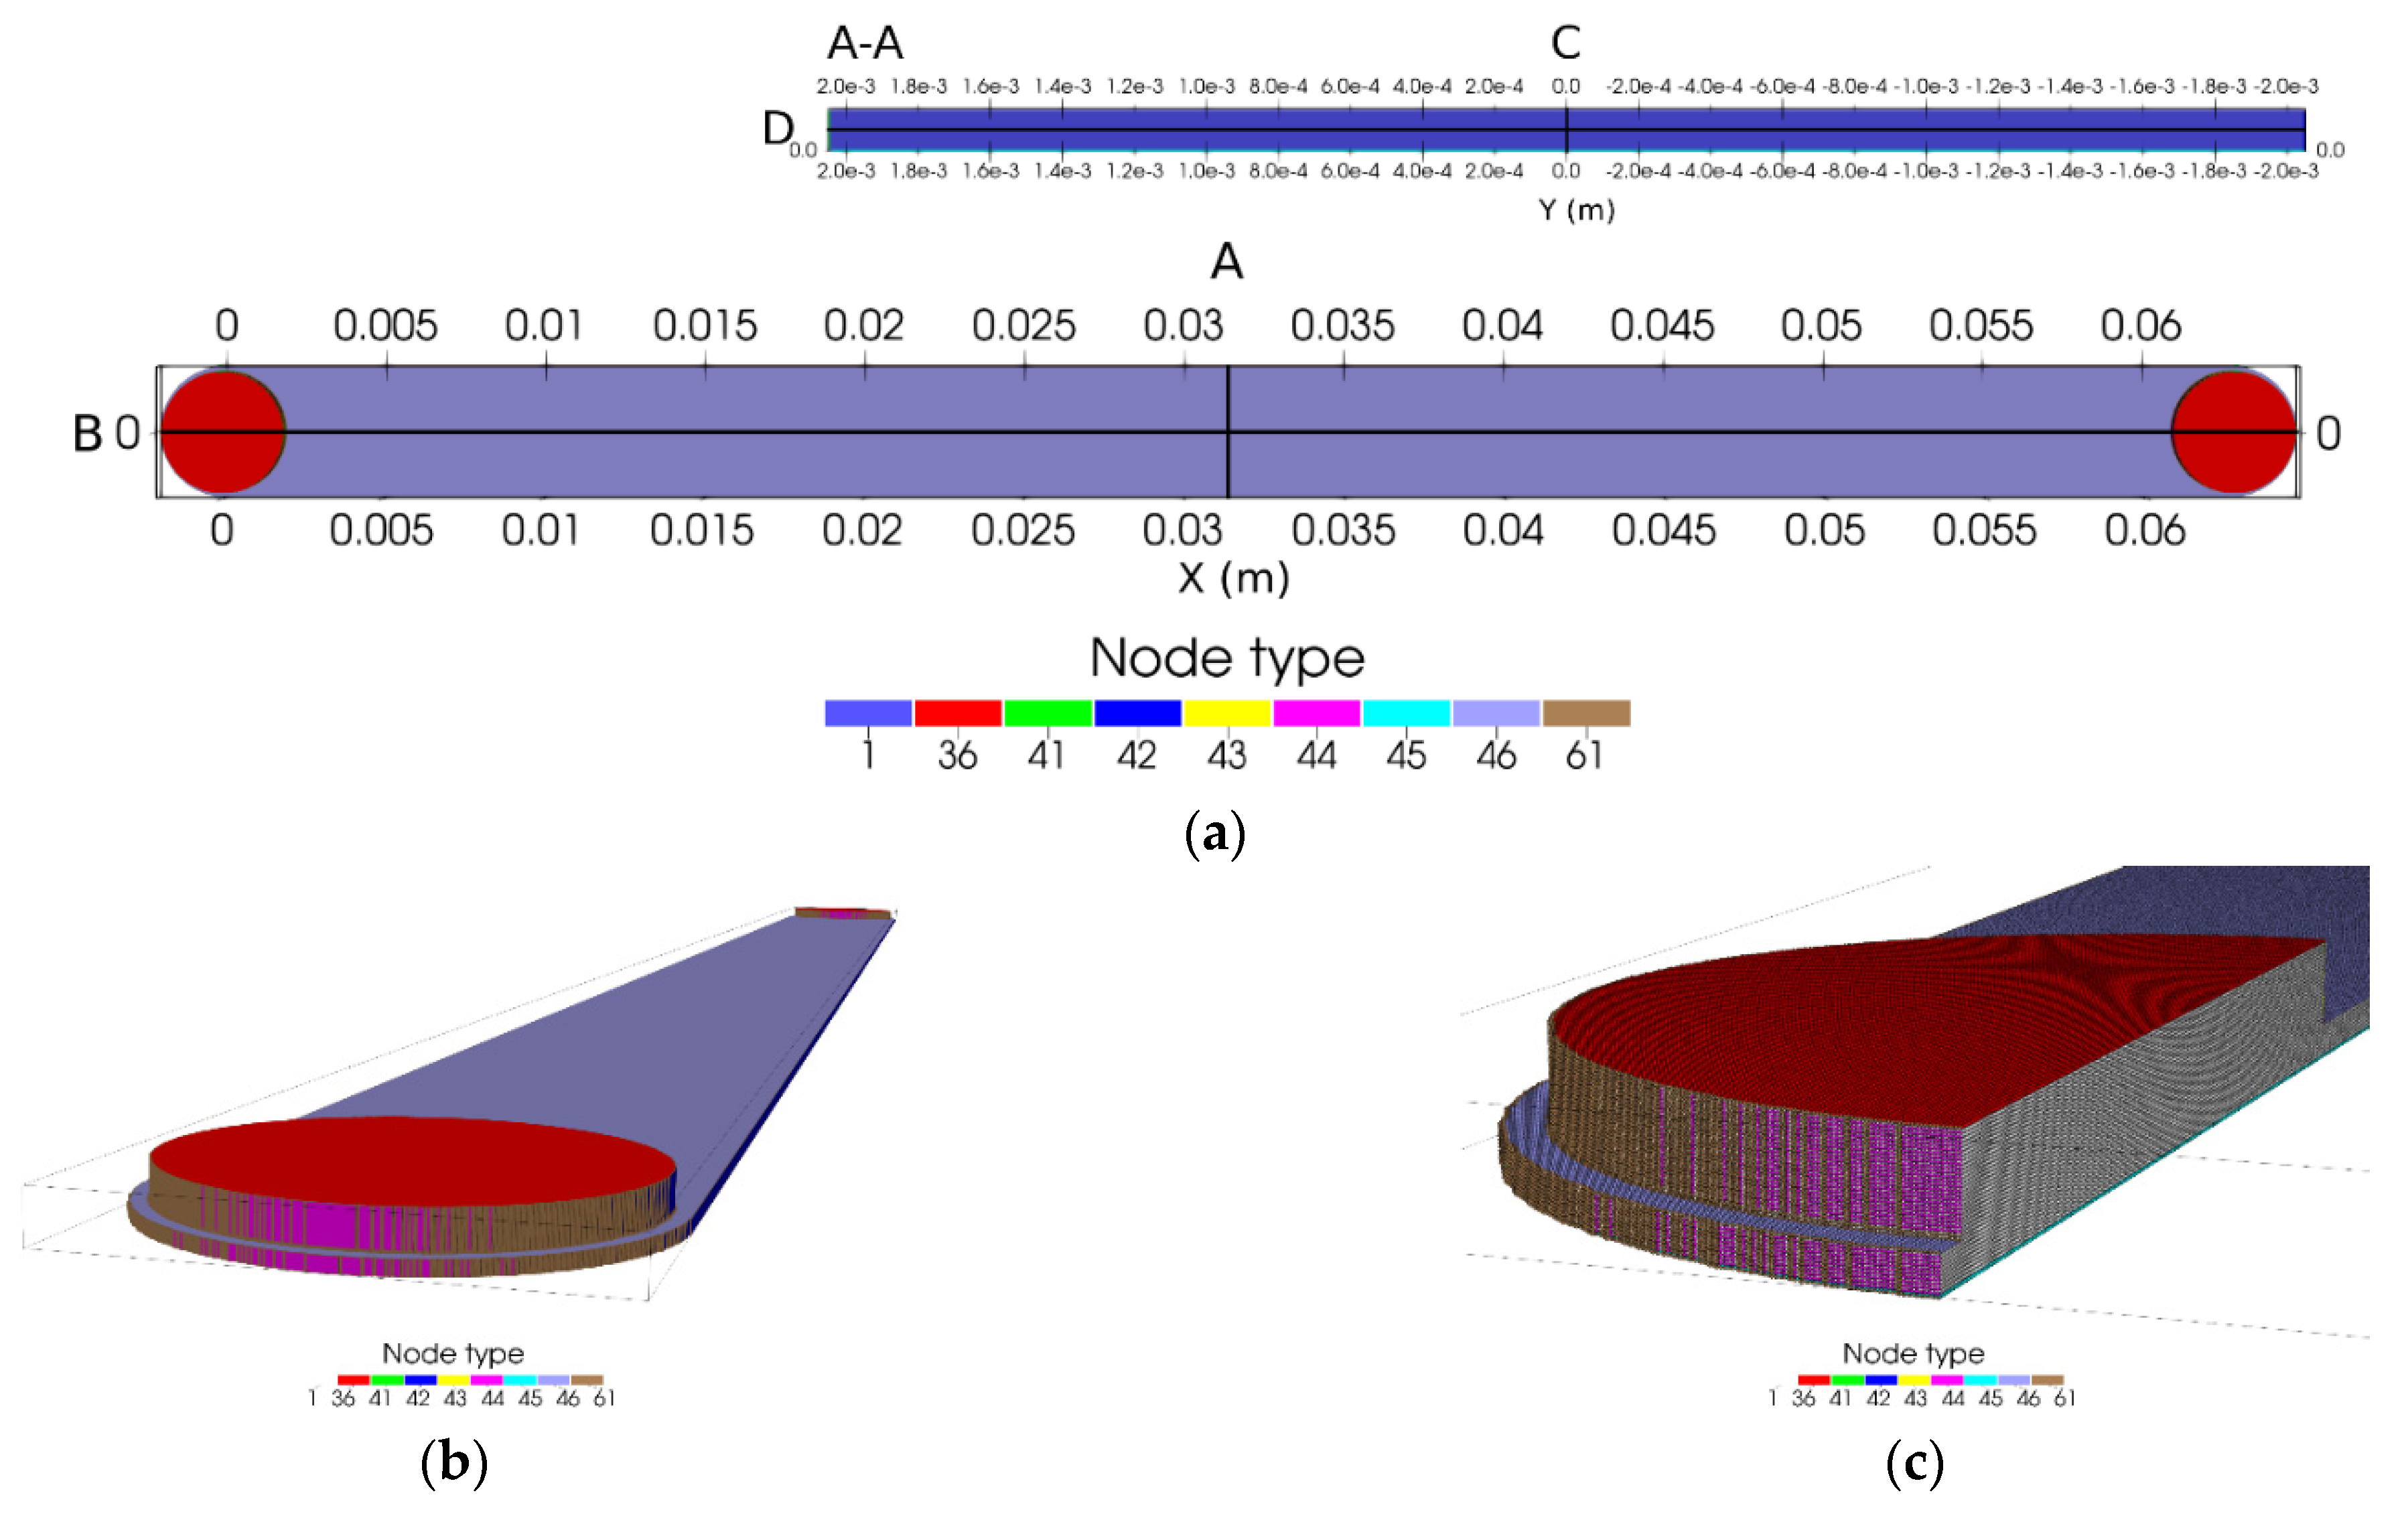
Preparing a new case for CFD simulations begins with geometry definition and meshing. The geometry of one channel was prepared in OpenSCAD and written in stl file format, surface mesh (Supplementary File S1). The volumetric structured Cartesian grid was automatically generated in MF3D based on the loaded surface mesh and was written in vti format for further visualization and analysis in ParaView. The numerical grid used in simulations is presented in Figure 2, where the distributions of nodes with distinction to their type are presented. Grid statistics: total number of computational nodes 24,693,507, number of fluid (type 1) nodes 20,752,599, number of full-way bounce-back (type 61) nodes 86,458, number of “velocity 0” (type 40) nodes 3,698,909, and number of pressure (type 30) nodes 155,541. The ratio of boundary nodes to the total number of computational nodes (%) = 15.96. The height and width of the CC in lattice units (lu) were 10 and 342 (11 and 343 computational nodes), respectively. A personal computer equipped with Intel Core i9-9900K CPU 3.60 GHz × 8, 32 Gb of DDR4 3000 MT/s, working under the control of Linux Mint 19 Tara, was used for solving the model. The converged solution was obtained after 54,000 steps (9.5 h of computation), with the mean computations’ performance of 38.5 MLUPS (Million Lattice Updates per Second).

Figure 2.
The numerical grid: (a) View from the top; (b) View from the side; (c) The cross-section through the reservoir. Grid nodes colored by node type: 1—fluid, 36—north pressure, 41–46—“velocity 0”, 61—full-way bounce-back. (A, B) Cross-section planes. A-A cross-section through A plane. (C, D) Lines placed in axes. The channel length is on the X-axis, the channel width is on the Y-axis, and the channel height is on the Z-axis.
For a description of the fluid flow phenomena in microchannels, we used the discretized in momentum space on the D3Q19 lattice form of the Boltzmann transport equation, called the lattice-Boltzmann equation (LBE) (Equation (1)). It can be seen as a kind of advection equation of the probability distribution function of fictitious particles, f (t, x, c), with an external body force term, that can be written for each i of Qm directions (lattice linkages) in velocity space as follows:
where x [xx, xy, xz] is a spatial point coordinate vector, ci [cx, cy, cz] is the lattice velocity vector: , where ei is the unit vector along the i lattice direction, is the lattice speed = 1 as δx and δt, that are respectively the lattice spacing and the lattice time step, and both equal 1, t represents time, F [Fx, Fy, Fz] is an external body force vector, Ω is the collision operator—a source term, which represents the local redistribution of f due to collisions, and ρ is a LB mass density:
u [ux,uy,uz] for incompressible fluid can be calculated from:
where and .
The collision operator, Ωi, was approximated with the most popular Bhatnagar-Gross-Krook model [24]:
and the external body force term in Equation (1) with the He-Shan-Doolen scheme (HSD) [25]:
where τ is the LB relaxation time related to the lattice fluid viscosity: and is the equilibrium distribution function along the i lattice direction given by the following formula for incompressible fluid [26]:
where cs is the lattice constant:, u is the macroscopic fluid velocity vector, and ωi is a weighting scalar for the i lattice direction.
In MF3D, all solution parameters are collected in case_params.cfg and thread_params.cfg (Supplementary Files S2 and S3). The flow simulations were performed for spontaneous gravitationally induced fluid flow in CC. The force density vector was calculated for the microsystem sloped at an angle of 30°: F = ρ × g = 1000 × 9.81 = 9810 (N/m3) (Fx = 4905, Fy = 0, Fz = −8495.7), and its constant value was fixed for the whole region. A free solution parameter—the relaxation time, τ—was set to 1.0. The solution termination criteria were set for scaled velocity residue to 1.0 × 10⁻⁷ and 0.1% for the mass flow balance error. The MF3D configuration files necessary to run the simulation are available in additional resources of the article (Supplementary File S4).
3. Results and Discussion
3.1. Model Validation
We have analyzed the liquid flow hydrodynamics in the device’s CC, performing numerical simulations of the LBM/CFD method for the same geometry and conditions as present in the device’s standard operation protocols [20]. The simulation results were compared with the experimentally determined overall volumetric flow rates of the fluid in CC. The average value of predicted velocity magnitude for the cross-section A (Figure 2) was 5.79 × 10⁻³ m/s, and its maximal value was observed in the channels’ axis as 8.93 × 10⁻³ m/s, which gives the value of mean volumetric flow rate in CC as 2.85 × 10⁻⁹ m3/s. This value is in good agreement with the experimentally determined volumetric flow rate, V, of cell culture medium in the microdevice’s CC, sloped at an angle of 30°. The median value of V for three different microsystems (CI–CIII), and the three repeats of experiments (1–3) for each device with five repetitions of measurement (45 points), was slightly higher, at 3.036 × 10⁻⁹ m3/s, with the standard deviation (SD) of 3.8% (Figure 3). Thus, the relative error of volumetric flow rate prediction was 6.1%, and it does not go beyond the acceptable ranges for engineering calculations. Looking at Figure 3, we can see that the determined values of flow fluctuations in CC are quite large (2.8–3.3 × 10⁻⁹ m3/s). The flow fluctuations are a well-known issue and source of errors in continuous-flow microsystems, where the very small flow rates have to be controlled and stabilized in time (at the level of microliters per second). Fortunately, this is not a problem for the proper operation of our solution, because the volumetric flow rate deviations do not affect changes of the shape of the velocity profile in CC as long as flows are laminar, and consequently do not have an impact on the proper development of a gradient. The median value of the Reynolds number calculated from experimentally determined flow rates is Re = 1.44, which confirms the deep laminar regime of the chip operation.
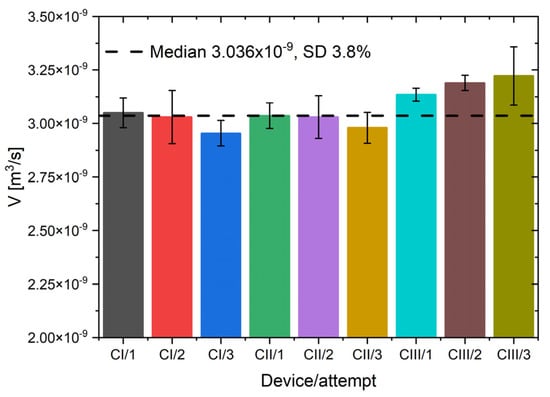
Figure 3.
The experimentally determined values of volumetric flow rates in CC for a device sloped at an angle of 30°.
In Figure 4, simulated velocity profiles are compared with an algebraic solution of the NSE for the rectangular duct (Equation (7)). The Poiseuille number, Po = 23.09, for the rectangular duct was calculated according to the formula provided by Shah and London [28]. The mean and median values of the relative velocity prediction error for the CC cross-section A (Figure 2) were 1.0% and 0.93%, respectively. Its maximal value reached 16.8%, but the minimal observed fluid velocity prediction error was only about 0.03%. The distribution of the relative error of the simulation is presented in Figure 5.
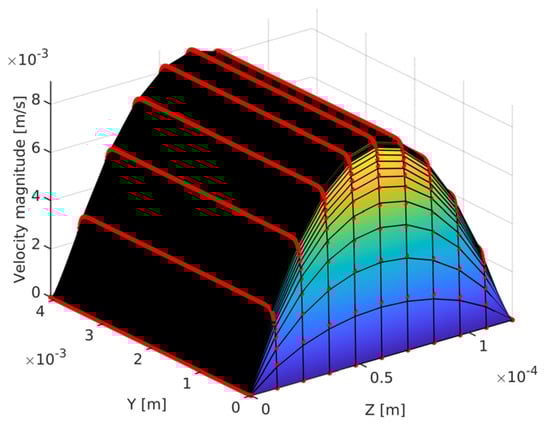
Figure 4.
Comparison of results of the simulation (red dots) with the algebraic solution of the NSE (surface plot). The cross-section A through the culture chamber.
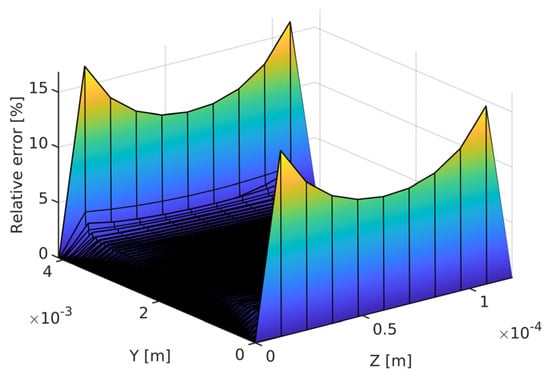
Figure 5.
The distribution of the relative error of the simulation (%). The cross-section A through the culture chamber.
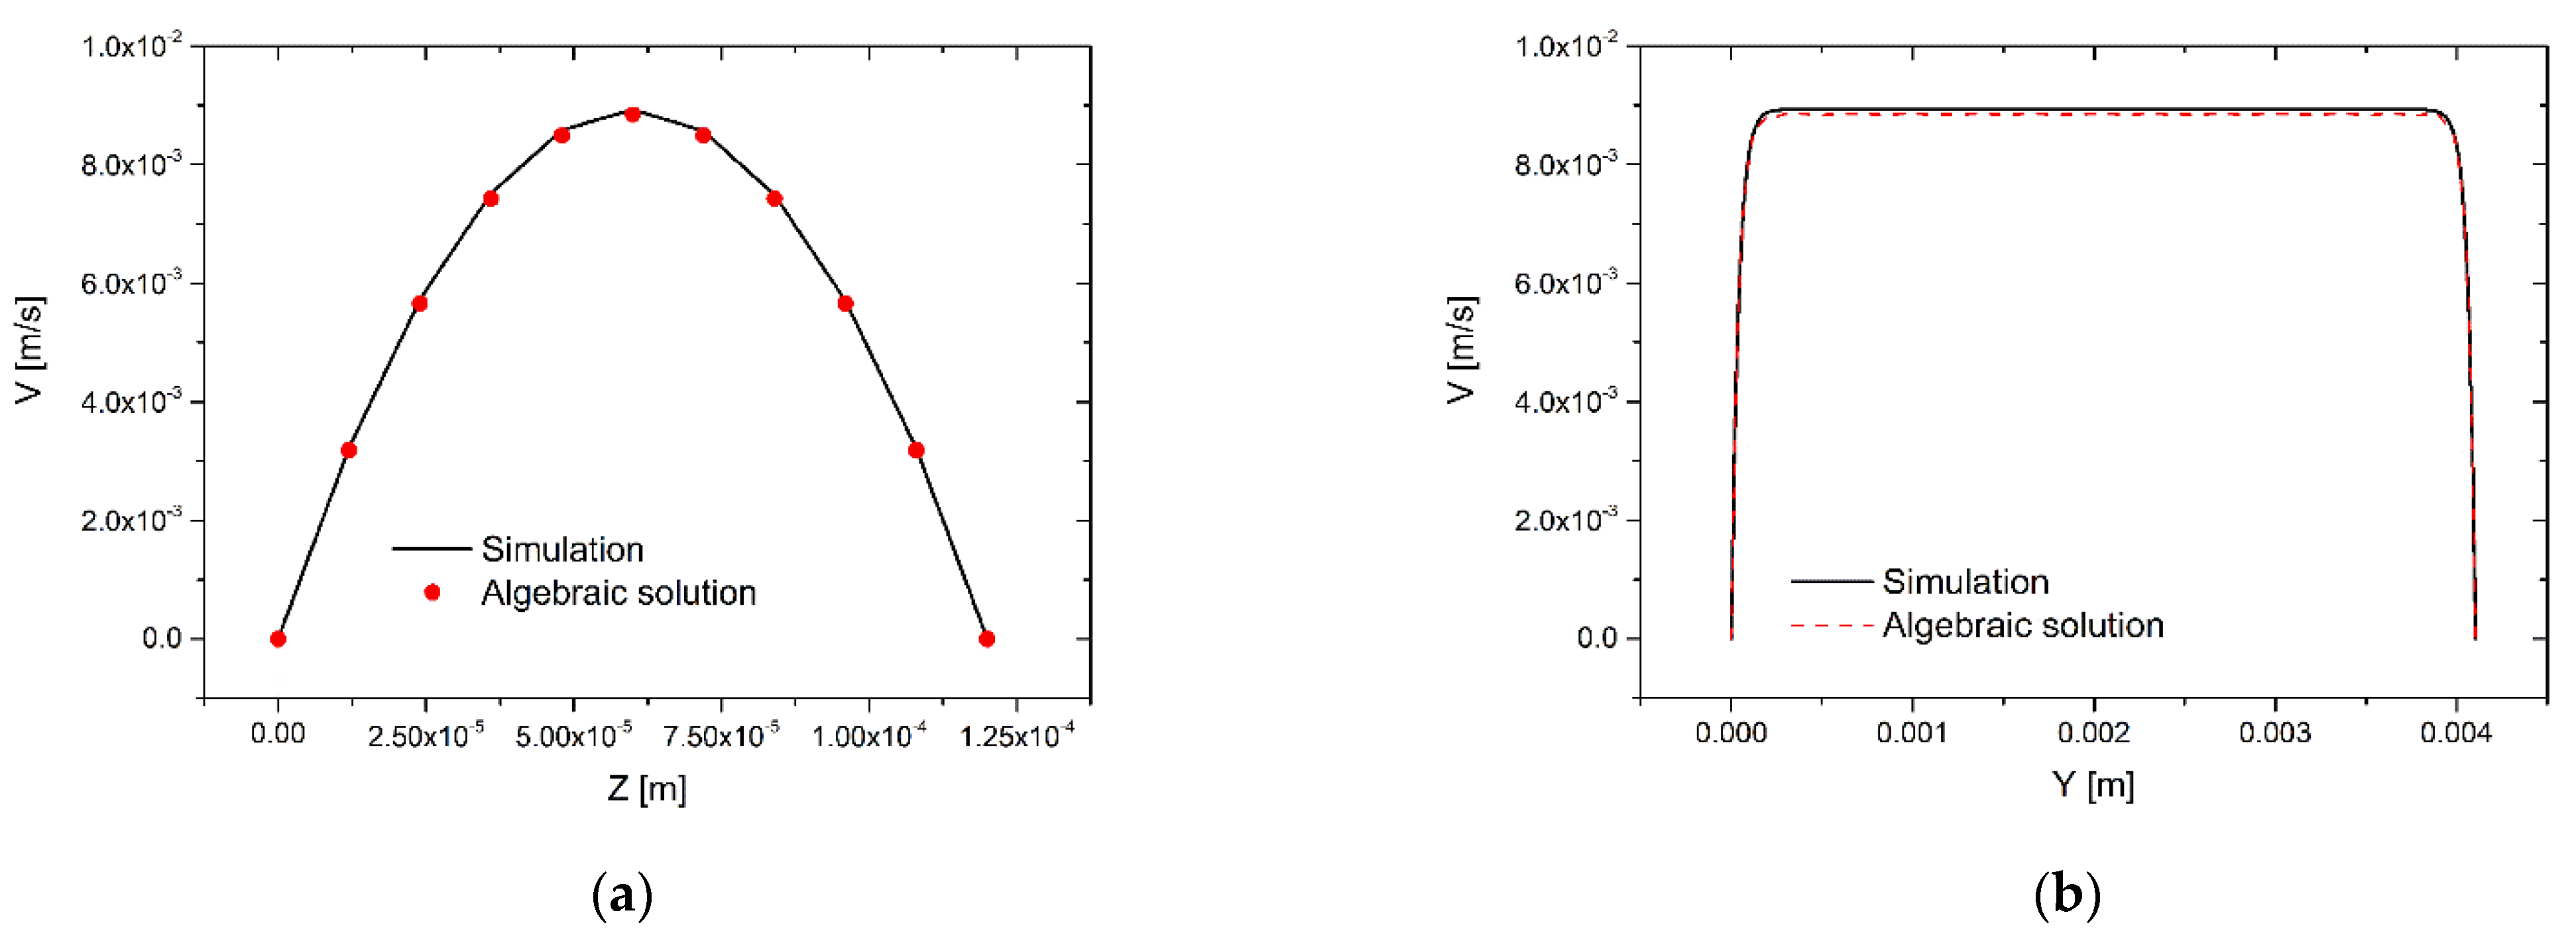
The largest difference between the simulation results and the algebraic solution of the NSE is noticed in the first row of nodes adjacent to the shortest edge of the duct (the height of the channel). For the axial lines C and D (Figure 2), the mean relative velocity prediction errors were 0.85% and 0.95%, respectively. The obtained fluid velocity profiles in CC are parabolic in the Z direction (C axial line) (Figure 6a), while in the Y direction (D axial line), they are nearly flat and correspond to the plug-flow profile (Figure 6b). The plug-flow-like profile is responsible for the even distribution of species across the CC, while the parabolic profile allows the development of the linear gradients along the CC during fluid reciprocating flow.
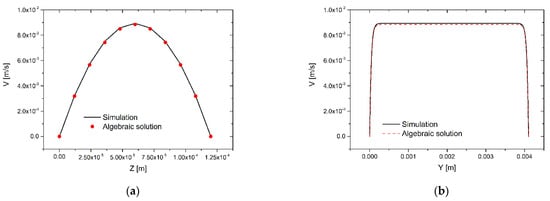
Figure 6.
Results of the simulation. Velocity profiles in a culture chamber of the microdevice: (a) plot over line C and (b) plot over line D.
The lattice-Boltzmann model of liquid flow in culture chambers of the microdevice predicts fluid velocity distributions with high accuracy. In regions where we could expect the almost fully developed velocity profile, the prediction error is less than 1%, compared to the analytical solution of NSE. This gives us the opportunity to investigate the effects of the chamber’s inlets and outlets on fluid velocity distributions and the shear stress distribution in CC in the next step. At the channels’ inlets/outlets, we cannot assume the fully developed velocity profiles, and the numerical solution of NS is the only way to correctly predict flow hydrodynamics.
3.2. Inlet and Outlet Effects
It is highly desired to have a flat velocity profile along the whole CC, as was shown in Figure 6b, since it allows for maintaining homogeneous conditions of cell culture across the chamber in the same cross-section, allowing to grow cells in the same microenvironment. Inlets and outlets disturb velocity profiles, but the small height of the channel promotes the development of a plug-flow-like profile in a short distance from inlets/outlets. It is interesting to distinguish how long the development regions are. As the flow enters a duct, the velocity profile begins to develop along its length, ultimately reaching the fully developed velocity profile. Almost all the analyses available in the literature neglected the inlet/outlet effects, but the relatively short length of the CC may mean that such disturbances may affect the culture microenvironment and consequently influence the results of tests performed on a chip.
In Figure 7, the distributions of magnitudes of the Z-direction velocity gradient, Vz, the dynamic pressure, PD, and the shear stress, τ, at the bottom surface of the CC are presented, where the cells adhere. Since shear stress, shear time, and pressure changes can severely affect cell viability, phenotype, and function [29,30], it is interesting to determine the ranges of the variability of these parameters under standard chip operating conditions. The distributions of such parameters in the working area of CC (between two vertical lines) are uniform in the Y direction, and vary only slightly in the X direction (Vz: 258–290 (1/s), PD: 0.4–5.2 (Pa), τ: 0.258–0.29 (Pa)). Bearing in mind that the flow exerts on cells only for a very short period of time, when gradients in CC are generated, we can definitely say that its influence on cells is negligible in standard operating conditions.
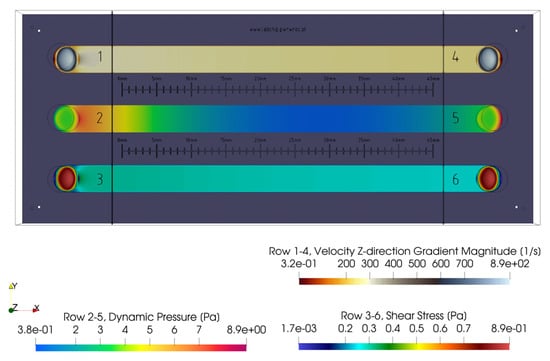
Figure 7.
Z-direction velocity gradient magnitude, dynamic pressure, and shear stress distributions at the bottom surface of CC.
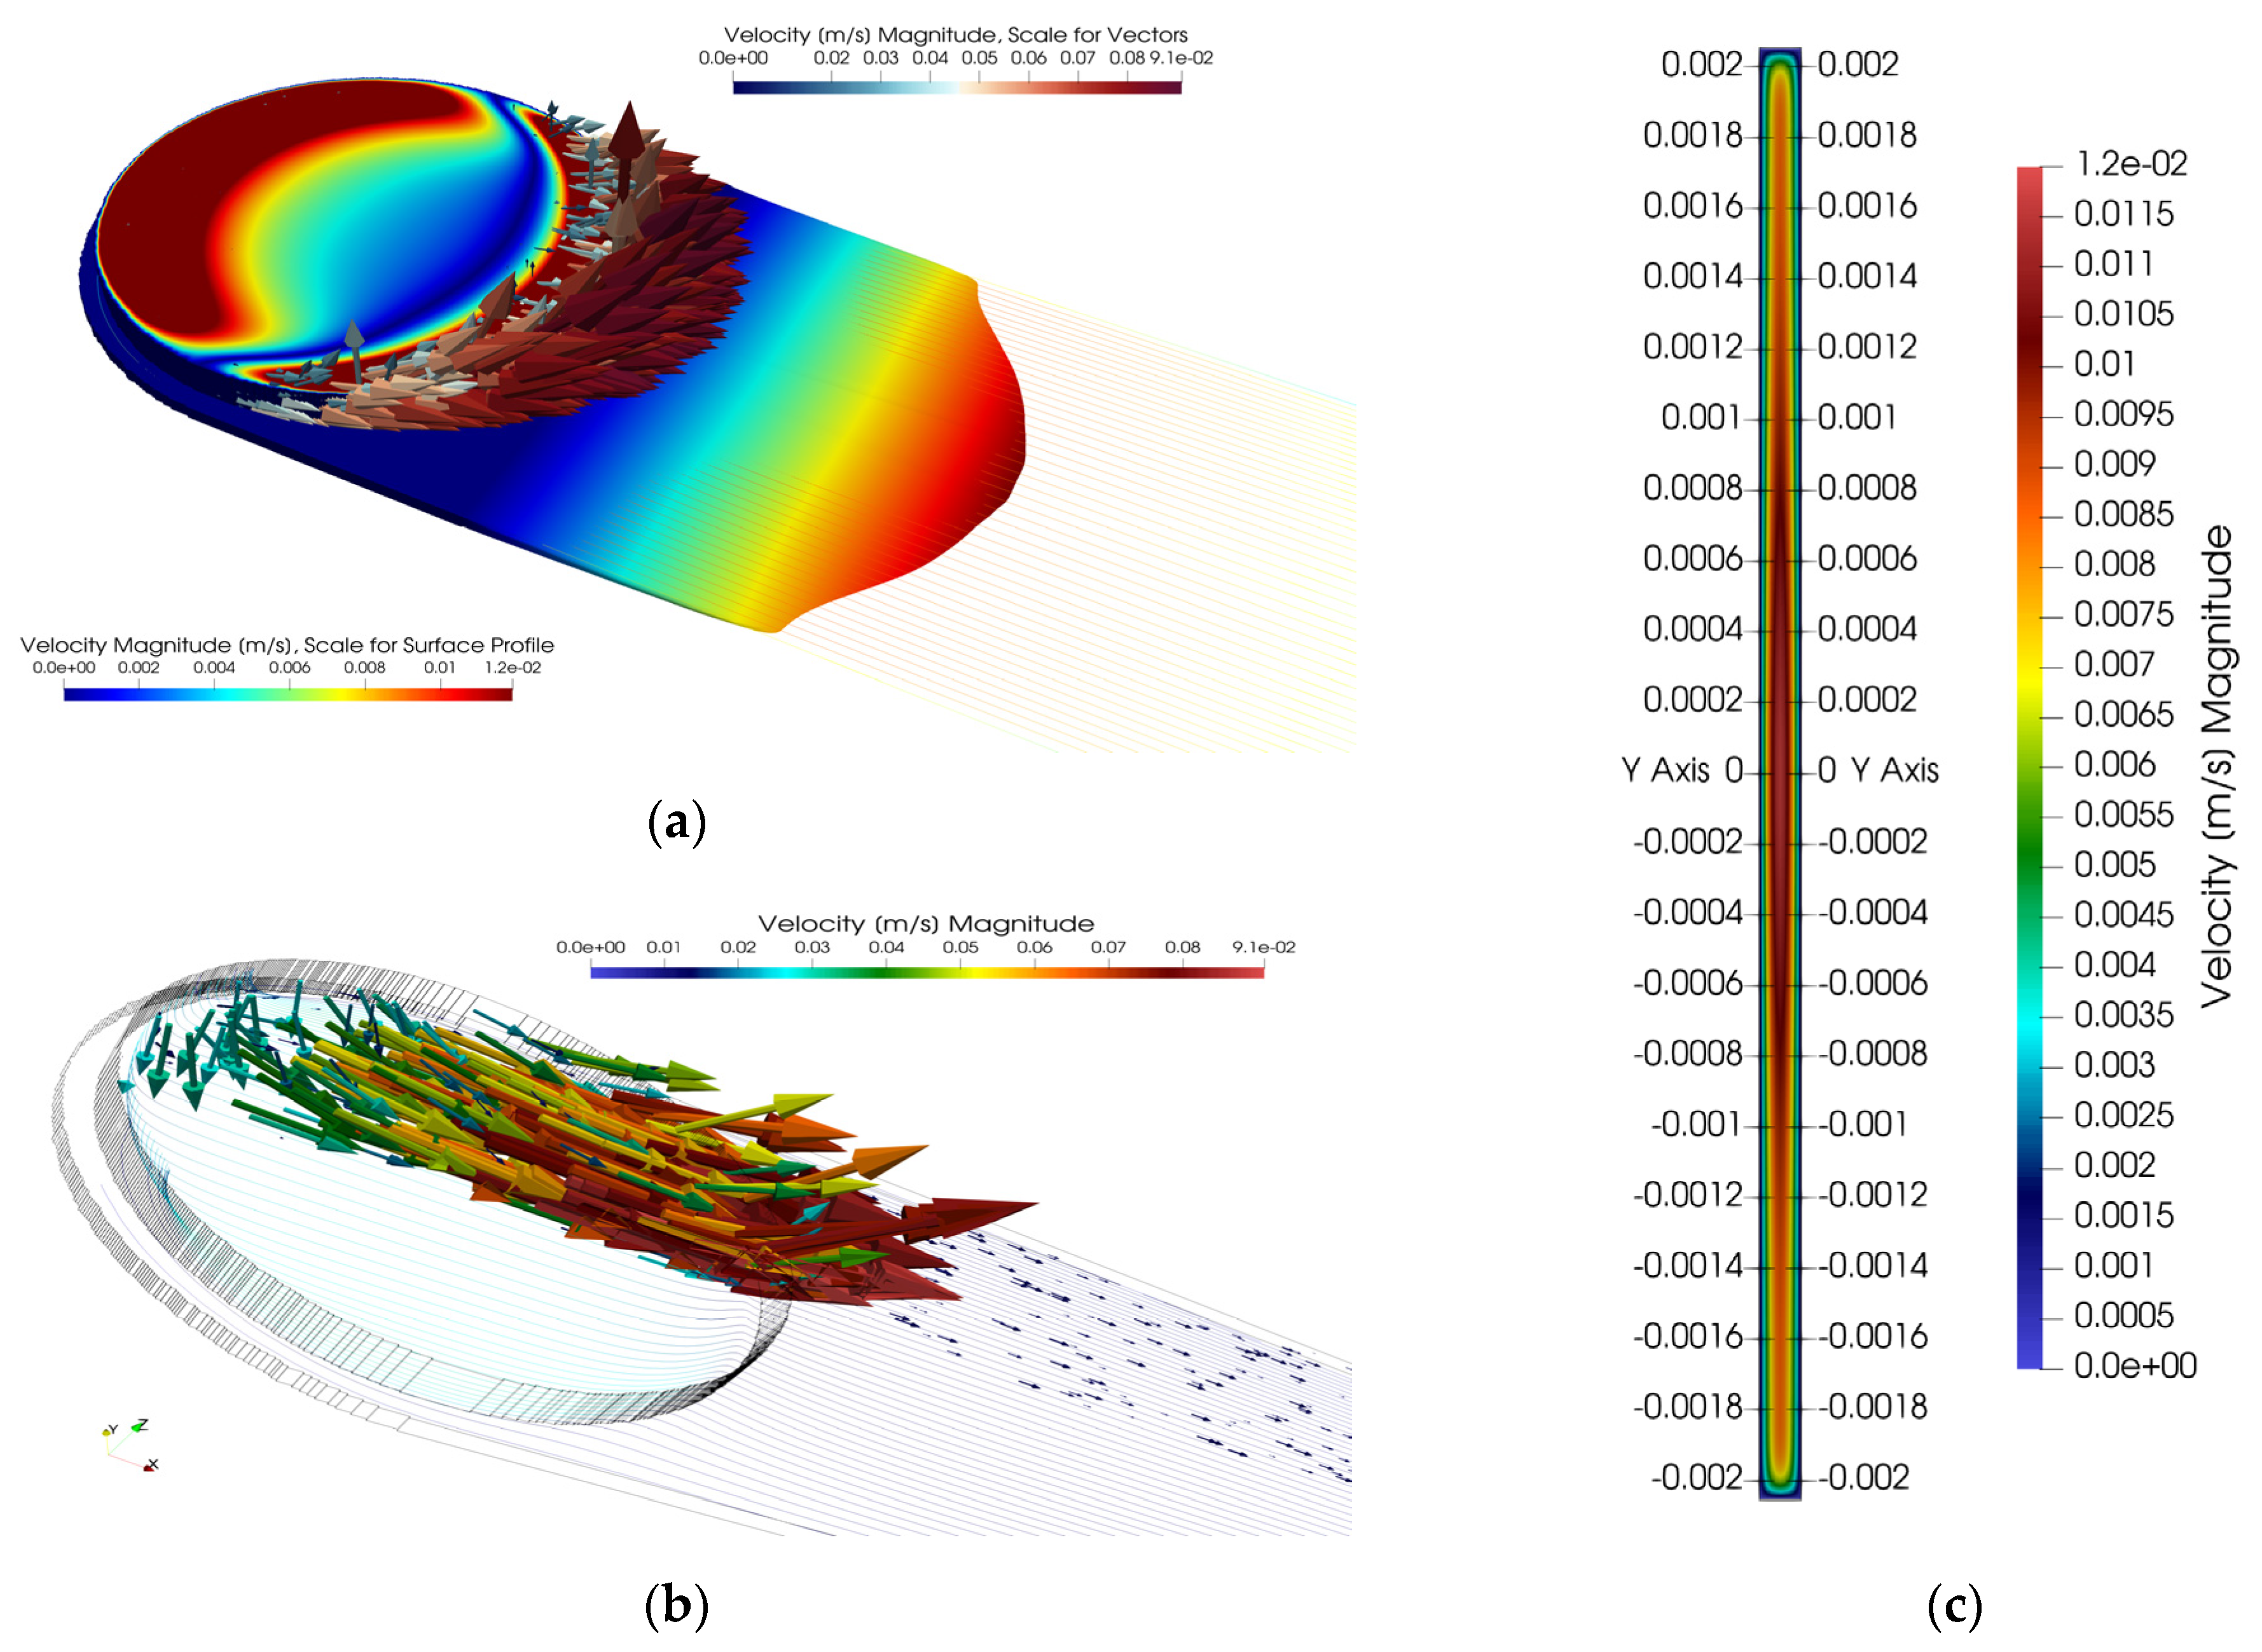
In Figure 8, the velocity distributions at the inlet of CC are presented. Velocity vectors that point out from the fluid reservoir indicate that fluid may pour out of the tank, but the surface tension prevents fluid from escaping the grove. Near the inlets, the parabolic velocity profile in the culture chamber with the near-wall flatness was observed. This is caused by the circular shape of the reservoirs and the uneven outflow of liquid from the reservoirs to the chambers.
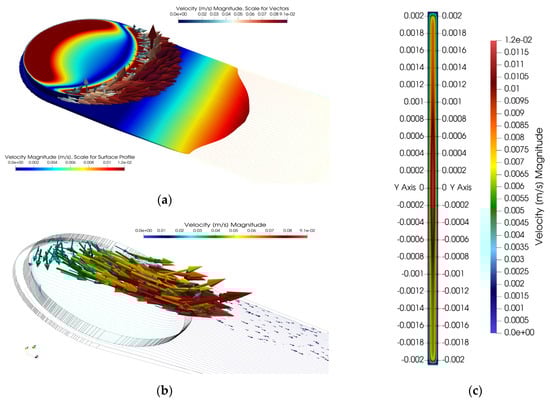
Figure 8.
Fluid velocity distributions at the inlet of CC: (a) velocity vectors and wrapped-by-vector velocity profile, (b) velocity profile and velocity streamlines at the inlet of CC—half view, and (c) XZ channel cross-section.
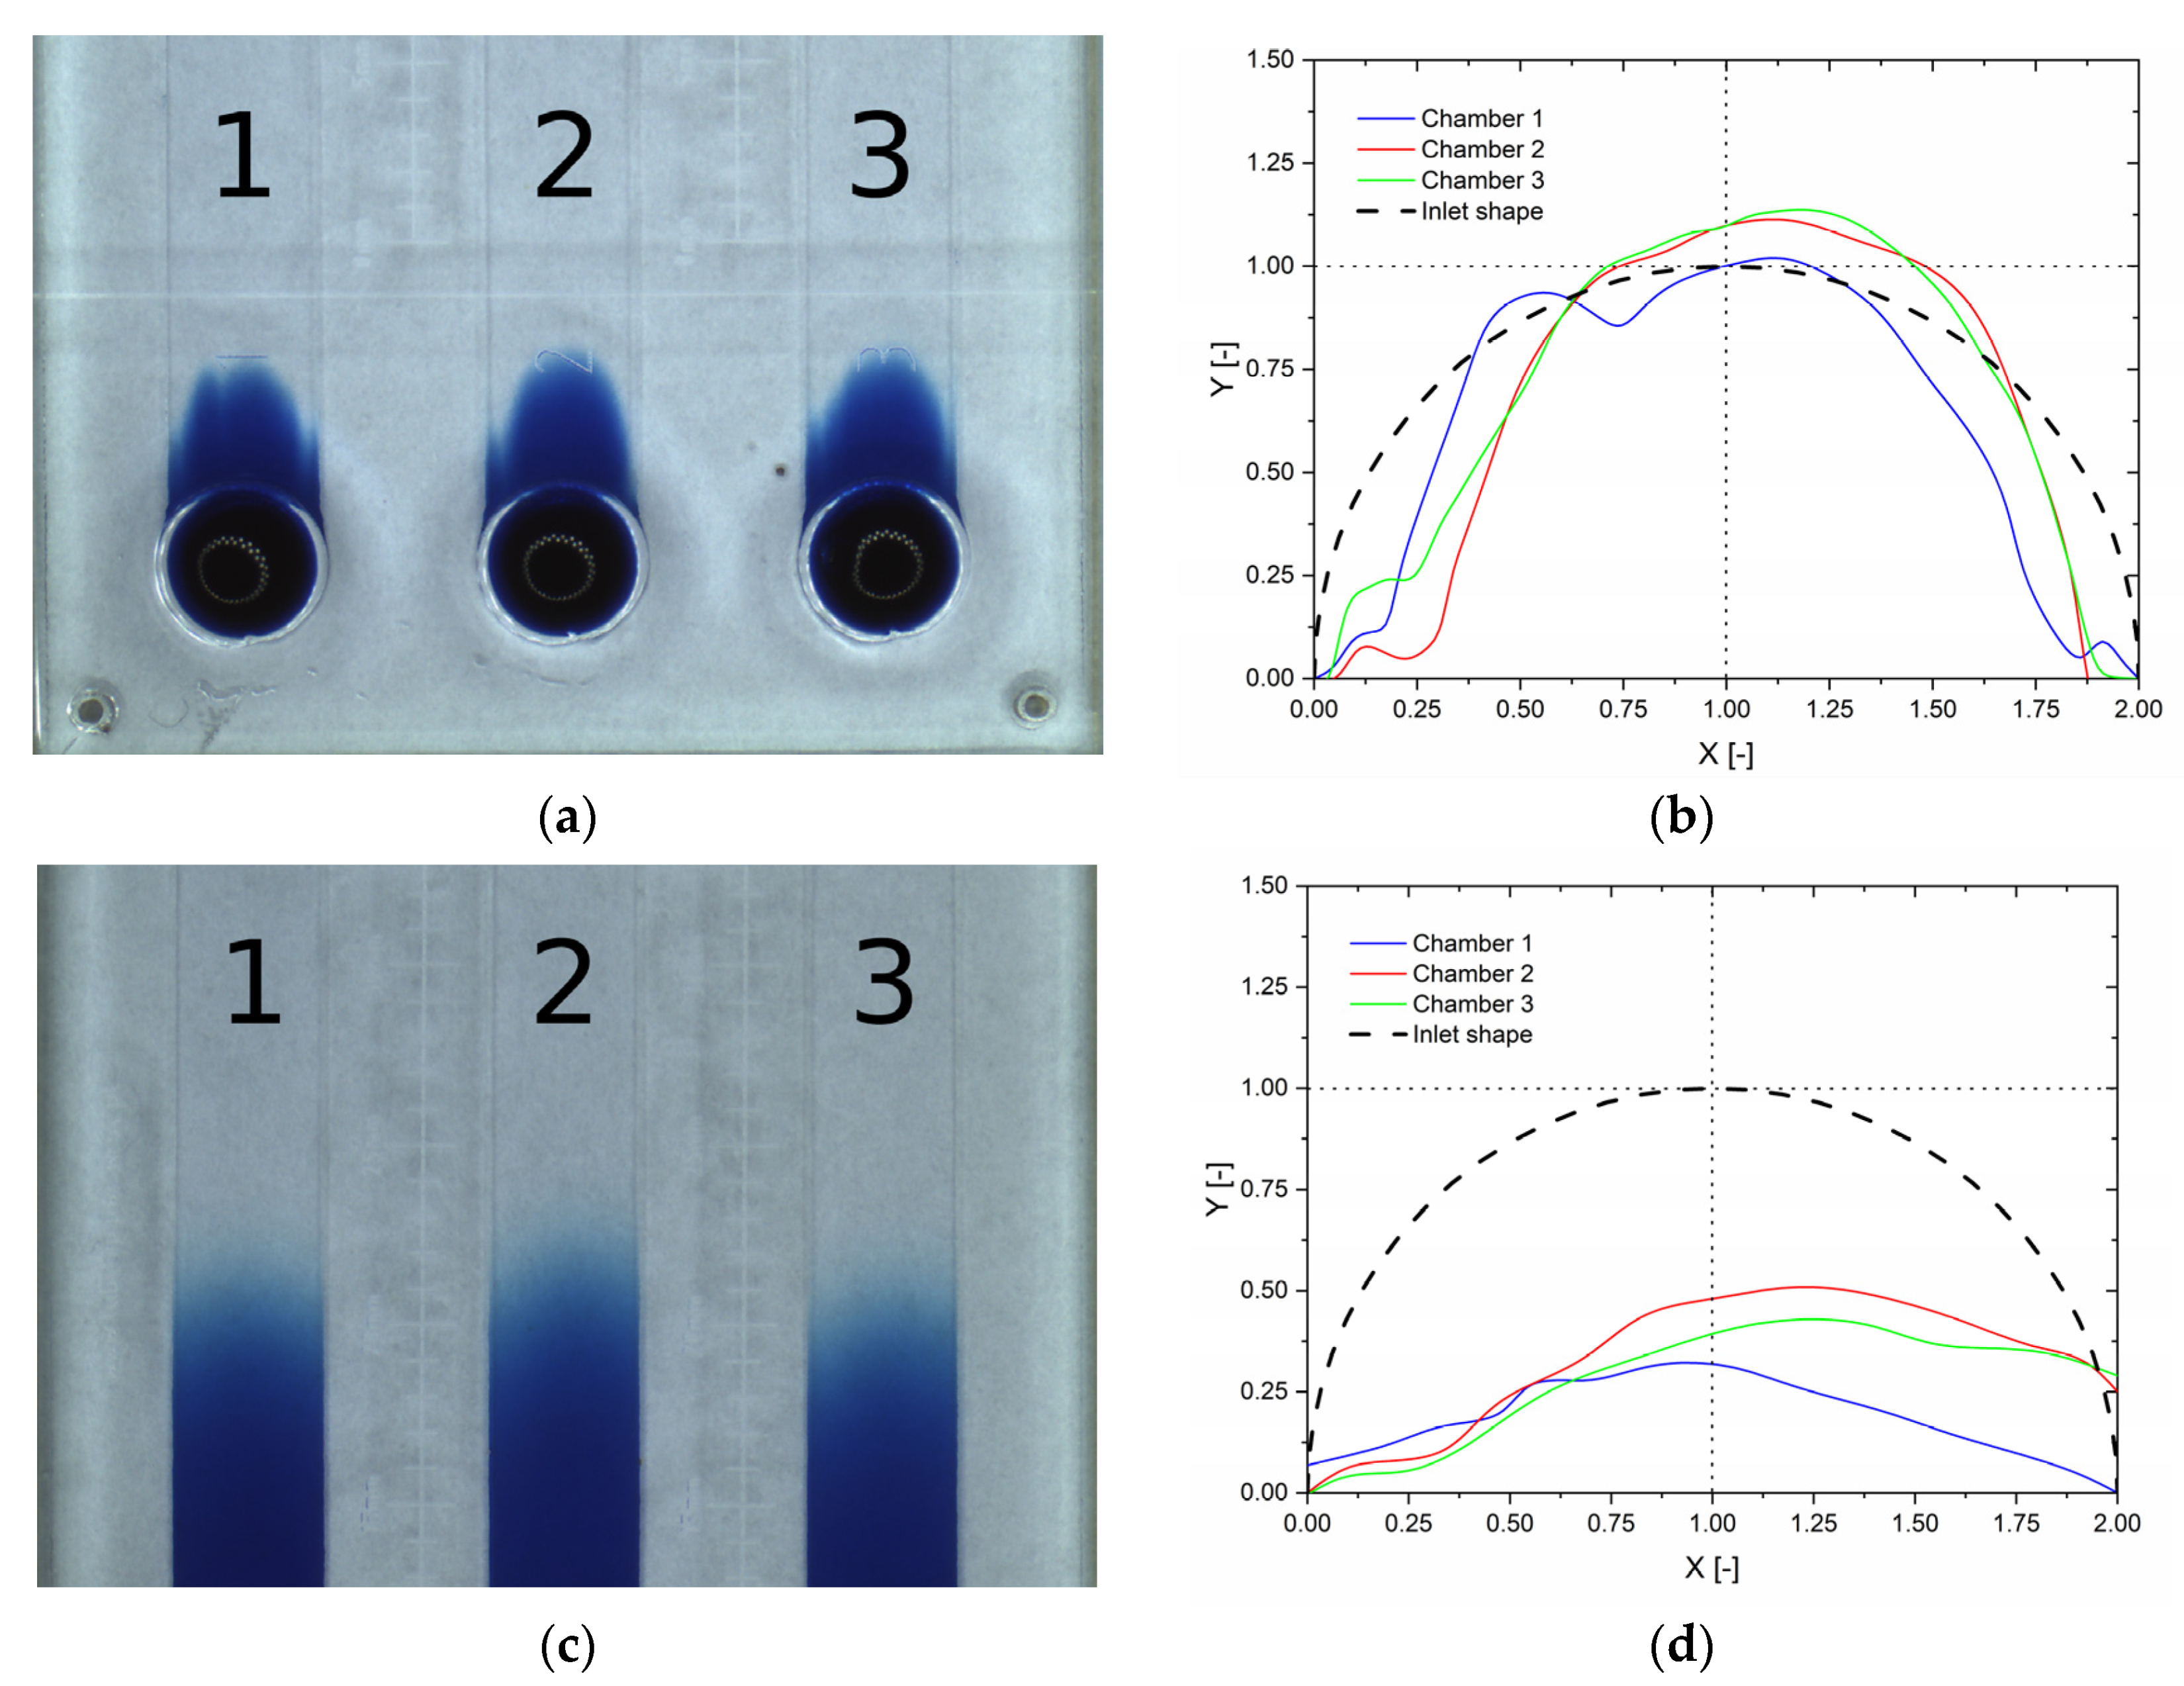
Similar observations have been made during experiments and are presented in Figure 9a,b, where we can see dynamic profiles of the dye introduced to the inlets of CC from the reservoirs. In Figure 9b,d, normalized profiles of the dye in a dimensionless coordinate system are presented, obtained from the microscopic photos. The dashed line represents the shape of the reservoir edge. In each CC, the observed dye profile is of the same tongue-like shape, with a near-wall flatness. The discrepancy of the dye contour from the circular shape of the reservoir outlet edge evidenced the flow unevenness in this region. As the dye moves deeper into the chamber, the profiles become flat, as can be seen in Figure 9c,d.
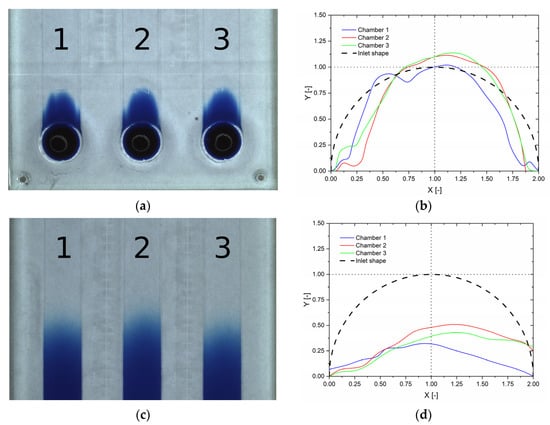
Figure 9.
Dynamic dye profiles experimentally determined during the flow of fluid from the reservoirs to the culture chambers: (a) photo from a stereoscopic microscope at the inlet, (b) normalized inlet profiles determined from the photo, (c) photo from a stereoscopic microscope taken in the middle of the CC length, and (d) normalized middle-length profiles determined from the photo. X, Y—dimensionless distances.
As we can see from Figure 10, the simulations predict that the discrepancies from the uniform distributions of flow parameters are observed close to the inlets only, and do not affect cell cultures in the CC working zone. The simulated velocity profiles flatten out when the fluid approaches the edge of the chip’s workspace (line 6 in Figure 10b,c). The effect of velocity profile formation in the inlet region of CC is clearly visualized in Figure 10c. The inlet/outlet regions are less than 10 mm long, and are marked with red dashed lines in Figure 10a. Within the working space of CC, the velocity magnitude along the axis placed in the middle of the height of CC changes by only about 10%, tending asymptotically to the value of 0.0086 m/s (dashed blue line in Figure 10a).
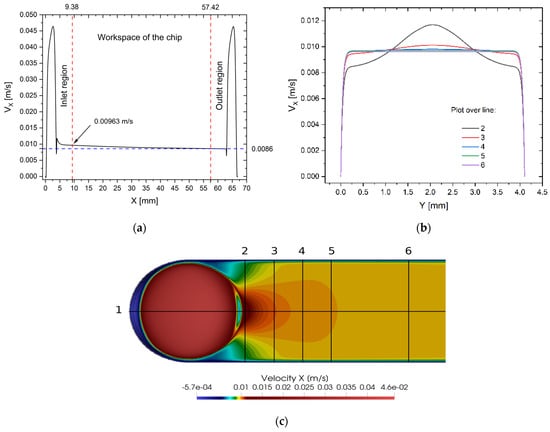
Figure 10.
Velocity profiles at the inlet of CC: (a) plot over line 1 placed in the middle of the height of CC, (b) plot over lines 2–6 placed in the middle of the height of CC, and (c) CC cross-section across the XY plane placed in the middle of the height of CC.
4. Summary and Conclusions
The aim of our research was to develop a numerical model of microflows occurring in the culture chambers of the microfluidic device of our construction, that is dedicated to high-throughput drug screening. The model describing incompressible fluid flow is based on the lattice-Boltzmann equation with an external body force term approximated by the HSD scheme and the BGK approximation of the collision operator. The solution of the model was performed in the open-source Microflow 3D solver for the full 3D culture chamber geometry on the Cartesian D3Q19 lattice, comprising over 24.5 million computational nodes. The model and code were validated using the analytical solution of NSE for 3D duct flow and using experimental data of volumetric flow rates of culture medium in CC. The mean errors were 1.0% and 6.1% respectively, in comparison to the NSE solution and experimental data. However, we should be aware that the deviation of simulation results from the reference values was influenced to a large degree by the experimental data deviation (SD = 3.8%). The obtained accuracy of the model is sufficient to conduct engineering calculations, and we used our model to perform an analysis of the inlet/outlet effects of flow in CC.
The biochips’ cell culture chambers’ construction promotes stable and homogeneous laminar plug-flow-like conditions within their workspace area, along the whole CC. The plug-flow-like velocity profile is responsible for the even distribution of species across the CC, while the parabolic profile developed across the CC (along the shortest edge of the CC) allows the development of the linear gradients of species during fluid reciprocating flow. The fluid reciprocating flow is invoked by alternately tilting the microsystem several times, and is prone to human operation errors, e.g., inclination angle. This can cause discrepancies in the volumetric flow rates of culture media. However, as the channel surface-to-volume ratio is high, the flow perturbations at the inlet/outlet of the CC are rapidly suppressed and do not influence species’ distributions within the working space of the CC, making test procedures robust and repeatable. If the lengths of the inlet and outlet sections are set to 10 mm, the change in fluid velocity along the axis of the chamber, within its entire length, does not exceed 10%.
The conclusions drawn from the simulation results are consistent with the observations made previously during the practical tests of the device [20]. In a further article, we intend to present an in-depth analysis of research results on the formation of active substance concentration profiles in CC and their stability over time.
5. Patents
- (1)
- Szafran Roman, Kazimierz Gąsiorowski, Katarzyna Gębczak, Benita Wiatrak, Microfluidic device for cell culture in gradient of bioactive substance, WO2018106132 (A1), 2018.
- (2)
- Szafran Roman, Kazimierz Gąsiorowski, Katarzyna Gębczak, Benita Wiatrak, Microfluidal device for growing cell culture in a gradient of bioactive PL237365B1, 2021.
- (3)
- Szafran Roman, Method for manufacturing micro-fluidized bed device for growing cell culture in a gradient of bioactive substance, PL238206B1, 2021.
- (4)
- Szafran Roman, Kazimierz Gąsiorowski, Katarzyna Gębczak, Benita Wiatrak, Method for producing stable active substance concentration gradient in the cell culture microsystems, PL419813 (A1), 2016.
Supplementary Materials
The following are available online at https://www.mdpi.com/article/10.3390/app11199140/s1, File S1: A surface grid of CC geometry in stl format, File S2: Case configuration file of MF3D case_params.cfg, File S3: Thread configuration file of MF3D thread_params.cfg, File S4: The MF3D case configuration files, File S5: The Matlab script used for calculation of a fully developed velocity profile from Equation (7).
Author Contributions
Conceptualization, R.G.S.; methodology, R.G.S.; validation, R.G.S.; formal analysis, R.G.S.; investigation, R.G.S.; data curation, R.G.S. and M.D.; writing—original draft preparation, R.G.S. and M.D.; writing—review and editing, R.G.S. and M.D.; visualization, R.G.S. All authors have read and agreed to the published version of the manuscript.
Funding
This research received no external funding.
Institutional Review Board Statement
Not applicable.
Informed Consent Statement
Not applicable.
Data Availability Statement
The data presented in this study are available from the corresponding author upon request.
Conflicts of Interest
The authors declare no conflict of interest.
References
- Amini, H.; Lee, W.; Di Carlo, D. Inertial microfluidic physics. Lab Chip 2014, 14, 2739–2761. [Google Scholar] [CrossRef] [PubMed]
- Haddadi, H.; Di Carlo, D. Inertial flow of a dilute suspension over cavities in a microchannel. J. Fluid Mech. 2017, 811, 436–467. [Google Scholar] [CrossRef]
- Di Carlo, D. Inertial microfluidics. Lab Chip 2009, 9, 3038–3046. [Google Scholar] [CrossRef]
- Ngo, I.L.; Lai, T.K.; Choi, H.J.; Le, H.T.T.; Kim, G.M.; Dang, T.D. A study on mixing performance of dean flows through spiral micro-channel under various effects. Phys. Fluids 2020, 32, 022004. [Google Scholar] [CrossRef]
- Yoon, D.H.; Ha, J.B.; Bahk, Y.K.; Arakawa, T.; Shoji, S.; Go, J.S. Size-selective separation of micro beads by utilizing secondary flow in a curved rectangular microchannel. Lab Chip 2009, 9, 87–90. [Google Scholar] [CrossRef]
- Kim, G.Y.; Han, J.I.; Park, J.K. Inertial Microfluidics-Based Cell Sorting. Biochip J. 2018, 12, 257–267. [Google Scholar] [CrossRef]
- Nakadate, H.; Aomura, S.; Zhang, Y.; Kakuta, A.; Fujiwara, S. Strain magnitude and strain rate influence stretch-induced injury of PC12 cells. In Proceedings of the IFMBE Proceedings, Singapore, Singapore, 1–6 August 2010; Springer: Berlin/Heidelberg, Germany, 2010; Volume 31, pp. 1091–1094. [Google Scholar]
- Ryan, D.P.; Chen, Y.; Nguyen, P.; Goodwin, P.M.; Carey, J.W.; Kang, Q.; Werner, J.H.; Viswanathan, H.S. 3D particle transport in multichannel microfluidic networks with rough surfaces. Sci. Rep. 2020, 10, 13848. [Google Scholar] [CrossRef]
- Hoseinpour, B.; Sarreshtehdari, A. Lattice Boltzmann simulation of droplets manipulation generated in lab-on-chip (LOC) microfluidic T-junction. J. Mol. Liq. 2020, 297, 111736. [Google Scholar] [CrossRef]
- Li, J.; Liu, H.; Ioannou, N.; Zhang, Y.; Reese, J.M. Lattice Boltzmann Simulations of Thermocapillary Motion of Droplets in Microfluidic Channels. Commun. Comput. Phys. 2020, 17, 1113–1126. [Google Scholar] [CrossRef] [Green Version]
- Lain, S.; Ernst, M.; Sommerfeld, M. Study of Colliding Particle-Pair Velocity Correlation in Homogeneous Isotropic Turbulence. Appl. Sci. 2020, 10, 9095. [Google Scholar] [CrossRef]
- Krüger, T.; Kuzmin, H.K.A.; Shardt, O.; Silva, G.; Viggen, E.M. The Lattice Boltzmann Method: Principles and Practice; Springer: Berlin/Heidelberg, Germany, 2016; ISBN 3319446479. [Google Scholar]
- Tomczak, T.; Szafran, R.G. A new GPU implementation for lattice-Boltzmann simulations on sparse geometries. Comput. Phys. Commun. 2019, 235, 258–278. [Google Scholar] [CrossRef] [Green Version]
- Tomczak, T.; Szafran, R.G. Sparse Geometries Handling in Lattice Boltzmann Method Implementation for Graphic Processors. IEEE Trans. Parallel Distrib. Syst. 2018, 29, 1865–1878. [Google Scholar] [CrossRef] [Green Version]
- Shi, H.; Nie, K.; Dong, B.; Long, M.; Xu, H.; Liu, Z. Recent progress of microfluidic reactors for biomedical applications. Chem. Eng. J. 2019, 361, 635–650. [Google Scholar] [CrossRef]
- Zhang, B.; Radisic, M.; Niklason, L.E.; Forgacs, G.; Stockbridge, N. Organ-on-a-chip devices advance to market. Lab Chip 2017, 6, e26397. [Google Scholar] [CrossRef]
- Hachey, S.J.; Hughes, C. Applications of Tumor Chip Technology. Lab Chip 2018, 18, 2893–2912. [Google Scholar] [CrossRef]
- Esch, E.W.; Bahinski, A.; Huh, D. Organs-on-chips at the frontiers of drug discovery. Nat. Rev. Drug Discov. 2015, 14, 248–260. [Google Scholar] [CrossRef] [Green Version]
- Low, L.A.; Tagle, D.A. Tissue chips—Innovative tools for drug development and disease modeling. Lab Chip 2017, 17, 3026–3036. [Google Scholar] [CrossRef] [PubMed]
- Szafran, R.G.; Gąsiorowski, K.; Wiatrak, B. Colorectal Adenocarcinoma Cell Culture in a Microfluidically Controlled Environment with a Static Molecular Gradient of Polyphenol. Molecules 2021, 26, 3215. [Google Scholar] [CrossRef] [PubMed]
- U.S. Food and Drug Administration/Center for Biologics Evaluation and Research Guideline for Industry. Text on Validation of Analytical Procedures (ICH-Q2A). Guidelines 1995, 9, 1–5. [Google Scholar]
- Food and Drug Administration. FDA Guidance for Industry Q2B Validation of Analytical Procedures: Methodology; Food and Drug Administration: Rockville, MD, USA, 1996; Volume 20857, pp. 301–827. [Google Scholar]
- Szafran, R.G. MF3D Validation Test No. 1. Available online: http://www.microflow.pwr.edu.pl/images/site_own/validation/Test_description.pdf (accessed on 30 September 2021).
- Bhatnagar, P.L.; Gross, E.P.; Krook, M. A Model for Collision Processes in Gases. I. Small Amplitude Processes in Charged and Neutral One-Component Systems. Phys. Rev. 1954, 94, 511–525. [Google Scholar] [CrossRef]
- He, X.; Shan, X.; Doolen, G.D. Discrete Boltzmann equation model for nonideal gases. Phys. Rev. E 1998, 57, R13–R16. [Google Scholar] [CrossRef]
- Zou, Q.; Hou, S.; Chen, S.; Doolen, G.D. A improved incompressible lattice Boltzmann model for time-independent flows. J. Stat. Phys. 1995, 81, 35–48. [Google Scholar] [CrossRef]
- Spiga, M.; Morino, G.L. A symmetric solution for velocity profile in laminar flow through rectangular ducts. Int. Commun. Heat Mass Transf. 1994, 21, 469–475. [Google Scholar] [CrossRef]
- Shah, R.K.; London, A.L. Laminar Flow Forced Convection in Ducts; Elsevier: Amsterdam, The Netherlands, 1978; ISBN 978-0-12-020051-1. [Google Scholar]
- Zhong, J.-J.; Fujiyama, K.; Seki, T.; Yoshida, T. A quantitative analysis of shear effects on cell suspension and cell culture ofperilla frutescens in bioreactors. Biotechnol. Bioeng. 1994, 44, 649–654. [Google Scholar] [CrossRef] [PubMed]
- Estrada, R.; Giridharan, G.A.; Nguyen, M.-D.; Roussel, T.J.; Shakeri, M.; Parichehreh, V.; Prabhu, S.D.; Sethu, P. Endothelial Cell Culture Model for Replication of Physiological Profiles of Pressure, Flow, Stretch, and Shear Stress In Vitro. Anal. Chem 2011, 83, 45. [Google Scholar] [CrossRef] [PubMed]


Publisher’s Note: MDPI stays neutral with regard to jurisdictional claims in published maps and institutional affiliations. |
© 2021 by the authors. Licensee MDPI, Basel, Switzerland. This article is an open access article distributed under the terms and conditions of the Creative Commons Attribution (CC BY) license (https://creativecommons.org/licenses/by/4.0/).