Article

Integrated Assessment of Surface Water Quality in Danube River Chilia Branch

1
Danube Delta National Institute for Research and Development Tulcea, 165 Babadag Street, 820112 Tulcea, Romania
2
INPOLDE Research Center, Faculty of Sciences and Environment, Dunarea de Jos University of Galati, 47 Domneasca Street, 800008 Galati, Romania
3
European Center of Excellence for the Environment, Faculty of Sciences and Environment, Dunarea de Jos University of Galati, 800201 Galati, Romania
*
Author to whom correspondence should be addressed.
Appl. Sci. 2021, 11(19), 9172; https://doi.org/10.3390/app11199172
Submission received: 25 August 2021 / Revised: 24 September 2021 / Accepted: 28 September 2021 / Published: 2 October 2021
(This article belongs to the Special Issue Monitoring and Analysis of Environmental Pollution)

Abstract

:
The Chilia branch is the north branch of the Danube River at the Romania-Ukraine border in the Danube Delta; it is a complex system with economic and ecological values. The surface water quality is a major concern and monitoring programs have been developed at the national and international level. The objective of this study was to evaluate the water quality of the Chilia branch in different sampling points from the mouth to the discharge in the Black Sea. The assessment of water quality was done at the individual level taking into account the nutrient concentrations and the standard limits for good ecological status and at integrative levels, using CCME WQI. The longitudinal distribution of Chilia branch water quality was done using GIS method. A total of 106 water samples were collected between 2013 and 2019 from five sampling points. At the individual level, the Chilia branch has a good ecological status except for its levels of total nitrogen, due to the organic nitrogen contribution in 2015. In 90% of nutrient concentrations, low values predominate and high values are considered extreme; only in 10% do high values predominate and low values are considered extreme concentrations. In equal percentages, 50% of the nutrient concentrations have a high degree of heterogeneity and the other 50% of concentration values are very close to the average values, with a high degree of homogeneity. CCME WQI method indicated that 39.93% of surface waters from the Chilia branch had an excellent quality, 45.45% a good quality, and only 14.62% a fair quality.

1. Introduction

Due to rapid changes in water quality in river ecosystems worldwide, caused by the impact of natural and anthropogenic factors on the catchment basin, it is of the utmost importance to implement appropriate programs and strategies for the efficient assessment of water quality, to support qualitative and quantitative decisions regarding environmental management and restoration of water resources and public health protection [1,2,3,4,5].
Depending on their chemical forms, nutrients, expressed in phosphorus (total and dissolved forms) and nitrogen (inorganic and total forms), are key water quality parameters for surface waters, entering the water body from point (municipal, industrial, and agricultural facilities) and diffuse (erosion and surface runoff, groundwater inflow, and atmospheric deposition) sources throughout the catchment area, with direct or indirect impacts on aquatic life, biomass growth, oxygen concentrations, water clarity, and sedimentation rates [1,2,6,7]. They play an important role in the eutrophication process and pose a serious problem for the monitoring and estimation of their effects on water quality in a riverine environment, being difficult to control [2,8,9,10].
The Danube is the second largest river in Europe and twenty–first in the world, passing through Europe from west to east, flowing through or forming a part of the borders of ten countries–Germany, Austria, Slovak Republic, Hungary, Croatia, Serbia, Bulgaria, Romania, Moldova, and Ukraine. In addition, its drainage basin includes areas of nine more countries: Italy, Poland, Switzerland, Czech Republic, Slovenia, Bosnia and Herzegovina, Montenegro, Republic of Macedonia, and Albania [11] (Figure 1a). The Danube River has been an important link in Central Europe as well as the border between EU and the Balkans and Black Sea Region [12,13]. In the lower part, before reaching the Black Sea, the Danube River is divided into three main branches: Chilia, Sulina, and Sfântu Gheorghe (St. George), forming a remarkable delta, the Danube Delta (Figure 1a).
Water pollution caused by the high population density and heavy industrialization in the catchment area is a major problem in the Danube [11]. Through its three branches, the Danube is by far the most important contributor to the regional nutrient pollution and is directly responsible for eutrophication processes within the river and in the Black Sea [10,14,15]. Having a length of 104 km, the Chilia branch, a natural border between Romania and Ukraine, is a very dynamic ecosystem in terms of biological activities, with temporal and spatial variations of nutrient concentrations [13]. In the last few decades, local and national authorities raised concerns regarding the Danube water quality, including the Chilia branch, determined by the fact that it is an important source of drinking water for the riparian population, in most cases without being subjected to any processes of drinking water extraction [14].
During regular monitoring and assessment of water quality, large datasets could be collected, which contain rich information about the water characteristics in a huge volume of samples [16,17]. Management of water quality intended for various uses requires not only strict monitoring of its parameters and simple comparison of monitoring data with allowable values of hazardous chemicals stipulated by the instructions and the European Union (EU) Water Framework Directive (WFD) [18] imposed by EU member states, but also involves methods and mathematical instruments to interpret, group, and communicate information regarding the water quality status in a specific area within the wider context of human activity and use and the conservation of the natural environment [1,19]. Thus, it is very important to build an integrated assessment model of each water body, using a water quality index (WQI), which is a useful tool that allows decision-makers and the public to receive simplified and reliable water quality information, assess tendencies for changes in water quality, and classify water according to various impairment categories [8,20]. A quality index is an unitless number that ascribes a quality value to an aggregate set of measured parameters [21]. Over time, several WQIs have been developed, such as the NSF WQI–National Sanitation Foundation Water Quality Index (additive (AWQI) and multiplicative (MWQI) forms), CCME WQI–Canadian Council of Ministers of Environment Water Quality Index, BC WQI–British Columbia Water Quality Index, and OWQI–Oregon Water Quality Index. These have been extensively used for various assessment tasks in a particular region for a water body [1,14,22,23,24,25,26]. Detailed description of the main WQI calculations are reviewed in several synthetic works [1,5,20,23,24,25,26].
CCME WQI is the most popular index, with its applications presented in many journal papers, technical reports, and governmental agencies reports [20]. It allows flexibility for index users to select those water parameters which can be easily adapted for local conditions and issues, in the same time assuring a clear and intelligible diagnostic for managers and the general public [1,20,26,27]. Moreover, the United Nations Environmental Program (UNEP) has endorsed the CCME WQI model as suitable for grading the quality of drinking waters worldwide [26]. In order to evaluate the water quality trends, the method could be coupled with Geographical Information System (GIS) techniques for building distribution maps [13,28].
Information on the nutrient composition of Danube water in the Chilia branch in the last decade is very scarce [10,13]. The main objectives of this study were two-fold: (1) to evaluate the water quality in the Chilia branch of the Danube River in terms of single indicators expressed in nutrient concentrations and in terms of CCME WQI integrated index, and (2) to represent, using GIS techniques, the distribution maps of the seven year (2013–2019) measurement datasets monitoring of the complex index, along the study area.
The approach of the present study had as a premise the integration of the concentrations of a single class of compounds, nutrients, both at dissolved and total level, in a single complex indicator indicating the degree of eutrophication along the Chilia arm. In subsequent studies will be addressed the other classes of pollutants, namely oxygen regime, metals, salts, integrating their concentrations in complex quality indicators.

2. Materials and Methods
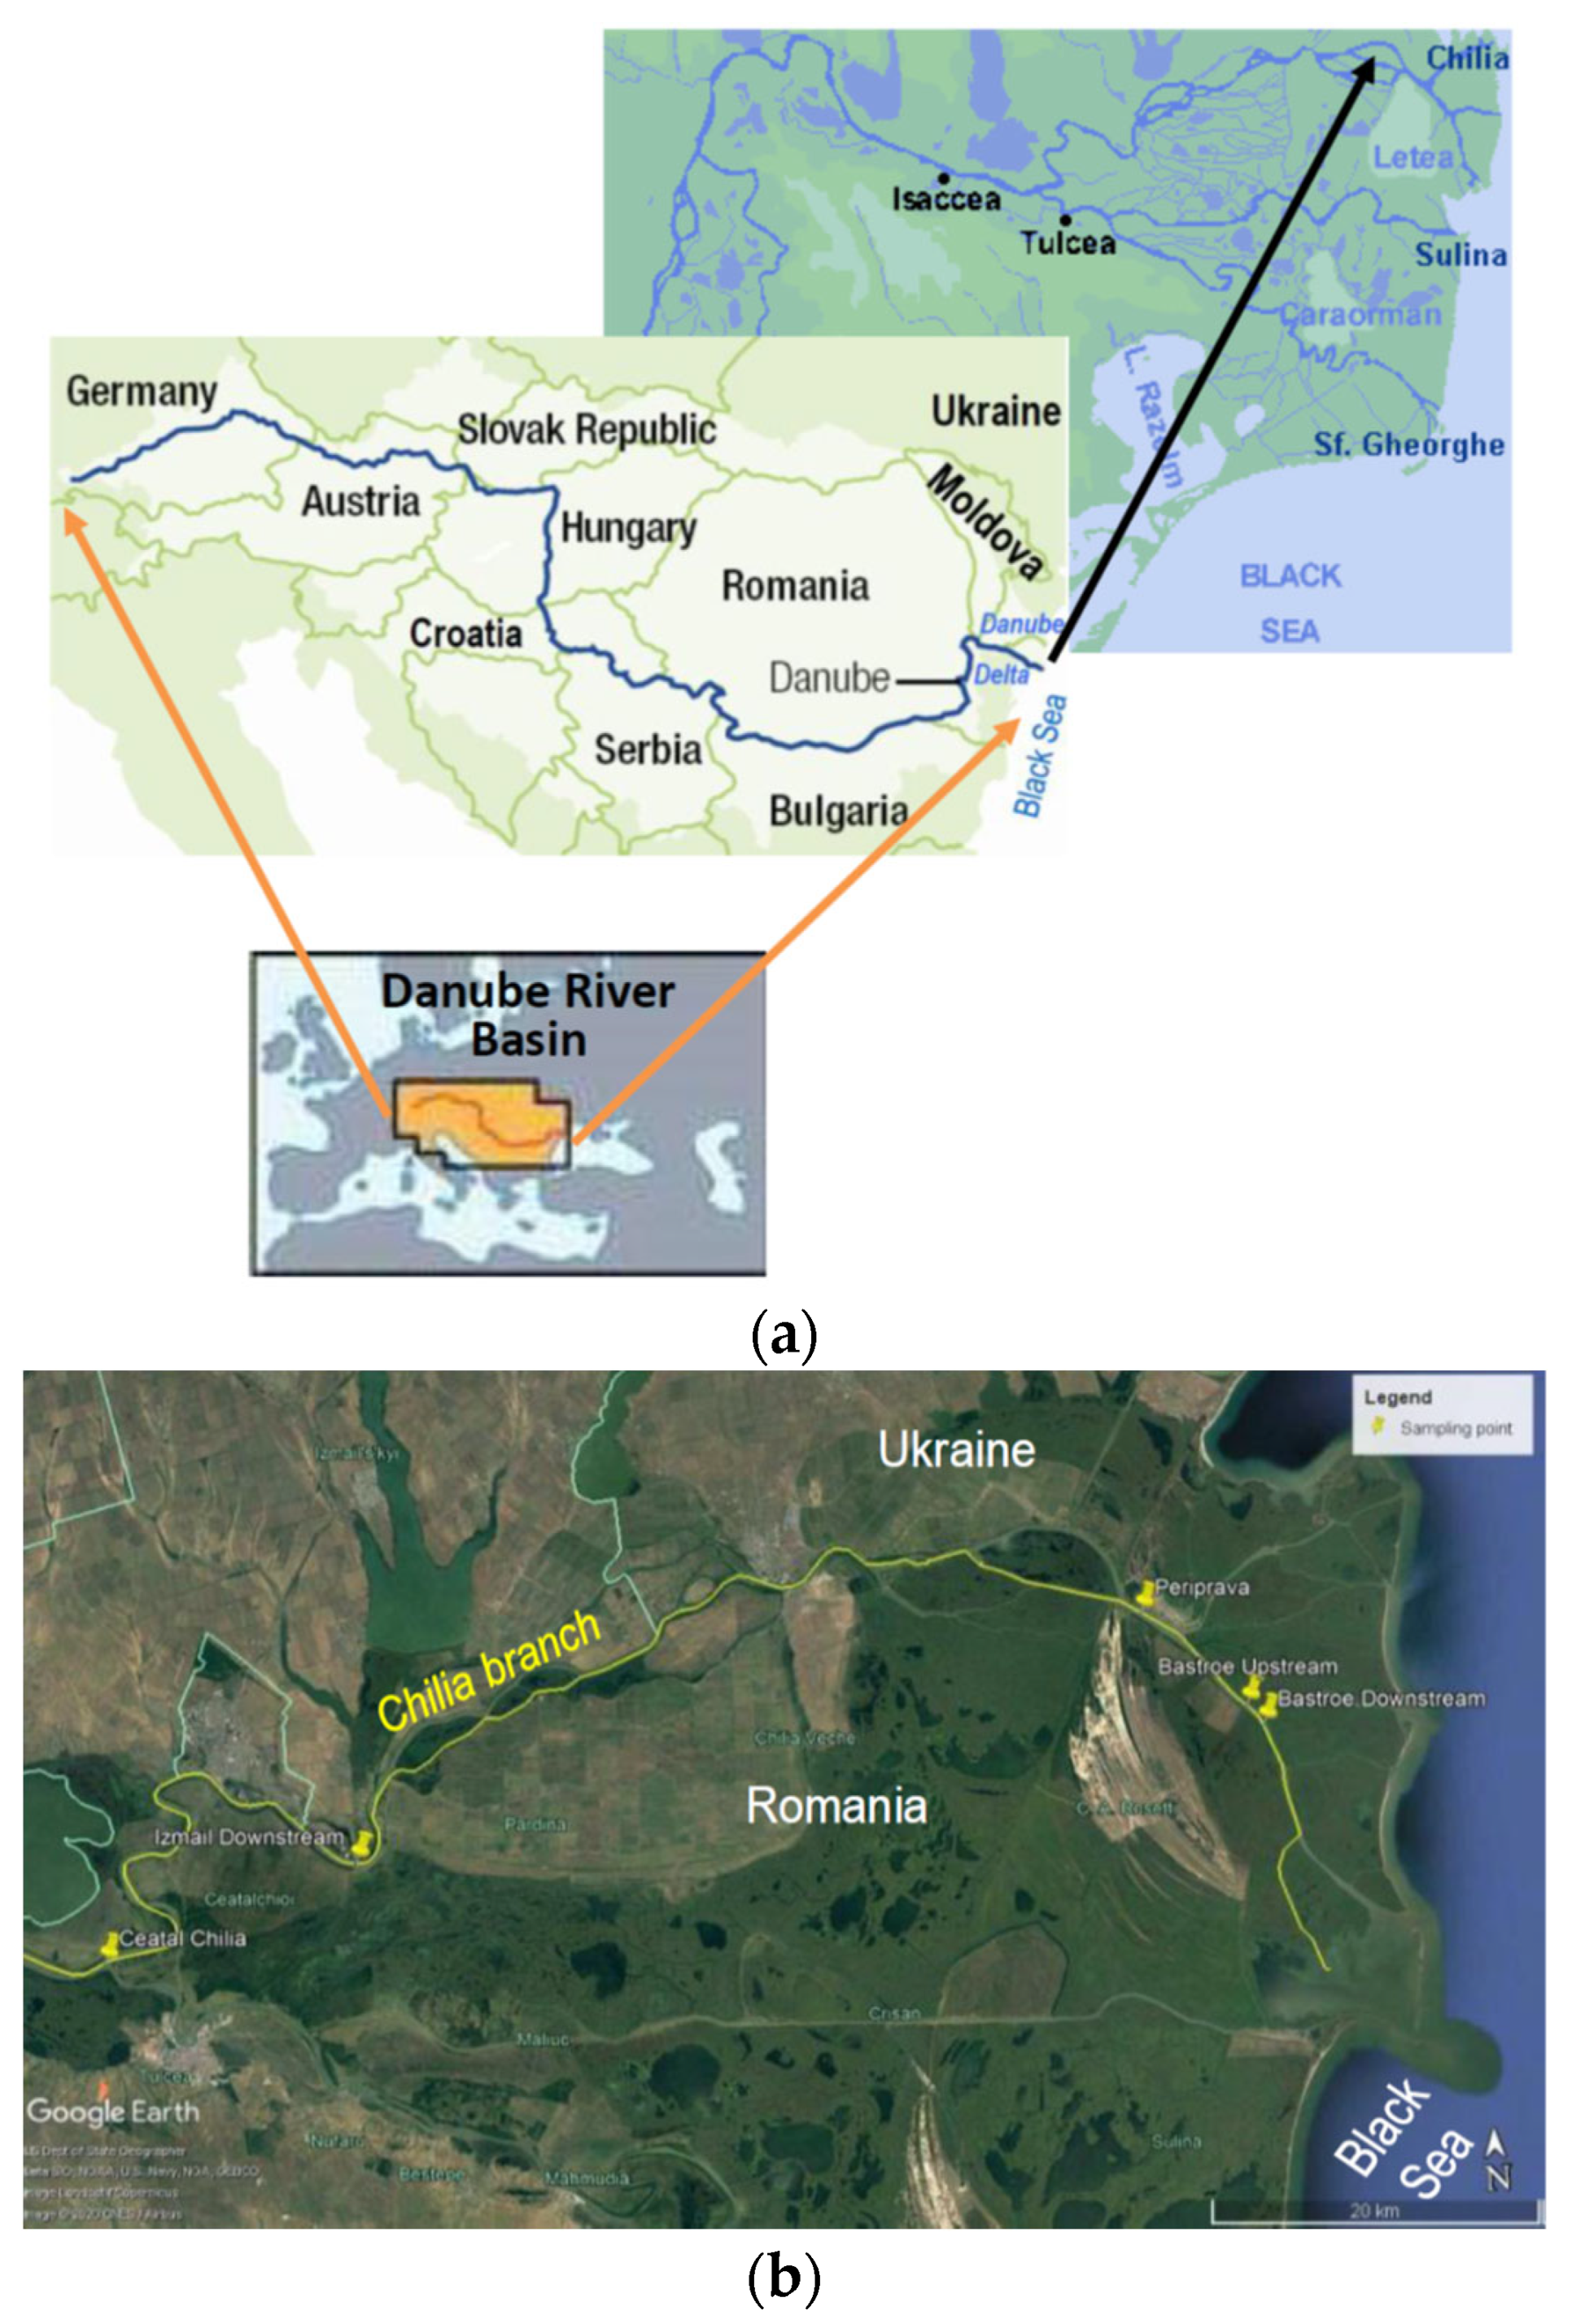
2.1. Study Area

During the monitoring activities conducted in Danube Delta Biosphere Reserve between 2013 and 2019, 106 samples of surface water were collected from Chilia branch, as follows: Ceatal Chilia—26 samples, Izmail Downstream—21 samples, Periprava—25 samples, Bastroe Upstream—17 samples and Bastroe Downstream—17 samples. Sampling was repeated three times each year. The sampling locations on the map of the Danube River basin are presented in Figure 1b and their coordinates and labels are shown in Table 1.

2.2. Chemical Analysis

The surface water samples were taken from the water column (0–60 cm) according to European standards [29], preserved and properly stored in polypropylene containers.
Dissolved nutrients (ammonium nitrogen, nitrite nitrogen, nitrate nitrogen, orthophosphate) and nutrients in total forms (nitrogen and phosphorus) were analyzed at Danube Delta National Institute for Research and Development, Tulcea, Romania, in a chemistry laboratory accredited since 2005, according to the ISO/IEC 17025, by manual spectrophotometry, using a UV-VIS Lambda 10 Perkin Elmer spectrophotometer and ISO standards.
The selected nutrients were converted by wet-chemical treatment into colored compounds with high molar absorptivity [30] that enabled low detection limits and low quantifications limits of each chemical indicator [31]. The quality assurance of chemical analysis was carried out using certified reference materials in flow charts. The parameters used in this work for nutrient analysis in Danube water samples are presented in Table 2.

2.3. Method of Evaluation of Chilia Branch Water Quality, Using the Canadian Council of Ministers of Environment Water Quality Index (CCME WQI)

In order to evaluate the water quality, after measuring the nutrient concentrations, another step is to report these values to quality standards, according to national legislation, Romanian Order MEWM 161/2006 [32], which transposes WFD and gives different quality classes, not a general quality. In addition, to achieve a general quality class for a selected surface water body, it is necessary to develop and to use integrated indices, that combine a sufficient number of chemical indicators in order to provide a single quality class for a water body.
The Canadian Council of Ministers of Environment Water Quality Index, CCME WQI, is a suitable tool for surface water quality evaluation, from the chemical point of view, with no combination with other indicators or biological data, but with flexibility in the selection of input parameters (nutrients) and objectives. For computing this indicator, it is required to take into account at least four chemical indicators and four samples [22,23,26]. CCME WQI is the result of three compounds: scope, frequency, and amplitude, as described in Table 3.
With the computed values for this index, the surface water quality is classified into 5 classes, from 0 (poor quality) to 100 (excellent quality) (Table 4). Nutrient concentrations can offer information about the state quality of a selected sampling point and also tracking changes over time, as well as for comparisons between sampling points.

2.4. Statistical Interpretation

Statistical and computational analyses for nutrient concentrations from surface water of Chilia branch between 2013 and 2019 were performed using Microsoft Excel 2010 with XLSTAT 2015.1. The data included the number of observations, the minimum, maximum, median and mean values, the standard deviation, and Skewness (Pearson) and Kurtosis (Pearson) coefficients.
Skewness index assesses the extent to which a nutrient’s concentration distribution is symmetrical. If the distribution of responses for a nutrient concentration stretches toward the right or left tail of the distribution, then the distribution is referred to as skewed. Kurtosis index is a measure of whether the distribution is too peaked (a very narrow distribution with most of the responses in the center) [33].

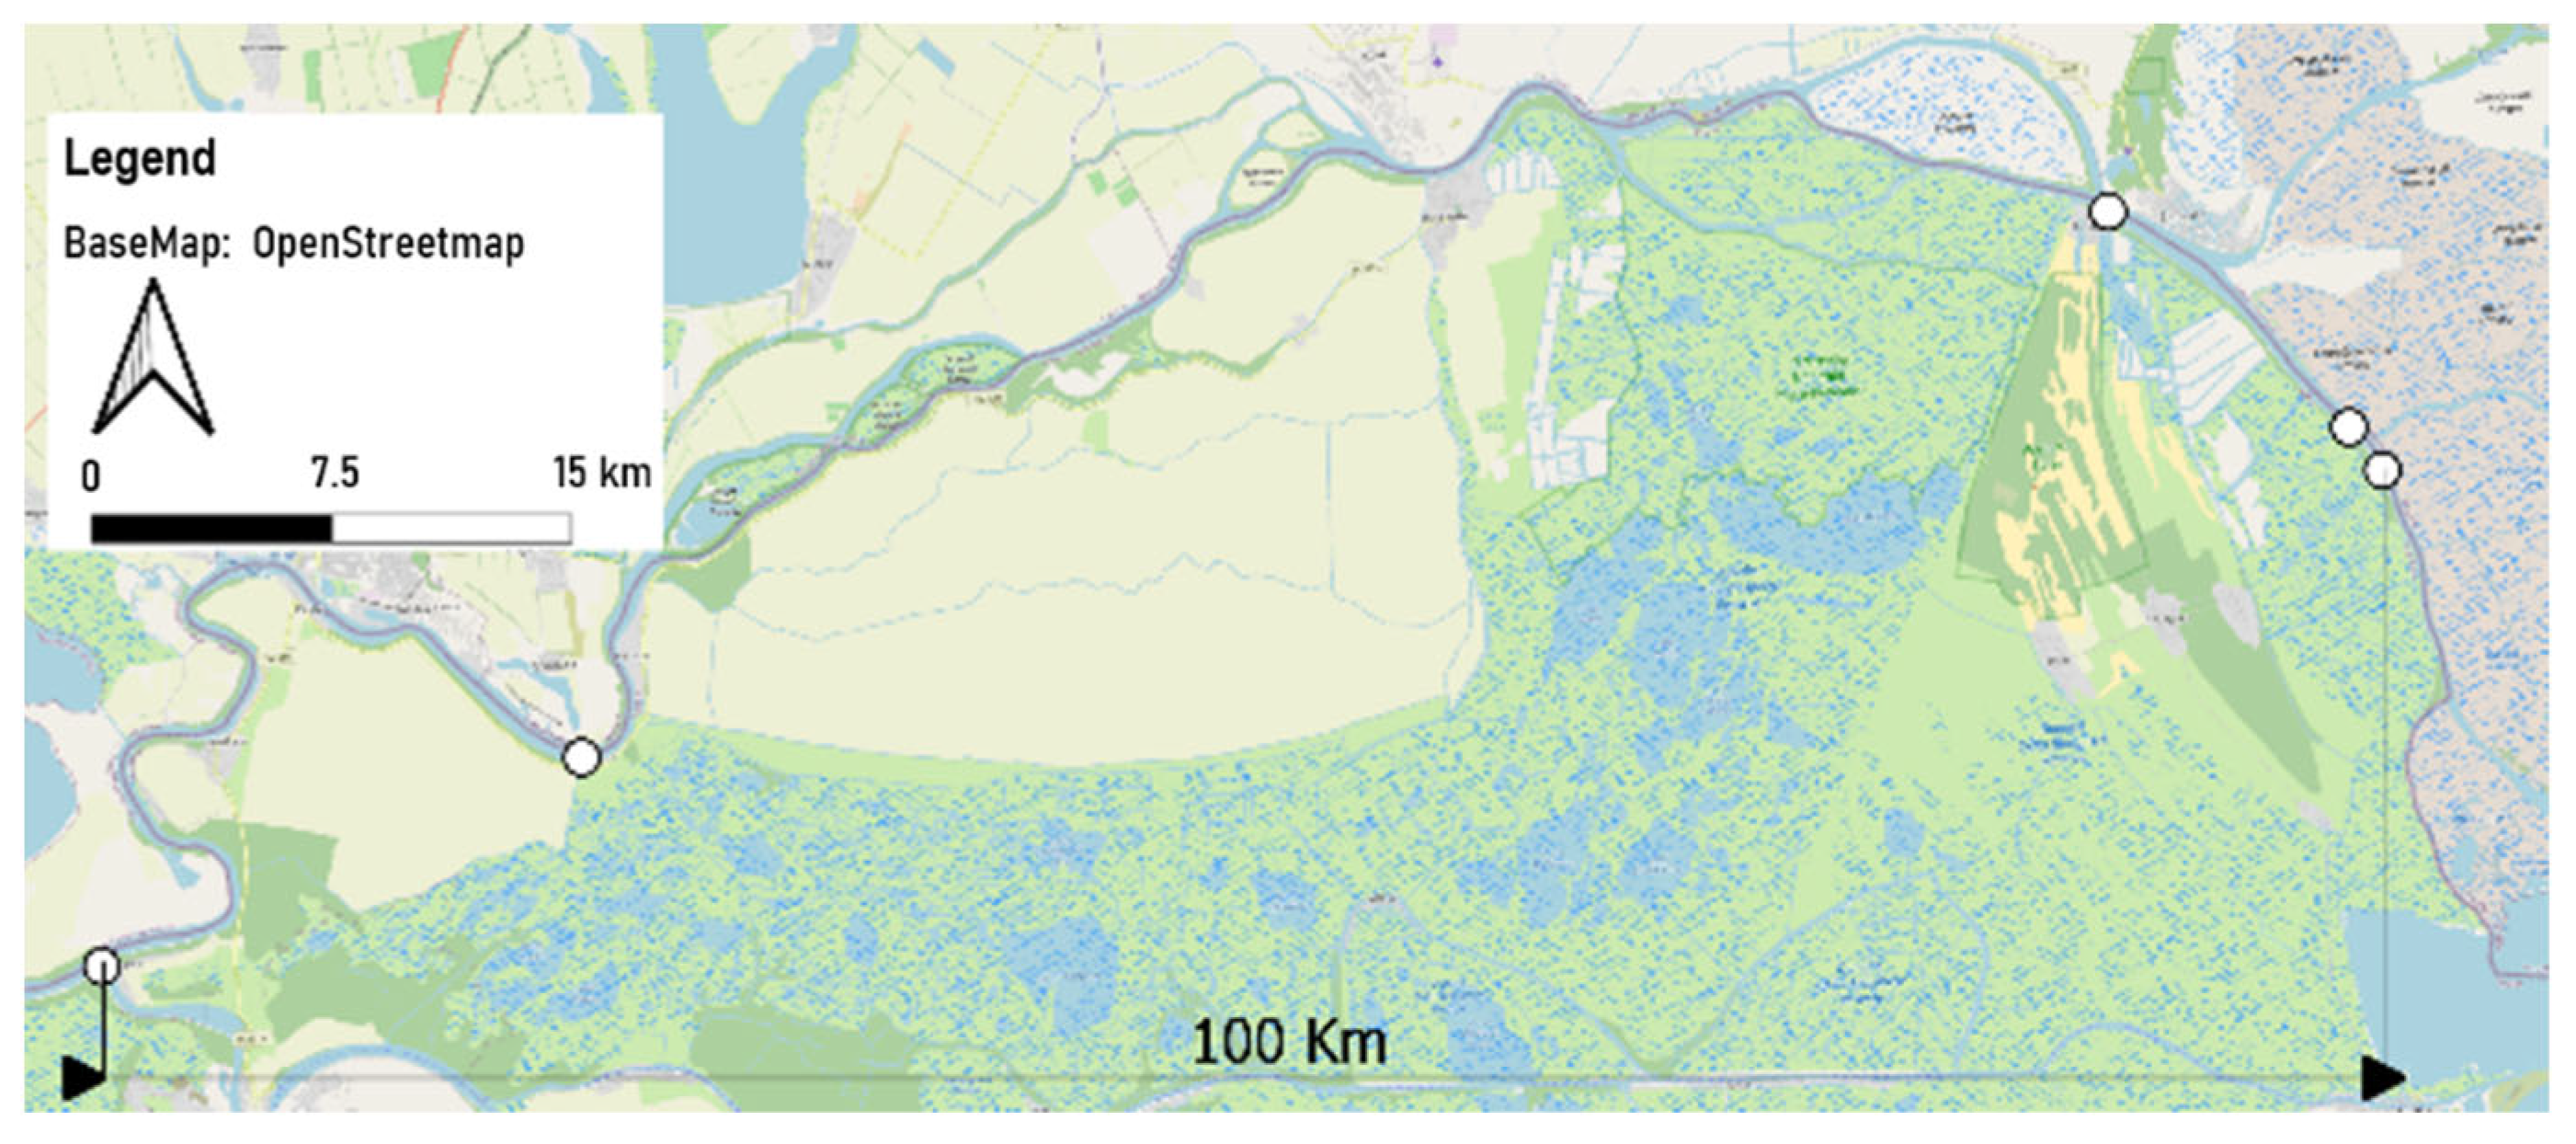
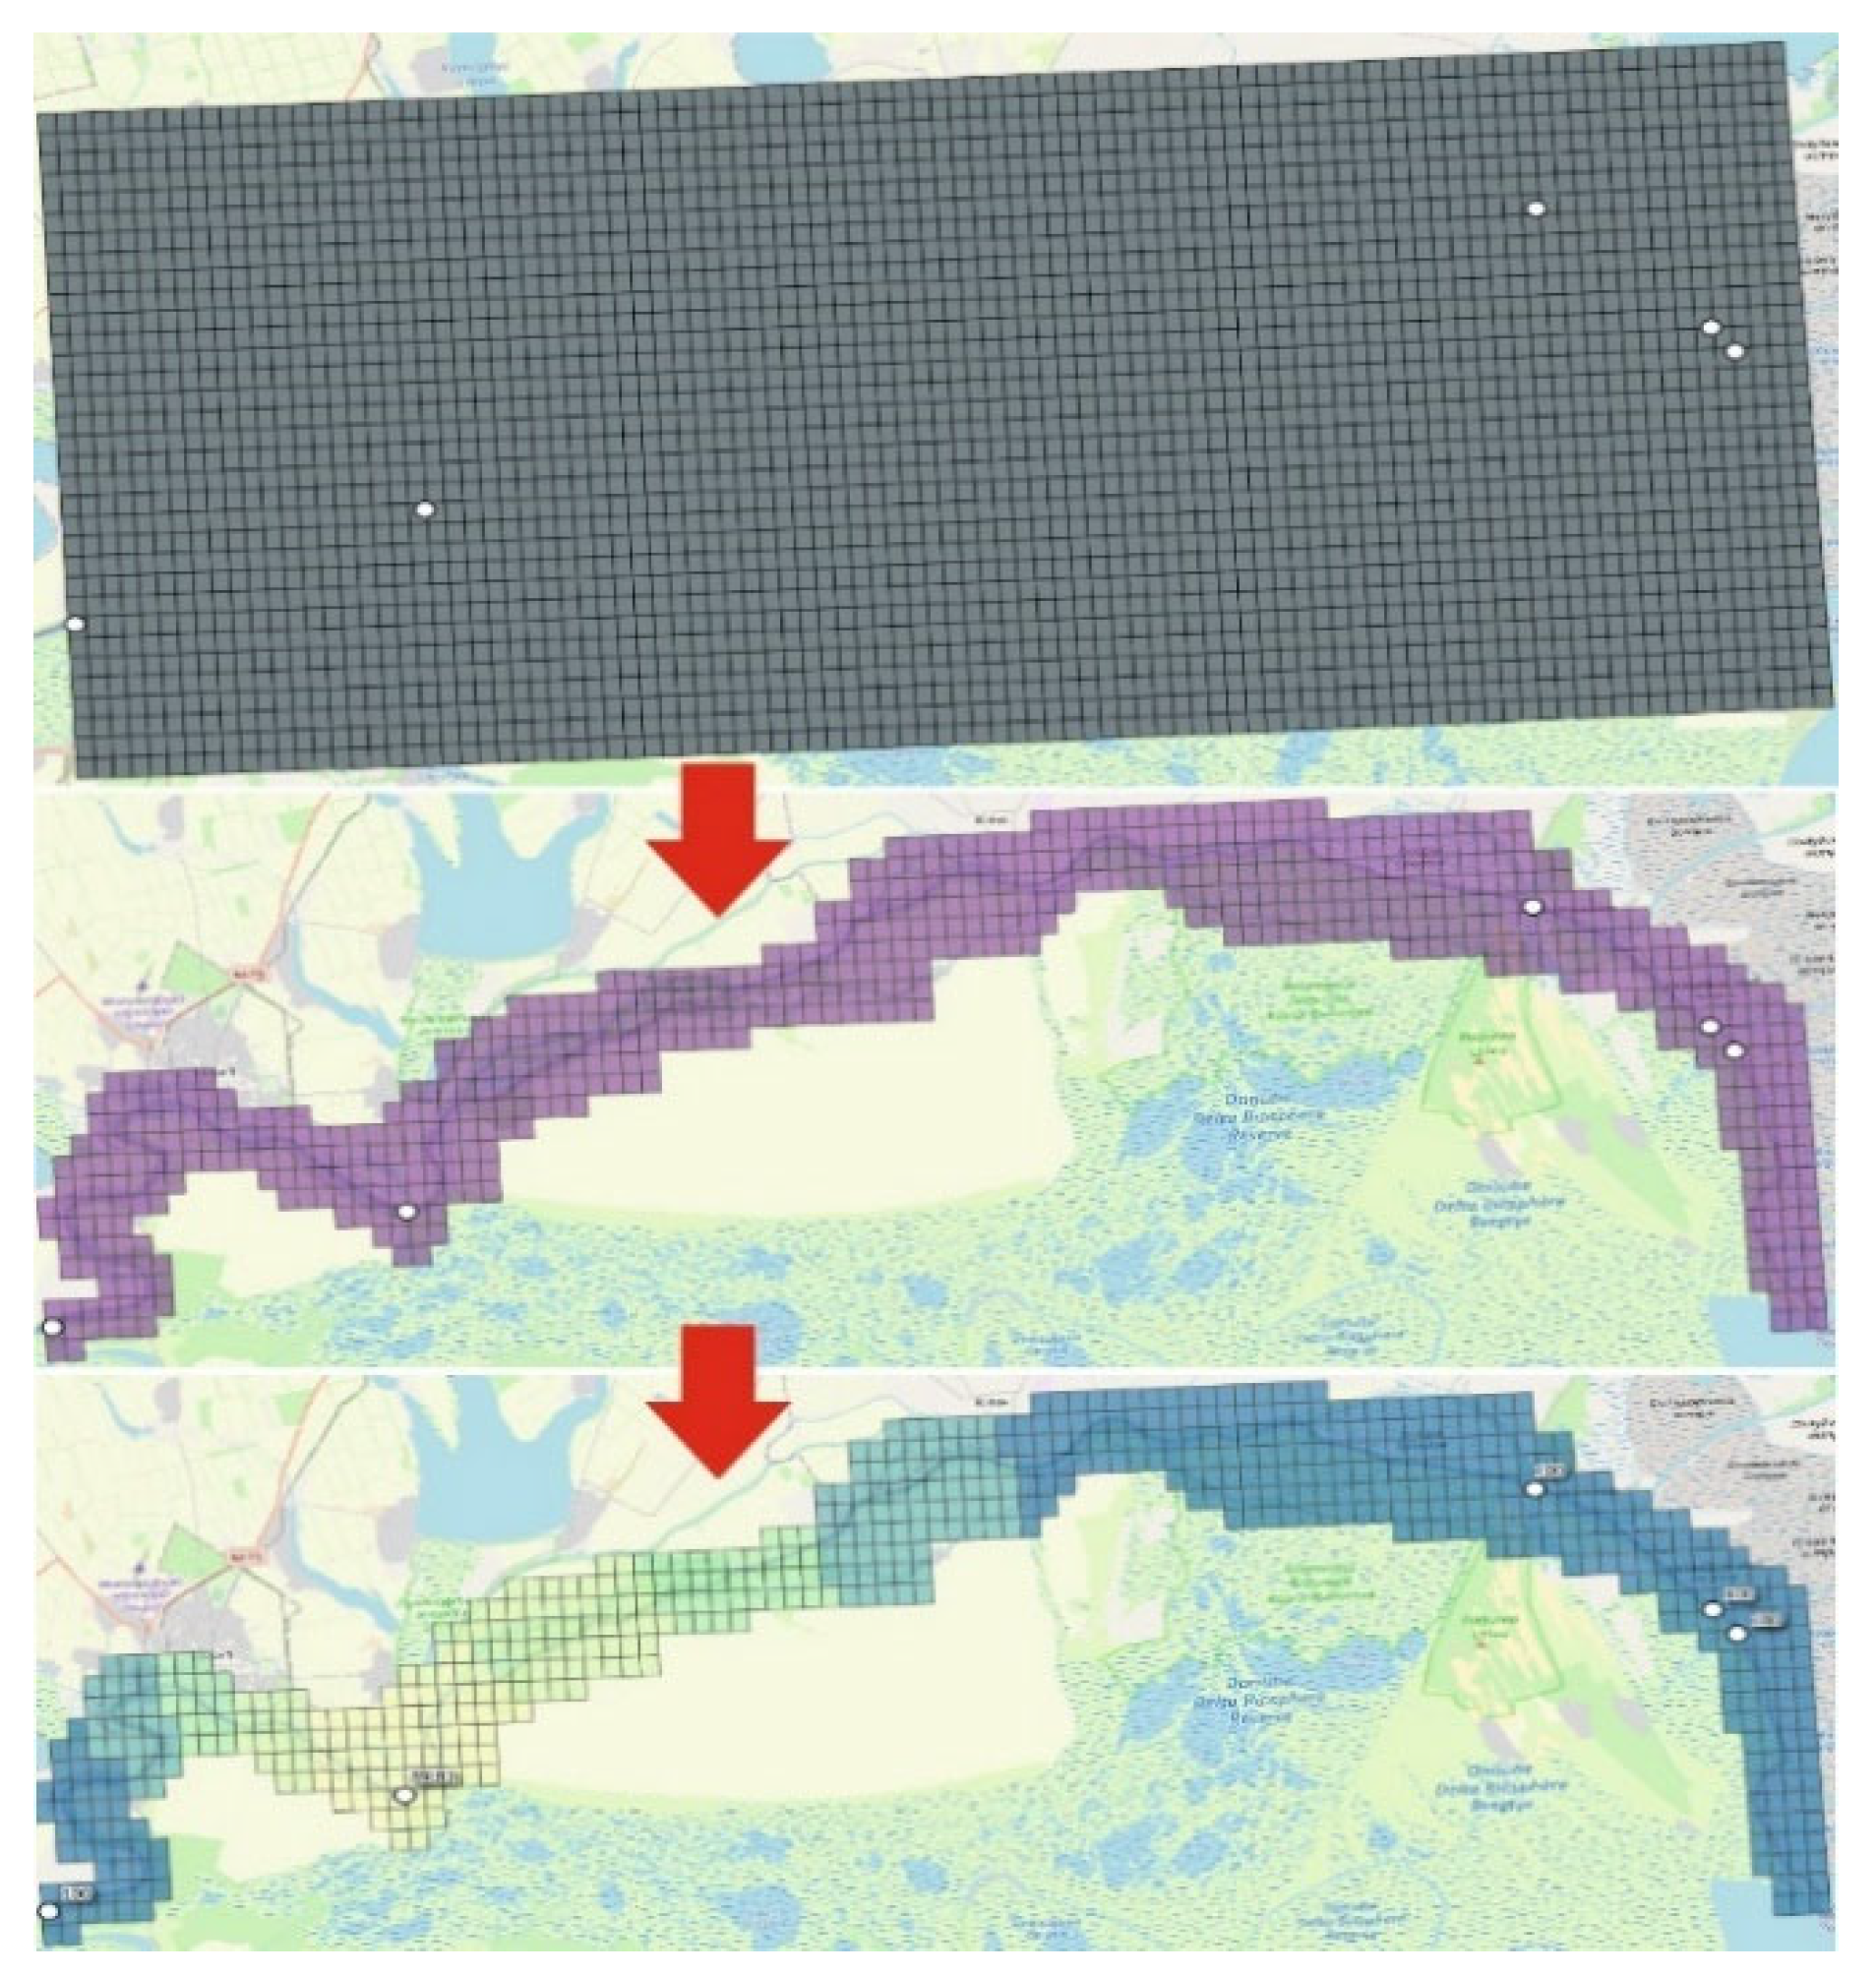
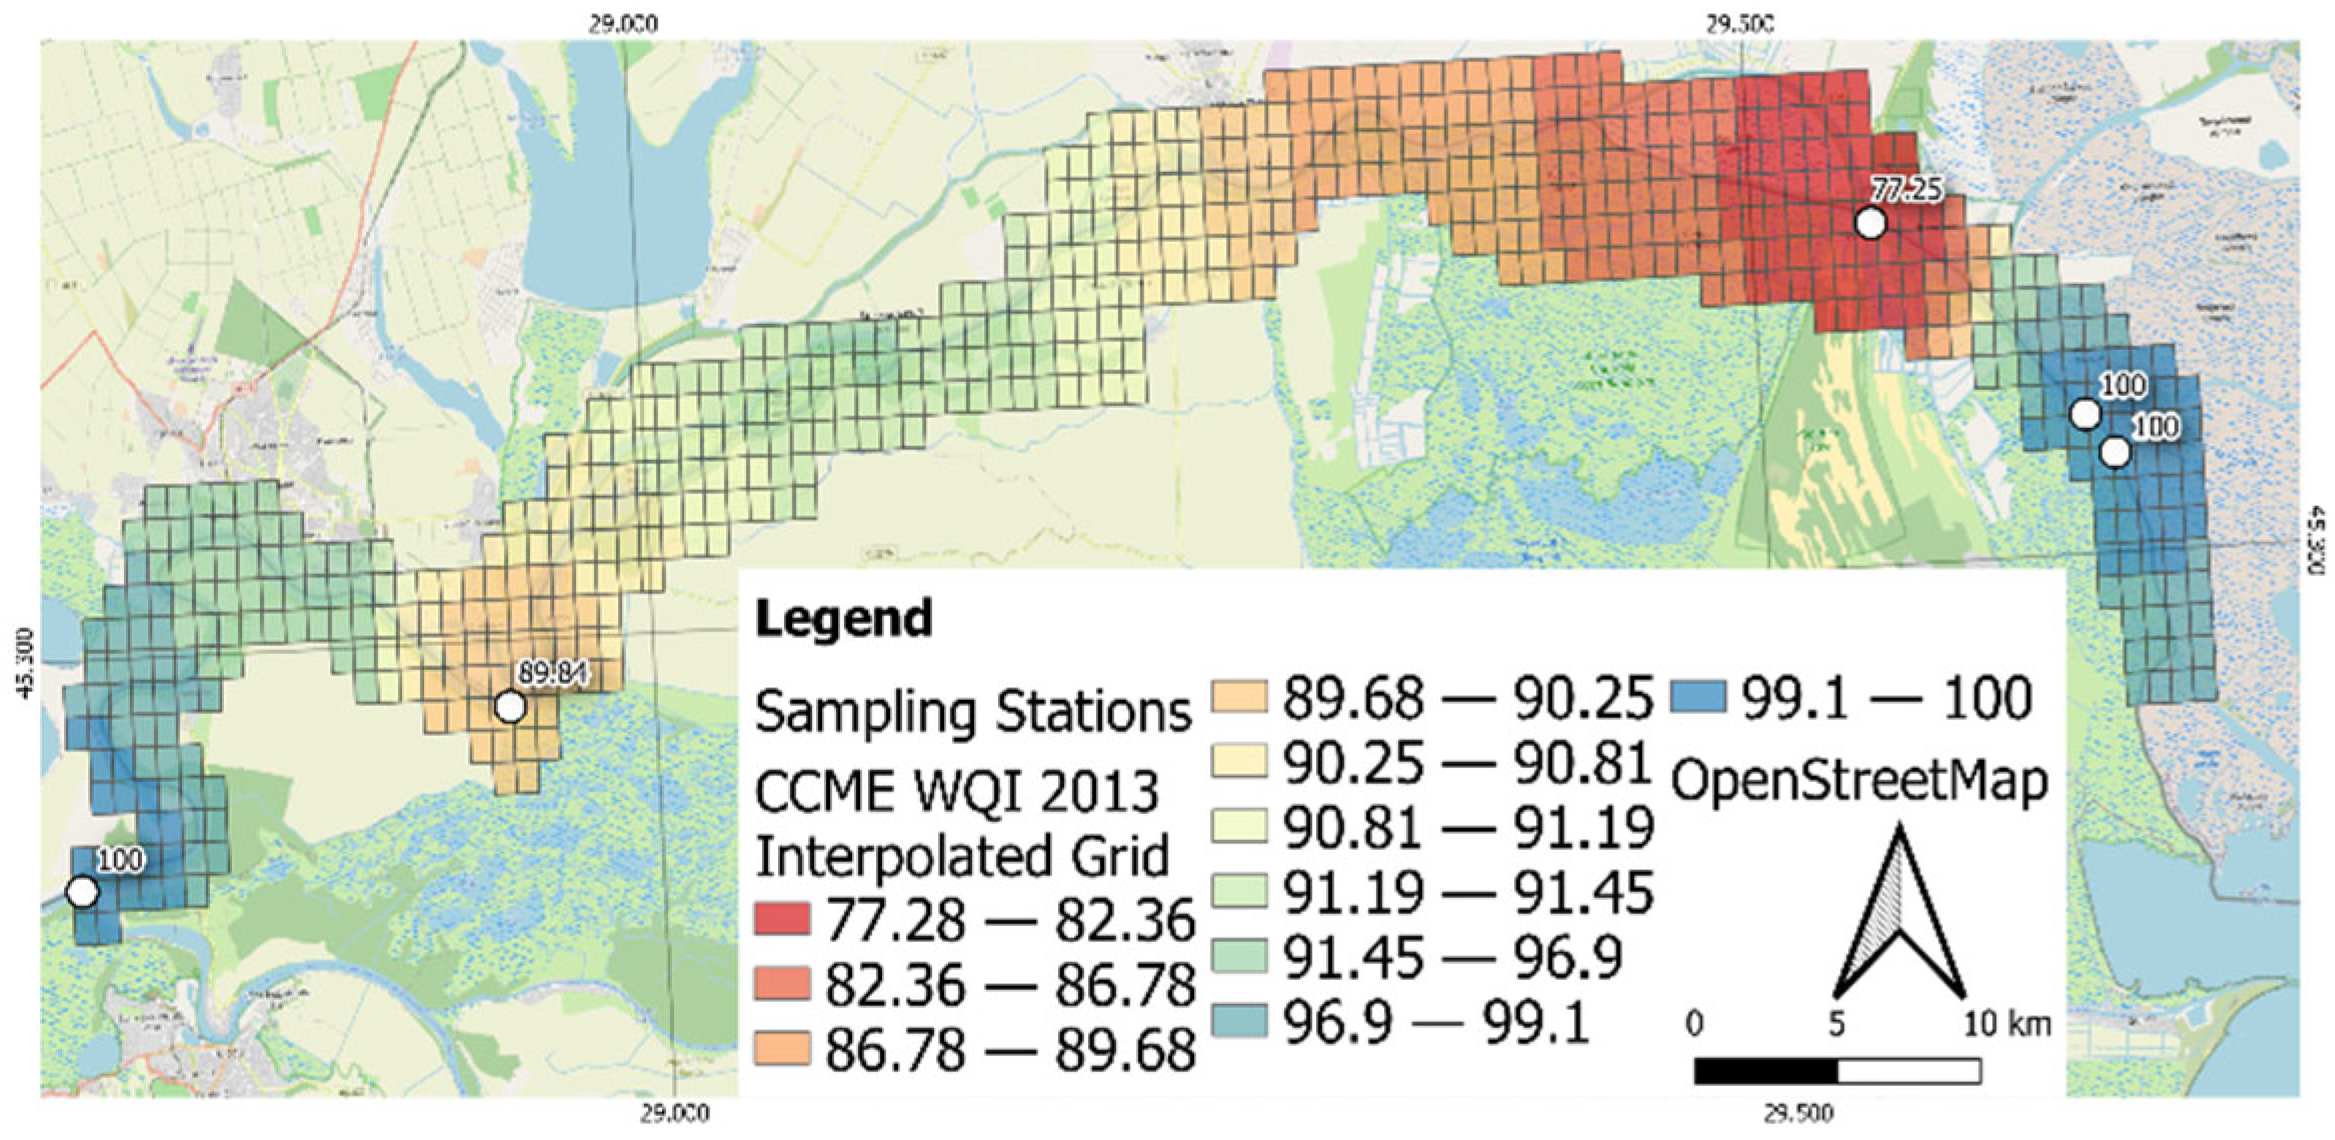
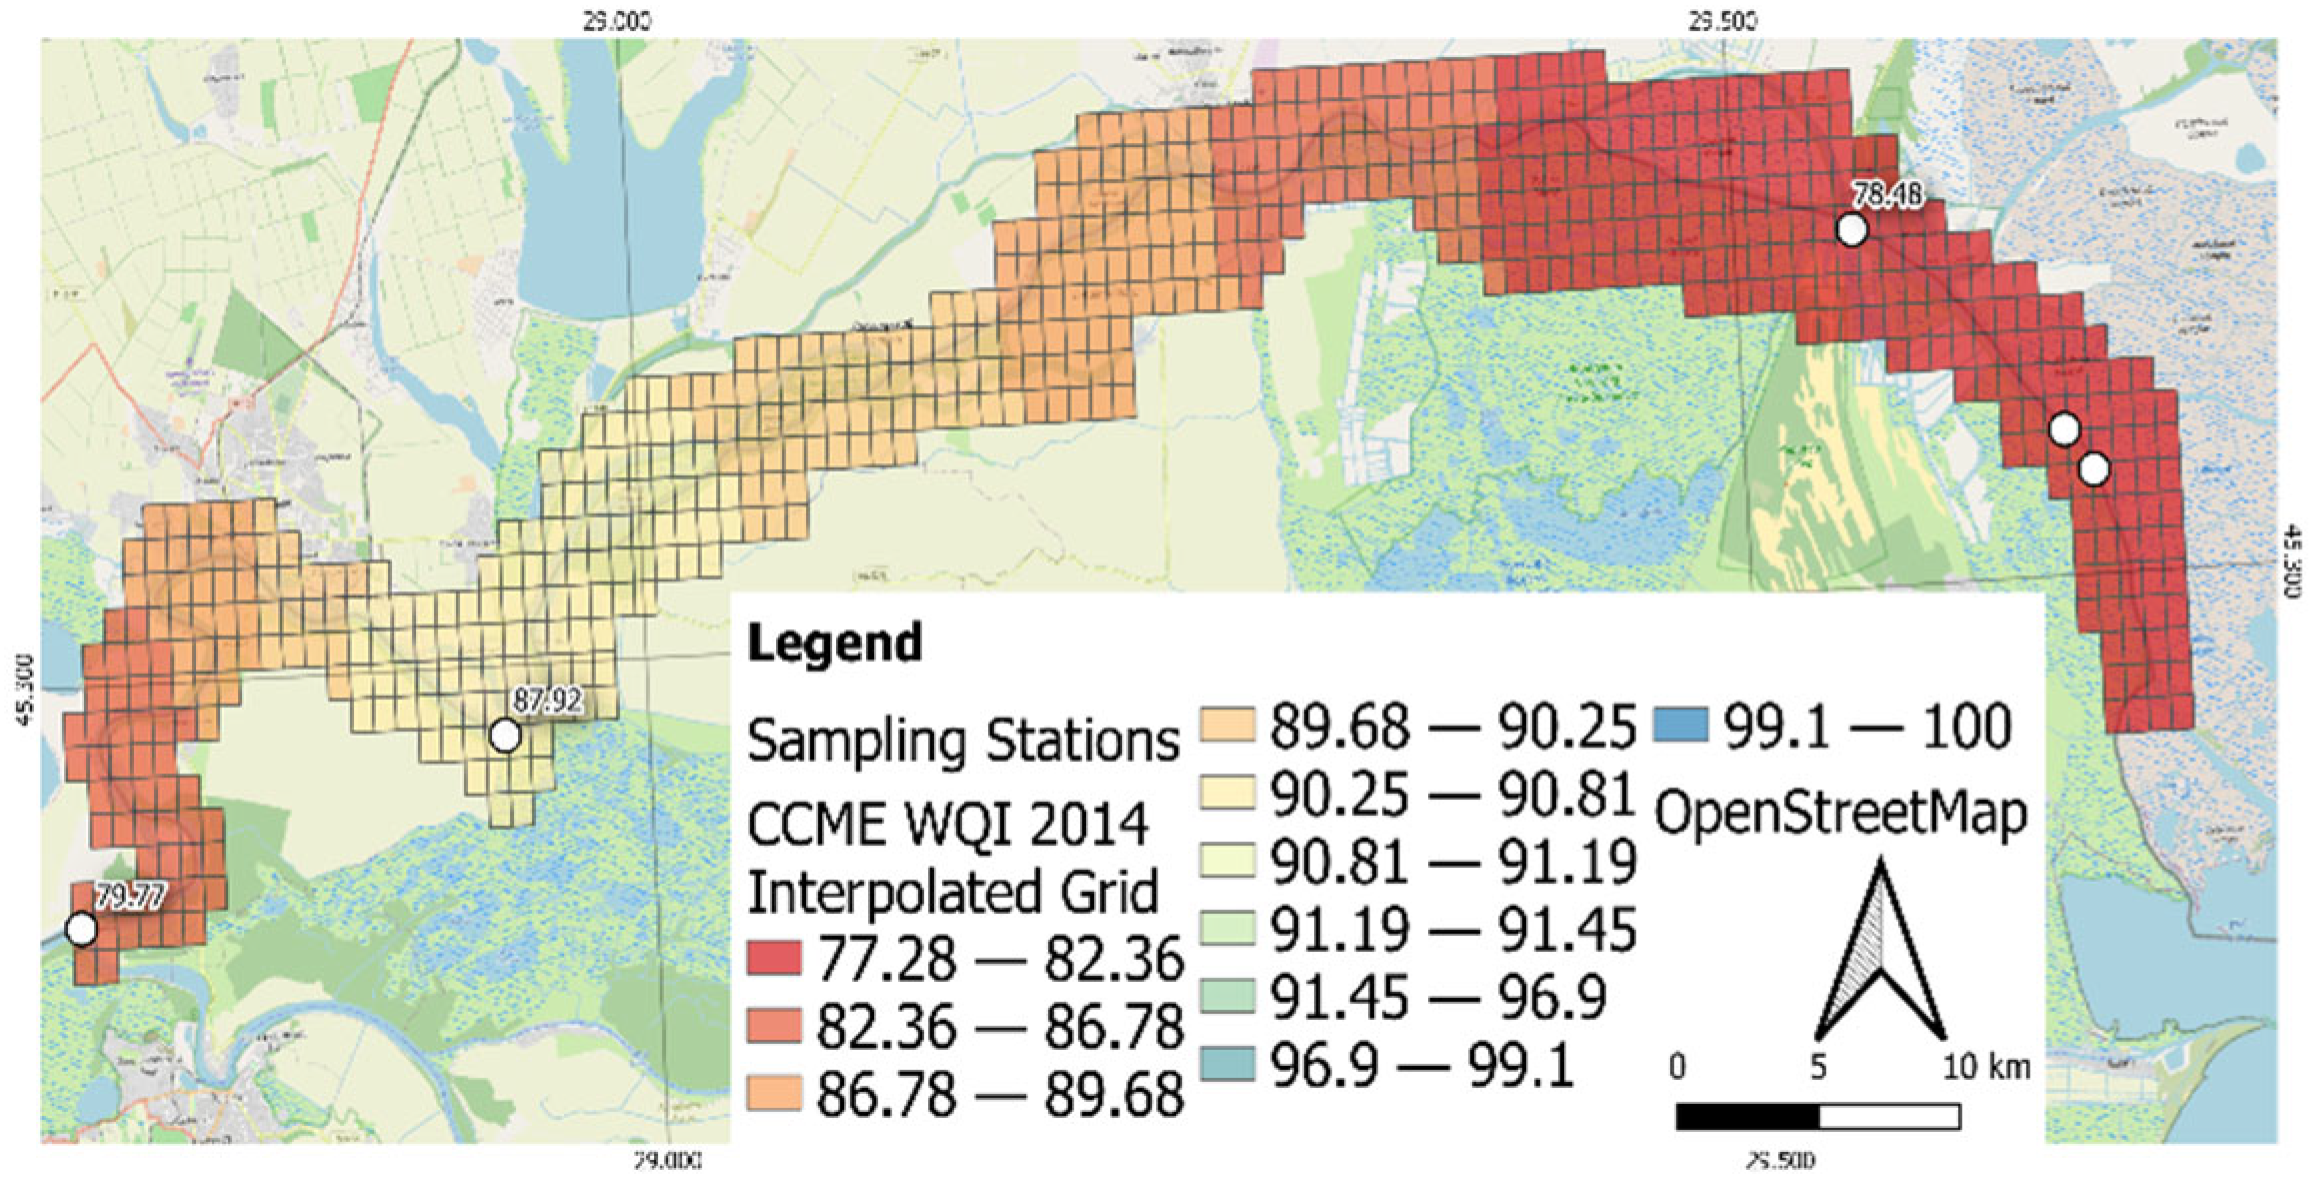
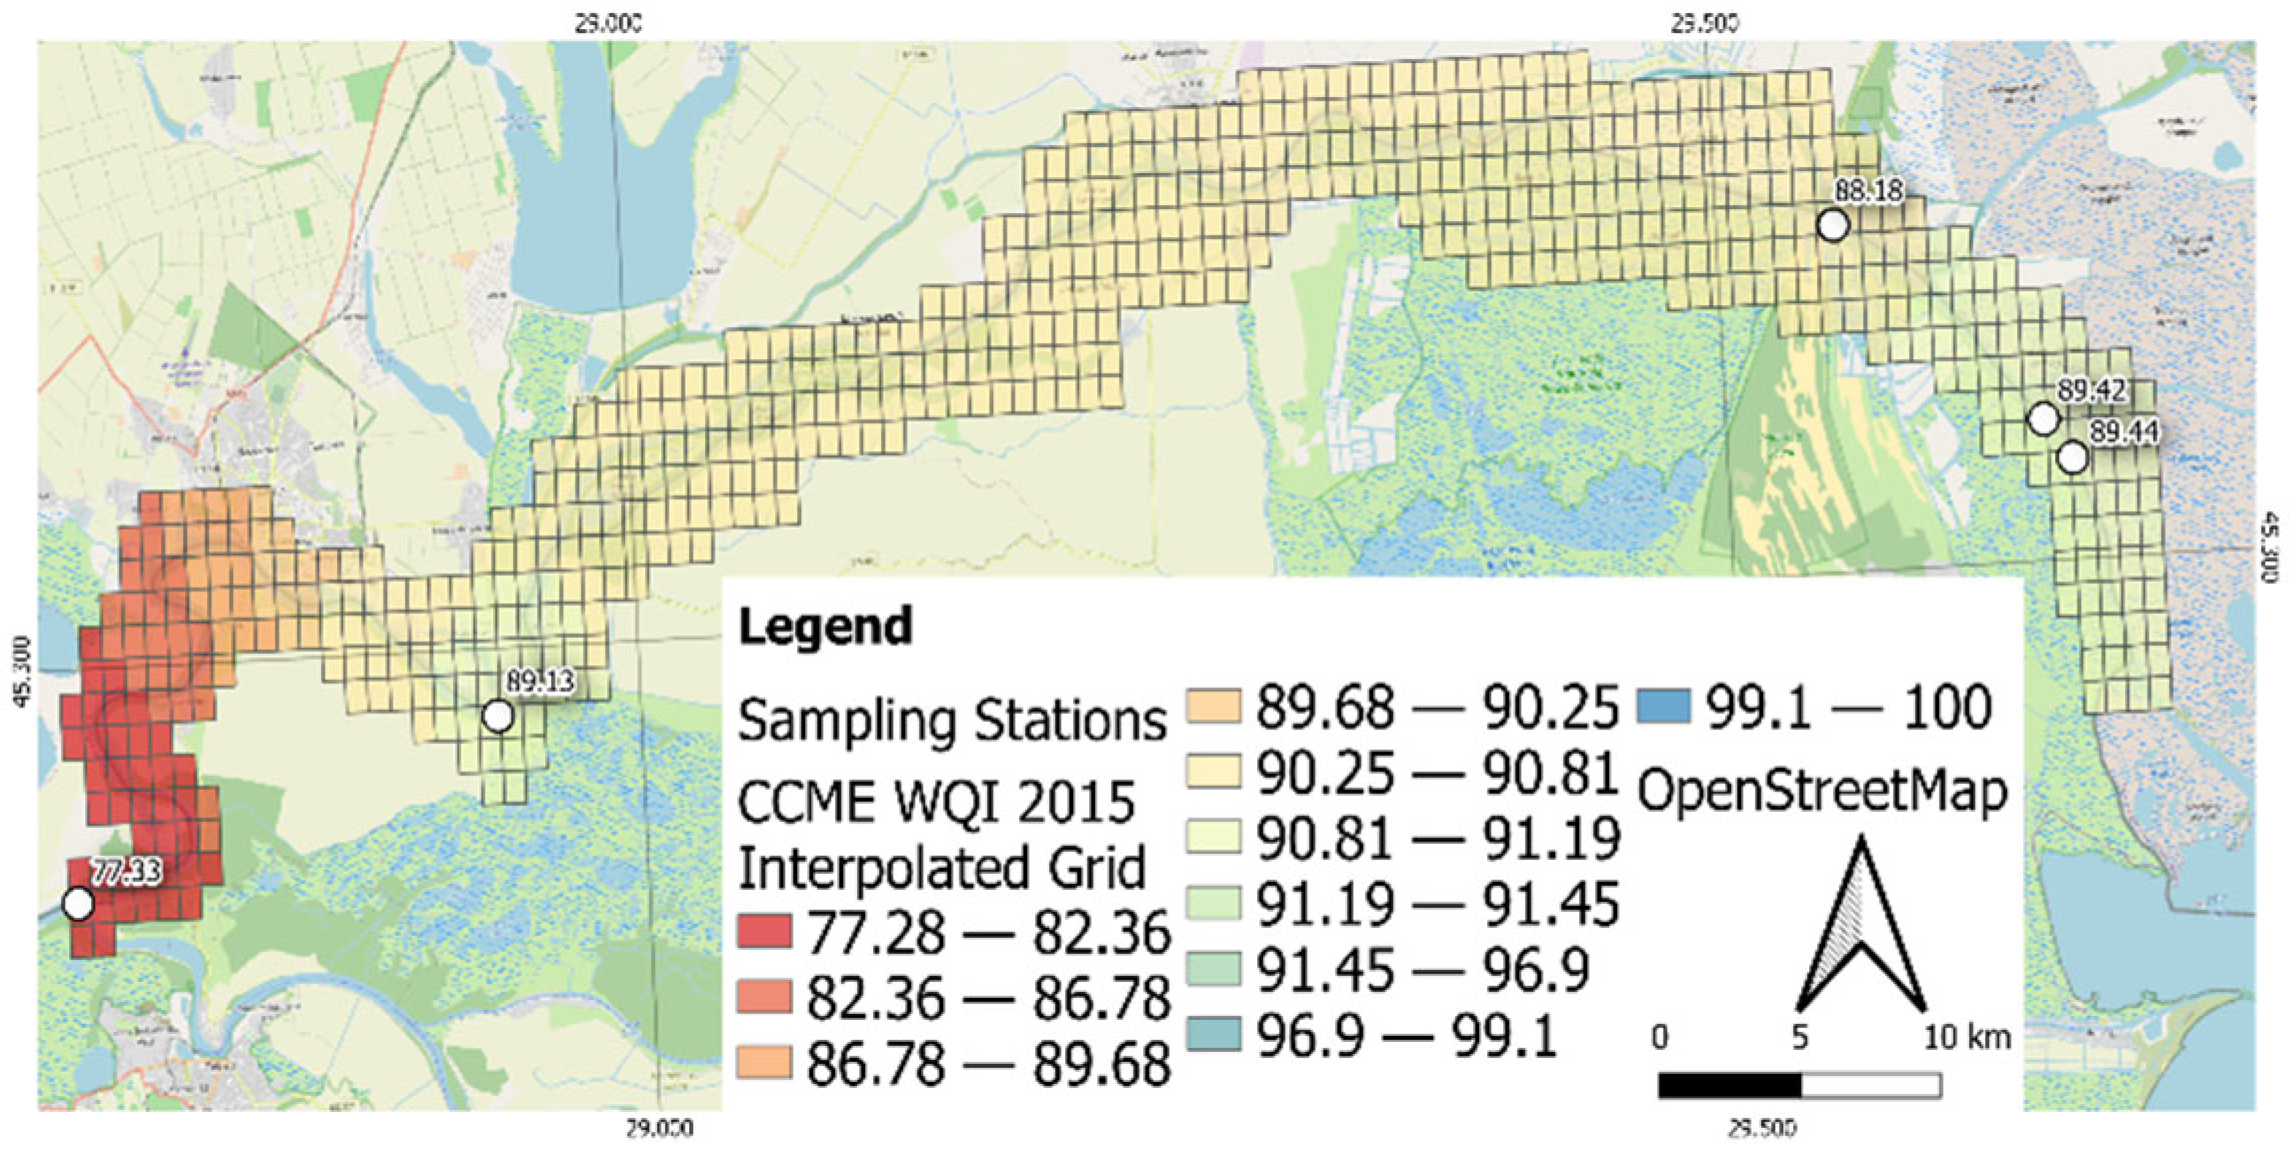
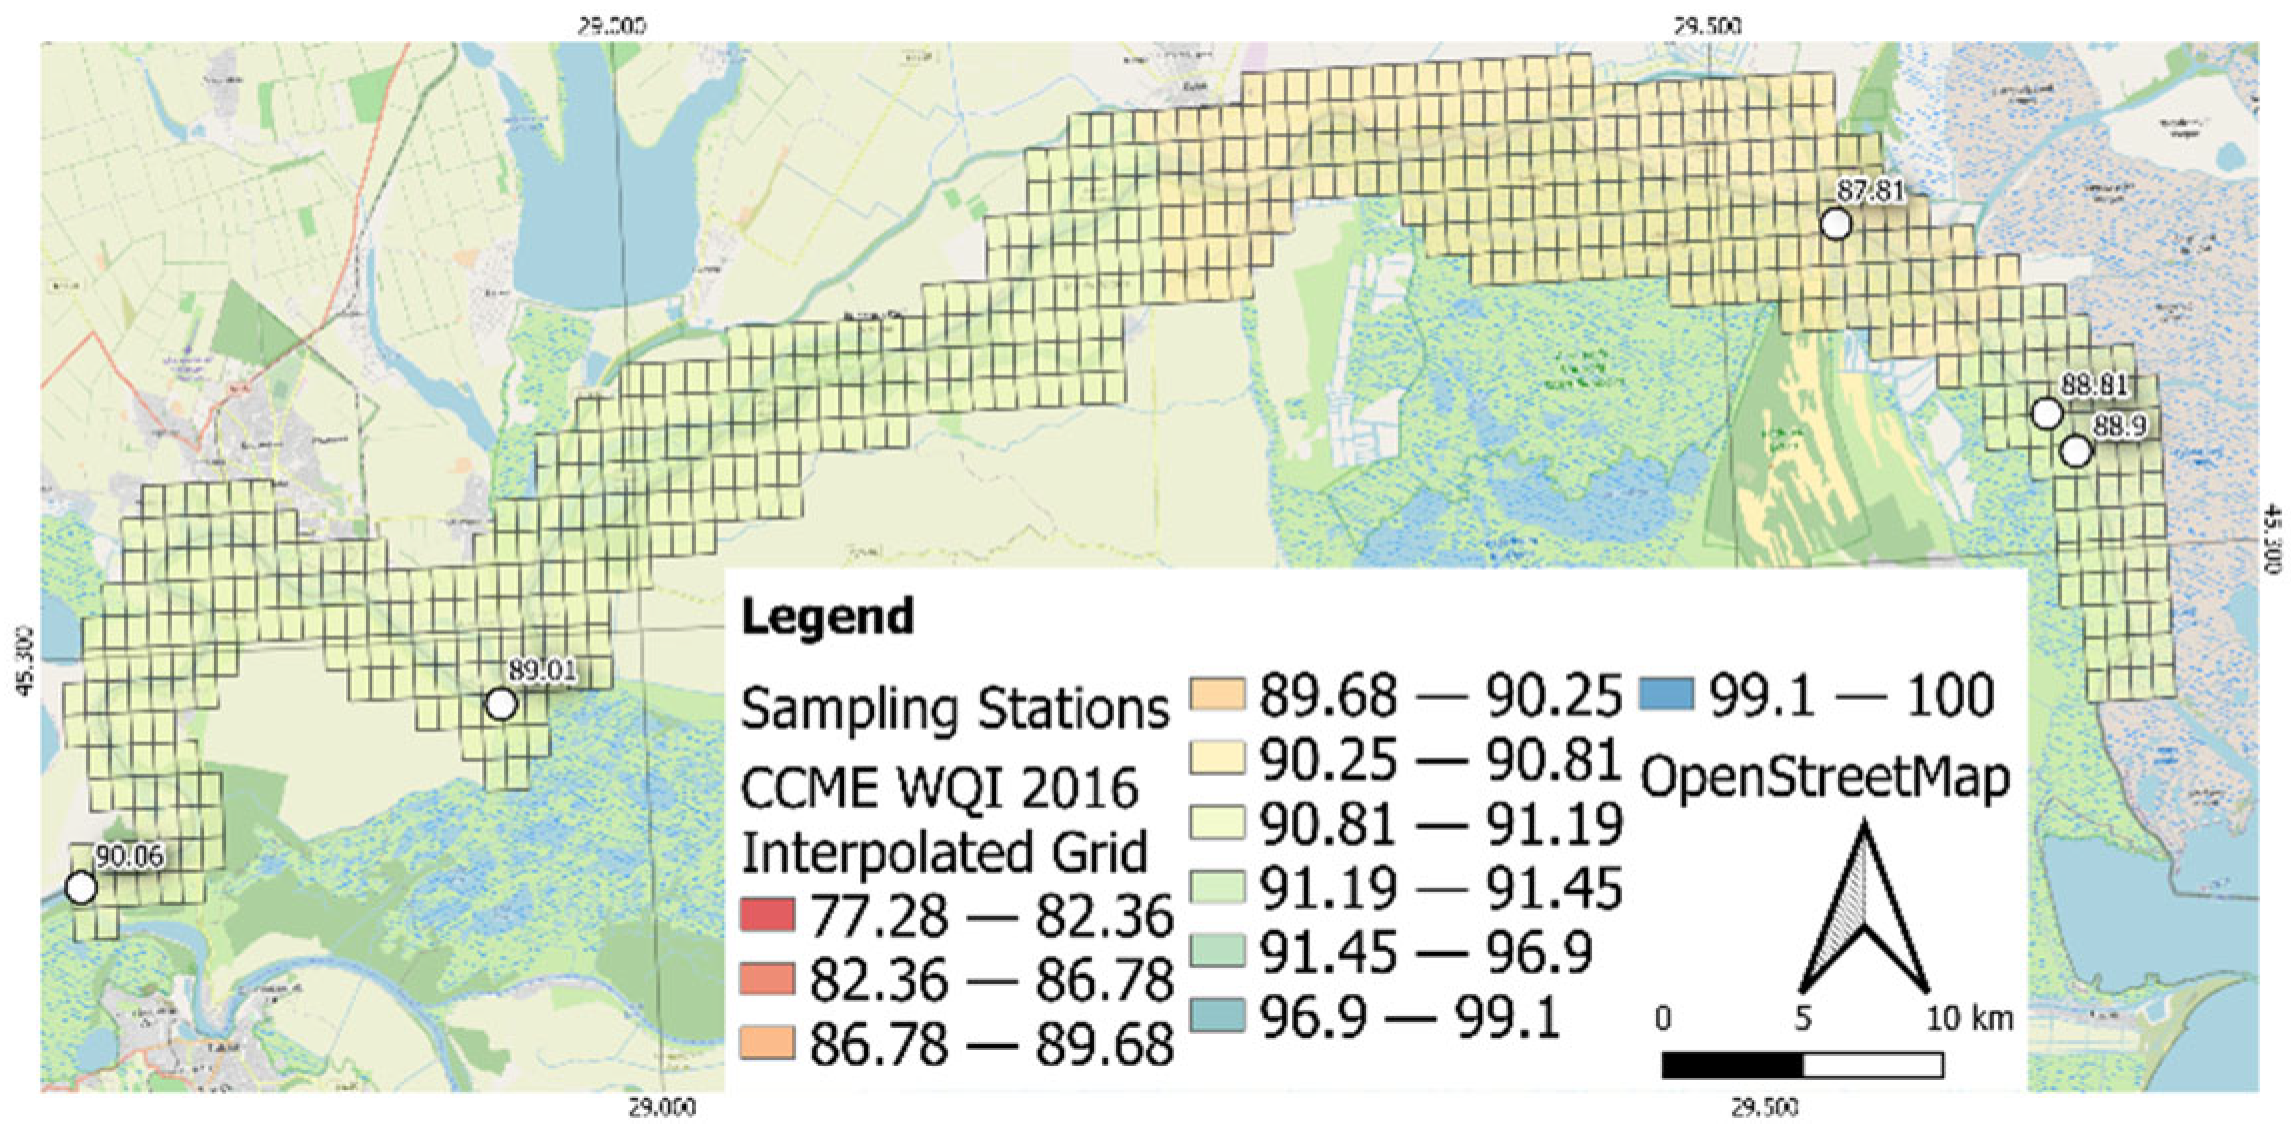
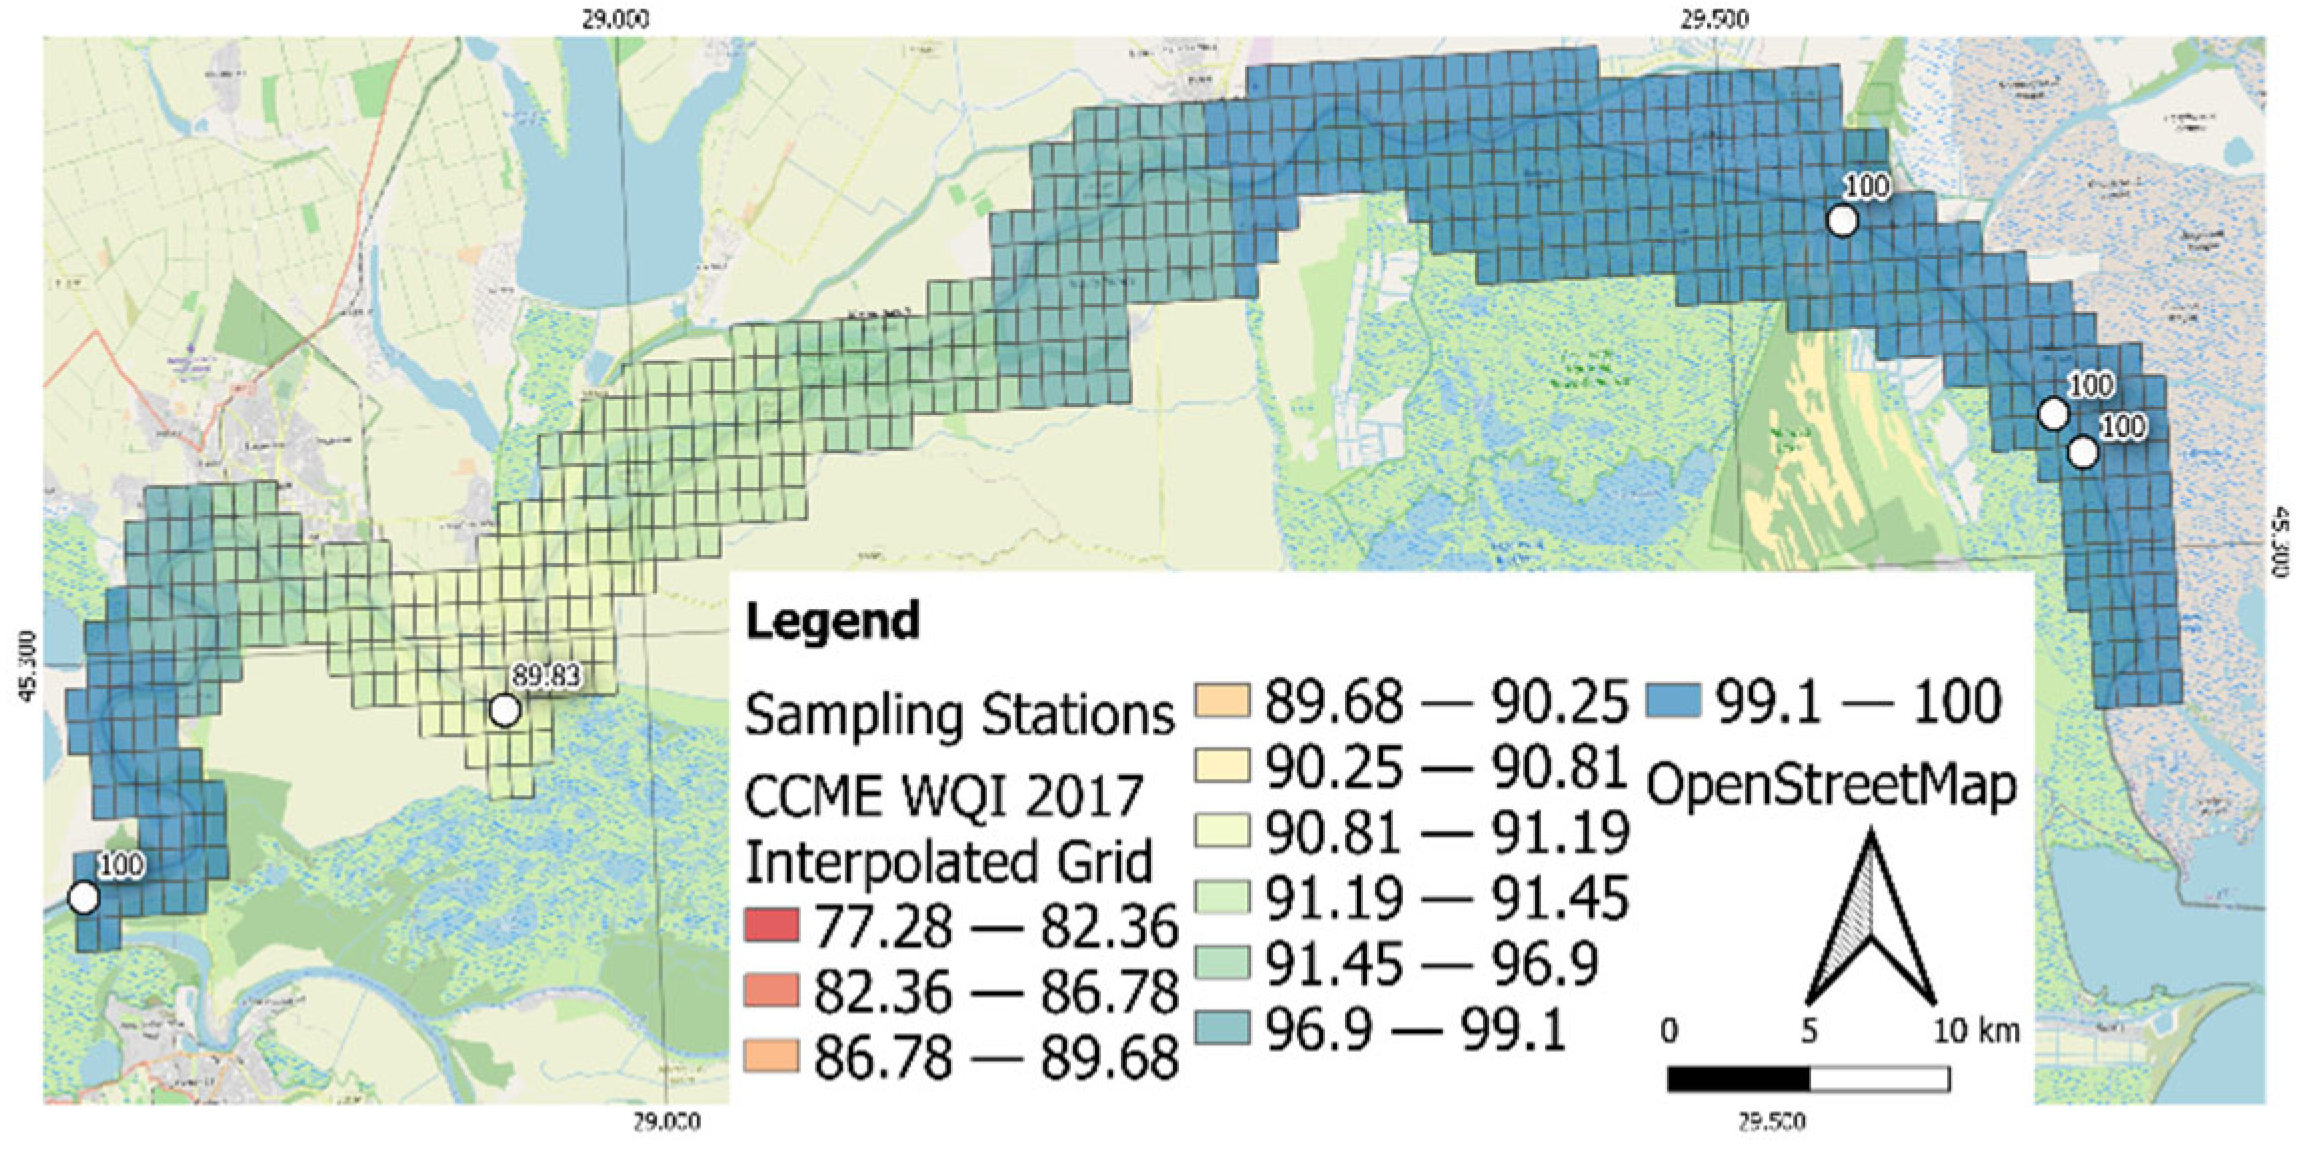
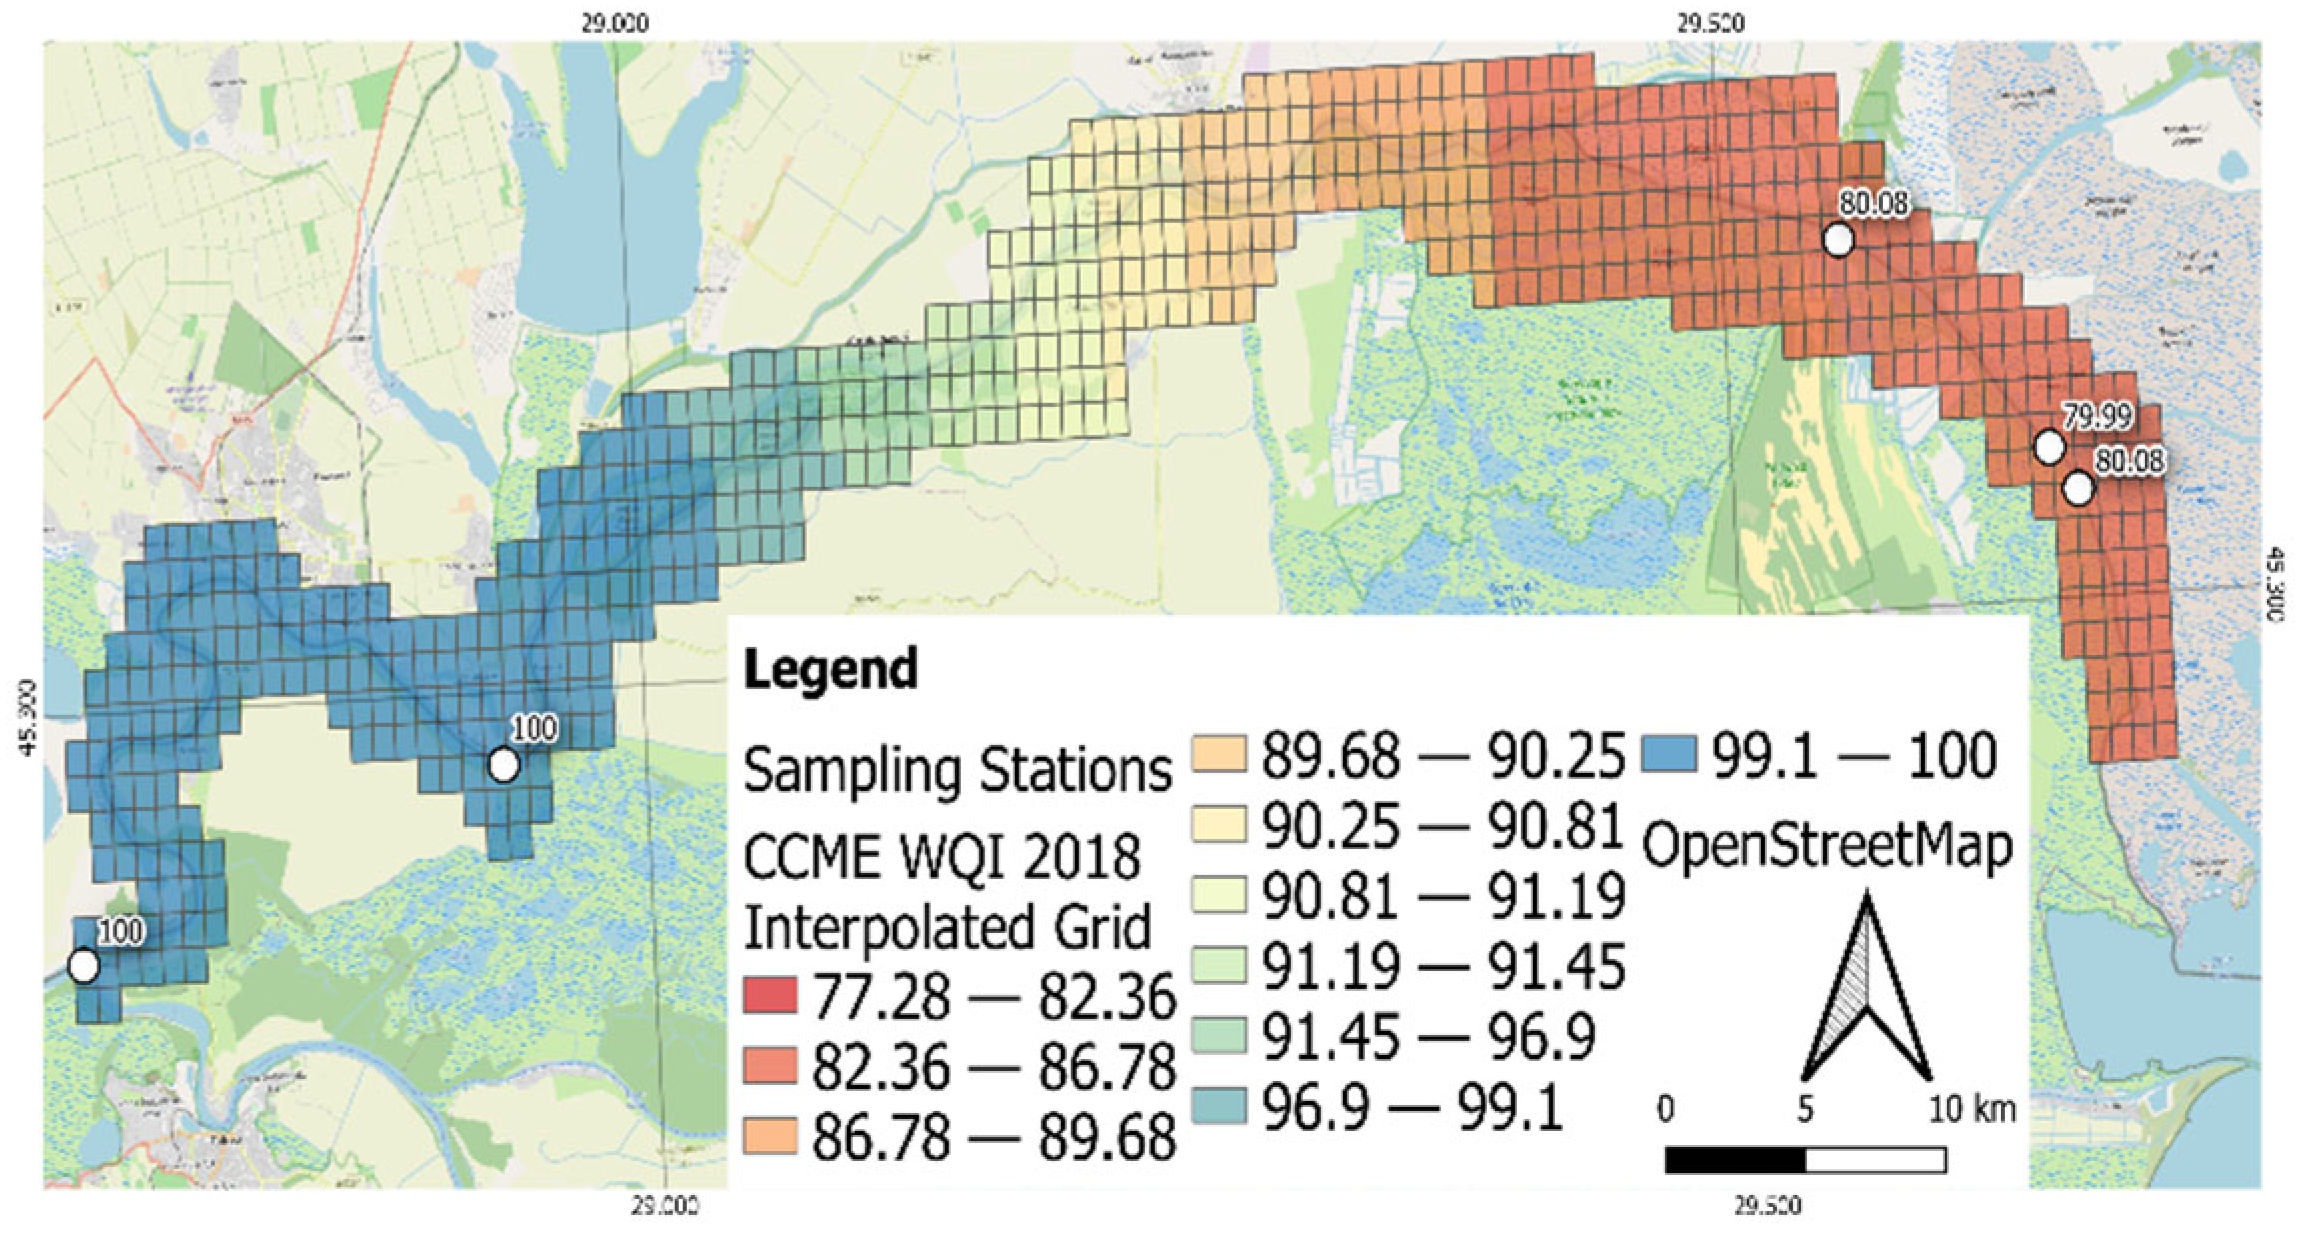
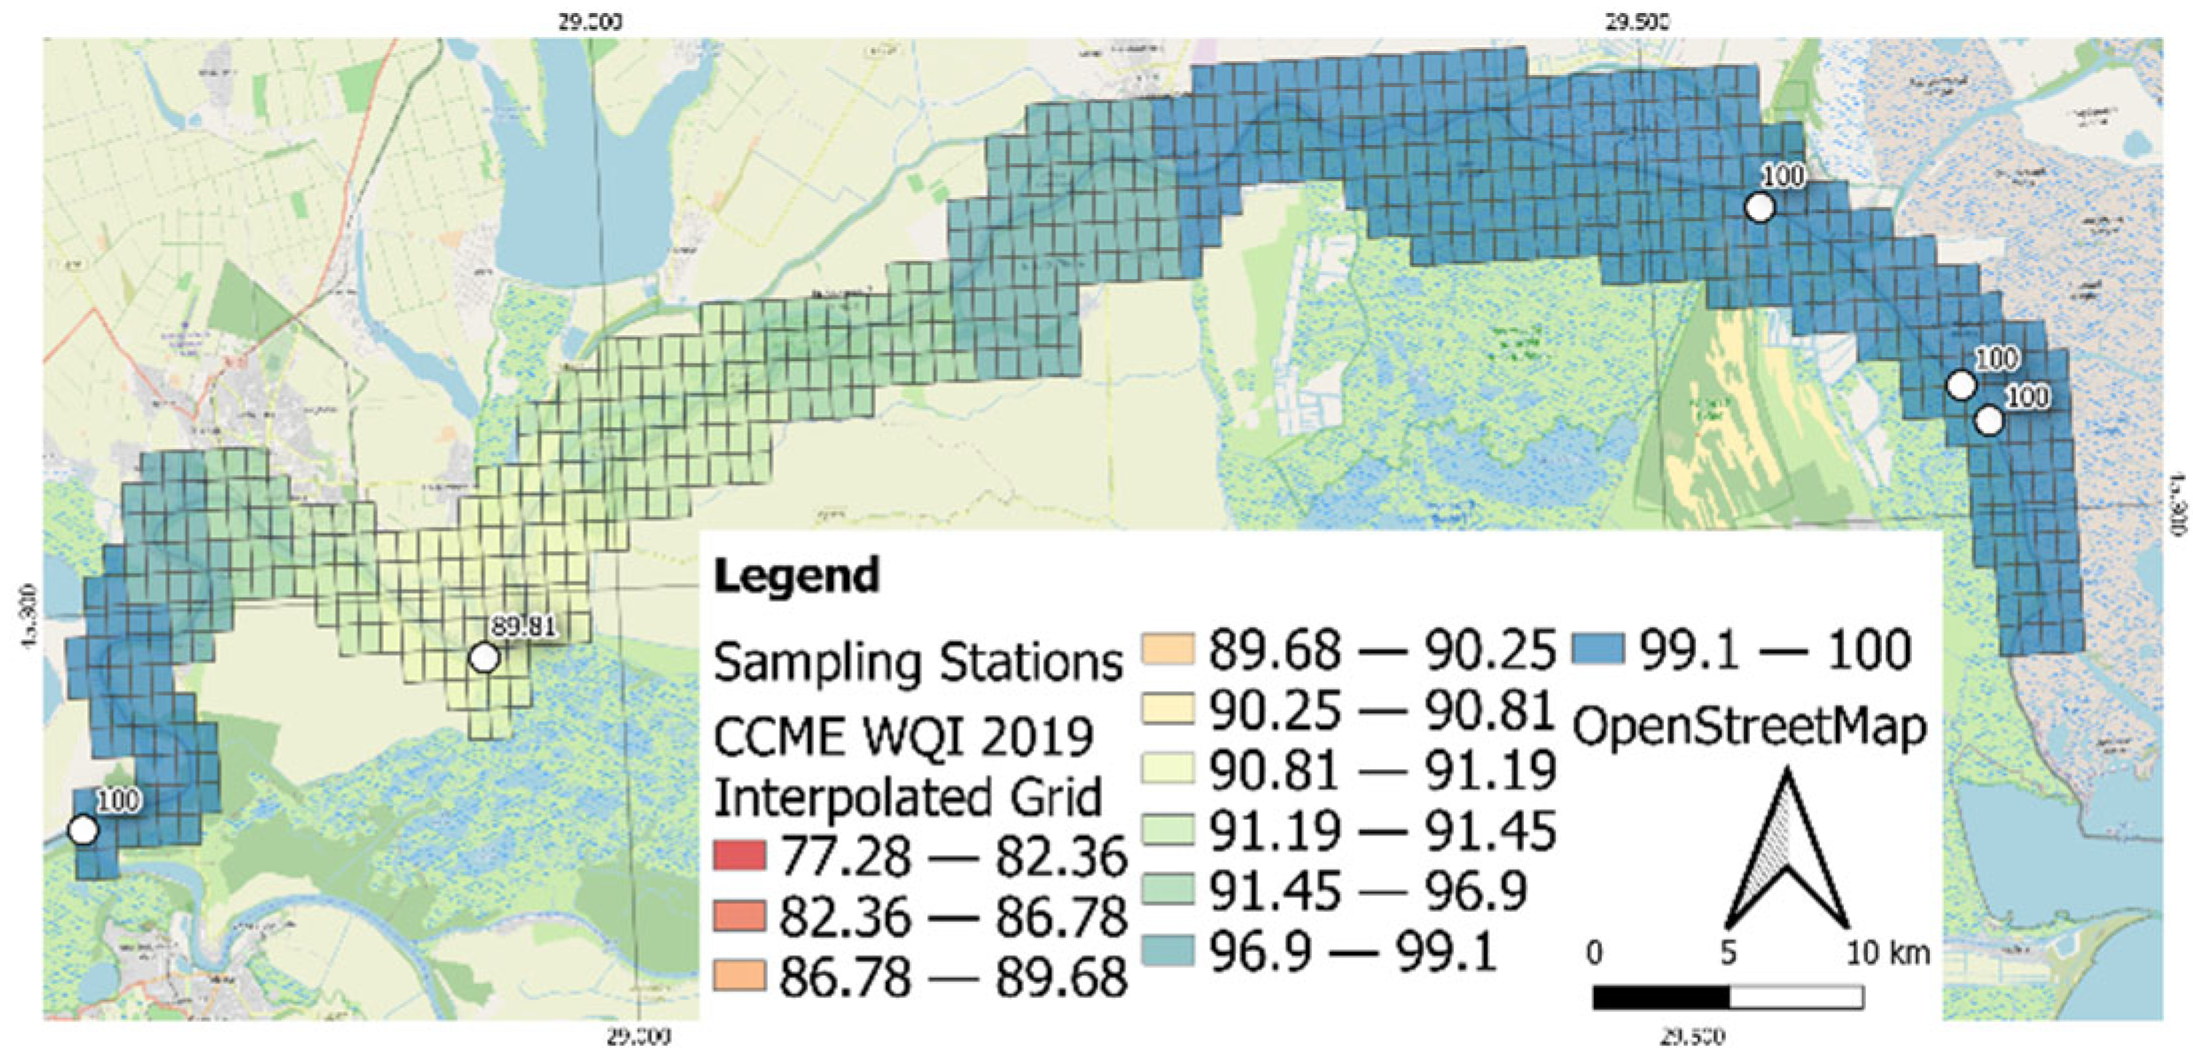
2.5. Mapping Method for the Water Quality Parameters

Nowadays, it is easy and accessible to record the coordinates, tracks, waypoints, and other related positioning information that accompany the measured datasets when collecting field data, no matter the domain. It has become a standard procedure in the data collection process to record also the spatial information for every type of field data. If the measured datasets can be processed, analyzed, and displayed in several ways, adding GPS information to those datasets enables further the development of spatial processing, analysis and representation of the same data through maps and a variety of GIS products that not only aid and accompany the tabular and graphical representation of the data but sometimes offers more information by integrating other spatial variables that enables the author to better disseminate the results. For this study, the Canadian Water Quality Index with respect to the nutrient concentration was calculated over 7 years of monitoring in 5 sampling stations along the Chilia branch of the Danube River in the Danube Delta. The database contained the point coordinates for each sampling station, which determined a GIS approach towards the map representation of the nutrient data. Taking into account that the distance between the upstream and the downstream sampling stations is roughly 100 km determined a certain data representation procedure (Figure 2).
In order to have a readable and comparable representation of the data, certain aspects in the map layout had to be exaggerated due to the low scale of the monitored area. Usually, this type of data is interpolated along the river surface and length but that would imply that the data could not be easily read. This considerable aspect determined an exaggerated feature approach which consisted in representing the data through a color-shaded grid of the interpolated data. Thus, for the whole stretch of the river segment, a polygon grid was created and altered according to the river flow. This grid exceeds the area of interest, but by doing this its cell size is exaggerated enough to represent the data accurately (Figure 3, up and middle).
In order to give the grid cells interpolated values along the river course, the yearly values of the parameter were interpolated. The raster result was sampled according to the grid’s cell centroids and then the attributes of the samples were transferred to the cells. The resulting grid cells were color-displayed based on 10 graduated quantile classes (Figure 3, down). The same methodology was applied for all the yearly values of the parameter and by keeping the scale of the graduated cell values enabled in having a consistent data representation which can be compared throughout the years. This is a basic GIS procedure in order to represent interpolated data for large areas and it was done by using QuantumGIS (QGIS) application, version 3.10.

3. Results and Discussion

The statistical analysis of the nutrient concentrations from the Chilia branch surface water requires methodologies that allow the evaluation of trends and a high degree of confidence. Combining spatial analysis by using GIS tools with nutrient concentration data, an easy-to-visualize product can be obtained, helpful for water quality management [28].
Ammonium nitrogen is present in the surface water of the Chilia branch at very low concentrations, which do not exceed the limit value corresponding to good ecological status [32]. With one exception (Periprava 2014), nitrite nitrogen does not exceed the standard quality. Nitrate nitrogen, phosphorus from orthophosphate, and total phosphorus also do not exceed the standard limits (Table 2). Due to organic nitrogen, total nitrogen has a different variation with highest values (over the maximum limit) in 2015 at sampling points and also in 2018 (Bastroe downstream). The high content of organic nitrogen, compared to the low content of inorganic nitrogen, is due to the fact that organic nitrogen seems to be assimilated by aquatic organisms at a much lower rate than inorganic forms of nitrogen [34]. In addition, some nitrogen contained in organic matter usually resists bacterial action and remains in water or sediment [35].
Analyzing the minimum and maximum values during the investigation period, the maximum values were observed as follows: Izmail downstream (ammonium nitrogen), Periprava (nitrite nitrogen and total nitrogen), and Ceatal Chilia (nitrate nitrogen, dissolved and total phosphorus). For the corresponding period, the minimum values were determined in surface water from Ceatal Chilia (ammonium nitrogen), Bastroe upstream (nitrite nitrogen), Izmail downstream (nitrate nitrogen and total nitrogen), and Periprava (dissolved and total phosphorus) (Table 5).
Taking into account the negative values of flattening index, Kurtosis, of ammonium nitrogen concentrations (Ceatal Chilia, Periprava, Bastroe upstream and downstream), nitrite nitrogen concentrations (Izmail upstream), nitrate nitrogen concentrations (Izmail downstream, Bastroe upstream and downstream), total nitrogen (Izmail downstream, Bastroe upstream and downstream), dissolved phosphorus (Bastroe downstream), and total phosphorus (Izmail downstream, Bastroe upstream and downstream), the distributions are platykurtic, flat, which means that the values of their concentrations are very scattered compared to the average value expressed in mg/L and indicate a high degree of heterogeneity of the determined concentrations. For the other indicators, kurtosis index is positive, so the concentration distributions are leptokurtic, sharp, which means that the concentration values are very close to the average values, with a high degree of concentration homogeneity.
According with asymmetry index, skewness, which is negative, the distributions of ammonium nitrogen concentration from Bastroe upstream and downstream and dissolved phosphorus concentration from Periprava are asymmetrical at the left, that means that the high concentrations predominate and the low concentrations are considered extreme concentrations.
The positive values of Skewness index computed for the rest of the chemical indicators/sampling points, means that the concentration distributions are asymmetrical at the right; low concentrations predominate and high concentrations are considered extreme.
At computing the CCM WQI using Equation (1) given in Table 3, the Romanian guidelines stipulated by Order MEWM 161/2006 [32] were taken into account in this work, using the standard limits for the “good” water quality class. The obtained values are presented in Table 6.
Water quality from Ceatal Chilia (2013, 2017, 2018, 2019), Izmail Downstream (2018), Periprava (2017, 2019), Bastroe Upstream (2013, 2017, 2019), and Bastroe Downstream (2013, 2017, 2019) is ranked in the excellent quality class, meaning that the surface waters in the mentioned years have conditions very close to natural or pristine levels, assuring the absence of threat for the Danube River ecological system and human health [22,36] (Table 6).
In the good quality class are the surface waters from Ceatal Chilia (2016), Izmail Downstream (2013, 2014, 2015, 2016, 2019), Periprava (2015, 2016, 2018), Bastroe Upstream (2015, 2016), and Bastroe Downstream (2015, 2016, 2018). The results show that the water quality class is protected with only a minor degree of threat or impairment; conditions rarely depart from natural or desirable levels [22].
Surface waters from Ceatal Chilia (2014, 2015), Periprava (2013, 2014) and Bastroe Upstream (2018) are ranked in the fair quality class, the water quality being usually protected but occasionally threatened or impaired; conditions sometimes depart from natural or desirable levels [22].
Low values of CCME WQIs have been attributed to a high level of total nitrogen and nitrites.
In our study area, using the QGIS interpolated data for CCME WQI, which integrated the nutrient concentrations, this global indicator was ranked in 10 graduated quantile classes, with different trends between 2013 and 2019 (Figure 4, Figure 5, Figure 6, Figure 7, Figure 8, Figure 9 and Figure 10). It can be noticed that from the start (Ceatal Chilia) to the end of the branch (Bastroe Downstream), in 2013, 2017, and 2019 the CCME WQI has the same shape, with maximum values at the extreme points, corresponding to excellent water quality, and graduated lower values along the branch. In 2014, CCME WQI values did not reach the highest values. So, the quality of water collected from the Chilia mouth has the lowest values, corresponding to the fair water quality class and, for the rest of this branch, the water quality increases from Ceatal Chilia to Periprava. In 2018, the water quality of the Chilia branch decreases from west to east, from Ceatal Chilia to Bastroe Downstream. In 2016 and 2015, the middle values for CCME WQI were obtained, with no significantly different values between the sampling points.
Taking into account the classification of water quality based on CCME WQI and regular WQI calculation [3] (Table 4 and Table 7), Table 8 presents a comparison between the results obtained by applying both indices.
At the integrative level, on the whole Chilia branch, throughout the analyzed period, respectively 2013–2019, taking into account the nutrient concentrations both in dissolved and total form, we found a similarity of the quality classes established according to two complex indicators, respectively WQI and CCME WQI (Table 7). Thus, 38.72% of surface waters (according to WQI) and 41.94% (according to CCME QWI) are in very good ecological condition. In good ecological condition are 54.84% of the surface waters taken from the Chilia arm (WQI) and 45.16% (CCME WQI). Thus, depending on the values of the two indicators, namely WQI and CCME WQI, over 85% of surface waters have a good quality status, which ensures a living environment propitious to aquatic flora and fauna. We can state that the small differences that appear at moderate ecological status—12.90% (CCME WQI), bad 3.22% (WQI), and very bad 3.22% (WQI) ecological status are insignificant and can be attributed to the different way of integrating concentrations in complex indicators and random exceedances of quality standards.
From the point of view of integrated quality indicators, it is difficult to select a specific indicator to make an accurate assessment of surface water quality [5,17,37]. In addition, despite the efforts of researchers worldwide, there is still no universal indicator of water quality.

4. Conclusions

Regular water quality evaluation may be complicated for large rivers due to the high number of monitored parameters in a huge volume of samples, which makes it difficult to express water quality status in a specific area. The results of this study represent a first step in assessment of water quality of Danube River branches at individual and integrated levels, while also giving a general overview of different pollution classes at the longitudinal level. A total of 106 samples of surface water were collected in the period 2013–2019 from the Danube River Basin, Chilia branch, from five sites (Periprava, Ceatal Chilia, Izmail downstream, Bastroe upstream, and Bastroe downstream). The spatial distribution of the Chilia branch water quality at integrative level was carried out using GIS techniques. From the nutrients’ point of view, Danube water in the Chilia branch is not polluted with ammonium nitrogen, nitrite nitrogen, nitrate nitrogen, ortho- and total phosphorus. In 2015, the Chilia branch was polluted with organic nitrogen, a component of total nitrogen.
CCME WQI method integrates the nutrient concentrations and the standard limits for second quality class, and it is a very useful tool for surface water managers, local and national authorities and inhabitants to evaluate the surface water quality in a selected sampling point and time. From a nutrient point of view, Ceatal Chilia had an excellent quality in 2013, 2017, 2019, good quality in 2016, and fair quality in 2014 and 2015. Izmail downstream had an excellent water quality only in 2018 and a good quality in the rest of the monitoring years. Periprava had excellent quality in 2017 and 2019, good quality in 2015, 2016 and 2019, and fair quality in 2013 and 2014.
Due to geographical position, Bastroe upstream and downstream showed the same trend, with excellent quality in 2013, 2017, 2019 and good quality in 2015, 2016, 2018. The accomplishment of this study started from the fact that in the literature there are very few studies related to the water quality of the Chilia branch from the chemical point of view. Our results showed different degrees of homogeneity for nutrient concentrations and also different concentration distributions. The next step is to include the other physico-chemical parameters in the CCME WQI, and to perform a comparison with other integrated indicators, targeted in international projects carried out in the Lower Danube and Black Sea Basins, in order to provide an overview on the Danube water quality of the Chilia branch at the longitudinal level.

Author Contributions

Conceptualization, L.T. and A.E.; data curation, L.T. and A.E.; formal analysis, L.T. and D.S.-O.; funding acquisition, A.E.; investigation, L.T., A.E., A.B., C.D., D.S.-O., C.T., O.I., E.B., M.-I.T., M.T., I.C., L.P.G. and C.I.; methodology, L.T., A.E., A.B., C.D., D.S.-O., C.T., O.I., E.B., M.-I.T., M.T., I.C., L.P.G. and C.I.; project administration, L.T. and A.E.; resources, L.T. and M.T.; software, L.T., A.E. and C.T.; supervision, L.T. and M.T.; validation, L.T., A.E., A.B., C.D., D.S.-O., O.I., E.B., M.-I.T., I.C., L.P.G. and C.I.; visualization, C.T.; writing–original draft, L.T. and A.E.; writing–review and editing, L.T. and A.E. All authors have read and agreed to the published version of the manuscript.

Funding

The APC is funded by “Dunarea de Jos” University of Galati, Romania.

Institutional Review Board Statement

Not applicable.

Informed Consent Statement

Not applicable.

Data Availability Statement

The data that support the findings of this study are available from the first (LT) and corresponding (AE) authors, upon reasonable request.

Acknowledgments

This research was funded by Romanian National Authority for Scientific Research and Innovation within the framework of Danube Delta Nucleus Programme and Joint Operational Programme Black Sea Basin 2014–2020 through the project with code BSB27 (MONITOX). The authors acknowledge the infrastructure and support of Danube Delta National Institute for Research and Development at Tulcea, Romania and INPOLDE research center of Dunarea de Jos University of Galati, Romania.

Conflicts of Interest

The authors declare no conflict of interest.

References

  1. Sener, S.; Sener, E.; Davraz, A. Evaluation of water quality using water quality index (WQI) method and GIS in Aksu river (SW-Turkey). Sci. Total Environ. 2017, 584–585, 131–144. [Google Scholar] [CrossRef]
  2. Oz, N.; Topal, B.; Uzun, H. Prediction of water quality in Riva river watershed. Ecol. Chem. Eng. S 2019, 26, 727–742. [Google Scholar] [CrossRef] [Green Version]
  3. Teodorof, L.; Burada, A.; Despina, C.; Seceleanu-Odor, D.; Tudor, A.I.M.; Ibram, O.; Năvodaru, I.; Tudor, M. Integrated indices for surface water and sediment quality, according to Water Framework Directive. J. Environ. Prot. Ecol. 2016, 17, 42–52. [Google Scholar]
  4. Iticescu, C.; Georgescu, L.P.; Murariu, G.; Topa, C.; Timofti, M.; Pintilie, V.; Arseni, M. Lower Danube Water Quality Quantified through WQI and Multivariate Analysis. Water 2019, 11, 1305. [Google Scholar] [CrossRef] [Green Version]
  5. Kachroud, M.; Trolard, F.; Kefi, M.; Jebari, S.; Bourrié, G. Water Quality Indices: Challenges and application limits in the literature. Water 2019, 11, 361. [Google Scholar] [CrossRef] [Green Version]
  6. Chapter 10 Nutrients—Nitrogen and phosphorus from Volunteer Estuary Monitoring Manual, a Methods Manual, Second Edition, EPA-842-B-06-003. 2006. Available online: http://wwwepagov/owow/estuaries/monitor (accessed on 10 April 2021).
  7. Karabulut, A.; Bouraoui, F.; Grizetti, B.; Bidoglio, G.; Pistochi, A. Managing Nitrogen and Phosphorus Loads to Water Bodies: Characterisation and Solutions. In Towards Macro-Regional Integrated Nutrient Management. Joint Research Centre, JRC-Ispra; Report EUR 26822 EN; Publications Office of the European Union: Luxemburg, 2014; pp. 1–73. [Google Scholar] [CrossRef]
  8. Messyasz, B.; Treska, E. Benthic diatoms as valuable indicators of anthropogenic eutrophication in biomonitoring of Ribbon lake. Ecol. Chem. Eng. 2019, 26, 709–726. [Google Scholar] [CrossRef] [Green Version]
  9. Kanownik, W.; Policht-Latawiec, A.; Fudała, W. Nutrient pollutants in surface water—Assessing trends in drinking water resource quality for a regional city in central europe. Sustainability 2019, 11, 1988. [Google Scholar] [CrossRef] [Green Version]
  10. Spiridon, C.; Burada, A.; Teodorof, L.; Despina, C.; Seceleanu-Odor, D.; Tudor, M.; Ene, A. Chlorophyll a and total nutrients distribution from surface waters in Romanian MONITOX network in 2019 and 2020. Ann. Univ. Dunarea Jos Galati Fasc. II Math. Phys. Mec. Theor. 2020, 43, 184–189. [Google Scholar] [CrossRef]
  11. Pantelica, A.; Ene, A.; Georgescu, I.I. Instrumental neutron activation analysis of some fish species from Danube River in Romania. Microchem. J. 2012, 103, 142–147. [Google Scholar] [CrossRef]
  12. Galatchi, L.D.; Tudor, M. Europe as a source of pollution—The main factor for the eutrophication of the Danube Delta and Black Sea. In NATO Security through Science Series C: Environmental Security; Springer: Berlin/Heidelberg, Germany, 2007; pp. 57–63. [Google Scholar]
  13. Ene, A.; Denga, Y.; Bogdevich, O.; Zubcov, E. (Eds.) Atlas of Maps; Tehno Press: Iasi, Romania, 2015; ISBN 978-606-687-235-5. Available online: https://www.researchgate.net/publication/305317824_Atlas_of_Maps (accessed on 8 April 2021).
  14. Paun, I.; Chiriac, F.L.; Marin, N.M.; Cruceru, L.V.; Pascu, L.F.; Lehr, C.B.; Ene, C. Water Quality Index, a useful tool for evaluation of Danube River raw water. Rev. Chim. 2017, 68, 1732–1739. [Google Scholar] [CrossRef]
  15. Nutrients. ICPDR—International Commission for the Protection of the Danube River. Available online: http://wwwicpdrorg/main/issues/nutrients (accessed on 20 March 2021).
  16. Spanos, T.; Ene, A.; Xatzixristou, C.; Papaioannou, A. Assessment of groundwater quality and hydrogeological profile of Kavala area, northern Greece. Rom. J. Phys. 2015, 60, 1139–1150. [Google Scholar]
  17. Poonam, T.; Tanushree, B.; Sukalyan, C. Water quality indices—Important tools for water quality assessment: A review. Int. J. Adv. Chem. 2013, 1, 15–28. [Google Scholar]
  18. Directive 2000/60/EC of The European Parliament and of The Council of October 23rd, 2000 Establishing a Framework for Community Action in the Field of Water Policy (WFD). Off. J. L 2000, 327, 1–73. Available online: http://ec.europa.eu/environment/water/water-framework/index_en.html (accessed on 6 March 2021).
  19. Spanos, T.; Ene, A.; Simeonova, P. Chemometric expertise of the quality of groundwater sources for domestic use. J. Environ. Sci. Health A Tox. Hazard. Subst. Environ. Eng. 2015, 50, 1099–1107. [Google Scholar] [CrossRef]
  20. Sutadian, A.D.; Muttil, N.; Yilmaz, A.; Perere, B.J.C. Development of river water quality indices—A review. Environ. Monit. Assess. 2016, 188, 2–29. [Google Scholar] [CrossRef] [Green Version]
  21. Avigliano, E.; Schenone, N. Water quality in Atlantic rainforest mountain rivers (South America): Quality indices assessment, nutrients distribution, and consumption effect. Environ. Sci. Pollut. Res. 2016, 23, 15063–15075. [Google Scholar] [CrossRef]
  22. Canadian Council of Ministers of the Environment (CCME). Canadian Water Quality Guidelines for the Protection of Aquatic Life: CCME Water Quality Index 1.0; Technical Report; Canadian Council of Ministers of the Environment: Winnipeg, MB, Canada, 2001; pp. 1–5.
  23. Bilgin, A. Evaluation of surface water quality by using Canadian Council of Ministers of the Environment Water Quality Index (CCME WQI) method and discriminant analysis method: A case study Coruh River Basin. Environ. Monit. Assess. 2018, 190, 554. [Google Scholar] [CrossRef]
  24. Ismail, A.H.; Robescu, D.; Hameed, M.A. Application of CCME WQI in the assessment of the water quality of Danube River, Romania. J. Eng. Technol. 2018, 36, 142–146. [Google Scholar] [CrossRef]
  25. Abbasi, T.; Abbasi, S.A. Water Quality Indices; Elsevier: Amsterdam, The Netherlands, 2012; ISBN 978-0-444-54304-2. [Google Scholar]
  26. Lumb, A.; Sharma, T.C.; Bibeault, J.F.; Klawunn, P. A comparative study of USA and Canadian Water Quality Index models. Water Qual. Expo. Health 2011, 3, 203–216. [Google Scholar] [CrossRef]
  27. Ranjbar, J.A.; Masoodi, M.; Sharifiniya, M.; Riyahi, B.A. Integrated river quality management by CCME WQI as an effective tool to characterize surface water source pollution (Case study: Karun River, Iran). Pollution 2016, 2, 313–330. [Google Scholar] [CrossRef]
  28. Li, H.; Smith, C.D.; Wang, L.; Li, Z.; Xiong, C.; Zhang, R. Combining spatial analysis and a drinking water Quality Index to evaluate monitoring data. Int. J. Environ. Res. Public. Health. 2019, 16, 357. [Google Scholar] [CrossRef] [PubMed] [Green Version]
  29. SR ISO 5667-6: 2014. Water Quality Sampling. Part 6 Guidance on Sampling of Rivers and Streams. ICS: 13.060.10 Water of Natural Resources. 13.060.45 Examination of Water in General. 2014. Available online: https://www.iso.org/standard/55451.html (accessed on 23 February 2021).
  30. Hansen, H.P.; Koroleff, F. Determination of nutrients. In Methods of Seawater Analysis, 3rd ed.; Grasshoff, K., Kremling, K., Ehrhardt, M., Eds.; Wiley-VCH: Weinheim, Germany, 1999; pp. 159–228. [Google Scholar] [CrossRef]
  31. Kuss, J.; Nausch, G.; Engelke, C.; Weber, M.; Lutterbeck, H.; Naumann, M.; Waniek, J.J.; Schulz-Bull, D.E. Changes of nutrient concentrations in the western Baltic Sea in the transition between inner coastal waters and the central basins: Time Series From 1995 to 2016 With Source Analysis. Front Earth Sci. 2020, 8, 106. [Google Scholar] [CrossRef]
  32. Order MEWM no 161/2006 of Romanian Ministry of Environment and Water Management Regarding Norms for Surface Water Classification in Order to Establish Ecological State of Water Bodies; Romanian Official Monitor: Bucharest, Romania, 2006; Available online: http://www.legex.ro/Ordin-161-2006-71706.aspx (accessed on 10 February 2021).
  33. Hair, J.F.; Hult, G.T.M.; Ringle, C.M.; Sarstedt, M. A Primer on Partial Least Squares Structural Equation Modeling (PLS-SEM), 2nd ed.; Sage: Thousand Oaks, CA, USA, 2017; ISBN 987148337745. [Google Scholar]
  34. Fahmy, M.A.; Abbas, M.M.; Beltagy, A.I. Distribution of nutrient salts in the coastal Egyptian Mediterranean waters after 30 years of the High Dam erection. Bull. Natl. Inst. Oceanogr. Fish 1996, 22, 267–291. [Google Scholar]
  35. Riley, J.P.; Chester, R. Introduction to Marine Chemistry; Academic Press: London, UK; New York, NY, USA, 1971; ISBN 10: 0125887507/13: 9780125887502. [Google Scholar]
  36. Qadir, A.; Malik, R.N.; Husain, S.Z. Spatio-temporal variations in water quality of Nullah Aik-tributary of the river Chenab, Pakistan. Environ. Monit. Assess. 2008, 140, 43–59. [Google Scholar] [CrossRef]
  37. Frîncu, R.-M. Long-term trends in water quality indices in the Lower Danube and tributaries in Romania (1996–2017). Int. J. Environ. Res. Public Health 2021, 18, 1665. [Google Scholar] [CrossRef]
Figure 1. Geographical location of: (a) Danube River basin, Danube Delta, and the three branches (Chilia, Sulina, and Sfantu Gheorghe), and (b) sampling points from Danube River Chilia branch.
Applsci 11 09172 g001
Figure 2. The area included in the grid processing.
Applsci 11 09172 g002
Figure 3. Grid processing steps: up—grid creation for the whole area, middle—altering the grid to the river flow, down—graduated quantile classes of the interpolated data.
Applsci 11 09172 g003
Figure 4. CCME WQI trends in 2013 on the Chilia branch.
Applsci 11 09172 g004
Figure 5. CCME WQI trends in 2014 on the Chilia branch.
Applsci 11 09172 g005
Figure 6. CCME WQI trends in 2015 on the Chilia branch.
Applsci 11 09172 g006
Figure 7. CCME WQI trends in 2016 on the Chilia branch.
Applsci 11 09172 g007
Figure 8. CCME WQI trends in 2017 on the Chilia branch.
Applsci 11 09172 g008
Figure 9. CCME WQI trends in 2018 on the Chilia branch.
Applsci 11 09172 g009
Figure 10. CCME WQI trends in 2019 on the Chilia branch.
Applsci 11 09172 g010
Table 1. Geographical coordinates of sampling points from Chilia branch.
Sampling PointLabelGeographical Coordinates
NE
Ceatal ChiliaCC45°13.716′28°44.157′
Izmail DownstreamID45°16.793′28°56.137′
PeripravaP45°24.051′29°33.867′
Bastroe UpstreamBU45°20.659′29°38.600′
Bastroe DownstreamBD45°19.975′29°39.337′
Table 2. Detection and quantification limits for nutrients.
NutrientParameters
Detection Limit [mg/L]Quantification Limit [mg/L]Standard Limit [mg/L]Analysis Standard
Ammonium nitrogen (N-NH4+)0.0280.0900.80SR ISO 7150–1: 2001
Nitrite nitrogen (N-NO2)0.00070.00240.03SR EN 26777: 2002
Nitrate nitrogen (N-NO3)0.0060.0213.00SR ISO 7890–3: 2000
Total nitrogen (TN)0.0300.01107.00SR EN ISO 11905-1:2003
Orthophosphate (P-PO4−3)0.0020.0100.20SR EN ISO 6878: 2005
Total phosphorus (TP)0.0030.0100.40SR EN ISO 6878: 2005
Table 3. Detection Parameters for CCME WQI evaluation [22,23,26].
Factor/IndexExplanation
Brief DescriptionFormula
F1
(Scope)
Assesses the extent of water quality guideline non-compliance over the time of interest; it is expressed by the percentage of variables (chemical indicators) that do not meet the water quality standards („failed variables”)F1 = (Number of failed variables/Total number of variables) * 100
F2
(Frequency)
Assesses the frequency by which the objectives are not met; it is expressed by the percentage of individual tests that do not meet the quality standards („failed tests”)F2 = (Number of failed tests/Total number of tests) * 100
F3
(Amplitude)
Assesses the amount by which the objectives are not met; it is calculated by an asymptotic function that scales the normalized sum of excursions from objectives (nse) to yield a range between 0 and 100F3 = nse/(0.01 * nse + 0.01)
excursionRepresents the relative deviation of a failed test from the guidelineexcursioni = (Failed test value i/ Objective i) − 1
nseRepresents the collective amount by which individual tests do not reach the standards (are out of compliance)nse = (∑ excursioni)/number of tests
CCME WQICombines three measures of variance (scope, frequency and amplitude) of excursions from objectives to produce a single unitless number representing the overall water quality at a site relative to the benchmark chosenCCME WQI = 100 − [√(F12 + F22 + F32)/1.732]
(1)
Table 4. Surface water quality classes according to CCME WQI values [5,20,22].
Quality ClassCCME WQI
Values
Excellent95 ≤ CCME WQI ≤ 100
Good80 ≤ CCME WQI < 95
Fair65 ≤ CCME WQI < 80
Marginal45 ≤ CCME WQI < 65
Poor0 ≤ CCME WQI < 45
Table 5. Statistical parameters for the Chilia branch ecological status evaluation (2013–2019).
ParameterSampling Point CodeValues
No. of SamplesMin.Max.MedianMeanStd.
dev.
SkewnessKurtosis
N-NH4+CC260.0000.2180.1040.1110.0600.183−0.944
ID210.0400.3330.1330.1400.0730.6540.134
P250.0240.2940.1560.1570.0680.127−0.428
BU170.0380.2270.1410.1370.058−0.111−0.974
BD170.0450.2790.1800.1690.060−0.603−0.132
N-NO2CC260.0080.0540.0180.0200.0101.5942.709
ID210.0080.0370.0180.0200.0080.945−0.059
P250.0090.1220.0200.0260.0233.0779.609
BU170.0050.0410.0160.0180.0081.2501.991
BD170.0090.0390.0170.0180.0071.5011.929
N-NO3CC260.4069.7441.0721.4611.7254.23917.485
ID210.0082.2601.1011.1060.5850.135−0.268
P250.3775.1331.0711.3020.9322.7648.657
BU170.0902.2761.1131.1370.5490.347−0.068
BD170.4032.4361.0101.1850.5800.943−0.213
TNCC261.39518.0543.8924.9623.6802.3655.227
ID210.97910.3994.1254.8662.3900.675−0.279
P251.73231.8576.0957.3026.1102.5037.642
BU172.13813.9565.1116.2543.7670.863−0.623
BD171.93513.7356.6886.7313.3050.579−0.281
P-PO4−3CC260.0030.1180.0500.0500.0210.4983.032
ID210.0070.1080.0500.0510.0210.5161.050
P250.0010.0800.0510.0490.016−0.8771.591
BU170.0350.0960.0480.0530.0151.2361.508
BD170.0310.0670.0450.0480.0100.285−0.825
TPCC260.0670.2430.1180.1230.0421.5242.449
ID210.0450.1920.1080.1140.0380.424−0.530
P250.0430.2050.1060.1130.0380.5880.037
BU170.0520.1970.1100.1110.0460.480−1.005
BD170.0500.2170.1220.1220.0510.315−0.878
Table 6. CCME WQI evaluation values of the Chilia branch (2013–2019).
Sampling PointVariablesValues
2013201420152016201720182019
Ceatal ChiliaF10.0033.3333.3316.670.000.000.00
F20.009.5211.114.170.000.000.00
nse0.000.050.210.010.000.000.00
F30.005.1417.531.200.000.000.00
CCME WQI100.0079.7777.3390.06100.00100.00100.00
Izmail DownstreamF116.6716.6716.6716.6716.670.0016.67
F25.5612.508.338.335.560.005.56
nse0.010.020.030.040.010.000.02
F30.991.912.643.891.280.001.64
CCME WQI89.8487.9289.1389.0189.83100.0089.81
PeripravaF133.3333.3316.6716.670.0033.330.00
F211.1113.8911.1112.500.008.330.00
nse0.220.100.040.040.000.030.00
F317.849.214.223.410.003.140.00
CCME WQI77.2578.4888.1887.81100.0080.08100.00
Bastroe UpstreamF10.00-16.6716.670.0033.330.00
F20.00-5.568.330.008.330.00
nse0.00-0.060.060.000.050.00
F30.00-5.235.350.004.520.00
CCME WQI100.00-89.4288.81100.0079.99100.00
Bastroe DownstreamF10.00-16.6716.670.0033.330.00
F20.00-5.568.330.008.330.00
nse0.00-0.050.050.000.030.00
F30.00-5.074.740.003.100.00
CCME WQI100.00-89.4488.90100.0080.08100.00
Table 7. Surface water quality classes according to WQI values [3,5,18,37].
Quality ClassWQI
Values
Very goodWQI < 25
Good25 ≤ WQI < 50
Moderate50 ≤ WQI < 75
Bad75 ≤ WQI < 100
Very bad100 ≤ WQI
Table 8. Comparison of Danube River Chilia branch water quality classification * according to CCME WQI and WQI.
Sampling PointIndex2013201420152016201720182019
Ceatal ChiliaWQI42.84974.70446.55056.79551.78863.71854.225
Izmail Downstream45.34779.95040.58342.96961.30461.78670.651
Periprava46.879147.39440.75851.01961.30459.63360.133
Bastroe Upstream44.948 44.93557.13445.76058.71560.704
Bastroe Downstream42.616 43.53656.24245.76064.12860.113
Ceatal ChiliaCCME WQI100.0079.7777.3390.06100.00100.00100.00
Izmail Downstream89.8487.9289.1389.0189.83100.0089.81
Periprava77.2578.4888.1887.81100.0080.08100.00
Bastroe Upstream100.00 89.4288.81100.0079.99100.00
Bastroe Downstream100.00 89.4488.90100.0080.08100.00
* Classes: I (blue)–excellent/CCME WQI, very good/WQI; II (green)-good/CCME WQI and WQI; III (yellow)-Fair/CCME WQI, moderate/WQI; IV (orange)-marginal/CCME WQI, bad/WQI; V (red)-poor/CCME WQI, very bad/WQI.
Publisher’s Note: MDPI stays neutral with regard to jurisdictional claims in published maps and institutional affiliations.

