Article

Driver Fatigue Detection Based on Residual Channel Attention Network and Head Pose Estimation

1
School of Mechanical and Automotive Engineering, Shanghai University of Engineering Science, Shanghai 201620, China
2
School of Vehicle and Mobility, Tsinghua University, Beijing 100089, China
3
School of Mechanical and Transportation Engineering, Guangxi University of Science and Technology, Liuzhou 545616, China
*
Author to whom correspondence should be addressed.
Appl. Sci. 2021, 11(19), 9195; https://doi.org/10.3390/app11199195
Submission received: 6 September 2021 / Revised: 27 September 2021 / Accepted: 30 September 2021 / Published: 2 October 2021
(This article belongs to the Section Transportation and Future Mobility)

Abstract

:

Featured Application

This study proposes a new driver fatigue detection system that serves to evaluate the driver’s driving risk from fatigue and improve driving safety.

Abstract

Driver fatigue is the culprit of most traffic accidents. Visual technology can intuitively judge whether the driver is in the state of fatigue. A driver fatigue detection system based on the residual channel attention network (RCAN) and head pose estimation is proposed. In the proposed system, Retinaface is employed for face location and outputs five face landmarks. Then the RCAN is proposed to classify the state of eyes and the mouth. The RCAN includes a channel attention module, which can adaptively extract key feature vectors from the feature map, which significantly improves the classification accuracy of the RCAN. In the self-built dataset, the classification accuracy of the eye state of the RCAN reaches 98.962% and that of the mouth state reaches 98.561%, exceeding other classical convolutional neural networks. The percentage of eyelid closure over the pupil over time (PERCLOS) and the mouth opening degree (POM) are used for fatigue detection based on the state of eyes and the mouth. In addition, this article proposes to use a Perspective-n-Point (PnP) method to estimate the head pose as an essential supplement for driving fatigue detection and proposes over-angle to evaluate whether the head pose is excessively deflected. On the whole, the proposed driver fatigue system integrates 3D head pose estimation and fatigue detection based on deep learning. This system is evaluated by the four datasets and shows success of the proposed method with their high performance.

1. Introduction

According to the statistics of the AAA Foundation for Traffic Safety, road accidents caused by fatigue driving comprise one-eighth of total accidents. The initial state of fatigue driving is inattention and transitory hypovigilance. With the deepening of fatigue, the driver gradually appears drowsy and eventually loses control of the vehicle. Therefore, fatigue detection of drivers would be of special interest to reduce road accidents and develop driving assistant systems.
According to the existing research status, the detection methods of driver fatigue are mainly divided into three categories [1], which are vehicle-based measurements, physiological signals measurements, and visual-based measurements.
Vehicle-based measurements include the assessment of steering wheel movement [2], driving deviation [3], and vehicle dynamic [4] information. The main cause of fatigue driving is human rather than vehicular. When the signals of driving performance, such as vehicle dynamics data and the steering wheel angle, change, the driver may already be in the fatigue driving stage. Using vehicle-based measurements will lead to delayed warning of fatigue driving. In addition, the detection accuracy of this method depends on personal driving habits and the driving road environment Therefore, this method is not suitable for real-time detection of driver fatigue.
Physiological signal measurement methods are usually based on the driver’s physiological signals, such as electroencephalogram (EEG [5]), electrooculogram (EOG [6]), and EMG [7]. The fatigue state can be evaluated by frequency domain analysis and linear classification based on EEG or EEG. However, this method needs a large number of sensors, even wearable sensors, to measure the driver’s physiological signal, which may cause driver discomfort. These constraints make this method difficult to apply to the real driving environment.
Compared with the other two methods, the visual method has irreplaceable advantages that are real time and non-invasive. Driver fatigue usually leads to a series of abnormal actions, such as frequent opening and closing of eyes and yawning. A visual method can help identify these actions consistently. A common visual strategy for fatigue detection mainly includes three steps: face detection, facial state recognition, and fatigue assessment. When the head deflects greatly for a long time, it is usually a precursor to low alertness and fatigue driving and the head deflection reduces the detection accuracy of the eyes and mouth state at the same time. Therefore, the head pose state should also be regarded as one of the indicators of driver fatigue. However, this problem was often ignored in the past. In recent years, this research has begun to garner wide attention [8].
This study proposes a novel driver fatigue detection framework. This framework consists of three parts: facial state recognition, head pose estimation, and fatigue assessment. Compared with the traditional visual method, this framework adds head pose estimation and takes it as an indicator of driver fatigue, which effectively improves the accuracy and robustness of this framework. The contributions of this study are as follows:
  • In this study, a new fatigue detection system is designed that calculates whether the driver is in the fatigue driving state based on the facial state and the head posture. The performance of the system is verified according to the existing and self-built datasets.
  • In this study, the residual channel attention network (RCAN) is proposed to classify the states of eyes and the mouth, and a channel attention module is designed to be embedded in the RCAN. The attention module can adaptively extract the global semantic information of the image and significantly improve the accuracy of face state classification. Then PERCLOS and POM are used to evaluate whether the driver is in a fatigue state.
  • The EPnP method is used to estimate the camera pose and then transform it into Euler angle of the head. This method only needs five landmark points of the face to estimate the Euler angle of the head pose. According to the self-built dataset, the rationality of head pose estimation as a supplement to driver fatigue detection is verified.
  • The rest of this article is as follows. Section 2 introduces the methods related to driver fatigue detection used in recent years. Section 3 introduces the proposed driver fatigue detection system in detail. Section 4 declares the experiments and discusses the results. Section 5 concludes this article.

2. Related Works

Judging driver fatigue based on facial state is basically divided into two steps: face detection and state detection. The first step of face state recognition is to detect the face in the image. Before the advent of deep learning technology, Viola et al. [9] introduced what is termed the “Integral Image” to represent the feature of the image and combined AdaBoost classifier in a “cascade” way to achieve efficient and fast face detection. In recent years, deep learning has met with great success in face detection. Zhang et al. [10] proposed a deep-cascaded multi-task framework (MTCNN) to detect the face. This framework uses cascaded networks to quickly generate and filter candidate facial windows and then generate a final facial bounding box and key face points. Retinaface [11] proposed by Deng et al. added a self-supervised mesh decoder branch for predicting pixel-wise 3D shape face information and has surpassed MTCNN in inference efficiency and accuracy. In this study, Retinaface is used as the face detection method.
Recent theoretical developments have revealed that the methods of facial state recognition are based on biological vision, traditional machine visual methods, and deep learning. The main research contents of facial state recognition include the eye state (open/close) and the mouth state (open/close). In the biological vision method, Benoit et al. [12] used the bio-inspired vision data to detect face motion. This method calculates the local energy in the video based on the Magno feature of the given video to determine whether the eyes are blinking and the mouth is open. In the traditional machine visual methods, Bakheet et al. [13] improved the HOG feature and used the naive Bayes method to classify the eye state and achieved 85.62% detection accuracy in the NTHU-DDD dataset. Akrout et al. [14] used the optical flow method to detect whether the mouth is open and used Haar wavelets and circular Hough transform to detect the eyes’ opening angle. The robustness and accuracy of the deep learning method make it superior to biological vision and traditional machine visual methods. Gu et al. [15] proposed MSP-Net to detect the facial state. MSP-Net can fit multi-resolution input images captured from variant cameras excellently. Ji et al. [16] used MTCNN detect face and design ESR-Net and MSR-Net to detect the facial state. Zhao et al. [17] used the single-shot multi-box detector algorithm to detect the face region and used VGG-16 to classify the facial state. With the development of deep learning, the introduction of the channel attention mechanism in the convolutional neural network has been proved to be effective in improving the accuracy of image classification [18]. Inspired by the above study and the channel attention mechanism, in this study, the RCAN is designed, which includes a series of stacked channel attention blocks to improve the accuracy of facial state recognition.
If the driver’s head posture changes too much, the detection accuracy of eyes and the mouth will be reduced. Therefore, judging whether the driver’s head posture is normal should be included in the scope of fatigue detection. In this study, the estimation of head posture is added to the judgment of the fatigue state. Ruiz et al. [19] trained a multi-loss CNN to predict intrinsic Euler angles. Abate et al. [20] proposed a regression model to estimate the head pose. This method uses a web-shaped model algorithm to encode the head posture and uses a regression algorithm to estimate the Euler angle. In the latest study, Abate et al. [21] combined the fractal image compression characteristics and regression analysis to predict the Euler angle and show its excellent performance in the BIWI dataset and the AFLW2000 dataset. The above methods all use the regression method to solve the head pose problem, which needs more facial landmark input and even extra training. Therefore, this paper uses the Perspective-n-Point (PNP) method to solve the camera pose and then solves the Euler angle of the head according to the camera pose. Given a general 3D head model and more than four 2D points, the Euler angle of the head on the image can be estimated by direct linear transform (DLT) or the Levenberg–Marquardt (LM) algorithm. The goal of DLT is not to minimize the projection error, which leads to inaccurate results. The results of the LM algorithm solved by iteration are not necessarily a positive solution. Lepetit et al. [22] proposed EPnP to estimate the pose of a calibrated camera from 3D-to-2D point correspondences, where time complexity is O(n). Therefore, this paper uses EPnP to estimate the camera pose and then transforms it into the Euler angle of the head.
The existing fatigue assessment methods include PERCLOS [23] and POM. According to research, when PERCLOS exceeds 0.8 or POM is greater than 0.5, the driver will enter the fatigue state. Compared with other fatigue detection methods, head pose estimation is added to the method proposed in this study. Therefore, the head posture change is also included in the fatigue detection parameter.

3. Materials and Methods

This study mainly contains three aspects: facial state recognition, head pose estimation, and fatigue assessment. Firstly, this study uses Retinaface to detect face and mark the facial bounding box, eye regions, and the mouth region. Then the eye regions and the mouth are sent to judge the state by the RCAN. Next, this study uses the facial landmark generated by Retinaface and then uses the EPnP algorithm to estimate the head pose. Finally, fatigue is judged by PERCLOS and POM and the head pose parameter. The overall structure of this paper is shown in Figure 1.

3.1. Facial State Recognition

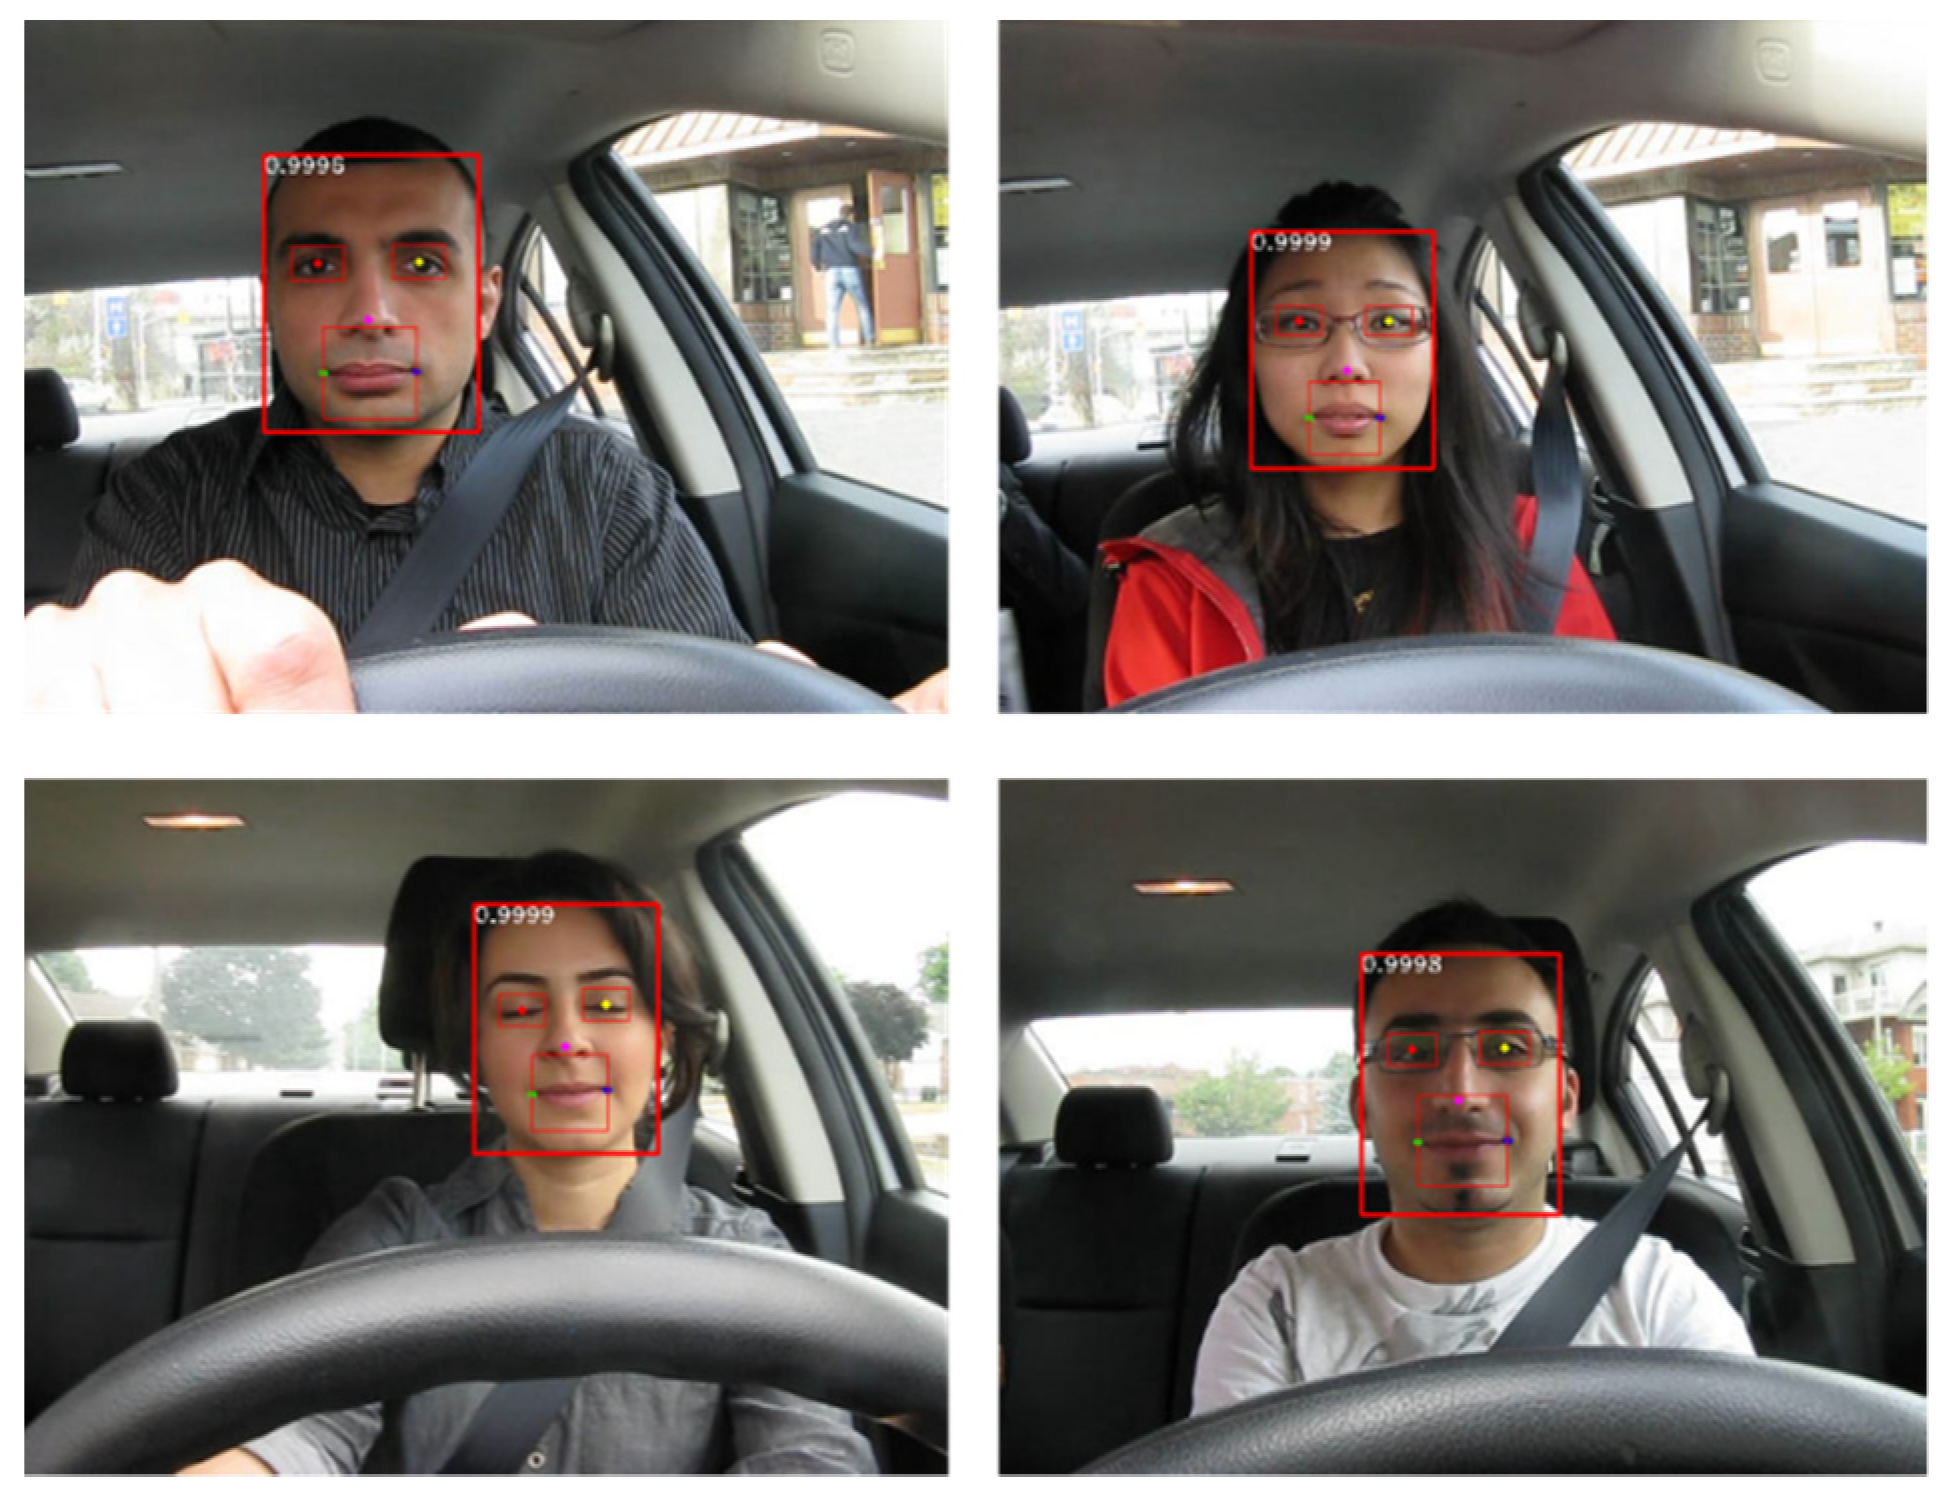
Retinaface has good robustness in complex situations and can accurately output the landmarks of the face: the left and right mouth corners, the center of the nose, and the centers of the left and right eyes. Retinaface performs pixel-wise face localization on faces of various scales by taking advantages of joint extra-supervised and self-supervised multi-task learning. Therefore, Retinaface can also accurately locate the five landmarks of human face when the camera is far away from the driver. Figure 2 depicts the results of face detection using Retinaface. According to the five landmarks given by Retinaface, the eye region and the mouth region can be obtained. Section 3.2 shows how to obtain these regions.
After obtaining the regions of eyes and the mouth, these regions will be uniformly scaled to 56 × 56 and input to the RCAN to judge the state. In this study, the RCAN is proposed to extract the features of the eyes and mouth. The RCAN is composed of three residual channel attention blocks (RCABs) that have the same structure in series, in which channel attention module is integrated. EfficientNet [24] and MobileNet [25] also have a similar structure. In the block of the RCAN, we uniformly use a 3 × 3 convolution kernel to extract features and stack multiple 3 × 3 convolution kernels to expand the receptive field in every RCAB. The RCAN finally achieves the last feature layer, the size of which is 7 × 7. Then this layer will be sent to the fully connected layer for feature aggregation. The complete structure of the RCAN is shown in Table 1.
In an RCAB, the channel attention module is used for feature re-extraction of the current feature layer. As every channel of a feature map is regarded as a feature detector [26], the channel attention module focuses on what is meaningful given a feature map. The significance of the channel attention module is to suppress a useless channel of the feature map and enhance the role of the useful channel of the feature map. Therefore, the channel attention module can suppress the unnecessary background area, which can help the RCAN know “what to look for”.
Figure 3 shows the structure of an RCAB and its channel attention module. This module extracts information by squeezing each channel of a feature map so that the feature layer with stronger semantic information has a higher weight. The ways of squeezing include global average-pooling (GAP) and global max-pooling (GMP). Ref. [26] demonstrated that it is effective to use GAP or GMP for squeezing the feature layer. GAP and GMP have different representation abilities. GMP focuses on the most significant region in the image to compensate the global region that GAP focuses on. Therefore, GAP and GMP have different effects on the compression feature layer. However, the convolutional block attention module (CBAM) proposed in [26] can be regarded as adding GAP to GMP directly for feature extraction, which causes the channel attention module input to be unbalanced. For this reason, the proposed channel attention module multiplies GAP and GMP by a trainable weight in the input stage and then adds them and sends them to a multi-layer perceptron (MLP) with a hidden layer to extract information. A residual connection is included between the input and output of the channel attention module, which makes it easy to converge when training the RCAN.
The specific operations of the proposed channel attention module are as follows: Set Minput as the input of the channel attention module in the current RCAB. C is the total channels of Minput. First, Minput is squeezed into the GAP layer Fgap ∈ R C×1×1 and the GMP layer Fgmp ∈ R C×1×1. Then a trainable parameter α, which is greater than 0 and no more than 1, is set as the weight of GAP. Relatively, the weight of the GMP layer is 1 − α. Section 4.2 describes how to train α. The proposed module can ensure the weight of GAP and GMP is positive. Then αFgmp and (1 − α)Fgap are added and sent to an MLP to extract features. The MLP has only one hidden layer. The proposed module sets the parameter of reduction rate k according to [26]. The hidden layer of the MLP contains C/k neurons. Next, the sigmoid function is used to activate the output of the MLP to get the final channel weight FCA. FCA and Minput are multiplied element-wise to get the final channel attention feature map of the current RCAB. Minput and Moutput contain a residual connection. The calculation process of the channel attention module can be simplified as the following equations:
FCA = sigmoid(MLP(αFgap + (1 − α)Fgmp))
M output = ( F CA M input )   +   M input
where denotes element-wise multiplication. MLP represents the send feature vector (αFgap + (1 − α)Fgmp) to generate the corresponding feature vector.
After extracting the features of three RCABs in the RCAN, the feature vectors of the original image are aggregated into a fully connected layer. The last layer of the fully connected layer is the output of the RCAN. The eye and mouth states are classified by the RCAN. Therefore, the output contains two neurons: open/close eye or open/close mouth. Softmax classifier is used to get the probability of the output. The Softmax classifier equation is as follows:
P i = exp ( γ i ) i = 1 2 exp ( γ i )
where γ i represents the output of the RCAN, while P ( γ i ) represents the probability of the classification result.
To verify the effectiveness of RCAN, this study compares the RCAN with ResNetXt [27], InceptionV4 [28], EfficientNet [24], and added ablation experiments to verify the effectiveness of the channel attention module.

3.2. Head Pose Estimation

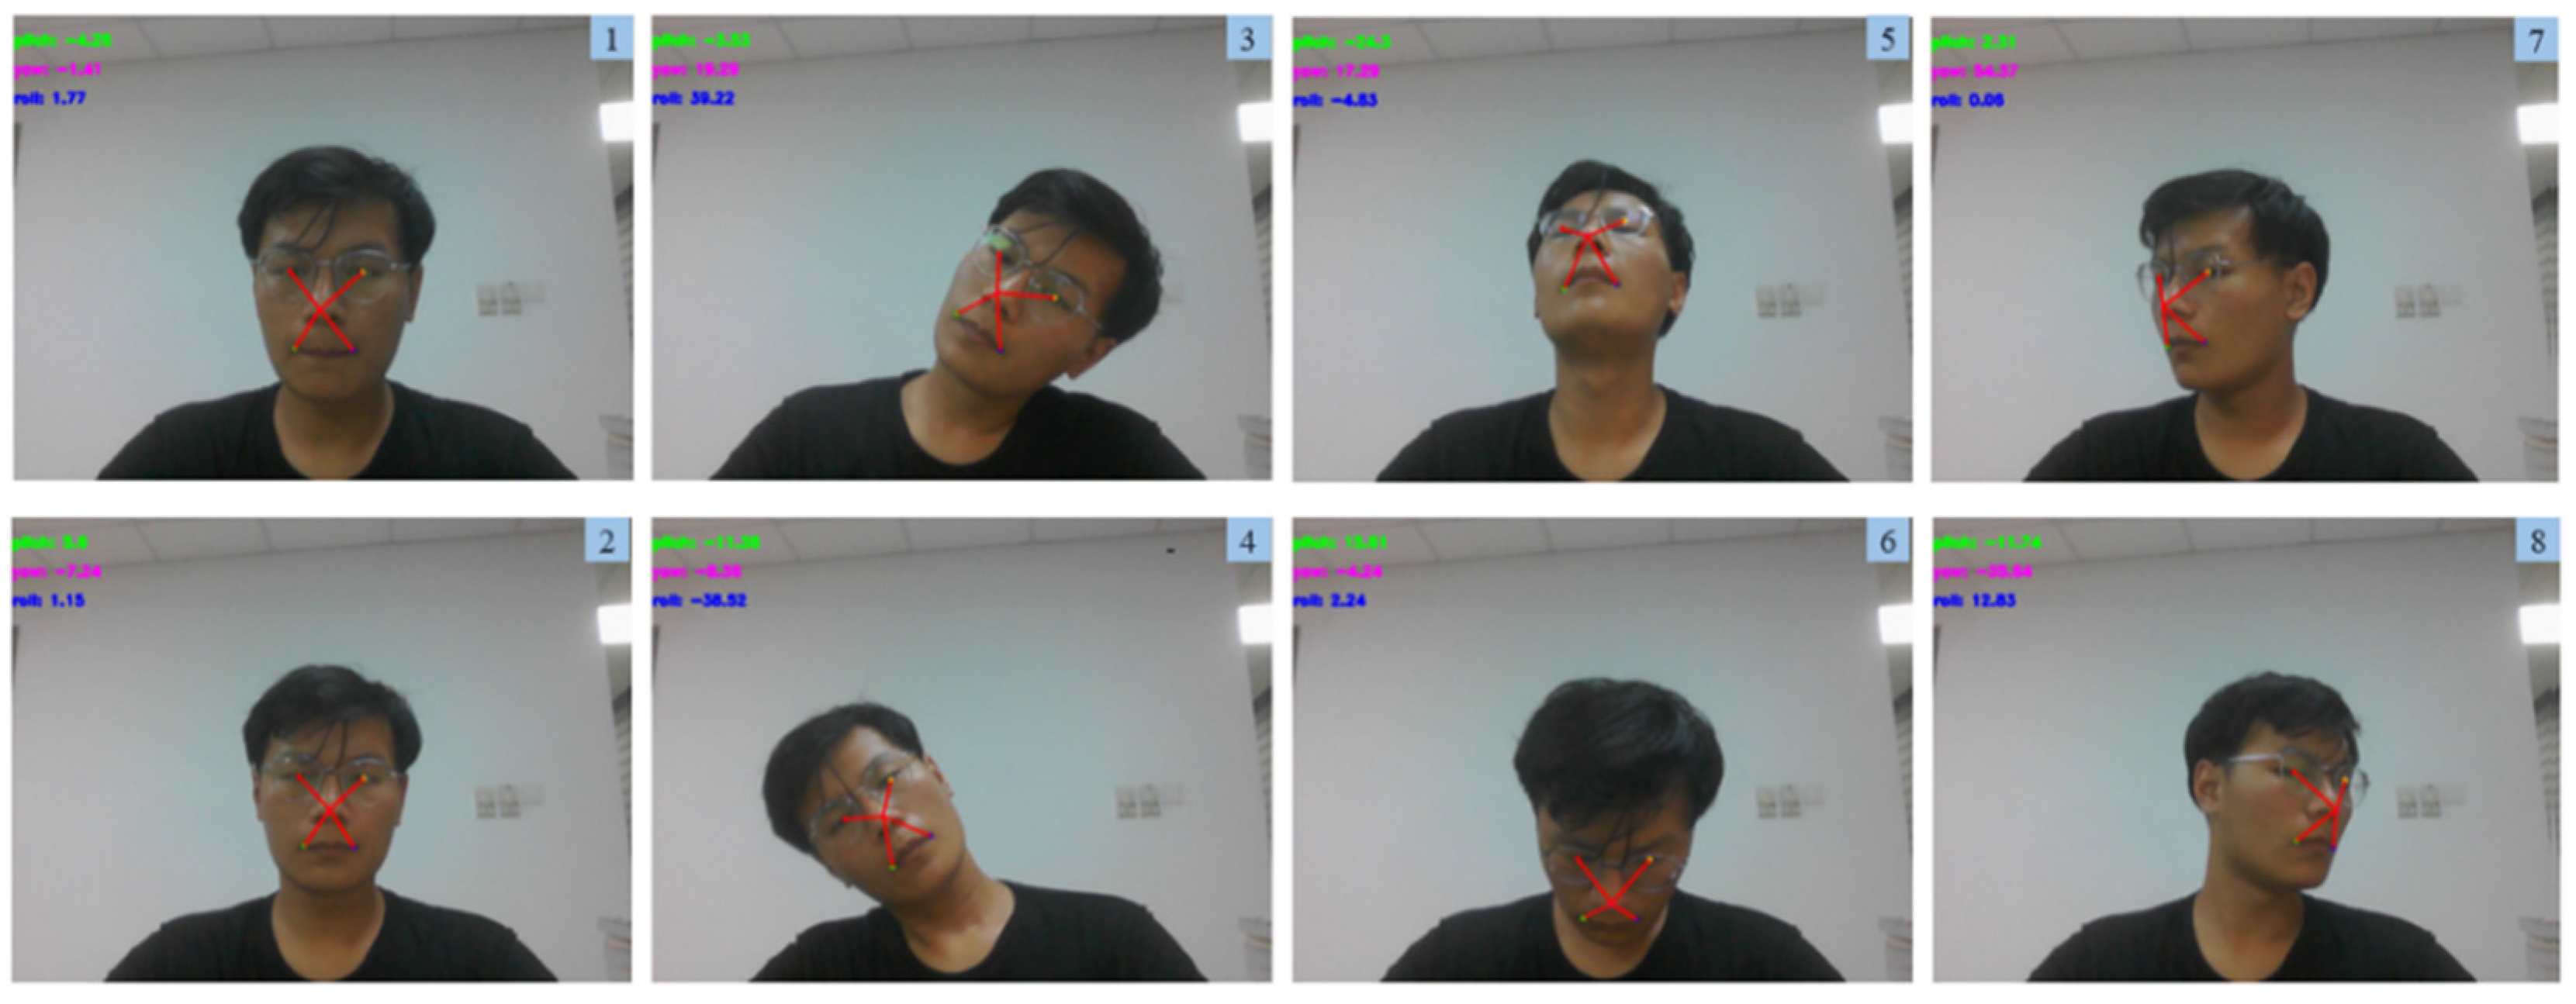
The inattention that occurs when a driver is unable to maintain their head posture is a precursor to fatigue driving. In the case of excessive face rotation, head pose estimation can be used as a supplementary signal for driver fatigue detection. Therefore, this section proposes to use the EPnP method for head pose estimation, which is based on the identification of five 2D landmarks on a face by Retinaface. The 3D point distribution in the world coordinate system can usually be mapped to the point distribution of 2D images. This mapping relationship can be reflected by the rotation matrix of the camera. The rotation matrix based on the camera pose can transform into the Euler angle of the head pose (pitch, yaw, roll), which directly displays the head pose. Retinaface outputs the 2D positions of the left/right eye, the left/right mouth corner, and the nose. These five points are not coplanar in 3D space. Therefore, this study uses EPnP to determine the position, orientation, and rotation matrix of the camera. Figure 4 shows the results of head pose estimation by EPnP in a natural scene.
This study assumes that the camera extrinsic parameters and the 3D coordinates of the human face model in the world coordinate system are known. The internal parameters were calibrated by the checkerboard plane calibration method. The 3D coordinates in the world coordinate system are P i w , i = 1, ···, 5, and the 3D coordinates in the camera coordinate system are P i c , i = 1, ···, 5. EPnP requires each 3D point to be a weighted sum of four control points. The coordinates of the four control points in the world coordinate system are c j w , j = 1, ···, 4. The coordinates of the four control points in the camera coordinate system are c j c , j = 1, ···, 4. Therefore, P i w and P i c can be represented by the following equation:
P i w = j = 1 4 a i j c j w , P i c = j = 1 4 a i j c j c , with j = 1 4 a i j = 1
where a i j are homogenous barycentric coordinates of control. Ref. [21] gives a specific method to determine the control points. In the world coordinate system, select the centroid of the 3D point as the first control point:
c 1 w = 1 n 1 n P i w , with   n = 5
Then the matrix A is obtained and can calculate the eigenvalue λ w , i , i = 1 , 2 , 3 of A T A . The eigenvector of A T A is ( v w , i , i = 1 , 2 , 3 ) . A is shown in Equation (6), and the remain three control points can be determined by Equation (7).
A = [ P 5 w T c 1 w T P 1 w T c 1 w T ]
c j w = c 1 w + λ w , j 1 1 2 v w , j 1 , j = 2 , 3 , 4
Therefore, the weight of the four control points can be calculated by the following equation:
[ a i 1 a i 2 a i 3 a i 4 ] = [ c 1 w 1 c 2 w 1 c 3 w 1 c 4 w 1 ] 1 [ P i w 1 ] 1
This study assumes a camera with internal parameters calibrated. The calculation equation of P i c can be rewritten as:
z j c [ u i v i 1 ] = [ f u 0 u 0 f v v 0 0 1 ] j = 1 4 a i j [ x j c y j c z j c ]
where [ x j c , y j c , z j c ] T represents c i c and u i and v i represent the 2D point of face landmark. f u and f v are the focal lengths of camera. u and v are the optical centers of the camera. Continue to simplify Equation (10) to generate a linear equation by concatenating all the unknowns.
M [ c 1 c T , c 2 c T , c 3 c T , c 4 c T ] T = 0 , where [ c 1 c T , c 2 c T , c 3 c T , c 4 c T ] T is   12   ×   1
The 3D coordinate values of the control points in the camera coordinate system can be obtained by solving Equation (11). The specific solution process is described in [21] and is not the focus of this article. The position and orientation of the camera can be calculated by getting all the control points. According to Equation (4), in this study, the 3D coordinates of five 2D landmarks in the camera coordinate system can be calculated. Next, the rotation matrix of the camera is calculated by the following steps:
1. Calculate the centroid of 3D points ( c 0 w ) in the world coordinate system and the centroid of 3D points ( c 0 c ) in the camera coordinate system.
2. Set matrix A and matrix B and calculate them. The equation is as follows:
A = [ P 5 w T c 0 w T P 1 w T c 0 w T ] , B = [ P 5 c T c 0 c T P 1 c T c 0 c T ]
3. Set matrix H , which is decomposed by SVD. The equation is as follows:
H = B T A = U V T
4. Calculate rotation matrix R . The equation is as follows:
R = U V T = [ f u 0 u 0 f v v 0 0 1 ]
Finally, the head pose can be obtained by transforming the rotation matrix into the Euler angle. The equations are as follows:
θ x = arctan ( r 32 , r 33 ) , θ y = arctan ( r 31 , r 32 2 + r 33 2 ) , θ z = arctan ( r 21 , r 11 )
where θ x , θ y , and θ z represent the pitch, yaw, and roll of the head pose, respectively.

3.3. Driver Fatigue Detection

When a driver enters the fatigue state, several physiological reactions will occur, such as blinking and yawning. Frequent change of head posture or excessive head angle change also reflects the driver’s inattention, which is a precursor to fatigue driving. The RCAN proposed in Section 3.1 can detect the state of eyes and the mouth. The head angle can be estimated by EPnP (Section 3.2). Therefore, this study uses PERCLOS, POM, and the head pose angle to estimate the state of driver fatigue.

3.3.1. PERCLOS

PERCLOS represents the eye closing time percentage in the total time per unit time. The equation is as follows:
P E R C L O S = n e y e N e y e × 100 %
where n e y e represents the total number of frames with eyes closed per unit time and N e y e represents the total frames per unit time. [29] indicated that when PERCLOS is higher than 0.15, the driver enters a fatigue state. Other studies, such as [30] and [23], set the threshold of PERCLOS to 0.25 and 0.4. Therefore, in this study, the threshold of PERCLOS is obtained by experiments.

3.3.2. POM

POM is similar to PERCLOS and represents the mouth opening time percentage in the total time per unit time. The equation is as follows:
P O M = n m o u t h N m o u t h × 100 %
where n m o u t h represents the total number of frames with the mouth open per unit time and N m o u t h represents total frames per unit time. Greater values of POM and PERCLOS suggest higher degrees of driver fatigue.

3.3.3. Head Pose Angle

In this study, the 3D landmark in the world coordinate system is a fixed value. The reason is that we only need to estimate whether the head deviates too much from the normal posture rather than the specific deflection angle. Therefore, it is necessary to determine the angle of excessive head pose deflection (over-angle). The over-angle can be determined by experiment, and experiment shows that pitch, yaw, and roll have different over-angles.

3.3.4. Driver Fatigue Detection

The proposed driver fatigue detection system can run in real time, and the steps are as follows. Firstly, Retinaface captures the face and five landmarks of the face and extracts the eyes and mouth regions. Secondly, the RCAN detects the eye and mouth states of the current frame. At the same time, EPnP is used to output the head pose angle of the current frame and then judge whether it exceeds the over-angle. The queue mechanism is used to save the outputs of the RCAN. After that, the length of the queue remains unchanged. The first value of the queue is deleted and a new value is added every frame. Finally, the PERCLOS and POM of each frame are calculated and compared with the threshold. If PERCLOS and POM values exceed the threshold values, it is determined that the driver is entering a fatigue state. If the Euler angle of the driver’s head exceeds the over-angles, the driver shall be warned.

4. Experiments and Results

4.1. Dataset

This paper uses four datasets for training the RCAN and evaluating its performance. Table 2 shows all the datasets used in this study. The first dataset is CEW [31]. The authors of the CEW dataset collected 4846 eye images, which included 2384 open eye images and 2462 closed eye images. The size of these images is 24 × 24. Therefore, the images need to be scaled to 56 × 56 to adapt to the input size of the RCAN. This dataset has no image data of the mouth (open/close).
The second dataset is DROZY [32]. The DROZY dataset includes 36 video sequences in which volunteers are in the state of drowsiness. We transformed these video sequences into 6210 images as a dataset that includes the eye and mouth states.
The third dataset is YawDD [33]. The authors of the YawDD dataset collected a total of 351 video sequences that simulated various characteristics of fatigue driving. These video sequences contain the real-time states of eyes and the mouth. Therefore, we transformed these video sequences into images frame by frame and collected 5510 eye state images and 4925 mouth state images. Then we annotated the obtained dataset. The eye state dataset has 3009 open eye images and 2501 closed eye images. The mouth state dataset has 2874 open mouth images and 2051 closed mouth images.
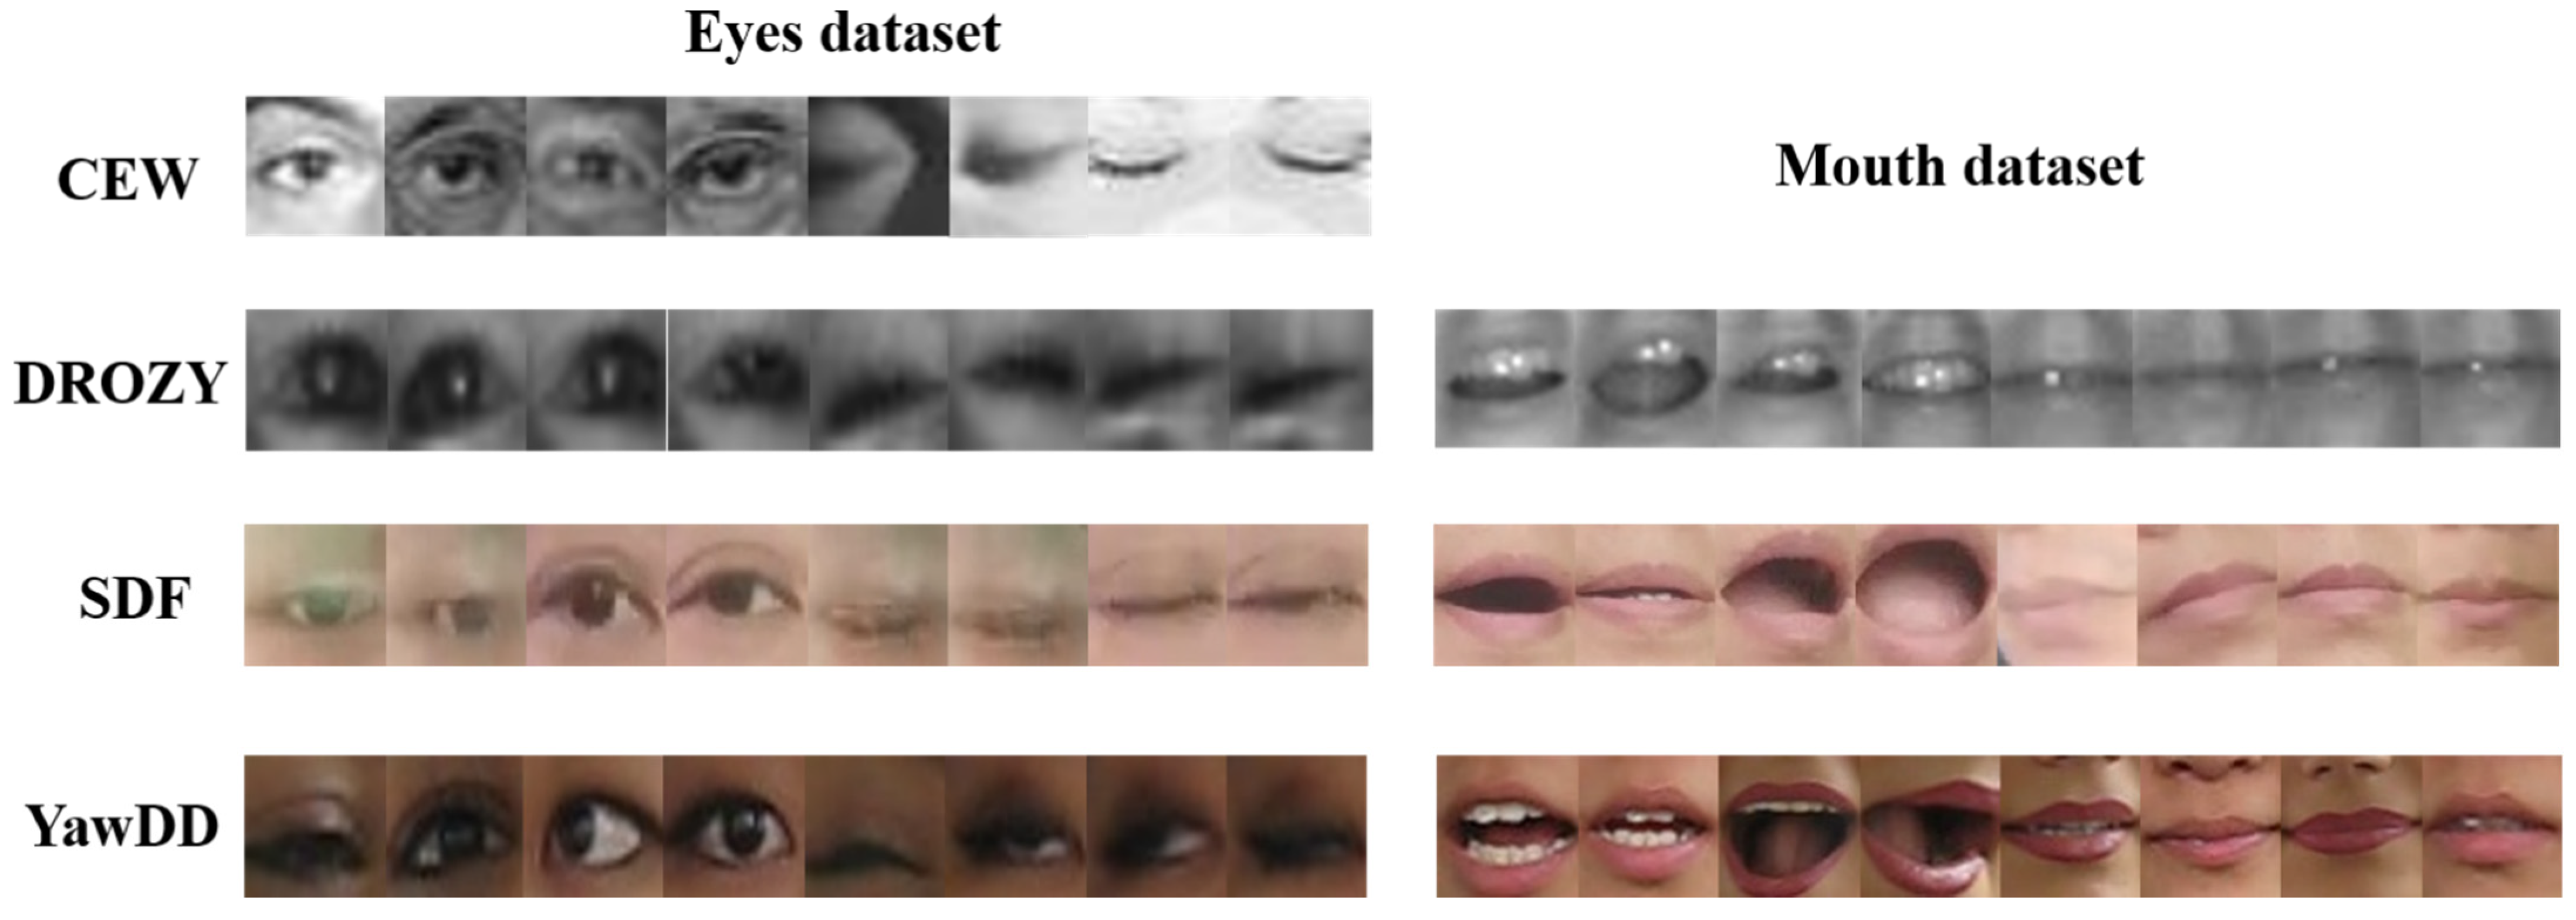
The last dataset is a self-built dataset named simulated driver fatigue (SDF). We gathered 20 volunteers to simulate fatigue driving in a real driving environment. Each person simulated three driving fatigue states: yawning, blinking frequently, and closing the eyes for a long time. The SDF dataset obtained 18,209 annotated eye images and 9772 annotated mouth images by clipping the video frames in the dataset. In addition, SDF contains 10 one-min videos simulating the change of the driver’s head posture. The video annotated the frame when the Euler angle of the driver’s head deflected too much and annotated it as over-angle. This study selects the over-angle according to the SDF dataset. Figure 5 shows examples of all datasets this study used.

4.2. Implementation Details

The experimental platform of our works is an industrial computer equipped with a NIVIDA GeForce RTX2080 graphics board. The CPU of the industrial computer is i7-9800x. The training and detection platform of the RCAN depends on Pytorch, and the implementation of head pose estimation depends on the OpenCV library.
In the training process of the RCAN, this study used the cross-entropy loss function. The batch size is 32, and the epoch of training is 100. During training, the method of optimizer is Adam [34]. Adam parameters are as follows: according to [34], the initial learning rate is 0.001, the first estimated exponential decay rate is 0.9, and the second estimated exponential decay rate is 0.999.
In the channel attention module, we assume that GAP and GMP have the same impact on the classification effect of the RCAN in the initial training state. The initial value of α is 0.5. In more detail, we set α = 1 / ( 1 + e z ) , which leads to α between 0 and 1. The reduction rate k of the channel attention module is uniformly set to 8 in our works. Section 4.3 shows the improvement of the channel attention module on the classification performance.

4.3. Performance of the RCAN

To prove the superiority of the RCAN in driving fatigue detection, we compared the RCA α N with other classical CNN structures, i.e., ResNetXt-50 [27], InceptionV4 [28], and EffcientNet [24], in four datasets. The results are shown in Table 3.
In the CEW and DROZY datasets, the classification results of the RCAN and other CNNs are relatively close. Most human eye images of the CEW dataset are taken in the forward direction, which caused the data dispersion to be low and easy to classify. In SDF and YawDD, the classification accuracy of the RCAN is higher than that of other CNNs. More deeply, we use Precision (p), Recall (R), and F-score to evaluate the classification performance of the RCAN. The equations of the above evaluation indicators are as follows:
P r e c i s i o n = T P T P + F P
R e c a l l = T P T P + F N
F - s c o r e = 2 × P r e c i s i o n × R e c a l l P r e c i s i o n + R e c a l l
where TP is the number of closed eye/mouth images that are predicted to be correct by the model. In contrast, FP is the number of closed eye/mouth images that are predicted to be false. FN is the number of the actual open eye/mouth images mistakenly classified as closed eye/mouth images. F-score is the harmonic average of precision and recall. The higher the F-score, the better the performance of the classification model. The performance of the RCAN in TP, FP, and F-score in each dataset is shown in Table 4.
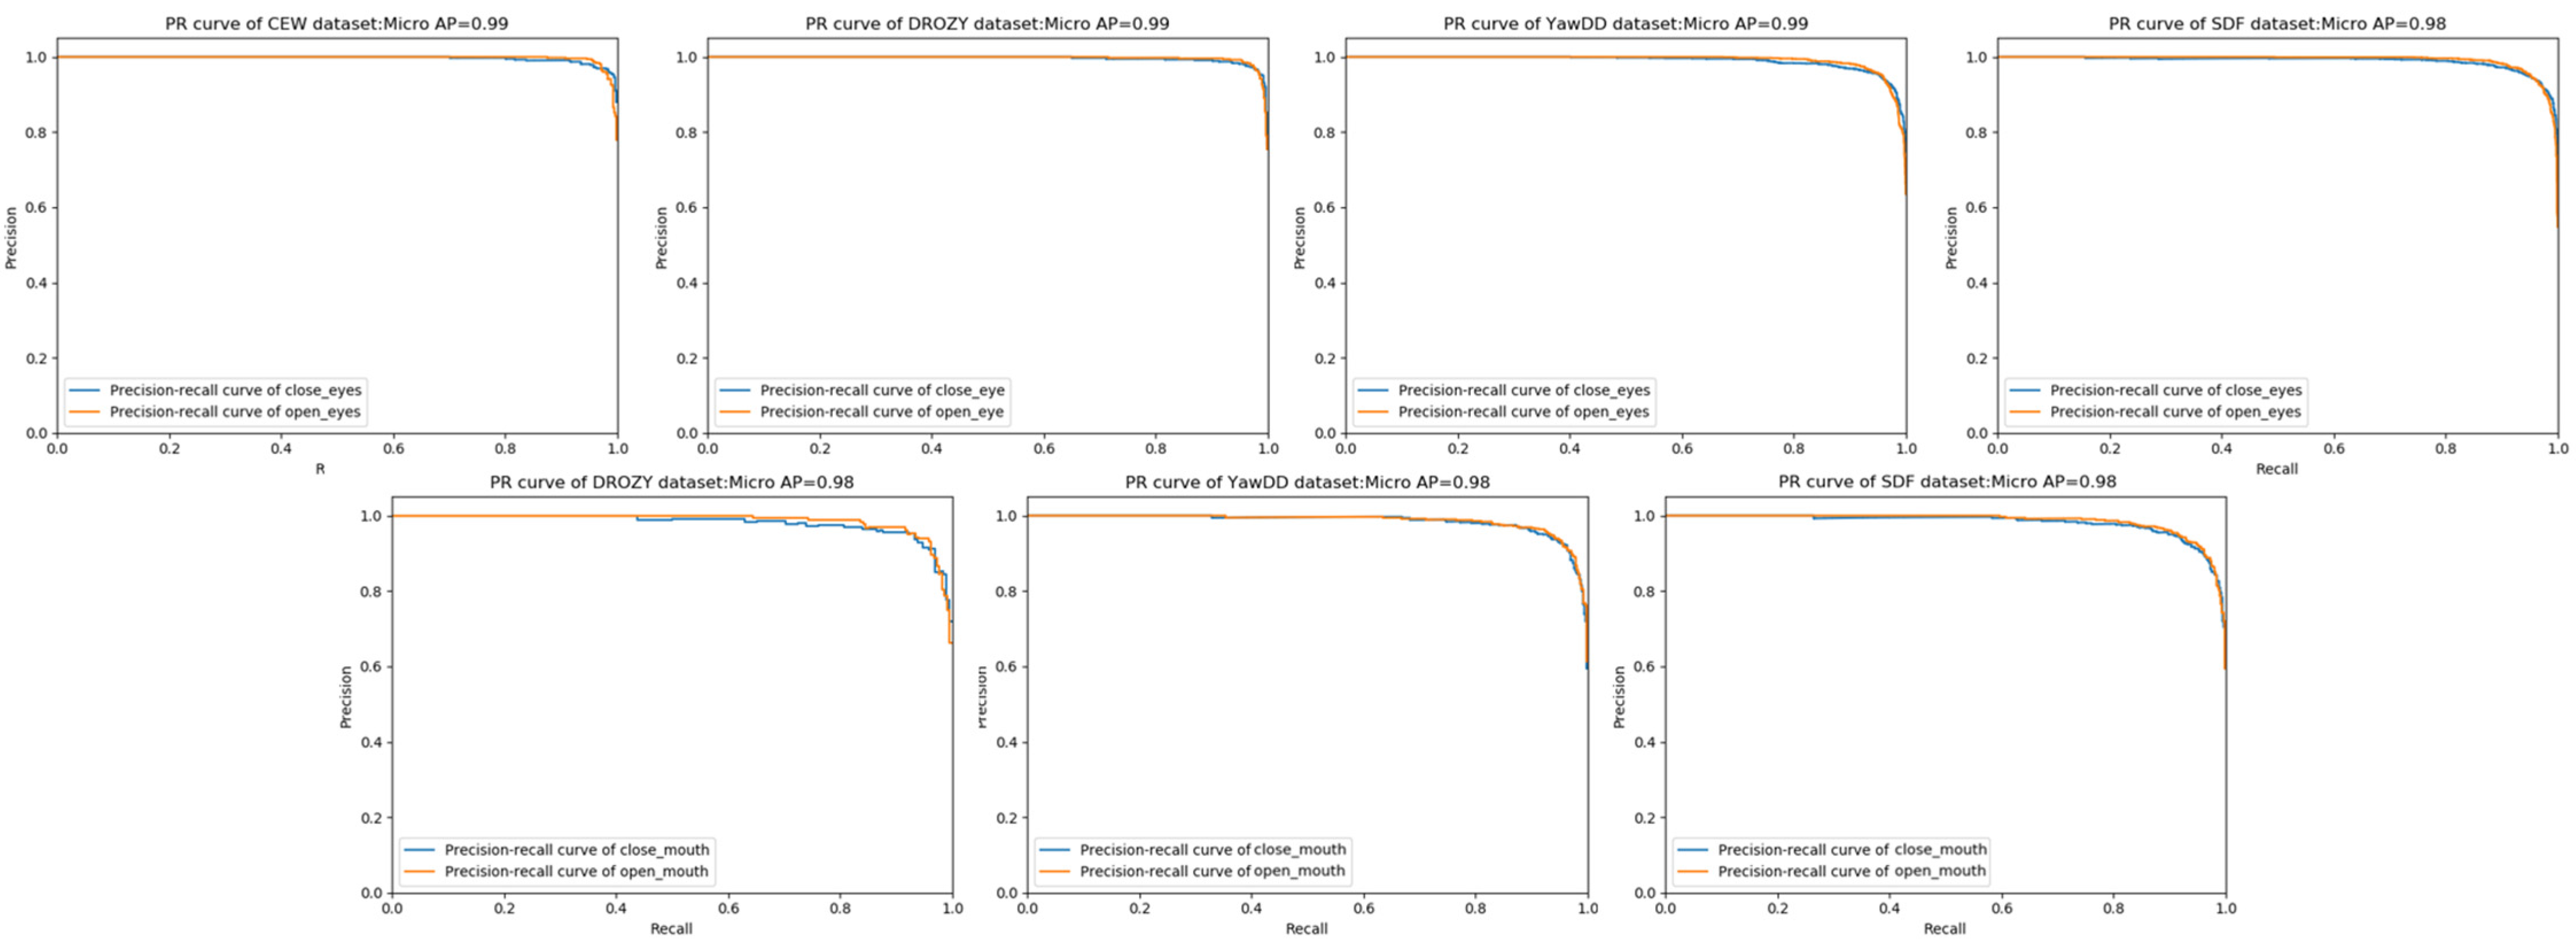
Figure 6 shows the PR curves of the RCAN under four datasets. The larger the area wrapped by the PR curve, the better the classification performance. The experimental results demonstrate that the classification performance of the proposed RCAN on the eye state is better than on the mouth state. In the SDF dataset, the accuracy of the RCAN can reach 98.962% for eye state classification. Similarly, the accuracy of the RCAN can reach 98.516% in the classification of the mouth state.
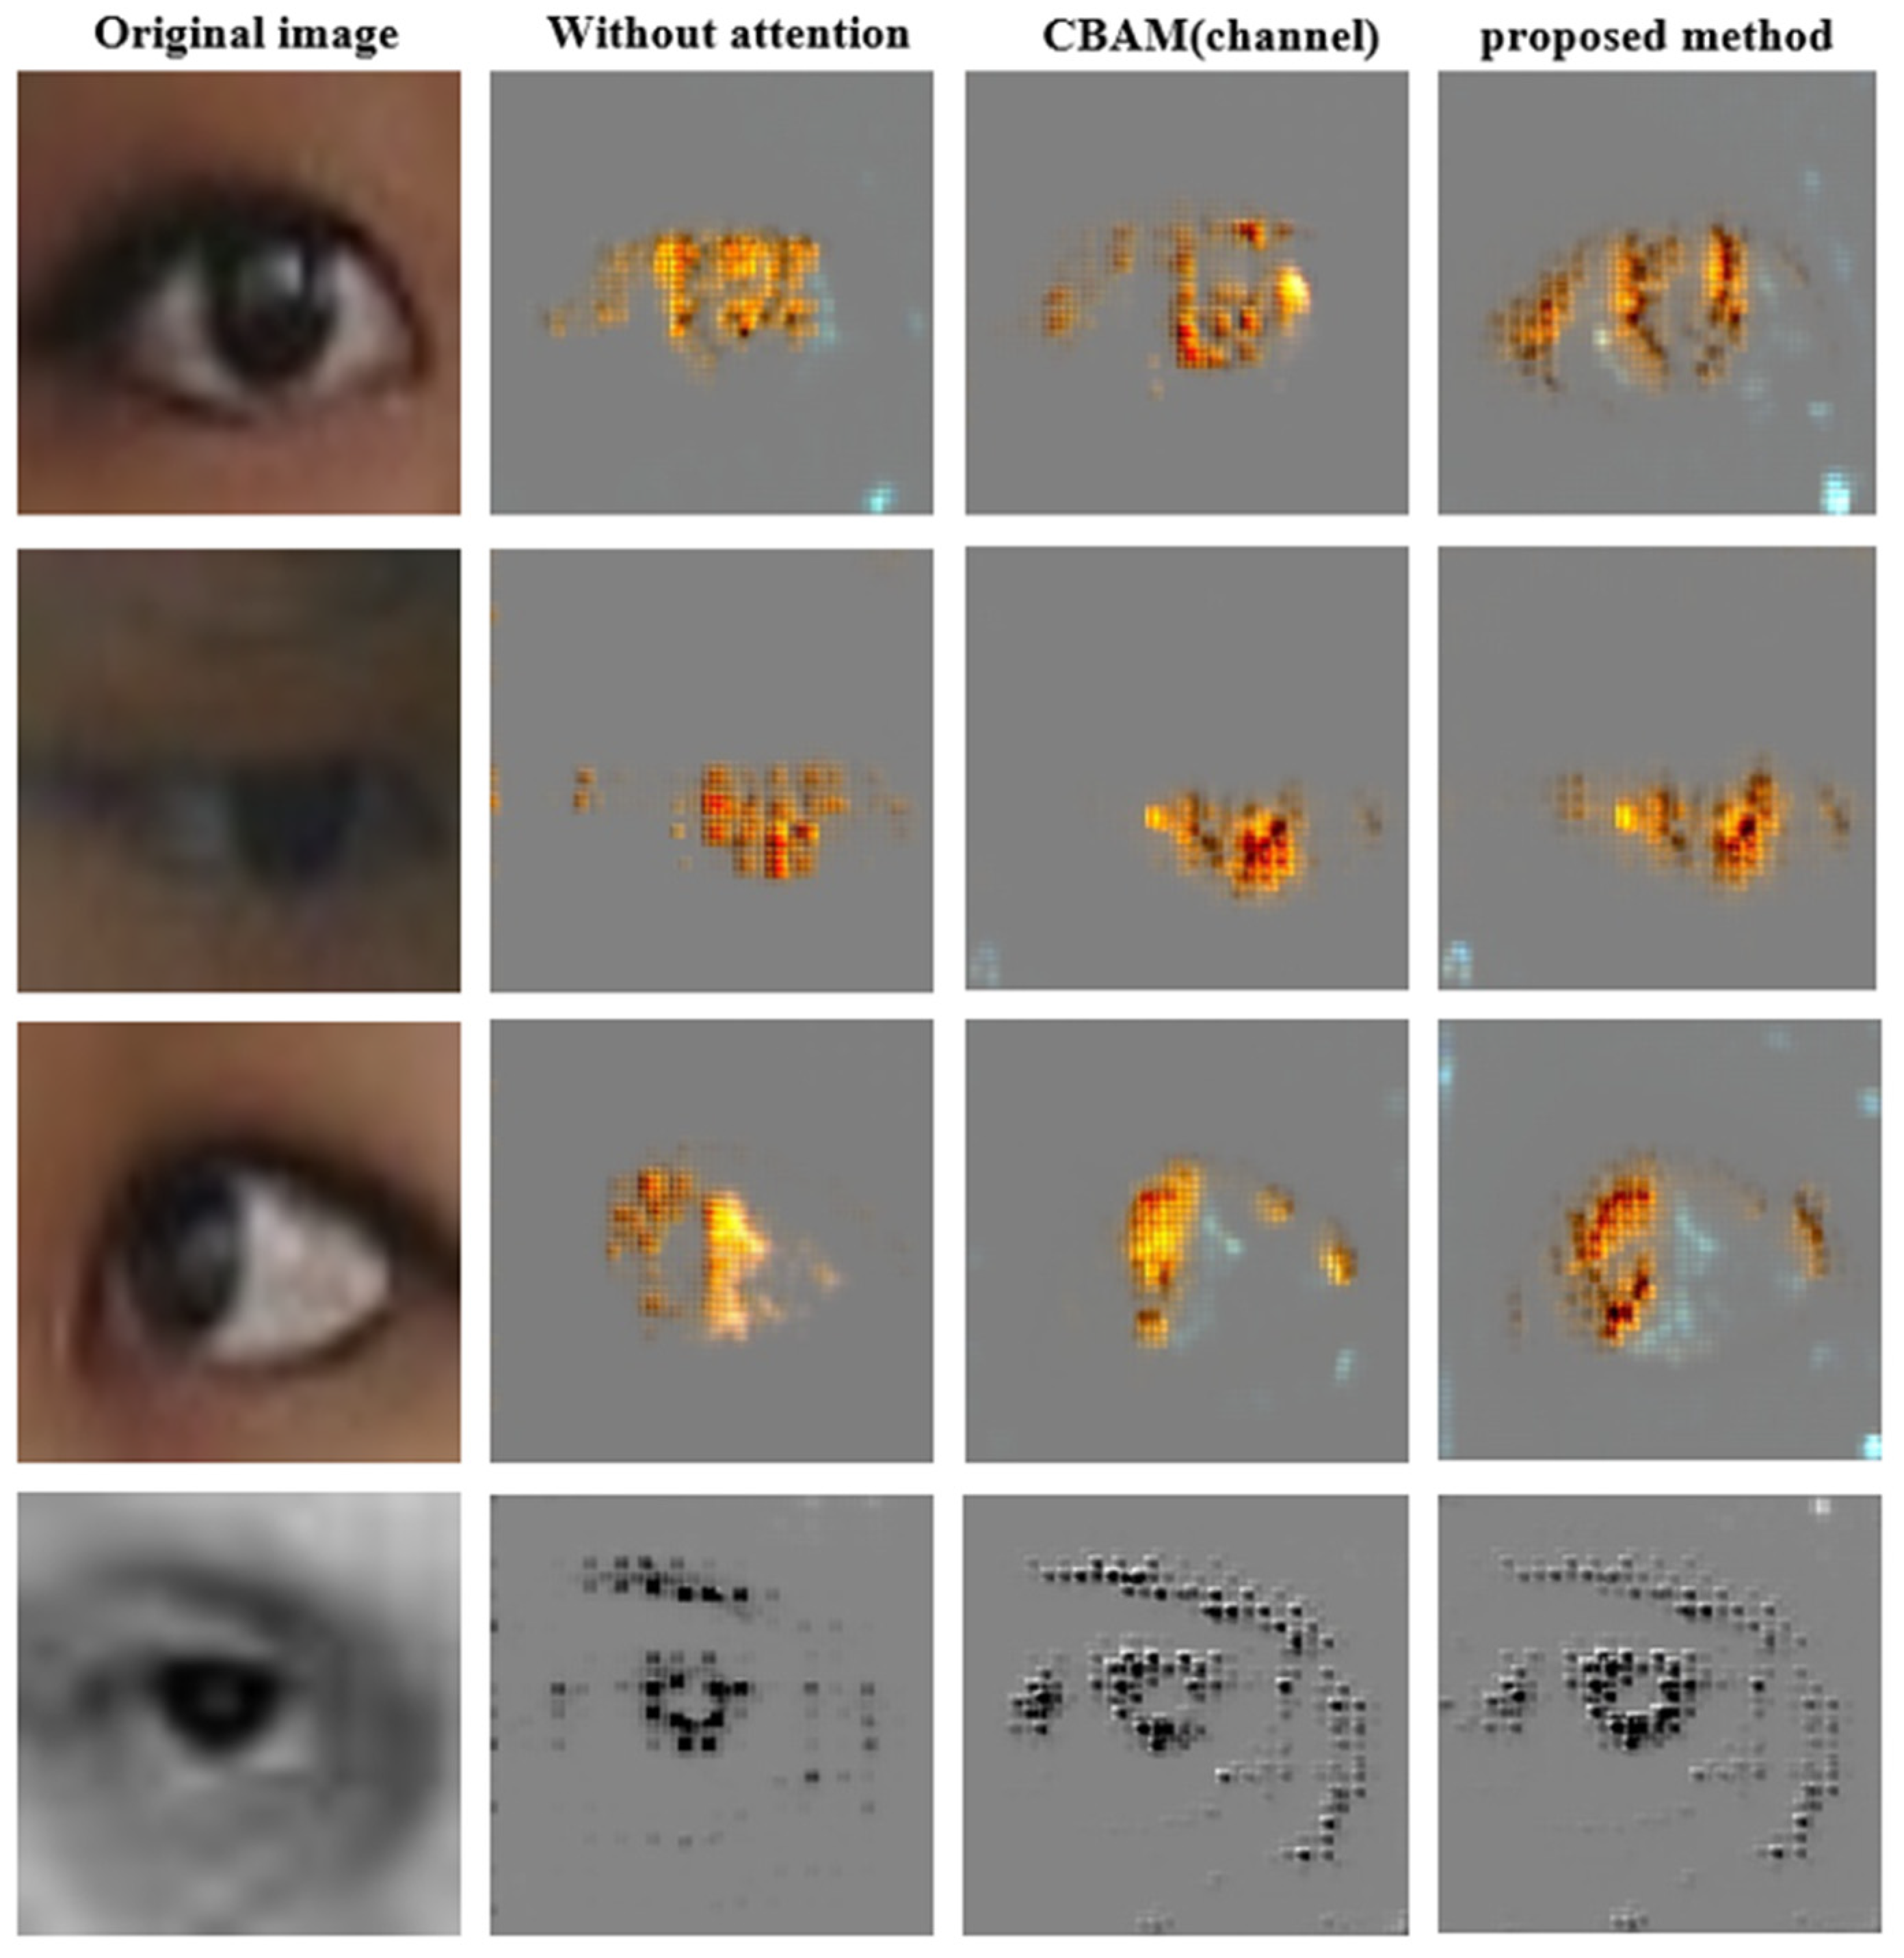
The RCAN also includes the channel attention module. To verify the effectiveness the channel attention module, we adopted the ablation strategy for experiment. We compared the original RCAN with the RCAN that deleted the channel attention module and the RCAN that fixed α as 0.5. The RCAN that fixed α as 0.5 is equivalent to the channel attention submodule of the CBAM [26]. Therefore, this study names this network structure as the RCAN (CBAM). Table 3 shows that the accuracy of the original RCAN is higher than that of the RCAN (CBAM) and the RCAN (no attention). We used Grad-CAM [35] to show the difference between the original RCAN and the RCAN (CBAM) and the RCAN (no attention). Grad-CAM can not only locate the position of eyes and the mouth in the image but also show what details the network has learned. Figure 7 shows that the RCAN with the channel attention module (original RCAN) can learn more details about the eye, such as the outline of the eye and the shape of the pupil. Therefore, the above experiments show that the channel attention module in the RCAN is effective.

4.4. Selection of the Over-Angle

The objective of this section is to determine whether the head pose is in an over-deflection state through the pitch, yaw, and roll of the head. In reality, we cannot directly obtain the Euler angle of the head and we just need to know whether the head is too deflected. In Section 3.1, this article constructed 10 one-min videos simulating the change of the driver’s head posture and marked each frame. If the head Euler angle is too deflected, it is annotated as 1, and if the head Euler angle is in a normal state, it is annotated as −1. Therefore, the purpose of this section is to obtain the angle (over-angle) at which the head posture is too deflected. When the Euler angle output by EPnP exceeds this angle, it is considered that the head posture is too deflected.
According to [14], the normal state of the head Euler angle is [−20°, 20°]. This value is related to the different methods used by different researchers. Therefore, this paper dynamically tests the situation of over-angles 16 to 25. The test results are shown in Figure 8.
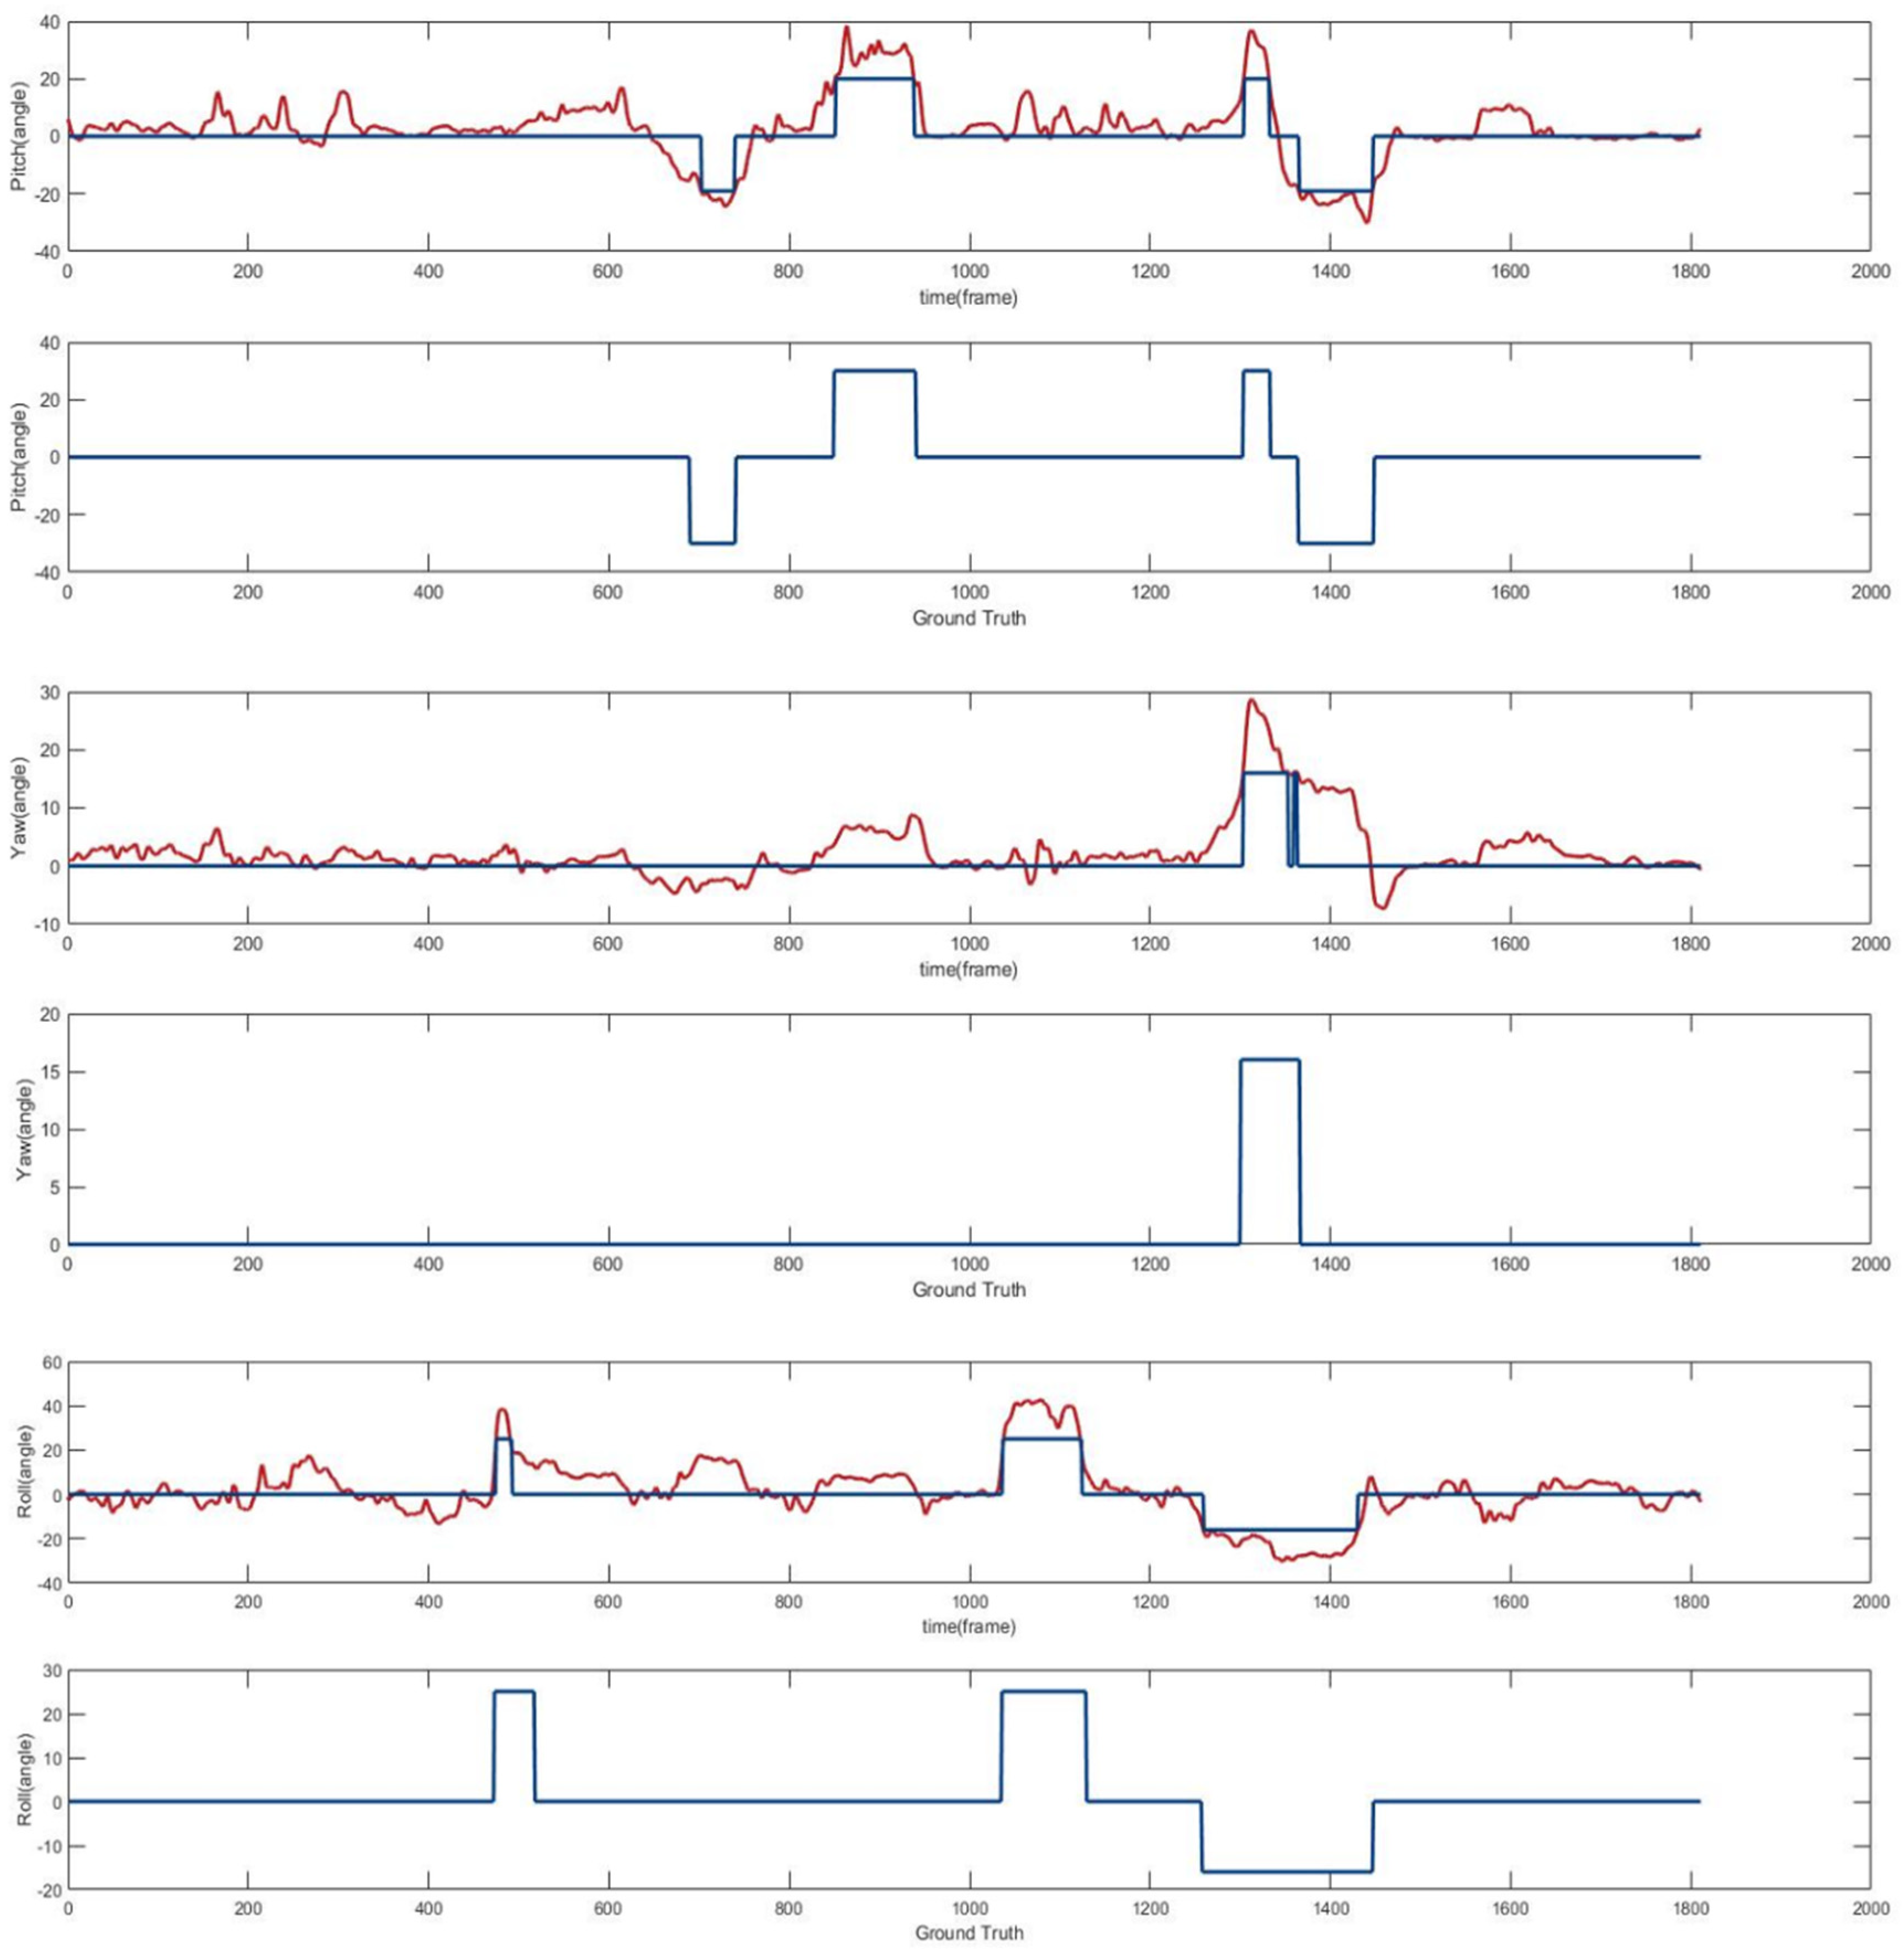
Figure 8 shows missed detection or wrong detection under different over-angles. It can be seen that when the pitch over-angle is 20°, missed detection and wrong detection is the least. Therefore, the pitch over-angle should be set to 21°. That is, when the pitch angle is between [−21°, 21°], the head pitch angle is normal. Similarly, the yaw over-angle should be set to 20° and the roll over-angle should be set to 20.5°. Figure 9 shows the results of using this set of over-angles to analyze one of the 1-min videos.
There are six graphs, from top to bottom, in Figure 9. The red curve of the first graph is the pitch output by EPnP. The blue line segment is binarized using the pitch over-angle. If it exceeds the over-angle, the pitch is too deflected. The second graph is the ground truth of the pitch angle. This line segment is the result of manual annotation. Other graphs are the test results of yaw and roll.

4.5. Fatigue State Recognition

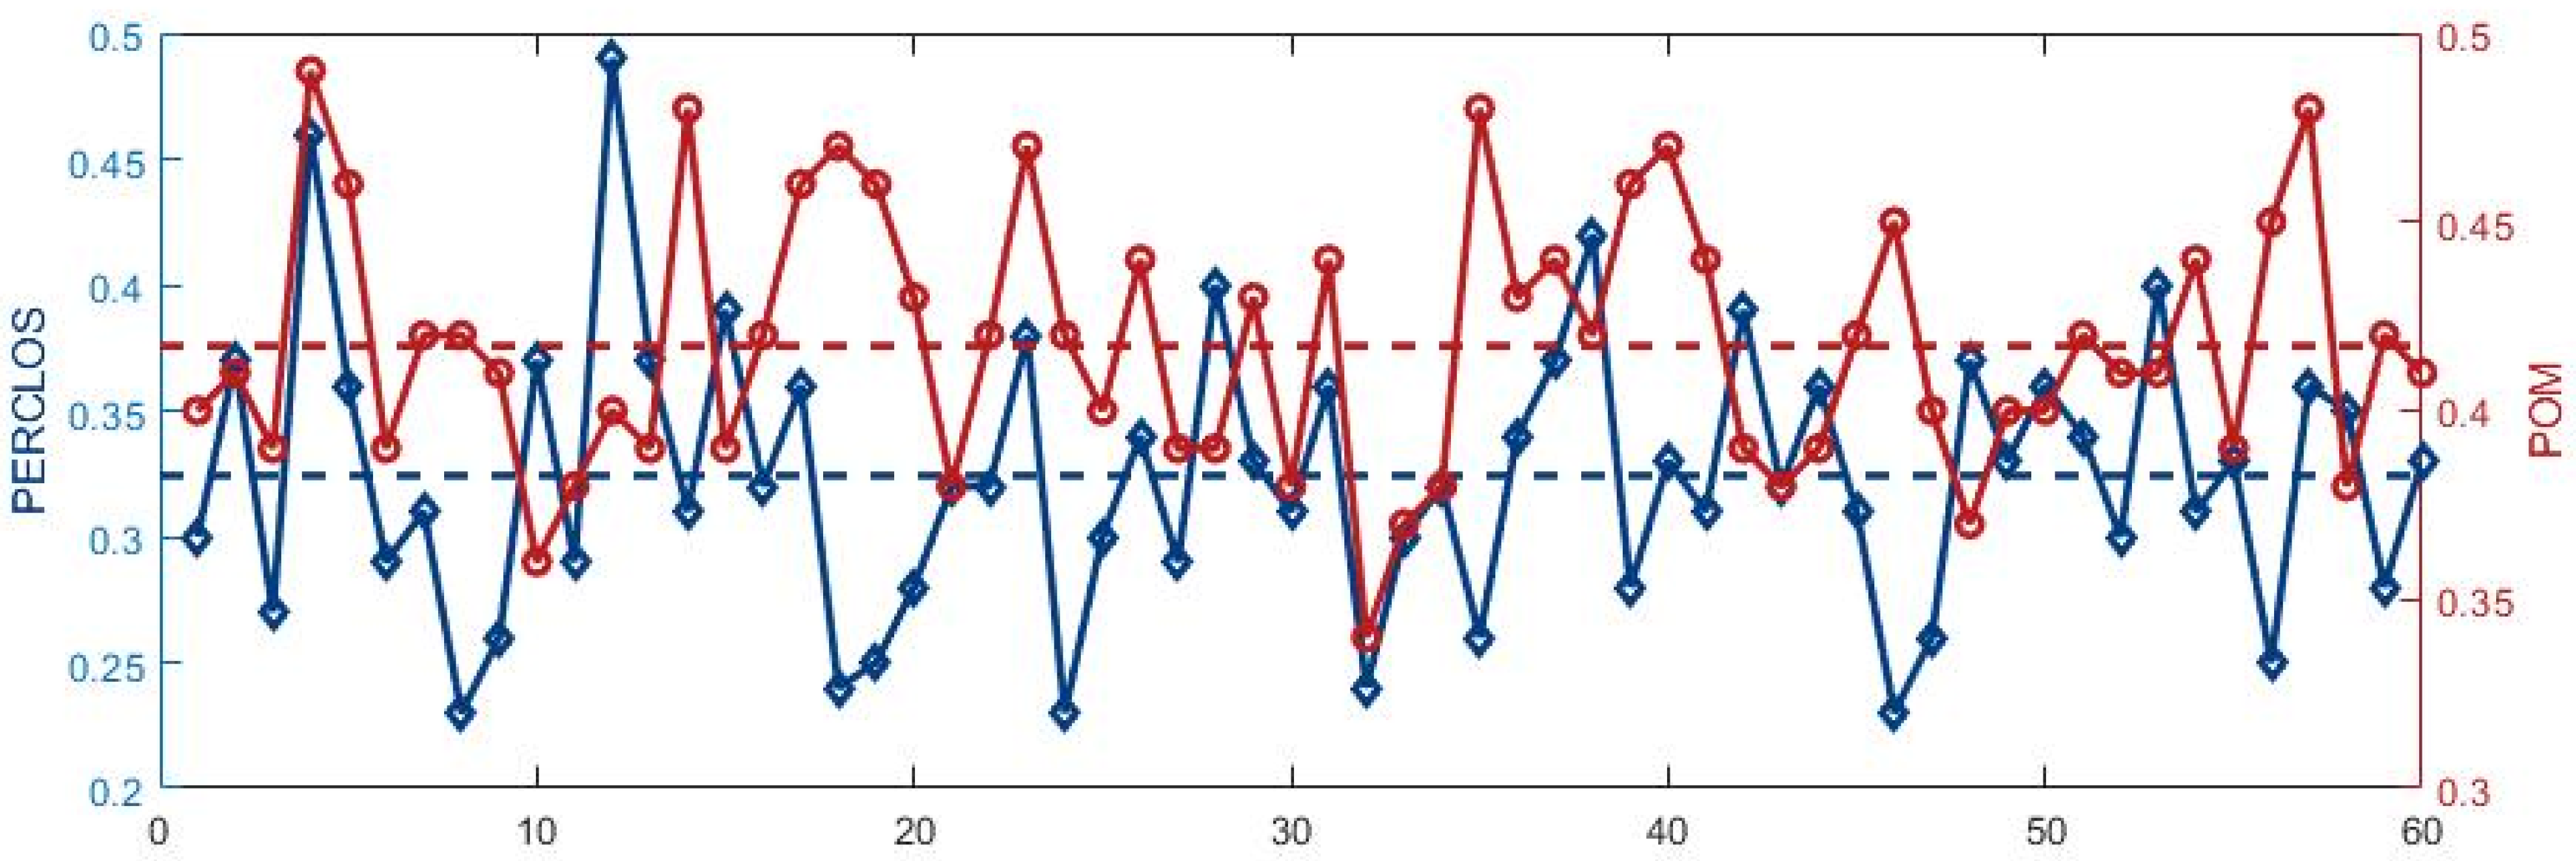
After the over-angle is determined, the thresholds of PERCLOS and POM need to be determined. We followed the method of [36]. This experiment converted the video of the SDF dataset into 60 frame sequences and converted them into images for recognition. Then we calculated the PERCLOS and POM of each video sequence. The results are shown in Figure 10.
The test results show that when PERCLOS reaches 0.32 or POM reaches 0.37, the driver enters the fatigue driving state. The greater the PERCLOS and POM, the deeper the driver’s fatigue. Synthesizing the results of this section and Section 4.4, it can be concluded that when PERCLOS is greater than 0.32 or POM is greater than 0.37, the driver is already in the fatigue driving stage. When the yaw angle is greater than 20°, the pitch angle is greater than 21°, and the roll angle is greater than 20.5°, the driver’s head posture has deviated excessively and a safety warning shall be given to the driver.

5. Conclusions

This study proposes a driver fatigue detection system based on the RCAN and head pose estimation. First, we use Retinaface to locate the face and eye/mouth regions. Then, the RCAN is used to classify the states of eyes and the mouth. Experiments show the superiority of the RCAN in classifying eye and mouth states. Meanwhile, we use EPnP to estimate the head pose based on five landmarks output by Retinaface. Then we compare the Euler angle output by EPnP with the over-angle of the head pose to judge whether it is in the state of over-deflection of the head. We use PERCLOS and POM to judge whether the driver is in a state of drowsiness. The experimental results show that if PERCLOS is greater than 0.32 or POM is greater than 0.37, the driver has already entered the state of fatigue driving and should stop driving in time, and if the yaw angle is greater than 20°, the pitch angle is greater than 21°, and the roll angle is greater than 20.5°, the driver’s head posture has deviated excessively and a safety warning shall be given to the driver. This driver fatigue detection system has high detection accuracy and robustness.
There are still some limitations of this framework. The position of the camera affects head pose estimation. Ideally, the camera is facing the driver. We have envisaged a solution, such as using the Euler angle gradient, to judge whether the driver’s head pose has changed suddenly. However, the discrimination conditions based on the gradient are too complex to design, Therefore, the future improvement of the framework may involve calibrating the initial pose of the camera based on other references in the vehicle, so as to optimize the accuracy of head pose estimation.
This framework has been tested for fatigue detection in a real driving environment. There are three future directions: 1. Continue to optimize the head pose estimation module. 2. Further increase the test data in the real driving environment. 3. Study how this framework applies to drivers with conversational or acquired disabilities.

Author Contributions

Conceptualization, M.Y. and W.Z.; methodology, M.Y.; software, M.Y.; validation, M.Y. and P.C.; formal analysis, M.Y.; investigation, M.Y.; resources, M.Y.; data curation, M.Y.; writing—original draft preparation, M.Y.; writing—review and editing, M.Y.; project administration, K.L.; funding acquisition, M.Y. All authors have read and agreed to the published version of the manuscript.

Funding

This work was supported in part by the National Natural Science Foundation of China (No. 51805312) and in part by the Shanghai Sailing Program (No.18YF1409400).

Acknowledgments

The authors would like to express their appreciation to the developers of Pytorch and OpenCV and the authors of EPnP.

Conflicts of Interest

The authors declare that they have no conflicts of interest.

References

  1. Koesdwiady, A.; Soua, R.; Karray, F.; Kamel, M.S. Recent Trends in Driver Safety Monitoring Systems: State of the Art and Challenges. IEEE Trans. Veh. Technol. 2016, 66, 4550–4563. [Google Scholar] [CrossRef]
  2. Chai, M.; Li, S.W.; Sun, W.C.; Guo, M.Z.; Huang, M.Y. Drowsiness monitoring based on steering wheel status. Transp. Res. Part D Transp. Environ. 2019, 66, 95–103. [Google Scholar] [CrossRef]
  3. Lawoyin, S. Novel Technologies for the Detection and Mitigation of Drowsy Driving. Bachelor’s Thesis and Diploma Thesis, Virginia Commonwealth University, Richmond, VA, USA, 2014. [Google Scholar]
  4. Tango, F.; Botta, M. Real-time detection system of driver distraction using machine learning. IEEE Trans. Intell. Transp. Syst. 2013, 14, 894–905. [Google Scholar] [CrossRef] [Green Version]
  5. Min, J.; Xiong, C.; Zhang, Y.; Cai, M. Driver fatigue detection based on prefrontal EEG using multi-entropy measures and hybrid model. Biomed. Signal Process. Control 2021, 69, 102857. [Google Scholar] [CrossRef]
  6. Zhang, G.; Etemad, A. Capsule Attention for Multimodal EEG-EOG Representation Learning with Application to Driver Vigilance Estimation. IEEE Trans. Neural Syst. Rehabil. Eng. 2021, 29, 1. [Google Scholar] [CrossRef]
  7. Satti, A.T.; Kim, J.; Yi, E.; Cho, H.Y.; Cho, S. Microneedle array electrode-based wearable EMG system for detection of driver drowsiness through steering wheel grip. Sensors 2021, 21, 5091. [Google Scholar] [CrossRef]
  8. Zhao, Z.; Xia, S.; Xu, X.; Zhang, L.; Yan, H.; Xu, Y.; Zhang, Z. Driver Distraction Detection Method Based on Continuous Head Pose Estimation. Comput. Intell. Neurosci. 2020, 2020, 1–10. [Google Scholar] [CrossRef]
  9. Viola, P.; Jones, M.J. Robust real-time face detection. Int. J. Comput. Vision 2004, 57, 137–154. [Google Scholar] [CrossRef]
  10. Zhang, K.; Zhang, Z.; Li, Z.; Qiao, Y. Joint face detection and alignment using multitask cascaded convolutional networks. IEEE Signal Process. Lett. 2016, 23, 1499–1503. [Google Scholar] [CrossRef] [Green Version]
  11. Deng, J.; Guo, J.; Zhou, Y.; Yu, J.; Kotsia, I.; Zafeiriou, S. Retinaface: Single-Stage Dense Face Localisation in the Wild. arXiv 2019, arXiv:1905.00641. Available online: https://arxiv.org/abs/1905.00641 (accessed on 6 September 2021).
  12. Benoit, A.; Caplier, A. Fusing bio-inspired vision data for simplified high level scene interpretation: Application to face motion analysis. Comput. Vis. Image Underst. 2010, 114, 774–789. [Google Scholar] [CrossRef]
  13. Bakheet, S.; Al-Hamadi, A. A framework for instantaneous driver drowsiness detection based on improved hog features and naïve Bayesian classification. Brain Sci. 2021, 11, 240. [Google Scholar] [CrossRef]
  14. Akrout, B.; Mahdi, W. A novel approach for driver fatigue detection based on visual characteristics analysis. J. Ambient. Intell. Humaniz. Comput. 2021, 1–26. [Google Scholar] [CrossRef]
  15. Gu, W.H.; Zhu, Y.; Chen, X.D.; He, L.F.; Zheng, B.B. Hierarchical CNN-based real-time fatigue detection system by visual-based technologies using MSP model. IET Image Process. 2018, 12, 2319–2329. [Google Scholar] [CrossRef]
  16. Ji, Y.; Wang, S.; Zhao, Y.; Wei, J.; Lu, Y. Fatigue State Detection Based on Multi-Index Fusion and State Recognition Network. IEEE Access 2019, 7, 64136–64147. [Google Scholar] [CrossRef]
  17. Zhao, G.; He, Y.; Yang, H.; Tao, Y. Research on fatigue detection based on visual features. IET Image Process. 2021. [Google Scholar] [CrossRef]
  18. Hu, J.; Shen, L.; Sun, G. Squeeze-and-excitation networks. In Proceedings of the IEEE Conference On Computer Vision and Pattern Recognition, Salt Lake City, UT, USA, 18–23 June 2018; pp. 7132–7141. [Google Scholar]
  19. Ruiz, N.; Chong, E.; Rehg, J.M. Fine-grained head pose estimation without keypoints. In Proceedings of the IEEE Conference on Computer Vision and Pattern Recognition Workshops, Salt Lake City, UT, USA, 18–22 June 2018; pp. 2074–2083. [Google Scholar]
  20. Abate, A.F.; Barra, P.; Pero, C.; Tucci, M. Head pose estimation by regression algorithm. Pattern Recognit. Lett. 2020, 140, 179–185. [Google Scholar] [CrossRef]
  21. Abate, A.F.; Barra, P.; Pero, C.; Tucci, M. Partitioned iterated function systems by regression models for head pose estimation. Mach. Vis. Appl. 2021, 32, 1–8. [Google Scholar] [CrossRef]
  22. Lepetit, V.; Moreno-Noguer, F.; Fua, P. EPnP: An Accurate O(n) Solution to the PnP Problem. Int. J. Comput. Vis. 2008, 81, 155–166. [Google Scholar] [CrossRef] [Green Version]
  23. Wan, Y.; Xie, J. One algorithm of driver fatigue detecting based on PERCLOS. Agric Equip Technol. 2009, 35, 25–28. [Google Scholar]
  24. Tan, M.; Le, Q. Efficientnet: Rethinking model scaling for convolutional neural networks. Int. Conf. Mach. Learn. 2019, 97, 6105–6114. [Google Scholar]
  25. Sandler, M.; Howard, A.; Zhu, M.; Zhmoginov, A.; Chen, L.C. Mobilenetv2: Inverted residuals and linear bottlenecks. In Proceedings of the IEEE Conference on Computer Vision and Pattern Recognition, Salt Lake City, UT, USA, 18–23 June 2018; pp. 4510–4520. [Google Scholar]
  26. Woo, S.; Park, J.; Lee, J.Y.; Kweon, I.S. CBAM: Convolutional block attention module. In Proceedings of the European Conference on Computer Vision (ECCV), Munich, Germany, 8–14 September 2018; pp. 3–19. [Google Scholar]
  27. Xie, S.; Girshick, R.; Dollár, P.; Tu, Z.; He, K. Aggregated residual transformations for deep neural networks. In Proceedings of the IEEE Conference on Computer Vision and Pattern Recognition, Honolulu, HI, USA, 21–26 July 2017; 2017; pp. 1492–1500. [Google Scholar]
  28. Szegedy, C.; Ioffe, S.; Vanhoucke, V.; Alemi, A.A. Inception-v4, inception-resnet and the impact of residual connections on learning. In Proceedings of the Thirty-first AAAI Conference on Artificial Intelligence, San Francisco, CA, USA, 4–9 February 2017. [Google Scholar]
  29. Taigman, Y.; Yang, M.; Ranzato, M. Deepface: Closing the gap to human-level performance in face verification. In Proceedings of the IEEE Conference on Computer Vision and Pattern Recognition, Columbus, OH, USA, 23–28 June 2016; 2014; pp. 1701–1708. [Google Scholar]
  30. Geng, L.; Yuan, F.; Xiao, Z.T. Driver fatigue detection method based on facial behavior analysis. Comput. Eng. 2018, 44, 274–279. [Google Scholar]
  31. Song, F.Y.; Tan, X.Y.; Liu, X.; Chen, S.C. Eyes closeness detection from still images with multi-scale histograms of principal oriented gradients. Pattern Recognit. 2014, 47, 2825–2838. [Google Scholar] [CrossRef]
  32. Massoz, Q.; Langohr, T.; Francois, C.; Verly, J.G. The ULg multimodality drowsiness database (called DROZY) and examples of use. In Proceedings of the IEEE Winter Conference on Applications of Computer Vision, Lake Placid, NY, USA, 7–10 March 2016; pp. 1–7. [Google Scholar] [CrossRef] [Green Version]
  33. Abtahi, S.; Omidyeganeh, M.; Shirmohammadi, S.; Hariri, B. YawDD: A yawning detection dataset. In Proceedings of the 5th ACM Multimedia Systems Conference, New York, NY, USA, 19 March 2014; pp. 24–28. [Google Scholar]
  34. Kingma, D.P.; Ba, J. Adam: A Method for Stochastic Optimization. arXiv 2014, arXiv:1412.6980. Available online: https://arxiv.org/abs/1412.6980 (accessed on 6 September 2021).
  35. Selvaraju, R.R.; Cogswell, M.; Das, A.; Vedantam, R.; Parikh, D.; Batra, D. Grad-cam: Visual explanations from deep networks via gradient-based localization. In Proceedings of the IEEE International Conference on Computer Vision, Venice, Italy, 22–29 October 2017; pp. 618–626. [Google Scholar]
  36. Zhao, Z.; Zhou, N.; Zhang, L.; Yan, H.; Xu, Y.; Zhang, Z. Driver Fatigue Detection Based on Convolutional Neural Networks Using EM-CNN. Comput. Intell. Neurosci. 2020, 2020, 1–11. [Google Scholar] [CrossRef]
Figure 1. The overall structure of driver fatigue state detection.
Applsci 11 09195 g001
Figure 2. Detection results of Retinaface.
Applsci 11 09195 g002
Figure 3. The structure of an RCAB and its channel attention module.
Applsci 11 09195 g003
Figure 4. Results of head pose estimation by EPnP in a natural scene. 1 and 2 indicate that the head postures are normal. 3 and 4 indicate abnormal head rolling angles. 5 and 6 indicate abnormal head pitch angles. 7 and 8 indicate abnormal head yaw angles.
Applsci 11 09195 g004
Figure 5. All datasets used in this study.
Applsci 11 09195 g005
Figure 6. PR curves of the RCAN under four datasets.
Applsci 11 09195 g006
Figure 7. Using Grad-CAM to visualize the details learned by the network.
Applsci 11 09195 g007
Figure 8. Missed detection and wrong detection frames of different over-angles. The left image is of the pitch over-angle. The middle image is of the yaw over-angle. The right image is of the roll over-angle.
Applsci 11 09195 g008
Figure 9. The above figure shows the results of using the angle analysis video in this section.
Applsci 11 09195 g009
Figure 10. Threshold of PERCLOS and POM.
Applsci 11 09195 g010
Table 1. The structure of the RCAN.
LayerKernel SizeFiltersStrideOutput
-1 × 116156 × 56 × 16
-1 × 116156 × 56 × 16
RCAB11 × 1, 3 × 332156 × 56 × 32
Max-Pooling2 × 2-228 × 28 × 32
RCAB21 × 1, 3 × 364128 × 28 × 64
Max-Pooling2 × 2-214 × 14 × 64
RCAB31 × 1, 3 × 3128114 × 14 × 128
Max-Pooling2 × 2-27 × 7 × 128
FC Layer1512FC-512
FC Layer2512FC-2
Softmax2Softmax-2
Table 2. All datasets used in this study.
DatasetTrain (Eyes)Test (Eyes)TotalTrain (Mouth)Test (Mouth)Total
CEW38779694846×××
Open19074772384×××
Close19704922462×××
YawDD44081102551039409854925
Open2408601300922995752874
Close2000501250116414102051
DROZY3128782391018404602300
open156039019508982241122
Close156839219609422361178
SDF14,567364218,209781819549772
Open782119569777412310315154
Close67461686843236959234618
Table 3. Classification accuracy of the RCAN and different classical CNN structures on four datasets.
DatasetTraining ObjectTest DataMethodAccuracy (%)
SDFEyes3642ResNetXt-5097.968
InceptionV497.831
EfficientNet98.325
RCAN(no attention) 96.541
RCAN (CBAM)98.465
RCAN98.962
Mouth1954ResNetXt-5097.595
InceptionV497.697
EfficientNet98.464
RCAN (no attention)94.417
RCAN(CBAM)98.327
RCAN98.516
DROZYEyes782ResNetXt-5098.593
InceptionV498.977
EfficientNet98.721
RCAN (no attention)98.082
RCAN (CBAM)98.593
RCAN99.233
Mouth460ResNetXt-5097.609
InceptionV497.391
EfficientNet98.043
RCAN (no attention)96.304
RCAN (CBAM)98.261
RCAN98.478
YawDDEyes1102ResNetXt-5098.457
InceptionV498.276
EfficientNet98.548
RCAN (no attention)95.531
RCAN (CBAM)98.557
RCAN99.002
Mouth985ResNetXt-5098.172
InceptionV498.477
EfficientNet98.782
RCAN (no attention)94.188
RCAN(CBAM)98.438
RCAN98.678
CEWEyes969ResNetXt-5098.555
Inception98.967
EfficientNet98.762
RCAN (no attention)97.751
RCAN(CBAM)98.967
Table 4. Classification results of the RCAN in each dataset.
DatasetTypeP (%)R (%)F-Score (%)Accuracy (%)
CEW 99.278
Eye dataOpen eyes99.37099.16199.265
Closed eyes99.18999.3999.289
DROZY (eyes) 99.233
Eye dataOpen eyes99.45898.97499.229
Closed eyes98.98599.49099.237
DROZY (mouth) 98.478
Mouth dataOpen mouth98.65598.21498.434
Closed mouth98.31298.72998.520
YawDD (eyes) 99.002
Eye dataOpen eyes99.16799.00299.084
Closed eyes98.80599.00298.903
YawDD (mouth) 98.678
Mouth dataOpen mouth98.78098.95398.867
Closed mouth98.53398.29398.413
SDF (eyes) 98.962
Eye dataOpen eyes99.08498.98399.034
Closed eyes98.82098.93798.878
SDF (mouth) 98.516
Mouth dataOpen mouth98.73598.44898.592
Closed mouth98.27298.59298.432
Publisher’s Note: MDPI stays neutral with regard to jurisdictional claims in published maps and institutional affiliations.