Abstract
The proposed work aims to acquire the maximum number of non-linear assemblies with closer assembly tolerance specifications by mating the different bins’ components. Before that, the components are classified based on the range of tolerance values and grouped into different bins. Further, the manufacturing process of the components is selected from the given and known alternative processes. It is incredibly tedious to obtain the best combinations of bins and the best process together. Hence, a novel approach using the combination of the univariate search method and the harmony search algorithm is proposed in this work. Overrunning clutch assembly is taken as an example. The components of overrunning clutch assembly are manufactured with a wide tolerance value using the best process selected from the given alternatives by the univariate search method. Further, the manufactured components are grouped into three to nine bins. A combination of the best bins is obtained for the various assembly specifications by implementing the harmony search algorithm. The efficacy of the proposed method is demonstrated by showing 24.9% of cost-savings while making overrunning clutch assembly compared with the existing method. The efficacy of the proposed method is demonstrated by showing 24.9% of cost-savings while making overrunning clutch assembly compared with the existing method. The results show that the contribution of the proposed novel methodology is legitimate in solving selective assembly problems.
1. Introduction
Product quality is the focus of any manufacturing process. In general, two or more components are assembled to create an assembly. The quality of the assembly depends on the quality of the components, which affects the product’s functionality. Tolerance plays an essential role in the component’s quality, deciding the fit between the mating parts. The components manufactured with closer tolerance make the precise assembly more suitable for functional requirements. Selective assembly is one of the feasible methods for making precise assemblies with lower manufacturing costs. The complete elimination or reduction of secondary operations by forming wide-tolerance components is the reason for lower manufacturing costs. In selective assembly, the components are grouped as bins based on the uniform grouping method, the equal probability method, or the uniform tolerance method, for example. According to the best bin combinations, the precise assemblies are made by mating the components randomly selected from the corresponding bins. Most of the research on linear/radial assembly have mainly focused on minimizing the objectives, namely, clearance variation or surplus parts. Research works focusing on non-linear assembly are seldom found. Moreover, in the existing literature, the tolerance of the components is usually considered for obtaining the best bin combinations rather than the dimension of components. Since different combinations of bins are possible, this problem environment can be treated as an NP-hard problem. Selection of process for making components from the given alternative processes also plays a vital role in further reducing the product’s manufacturing cost.
2. Related Research
The literature relevant to the proposed work has been categorized as selective assembly and the harmony search algorithm. The literature related to both topics is detailed below.
2.1. Selective Assembly
Kern (2003) [1] proposed an approach for selecting assembly by considering variations in the dimensional distributions. Further, the author developed closed-form equations for the different techniques of selective assembly. Mease et al. (2004) [2] introduced a method to classify the components into various classes based on the dimensional variations. The assembly was made by pairing the selected components from the different classes. Further, the absolute and squared error loss functions were studied to select the optimum method. Matsuura et al. (2008) [3] explored a method to minimize clearance variation when pairing the components with less variance for making an assembly. Kwon et al. (2009) [4] studied the effectiveness of optimal binning strategies based on the squared error loss function by considering similar normal distributions of the dimensions of two different components. Matsuura et al. (2011) [5] developed the optimal mean shift to reduce surplus components while making selective assembly. The equal width concept was used for grouping the components into different bins. Three shifted means method was used for the fabrication of components.
Yue et al. (2014) [6] proposed a genetic algorithm to minimize the variation in clearance while mating the components available in the selective groups to manufacture hole and shaft assemblies. Babu and Asha (2014) [7] introduced a customized artificial immune system algorithm for mating the components available in selective groups to minimize assembly clearance variation. Further, they applied Taguchi’s loss function to identify the deviation from the mean. The count of selective groups was also one of the important concerns in the proposed work. Ju and Li (2014) [8] solved selective assembly problems using a two-stage decomposition procedure. A two-component assembly system with unreliable Bernoulli machines and limited inventories was considered. The effectiveness of the proposed method was analyzed analytically.
Xu et al. (2014) [9] applied a new method with the combination of discarding and binning theorems to minimize the components’ variations while making the selective assembly of a hard disk drive. The utilization rate of the components was high with regard to the number of assemblies made using the newly proposed method. Lu and Fei (2015) [10] proposed a grouping method in selective assembly to increase the success rate of manufacturing the assemblies and reducing the surplus parts. A genetic algorithm with a 2D chromosome structure was used for this purpose. The effectiveness of the proposed method was studied based on solving three different cases. Manickam and De (2015) [11] developed a genetic algorithm to identify the better combination of groups containing the components to create the maximum number of assemblies with less total cost. The small number of components with wider tolerance was made available in the individual groups. This was the uniqueness of the presented work. The model was developed using MATLAB software.
Babu and Asha (2015) [12] evaluated the losses in making assemblies by applying the symmetrical interval-based Taguchi loss function. Further, the dual objectives, namely, minimum clearance variation and minimum losses in making assemblies, were considered to identify the better combination of the parts’ groups using the sheep flock heredity algorithm. Ju et al. (2016) [13] studied the performance of the selective assembly system using Bernoulli machine reliability models. For this study, the assemblies made through two components with different qualities were considered. The two-stage decomposition procedure was applied to evaluate the effectiveness of the proposed models analytically. Malaichamy et al. (2016A) [14] developed software capable of applying all kinds of selective assembly methods to identify suitable solutions with the least possible time. For instance, equal area and width methods were used to minimize variation and scrap in selective assembly. The random assembly method was inbuilt in the software to select the best method for minimizing the manufacturing cost of the assembly. Since the software was developed using an optional programming language, changes to the input data were extremely easy, and, in no time, the result could be viewed graphically.
Malaichamy et al. (2016B) [15] introduced a software approach to help engineers to visualize the tolerance cost curve for a given process or a good combination of processes in no time. The tolerance cost was calculated using the reciprocal power cost model. The best process could be selected in this work from the given alternative processes for the known tolerance value. A simulated annealing algorithm was implemented to compute the best bin number and its combinations with almost nil surplus parts for the given dimensional distribution of components of a shaft housing assembly. Compared with random assembly, a good number of surplus parts were reduced by implementing an equal width selective assembly method. Liu and Liu (2017) [16] discussed the remanufacturing of the engine through the selective assembly concept. Remanufacturing is a sustainable strategy in which the group numbers and range of components in each group are not kept constant. The assembly accuracy was greatly increased using the proposed strategy. Chu et al. (2018) [17] developed a method for manufacturing gear reducers using a novel strategy called GA-based selective assembly. The backlash of the gear reducer was the major concern in this work to verify the meeting of assembly requirements.
2.2. Harmony Search Algorithm
Geem et al. (2001) [18] described the harmony search optimization algorithm’s features, robustness, simplicity, and search efficiency in solving engineering problems. Geem et al. (2002) [19] proposed a harmony search optimization algorithm to solve the problems associated with pipe network design. Lee and Geem (2004) [20] described a novel structural optimization algorithm using the harmony search method. The effectiveness of the proposed algorithm was verified by identifying the solutions to different truss problems. Lee and Geem (2005) [21] solved different engineering optimization problems that included minimizing mathematical functions and optimizing structural problems using a harmonic-search-based method. Flow demand and low head were considered objectives in this work. Wang et al. (2009) [22] analyzed the harmony search algorithm’s effectiveness with the colonal selection algorithm. The colonal search method was used to increase the harmony memory members in the harmony search method.
From the literature survey, it is clear that research works have been very limited in the manufacturing of non-linear assemblies with a closer assembly tolerance specification. Further, the usage of the harmony search algorithm for solving selective assembly problems is seldom found. The problem environment is discussed in the next section.
3. Problem Environment
In selective assembly, parts are manufactured with wider tolerance, measured, and partitioned into groups, and assemblies are made by assembling the components within the random combination of groups. Manufacturing tolerance, assembly specification, and the number of groups are the three main factors that play important roles in controlling surplus parts that affect the product’s manufacturing cost. After parts are manufactured, it is tedious to obtain the best combination of groups for different assembly specifications. It is laborious work to compute the numbers of closer assembly for each bin number from the manufactured components. Alternative process selection for making components also makes the problem highly complicated. The problems described above are challenging to process/design engineers and reduce implementation in real situations. Moreover, the components involved in making a non-linear assembly require the individual mating of dimensions for each assembly. Compared to making linear assembly, this required additional computation effort is tedious.
4. Solution Methodology
The proposed problem environment can be solved in three stages. In the first stage, the best process for manufacturing each component of an assembly is obtained from the alternative processes using the univariate search method. In the second stage, 1000 simulated dimensions of each component are generated using MATLAB for the different combinations of alternative processes obtained from the first stage. Further, the components are partitioned into different bin numbers according to the equal area method, which is one of the techniques used in the selective assembly method. In the last stage, the harmony search algorithm is implemented to obtain the best bin combinations. Then, the non-linear assemblies are made by mating the components according to the best bin combinations with almost nil surplus parts. To show the effectiveness of the proposed method, the manufacturing cost of assemblies made both from the random assembly [23] and selective assembly are compared. This three-stage approach is explained in a detailed way in the numerical illustration section.
5. Numerical Illustration
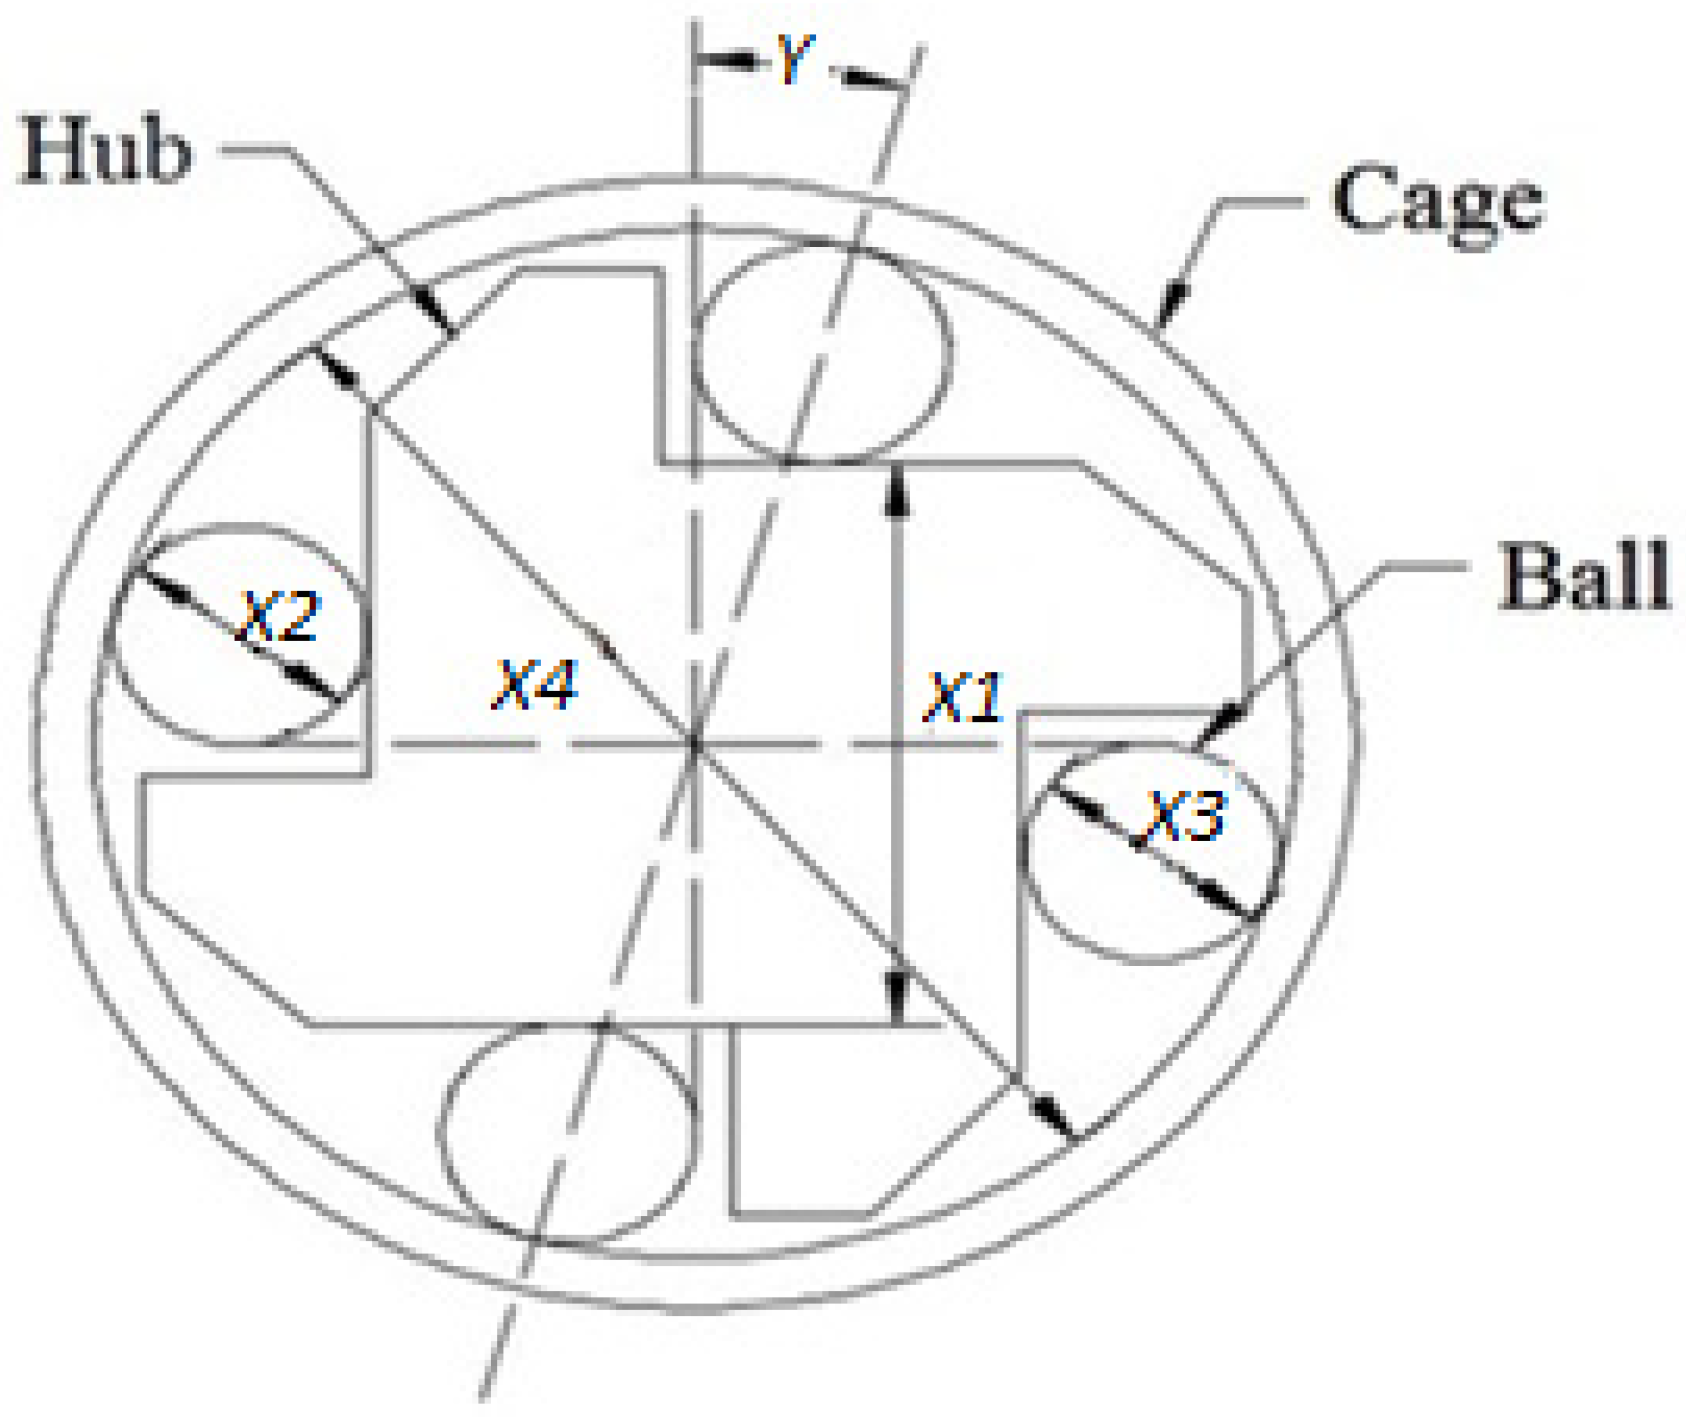
Overrunning clutch assembly (OCA), dealt with by Ganesan et al. (2001) [23], shown in Figure 1, is considered an example product to show the efficiency of the proposed method. It consists of a hub, four rollers, and a cage. The nominal dimensions and their allocated tolerance; the minimum, maximum process tolerances; and the tolerance cost function constants of alternative processes of each component are listed in Table 1. The critical dimension Y is determined using Equation (1), and the accepted value of Y is assumed to be 7.0124 ± 2°. Equation (2) represents the reciprocal tolerance cost function to calculate the component’s tolerance cost. The cost function constants are taken from Ganesan et al. (2001) [23]. The cost of assembly based on allocated and maximum process tolerances is computed using Equations (3) and (4), respectively, and listed in Table 2.
where
| X1 | —Dimension of the hub in mm |
| X2 and X3 | —Dimension of the rollers in mm |
| X4 | —Dimension of the cage in mm |
| Y | —Critical dimension in degrees |
| Ai | —Fixed cost of the ith component in $ |
| Bi | —Cost function constants of the ith component |
| ti | —ith component’s tolerance in mm |
| Ci | —Cost of the ith component in $ |
| tai, tmi | —ith component’s allocated and maximum tolerance in mm |
| Ca, Cm | —Cost of assembly in $ based on tai and tmin |
| nc | —Number of components |
| i | —Component number index |
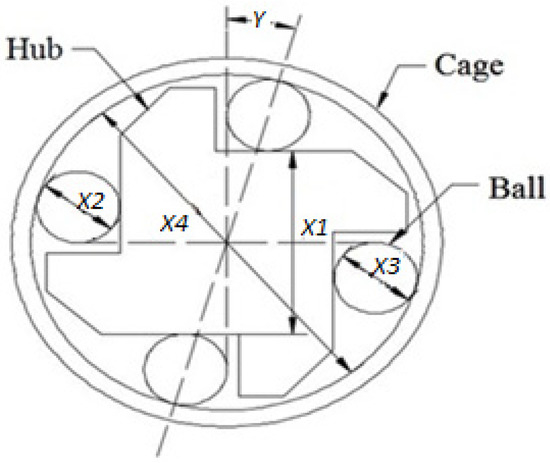
Figure 1.
Overrunning clutch assembly.

Table 1.
Manufacturing details of overrunning clutch assembly.
Table 2.
Manufacturing cost of overrunning clutch assembly for tai, tmin, and tmax.
5.1. Stage I
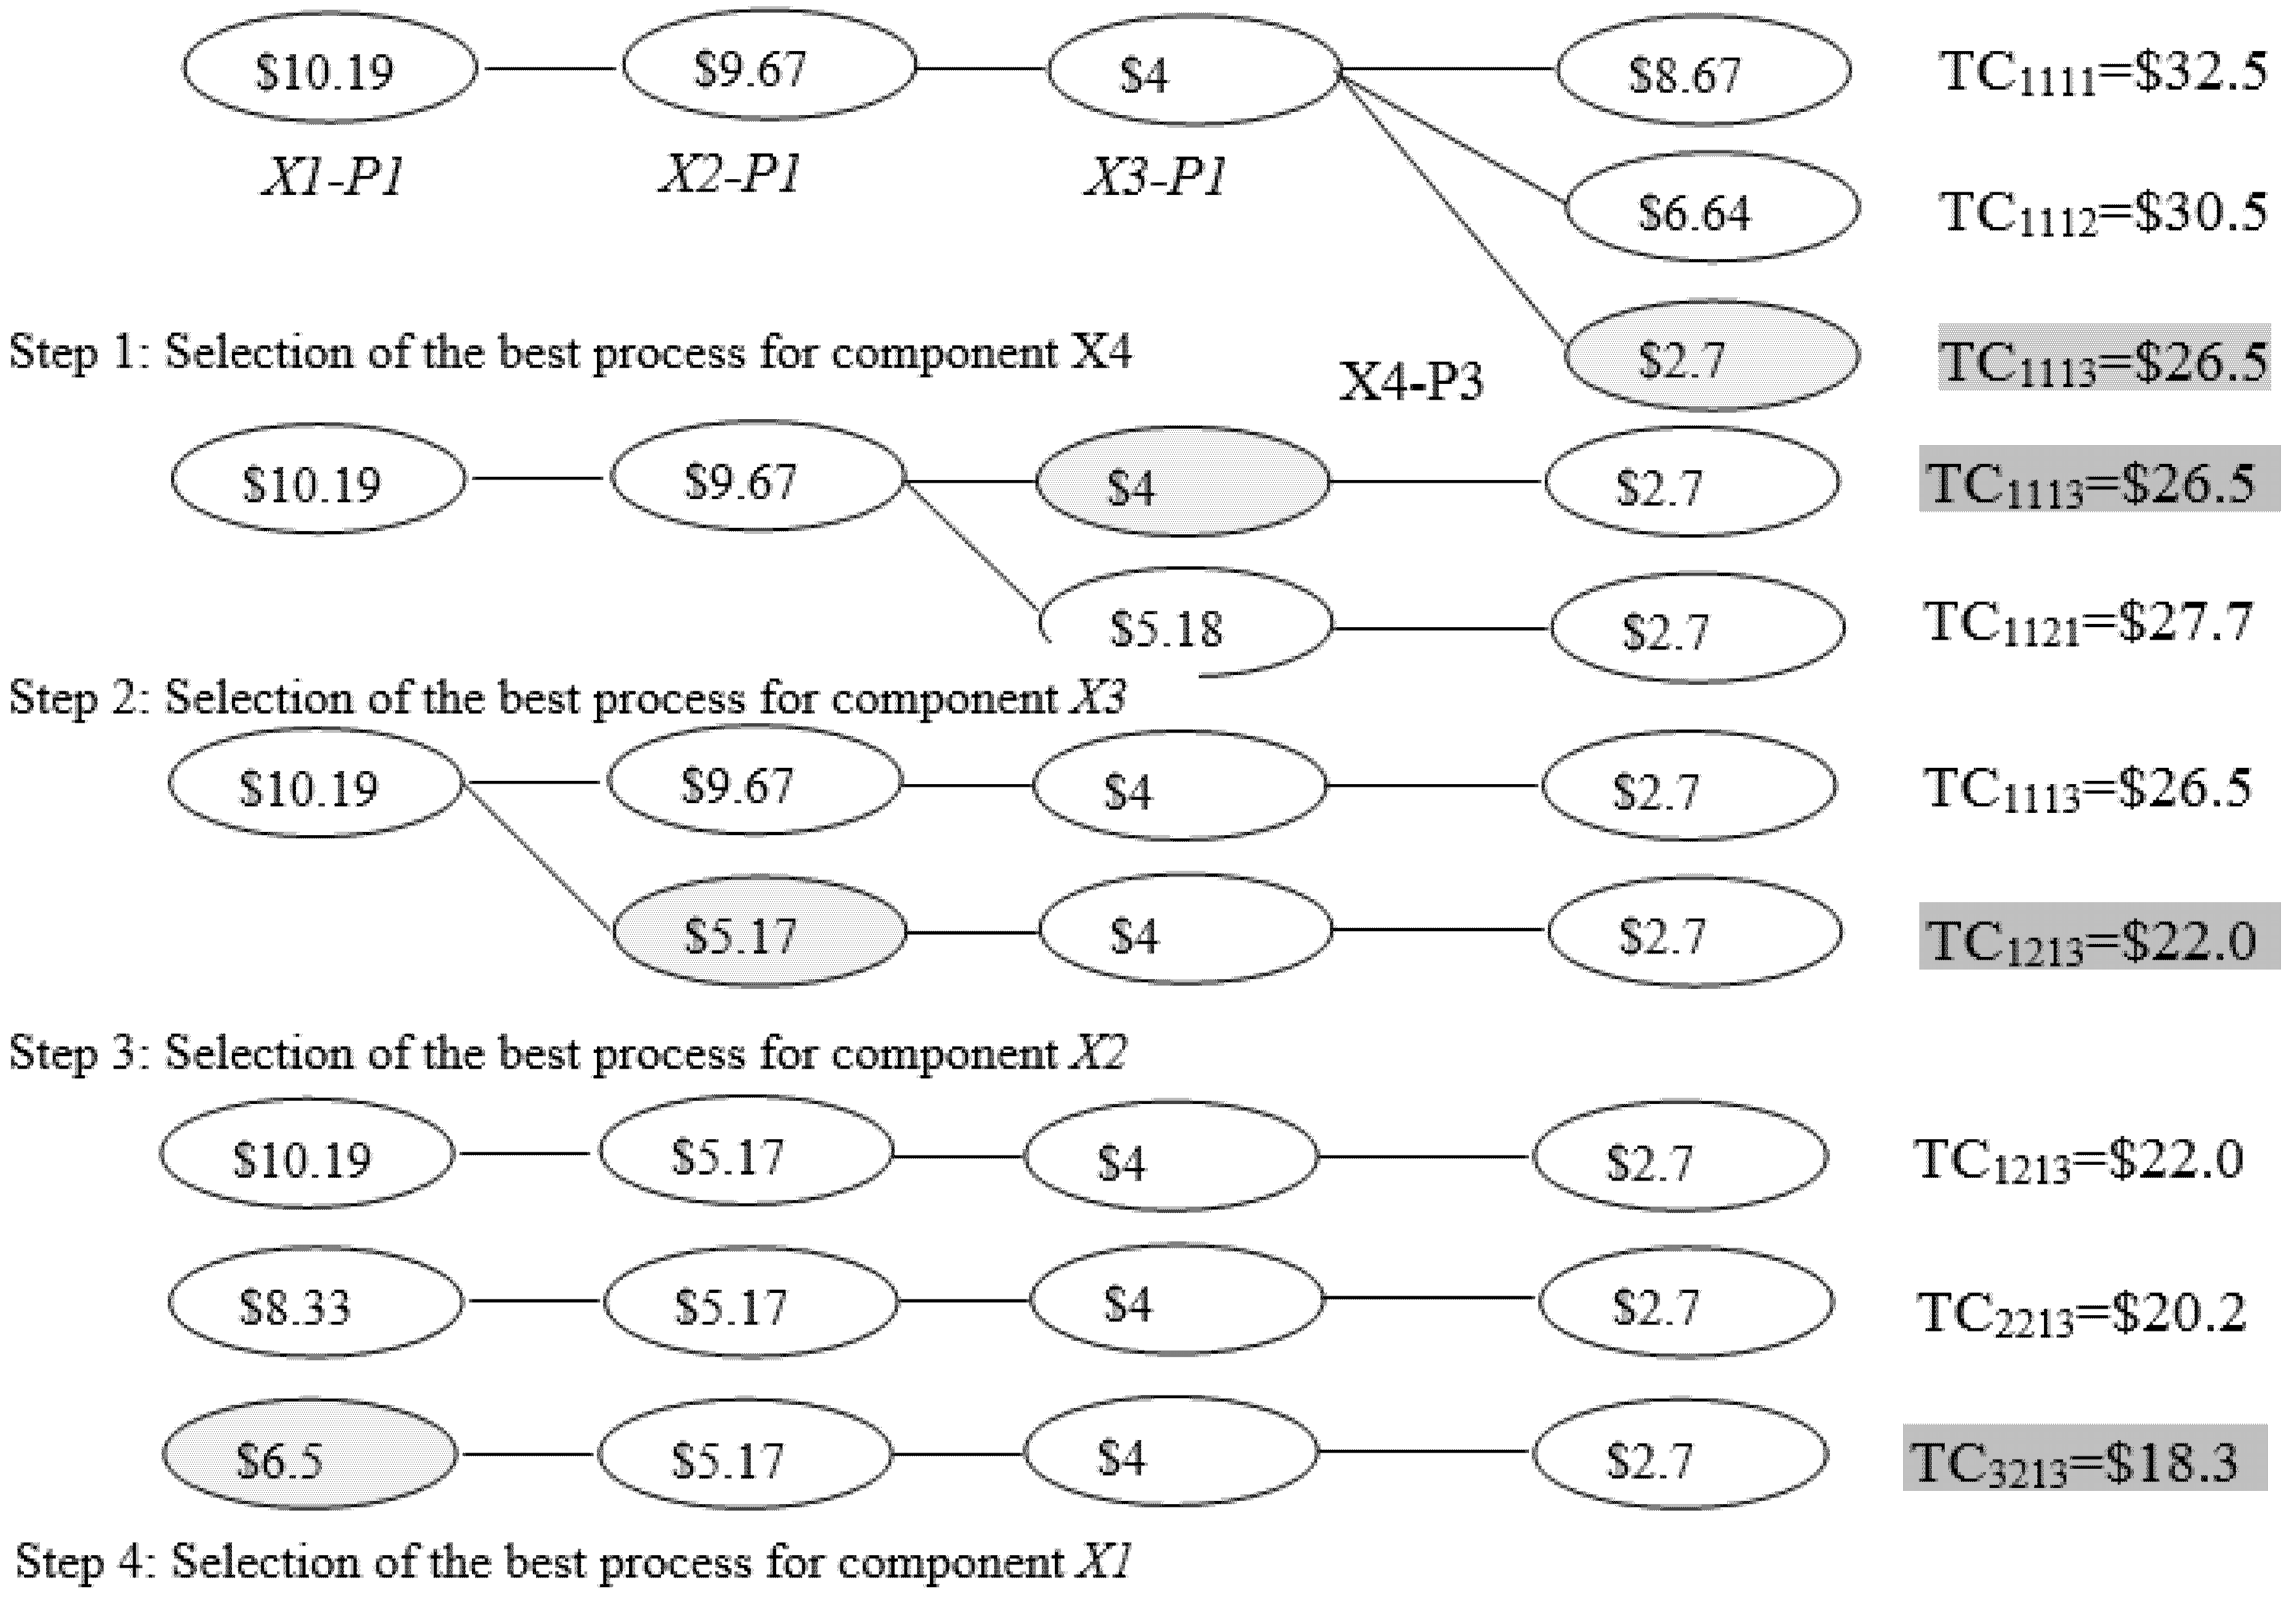
The selection of the best process for each component from the given alternative processes using the univariate search method is illustrated in Figure 2. It is understood from Figure 2 that the minimum manufacturing cost of $18.37 can be achieved through making the components X1, X2, X3, and X4 using process combinations (3213) P3, P2, P1, and P3, respectively, which is nearly 24.98% less compared with the $24.49 reported in the existing method dealt by Ganesan et al. (2001). It is also understood that the process combinations of 2213 and 1213 for components X1, X2, X3, and X4, respectively, can yield 17.52% and 9.92% savings in manufacturing cost. However, in a real situation, the savings may vary slightly because of surplus parts present in the selective assembly method.
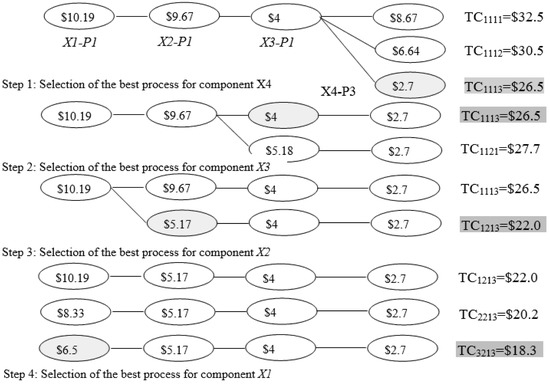
Figure 2.
Univariate search method to select the best process for each component. X1-P1 indicates that X1 component is produced by the P1 process; TC1113 = $26.56 indicates that components X1, X2, X3, and X4 are manufactured using processes P1, P1, P1, and P3, respectively, and the total cost to manufacture the same will be $26.56.
5.2. Stage II
As discussed in Section 4, 1000 random values have been generated for each component according to the mean (µi) and standard deviation (σi) presented in Table 3. The dimensional distribution of 1000 components of X1, X2, X3, and X4 was generated using the normrnd (C.No.) function in MATLAB.
Table 3.
Mean and standard deviation of components for different process combinations.
5.3. Stage III—Implementation of HSA
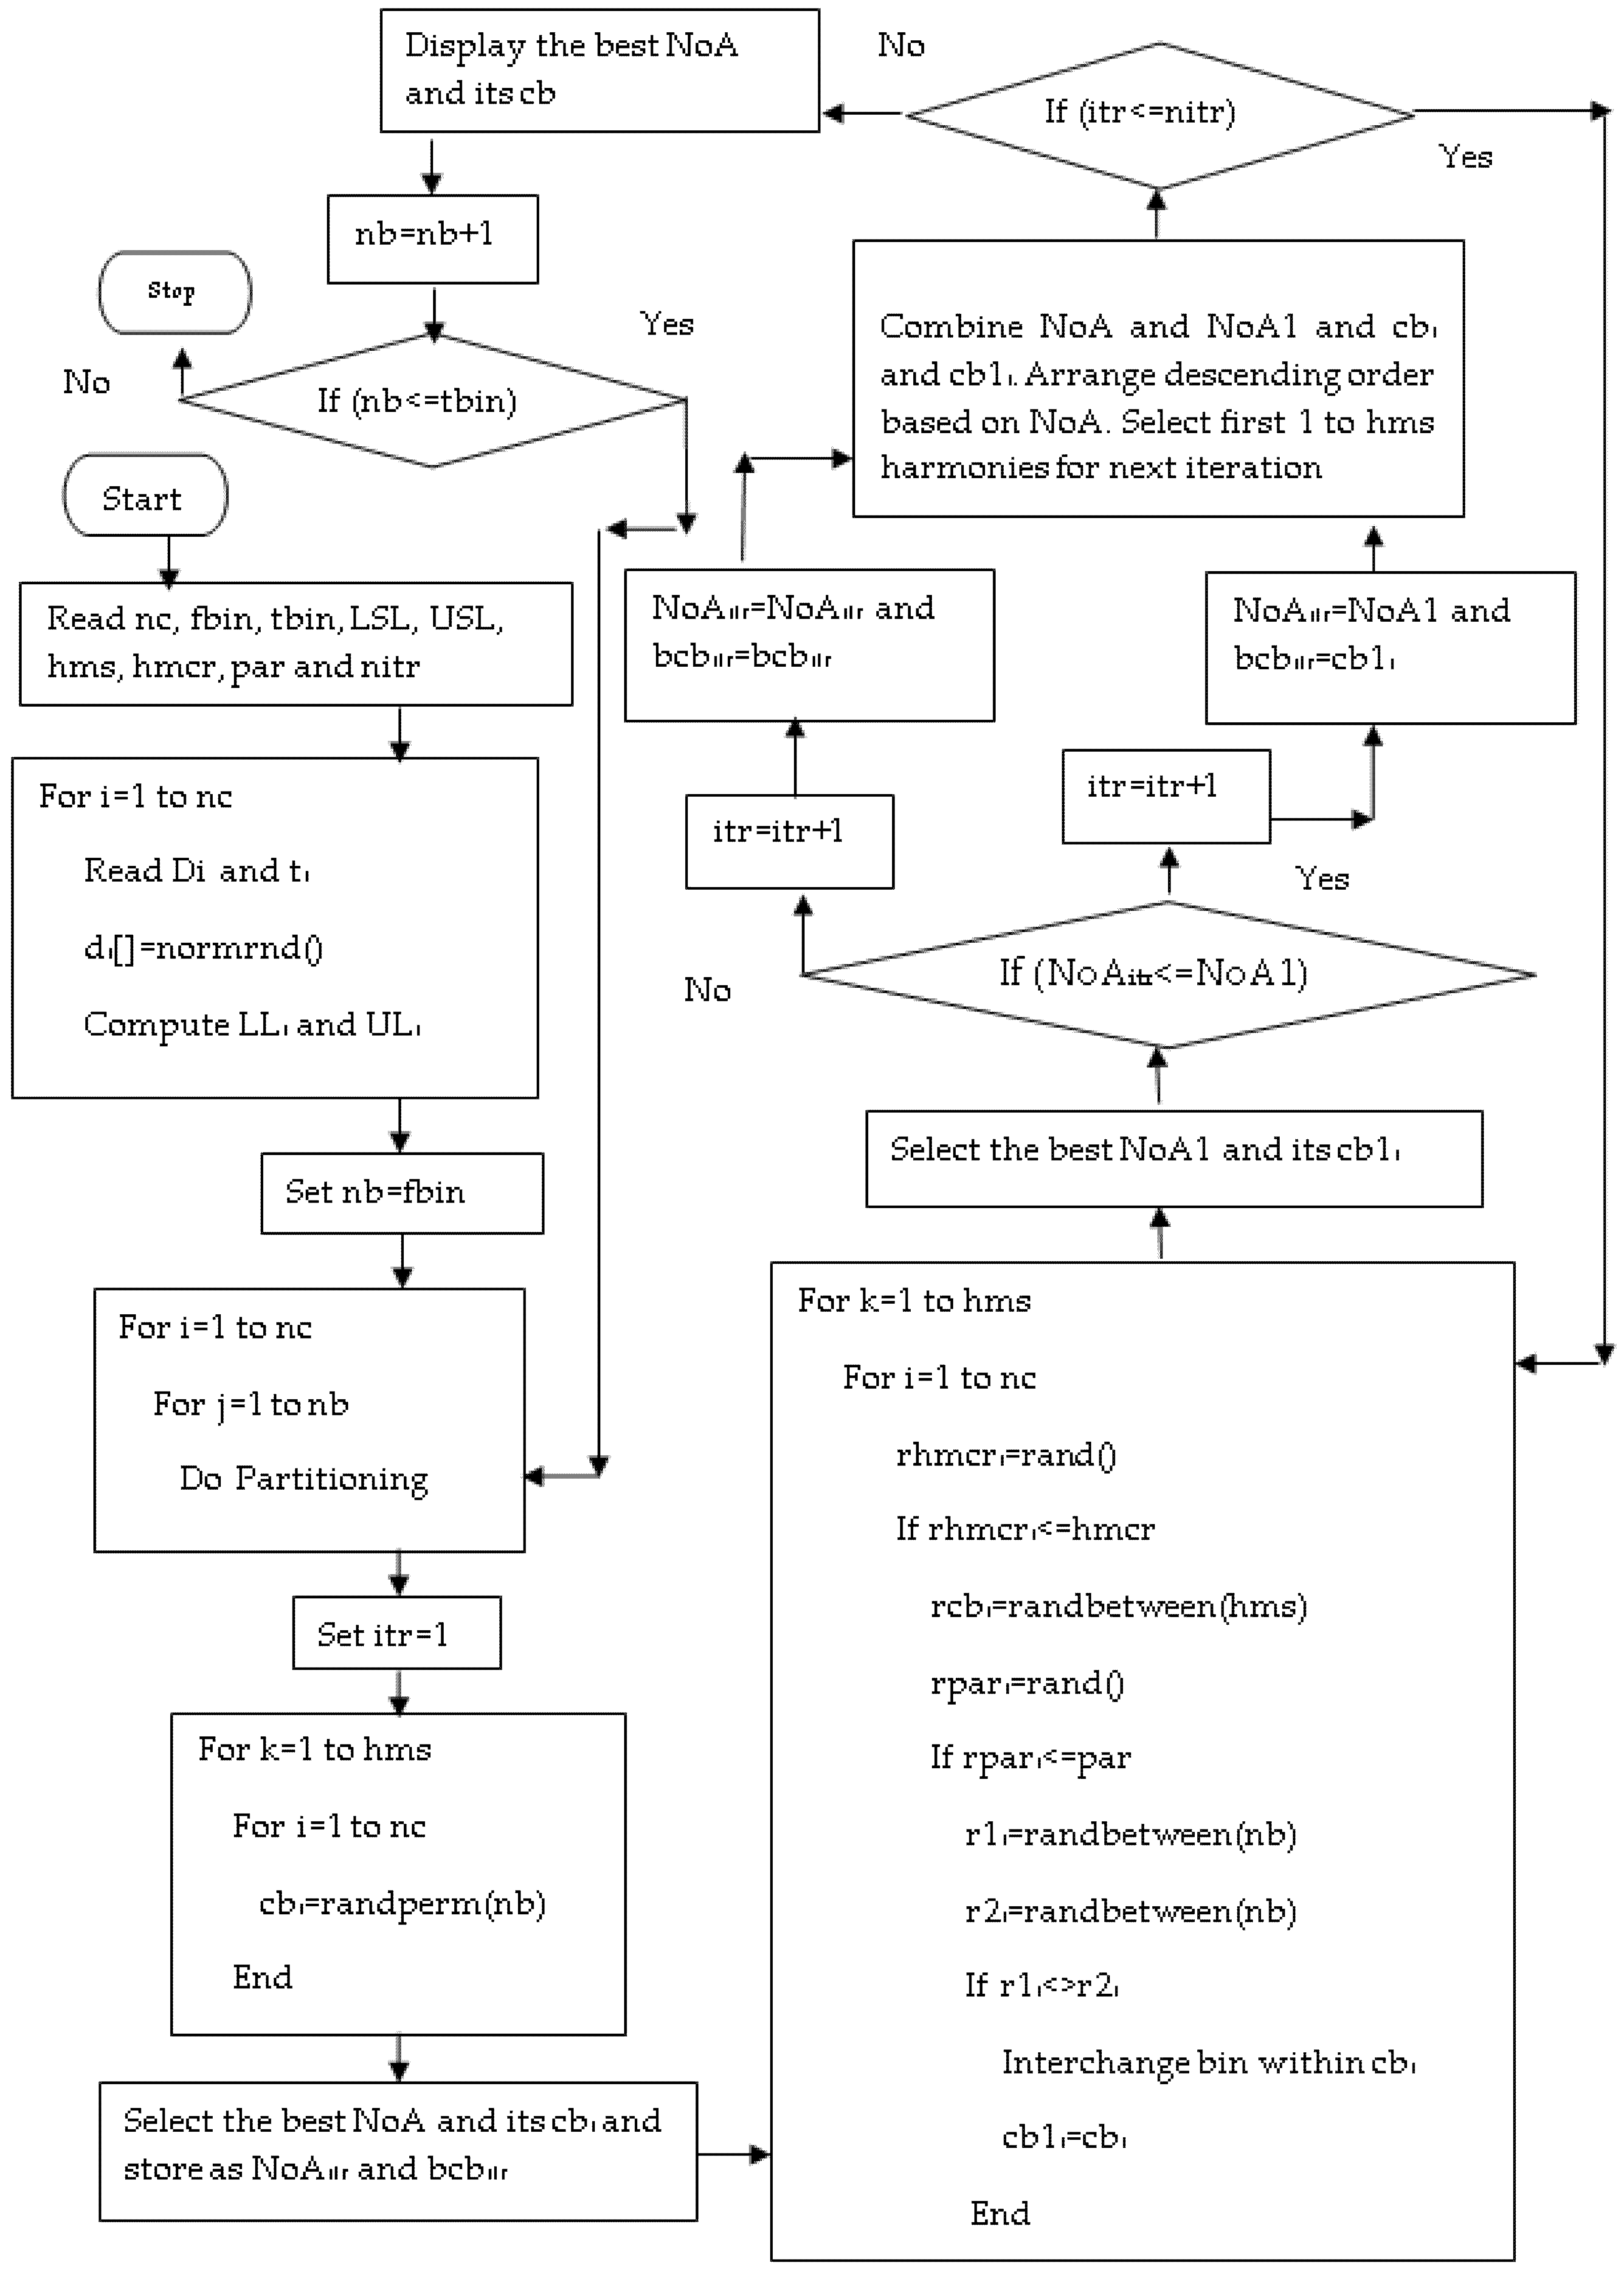
The harmony search algorithm (HSA) is a meta-heuristic algorithm, and it works based on the identification of good harmony by musicians through a continuous improvisation process. The HSA has the following advantages: (i) quick convergence, (ii) easy to adapt, and (iii) the least computational time. Further, from the literature survey, it is observed that the HSA has outperformed in solving complex optimization problems. Hence, the HSA has been used in this work. Table 4 presents the different terms used in the HSA, its equivalent term in both optimization problems and the present work formulation, and its range of values and examples. The schematic diagram shown in Figure 3 illustrates the implementation of the HSA to obtain the best bin combinations. The technical terms and their meanings used in Figure 3 are presented in Table 5. For demonstration purposes, the components are partitioned into five bins. The step-by-step procedure is given below.
Table 4.
Representation of variables in HSA.
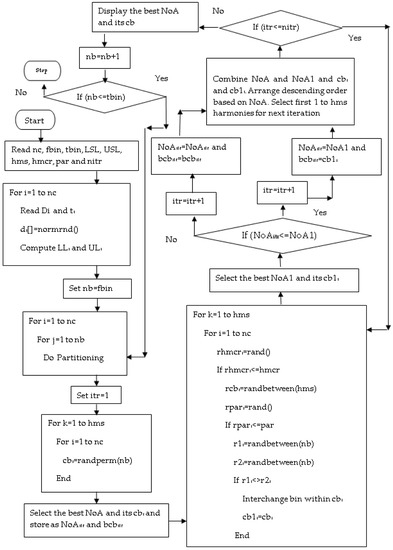
Figure 3.
Implementation of HSA.
Table 5.
Technical terms and their meanings.
- Step 1:
- A random combination of bins for each component for the size of harmony memory 10 is generated (listed in Table 6).
Table 6. Initial harmony memory.
- Step 2:
- The corresponding bin’s components are randomly matched with other components for each harmony number, and the assembly is produced. If the assembly meets the given specification limit, it is accepted as an assembly; otherwise, it is treated as a surplus part. This will be carried out until the component exists in each bin. The accepted assemblies are counted and listed in Table 6 as NoA.
- Step 3:
- Table 7 represents the arrangements of harmony, from maximum NoA to minimum NoA. Table 8 illustrates the best bin combination that will produce maximum NoA in the first iteration.
Table 7. Harmonies after sorting based on NoA.
Table 8. Best combination of bins for the first iteration.
- Step 4:
- A random number less than 1 is generated for each component of each harmony number (presented in Table 9 as RHMCR).
Table 9. RHMCR and rcb values.
- Step 5:
- If this number is less than or equal to HMCR, then a random number between 1 and HMS (rcb) is generated, and others are assumed to be zero. This is presented in Table 9.
- Step 6:
- The cbX1, cbX2, cbX3, and cbX4 values corresponding to rcbX1, rcbX2, rcbX, and rcbX4 are taken from Table 6 and listed in Table 10. If the value of rcb is zero, then the corresponding harmony’s cbx value is considered.
Table 10. Harmony after HMCR.
- Step 7:
- A random number (RPAR) less than 1 is generated for each value of RHMCR, which is not equal to zero and is less than the HMCR value (listed in Table 11).
Table 11. RPAR, r1, and r2 values.
- Step 8:
- Two random numbers, r1 and r2, within bin numbers, are generated for each value of RPAR, which is not equal to zero (presented in Table 11).
- Step 9:
- New harmony, i.e., cbX1, cbX2, cbX3, and cbX4, is obtained wherever the bin is located within their bin combinations, according to r1 and r2 (presented in Table 12).
Table 12. Harmony after HMCR and PAR.
- Step 10:
- Then, NoAs are obtained by mating the components randomly corresponding to the bin combinations given in cbX1, cbX2, cbX3, and cbX4 (listed in Table 12).
- Step 11:
-
Table 13. Selection of harmonies for next iteration.
Table 14. Selected harmonies for next iteration.
- Step 12:
- The steps from 4 to 11 are repeated to the specified number of iterations.
- Step 13:
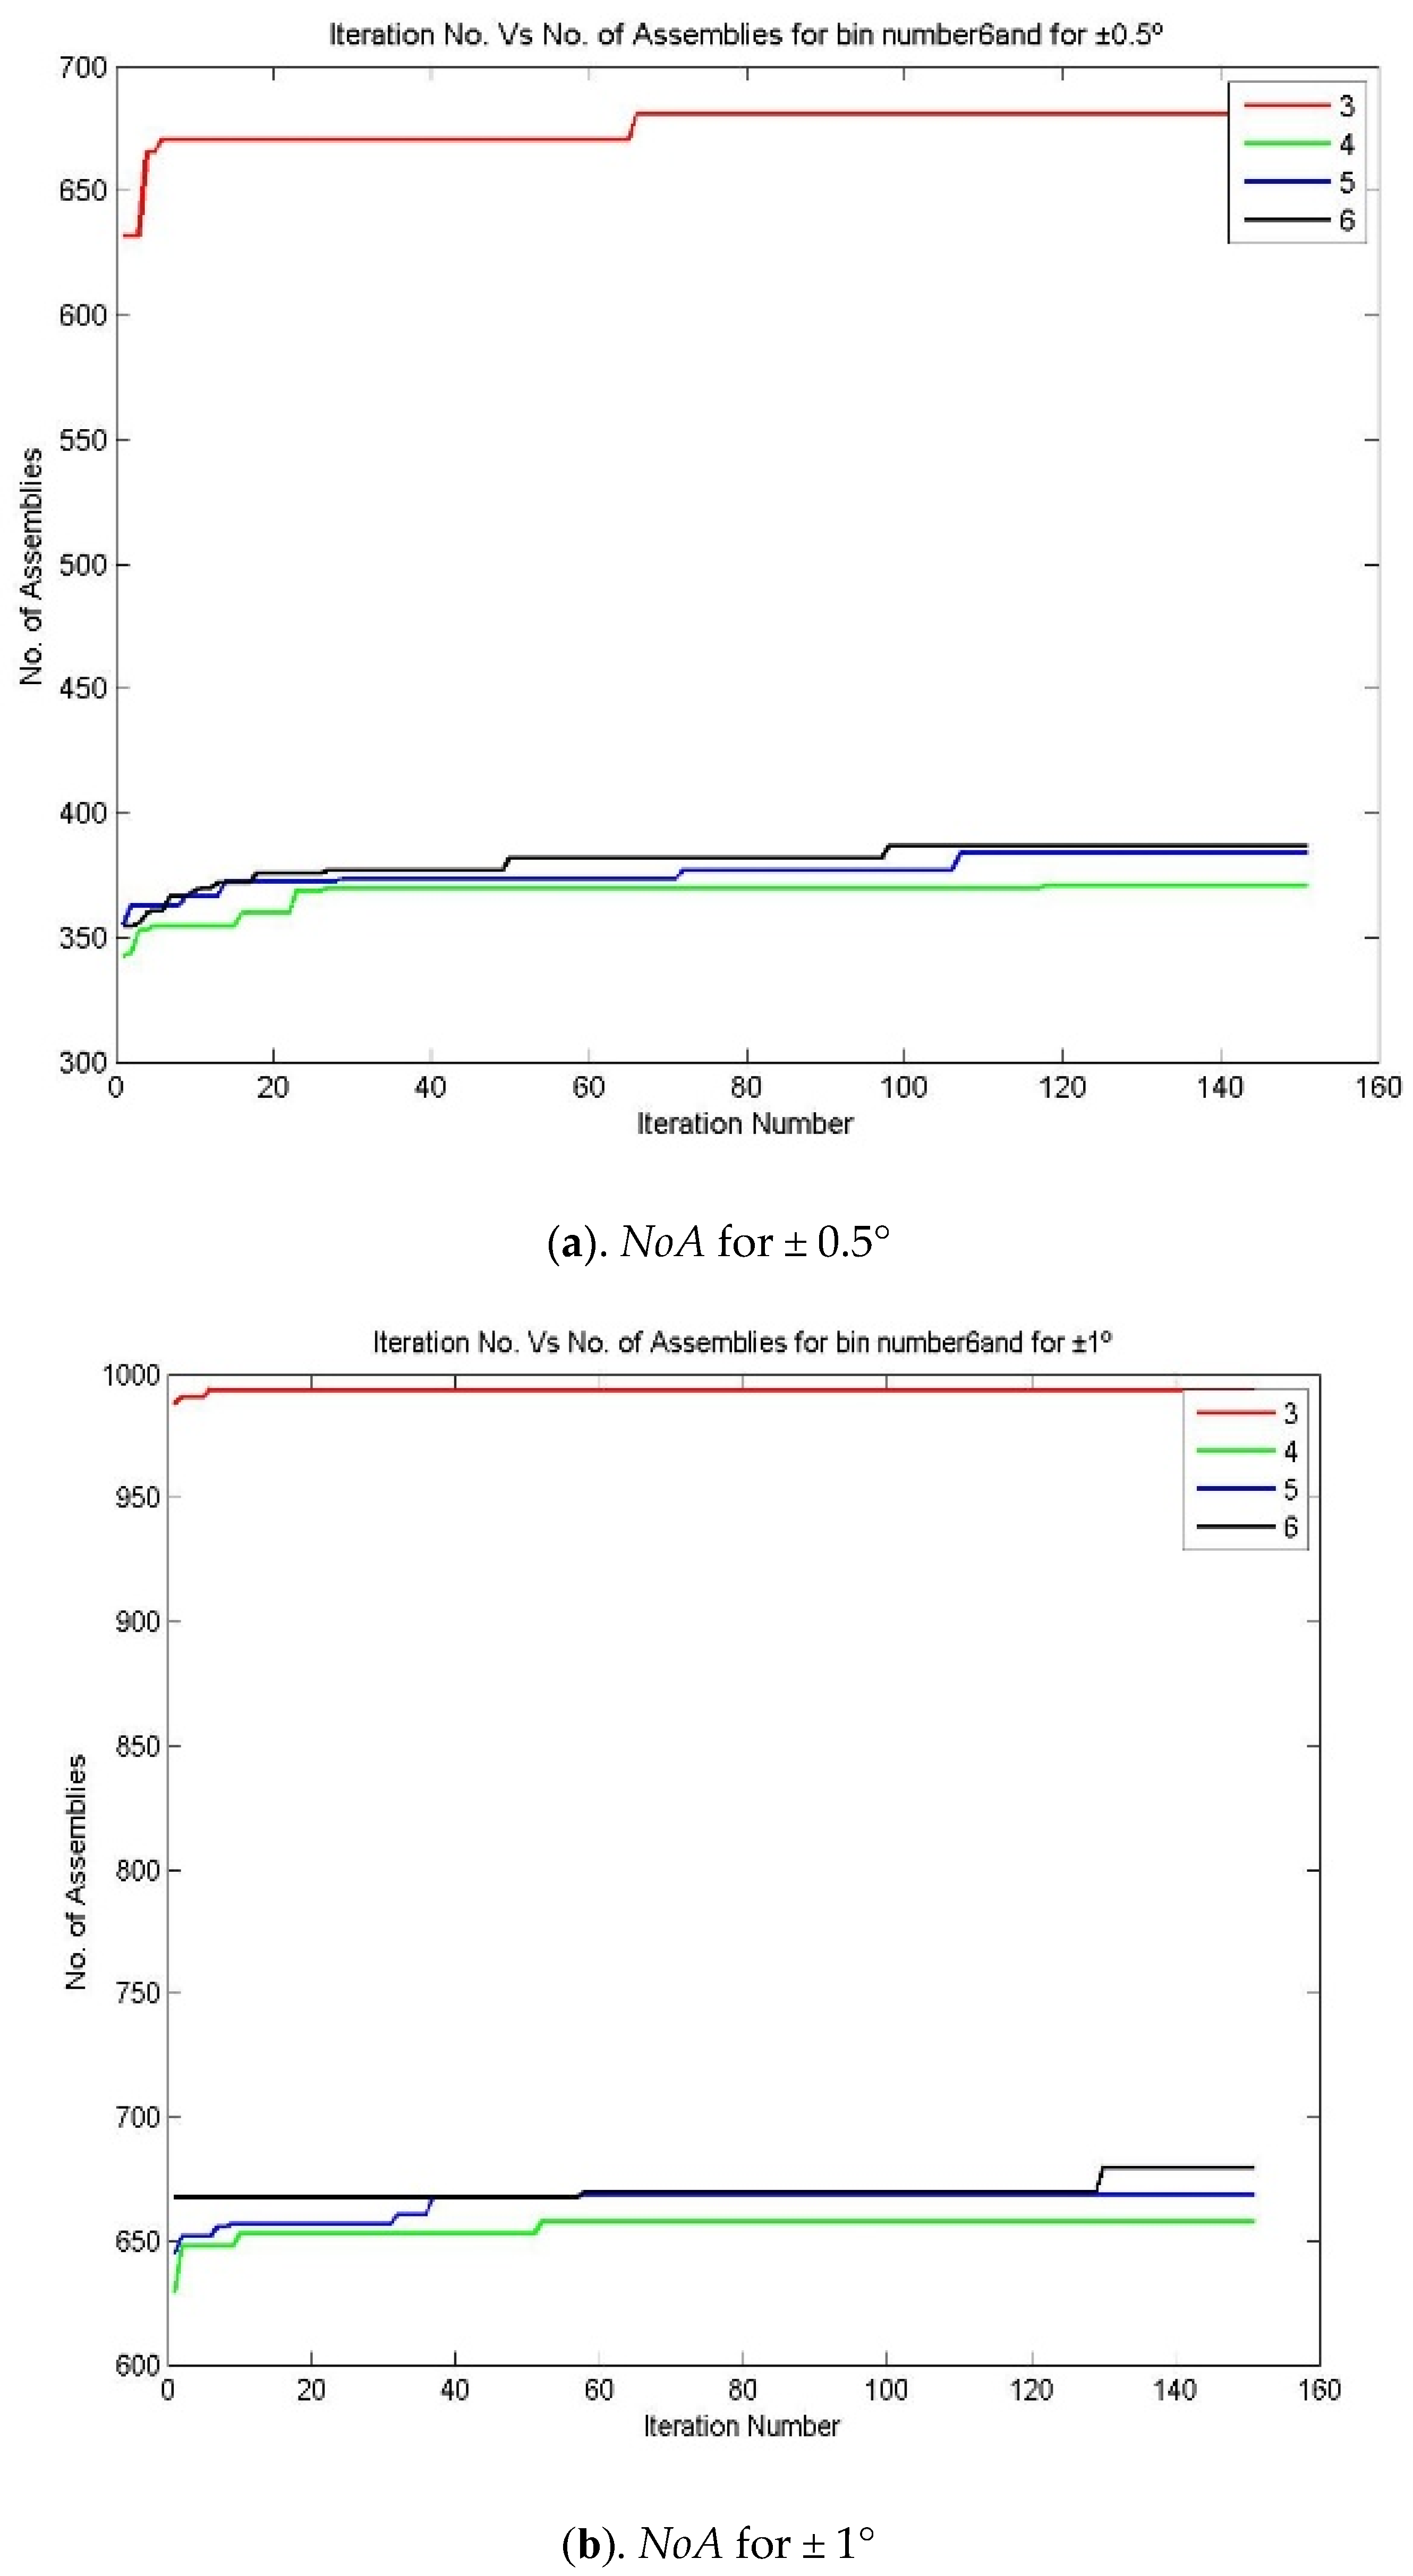
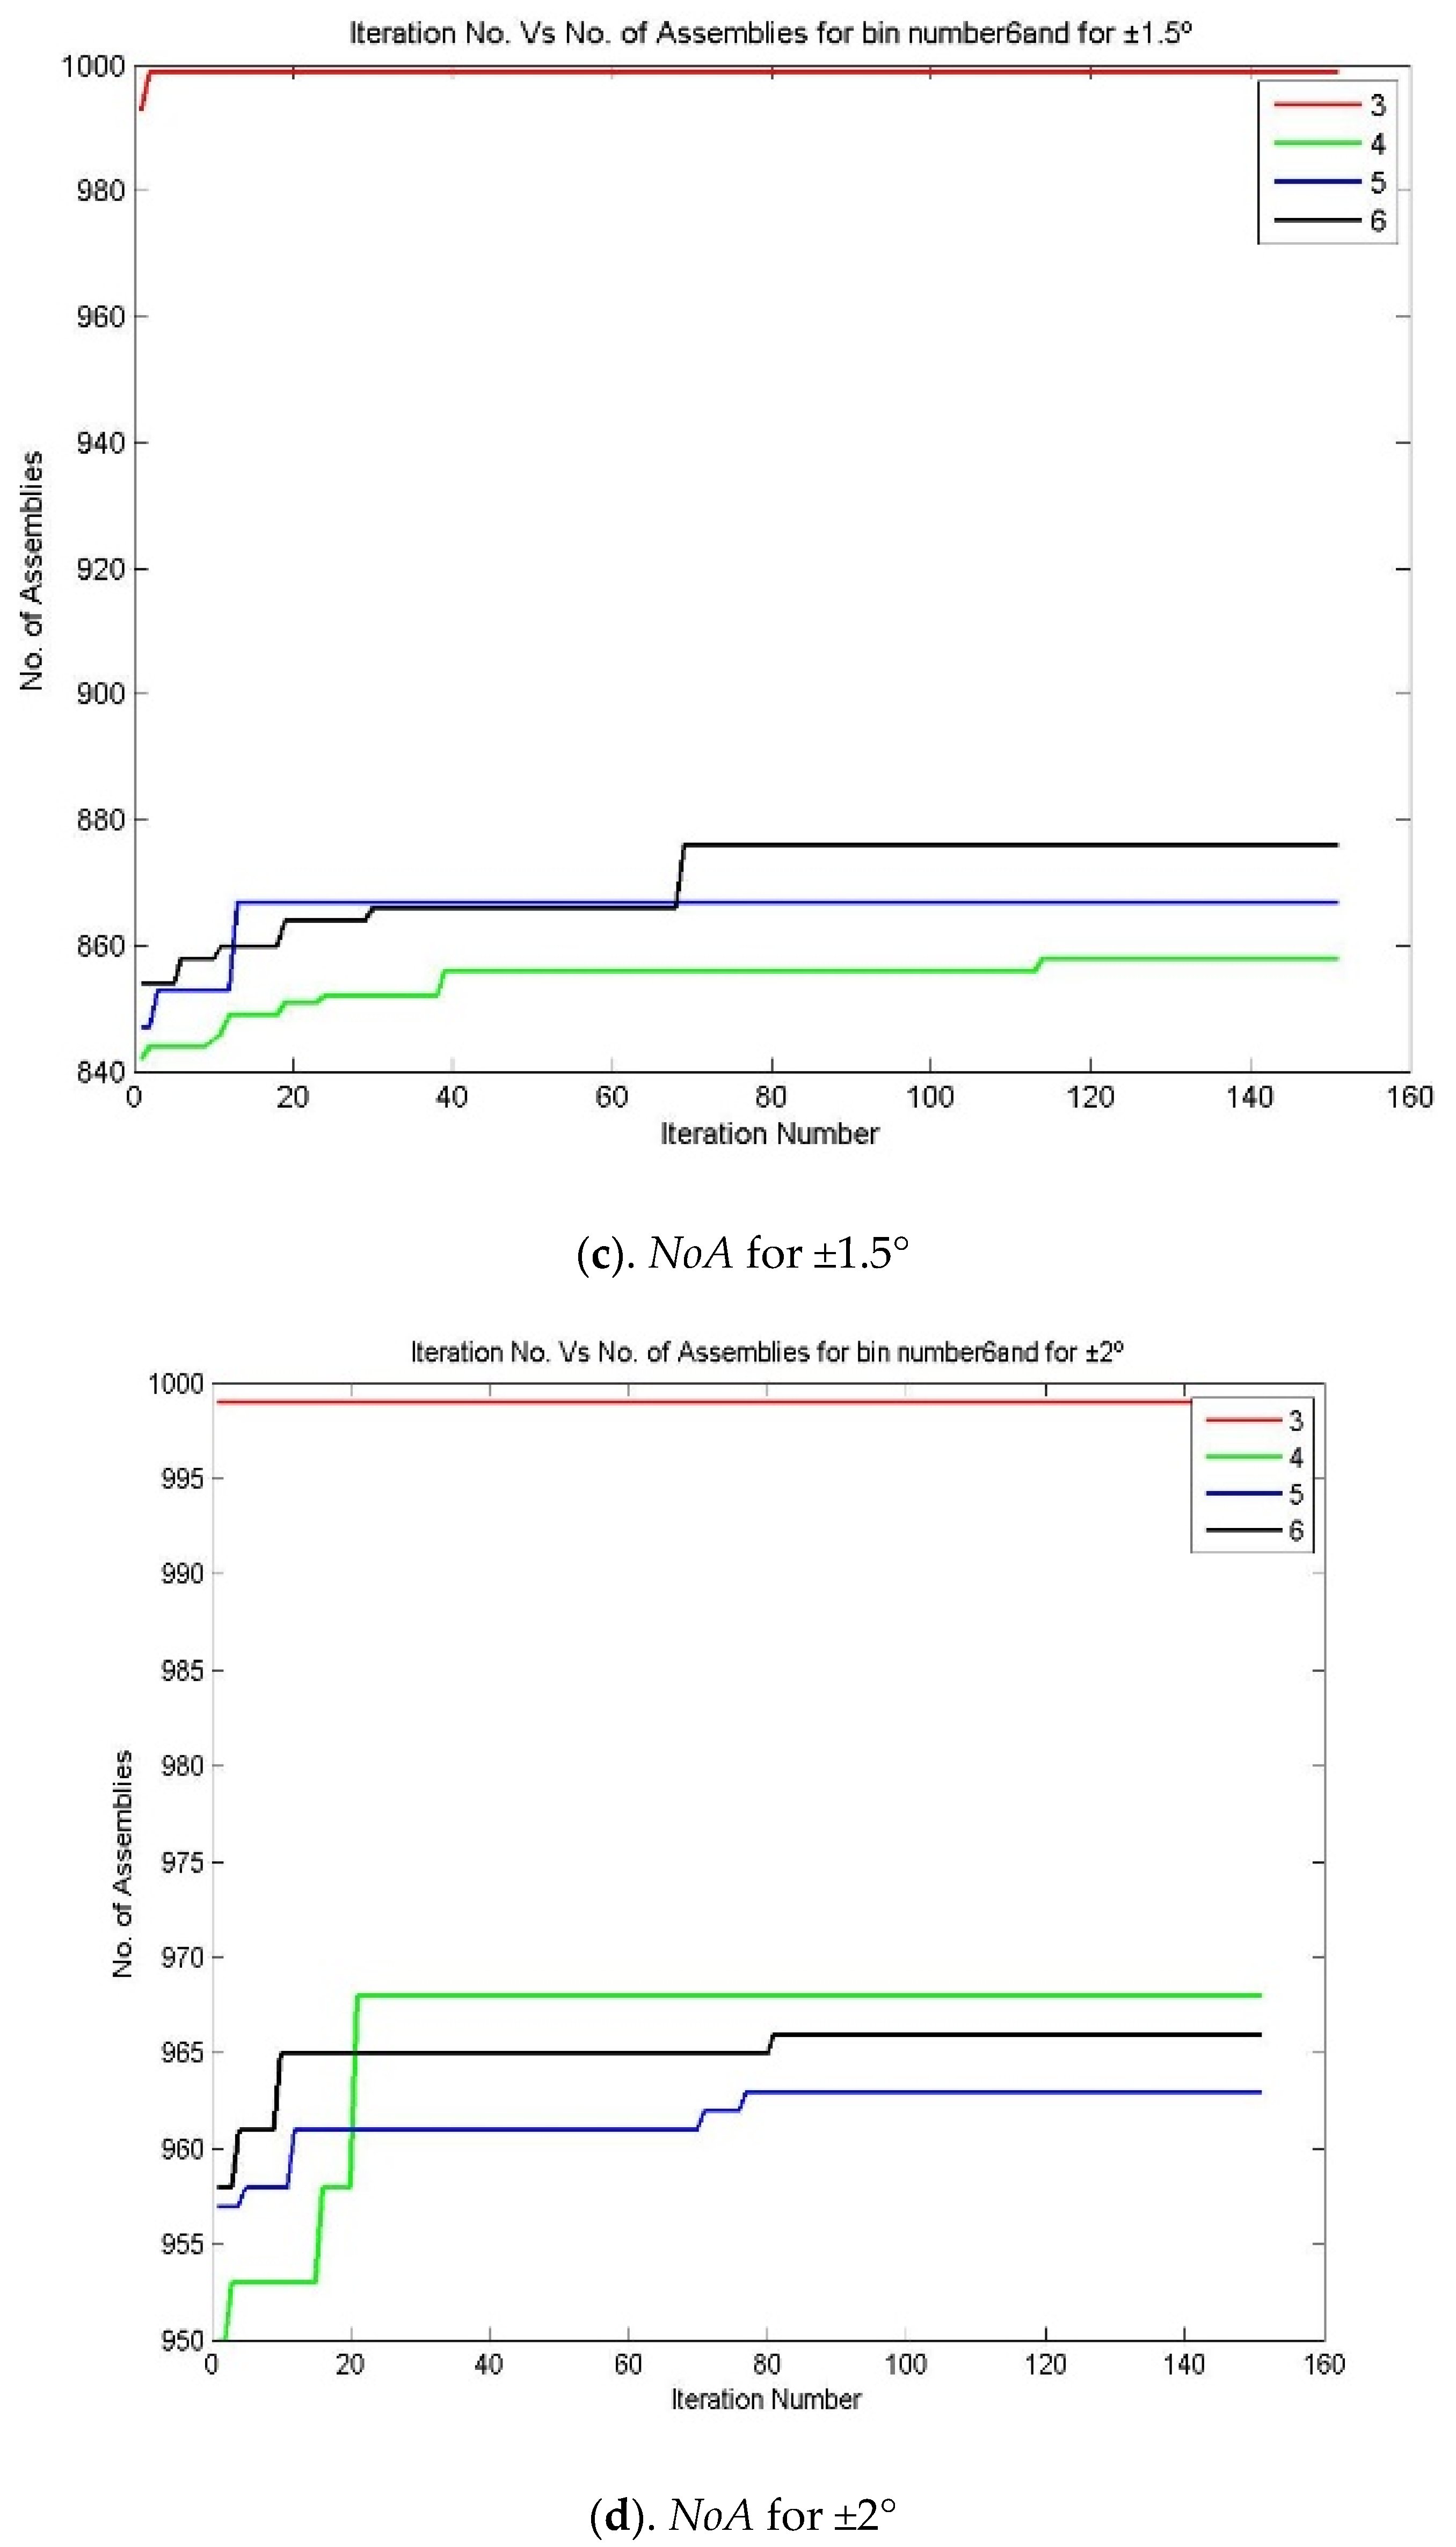
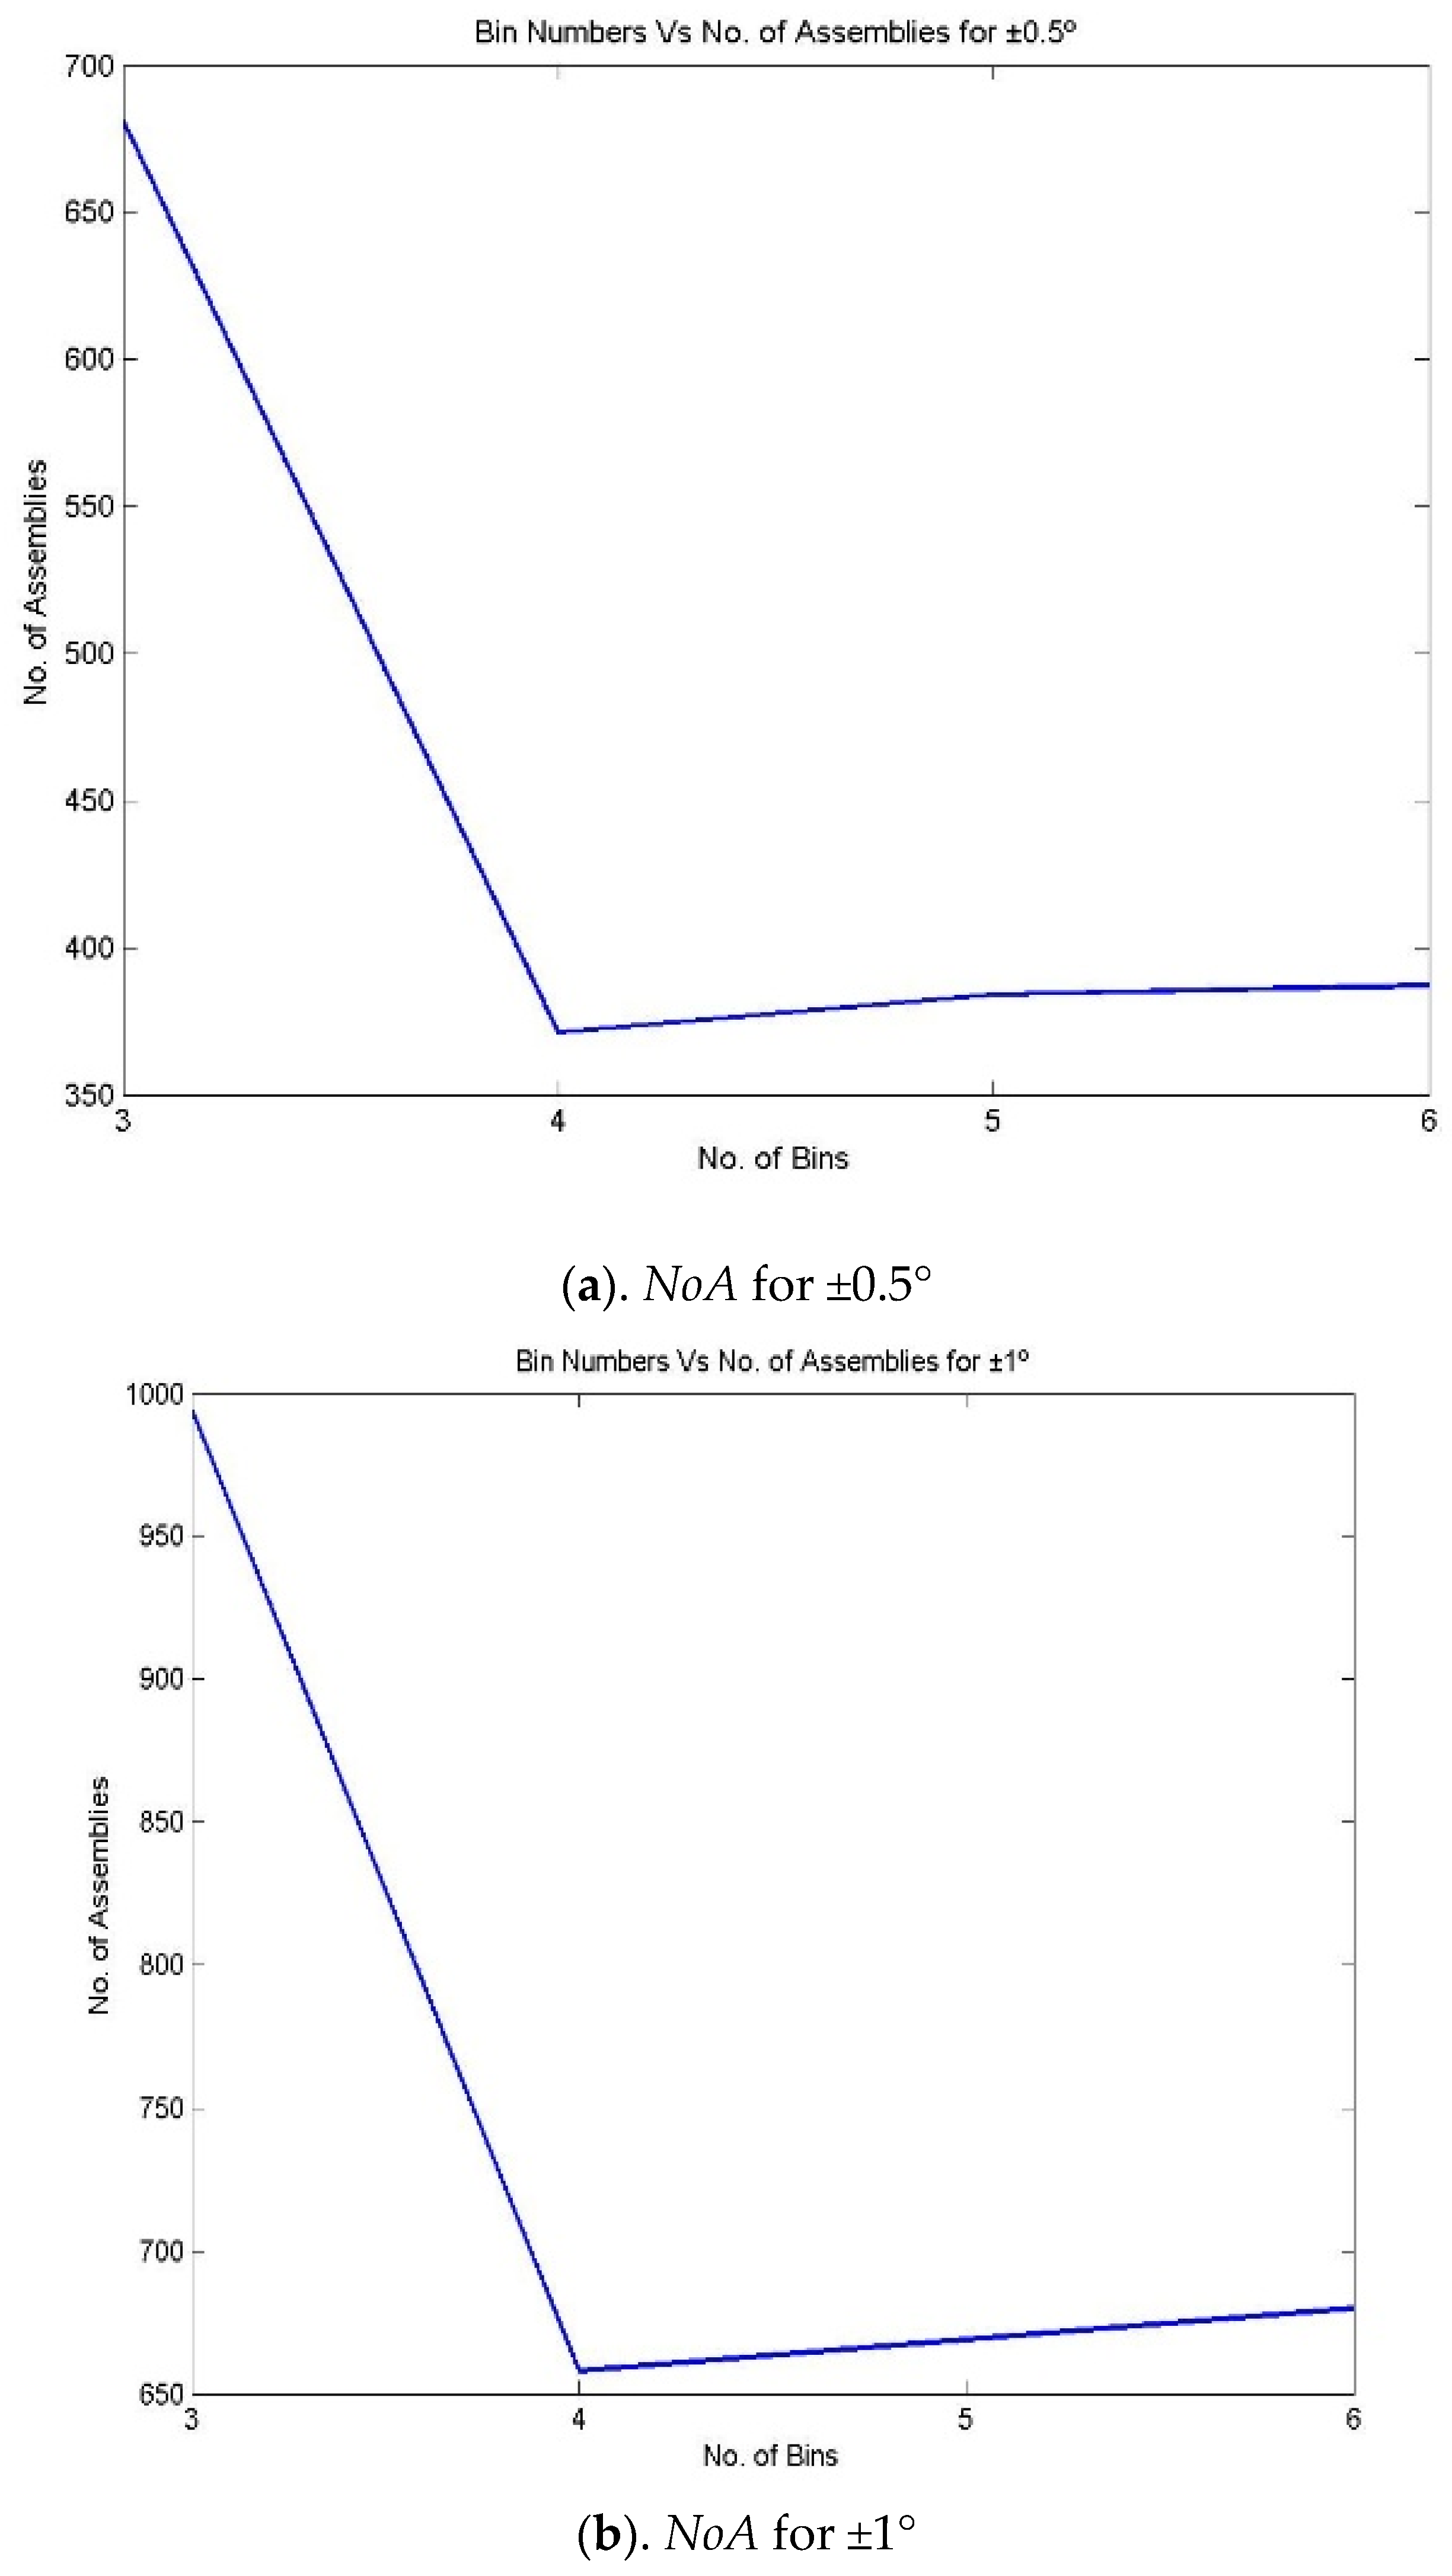
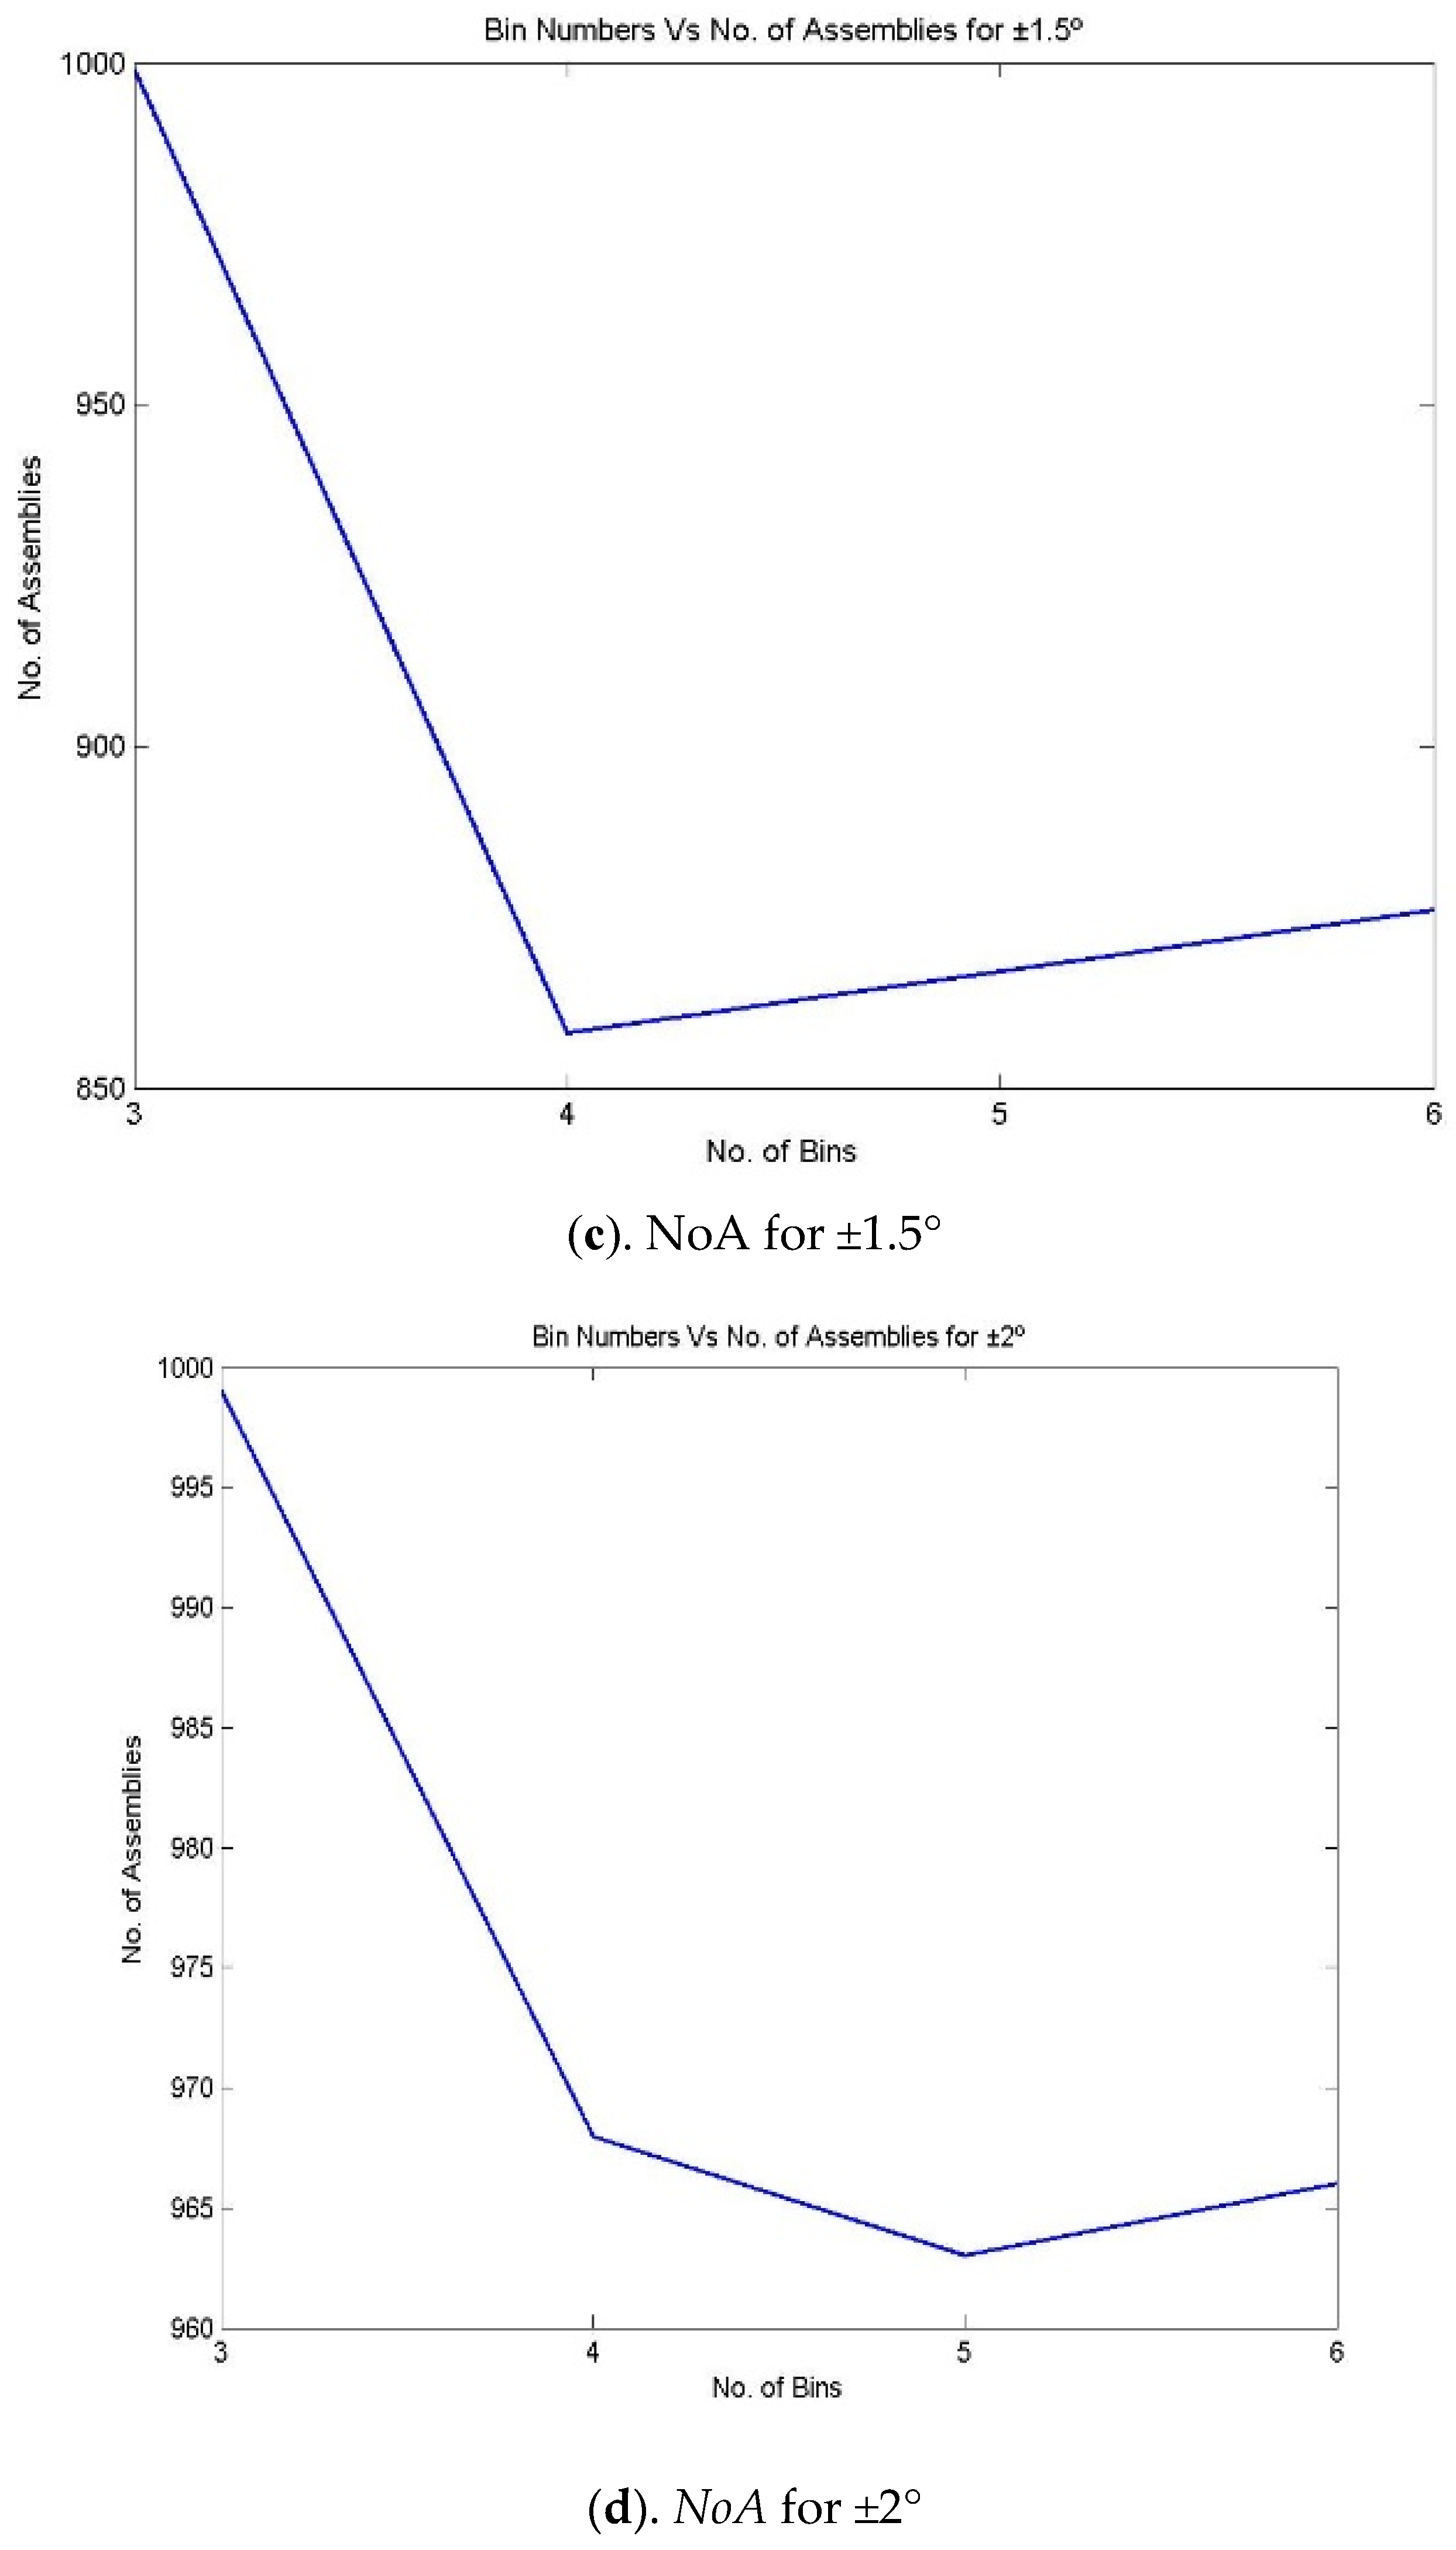
- The above steps, from 1 to 12, can be repeated for various bin numbers, starting from 3 to 9. Figure 4 and Figure 5 represent the iteration number vs. NoA and the number of bin vs. NoA for various bin numbers.
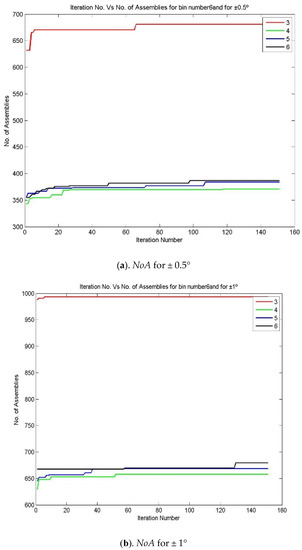
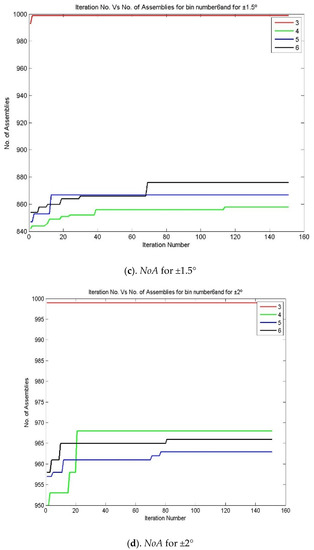 Figure 4. Iteration number vs. NoA for various bin numbers—the 3213 process combination (a) NoA for ±0.5°, (b) NoA for ±1°, (c). NoA for ±1.5° and (d) NoA for ±2°.
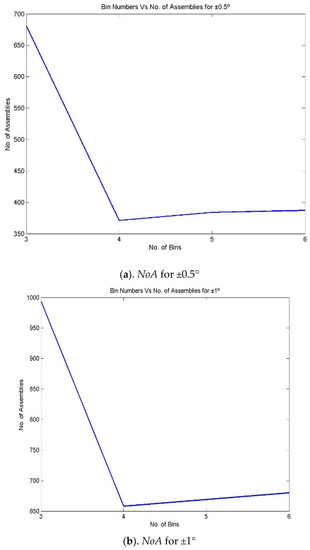
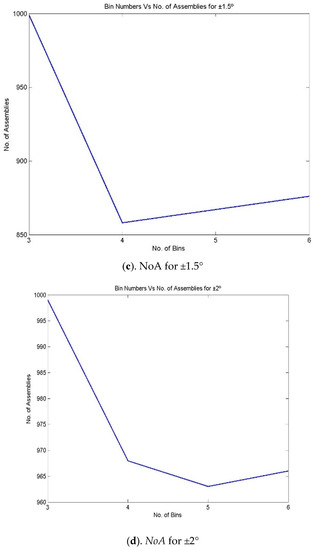 Figure 5. NoA for various bin numbers and assembly specifications for the 3213 process combination (a) NoA for ±0.5°, (b) NoA for ±1°, (c). NoA for ±1.5° and (d) NoA for ±2°.
 - Step 14:
- By changing the product specification, starting from ±0.25° to ±2°, the above steps from 1 to 13 can be repeated.
6. Results and Discussion
An attempt has been made to make assemblies by considering the number of bins/partitions, up to 9. Figure 6 reveals that in the equal area method for making non-linear assemblies, it is possible to make 996 assemblies out of 1000 components by partitioning them into 3 bins for the assembly specification of ±2°. It is also understood that while increasing the partition number, there may be a 5.8% (938 assemblies) drop in producing the number of assemblies for the same assembly specification. In the meantime, the number of assemblies is reduced for the same 1000 components of X1, X2, X3, and X4 while reducing the assembly specification for the same partition number (equal to 3). The assemblies are reduced from 996 to 392 for the assembly specification of ±2° to ±0.5°.
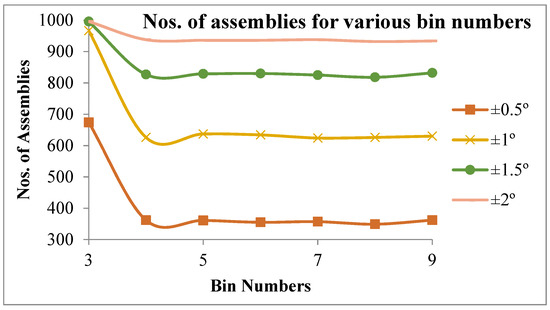
Figure 6.
NoA vs. bin number for various assembly specifications for the 3213 process combination.
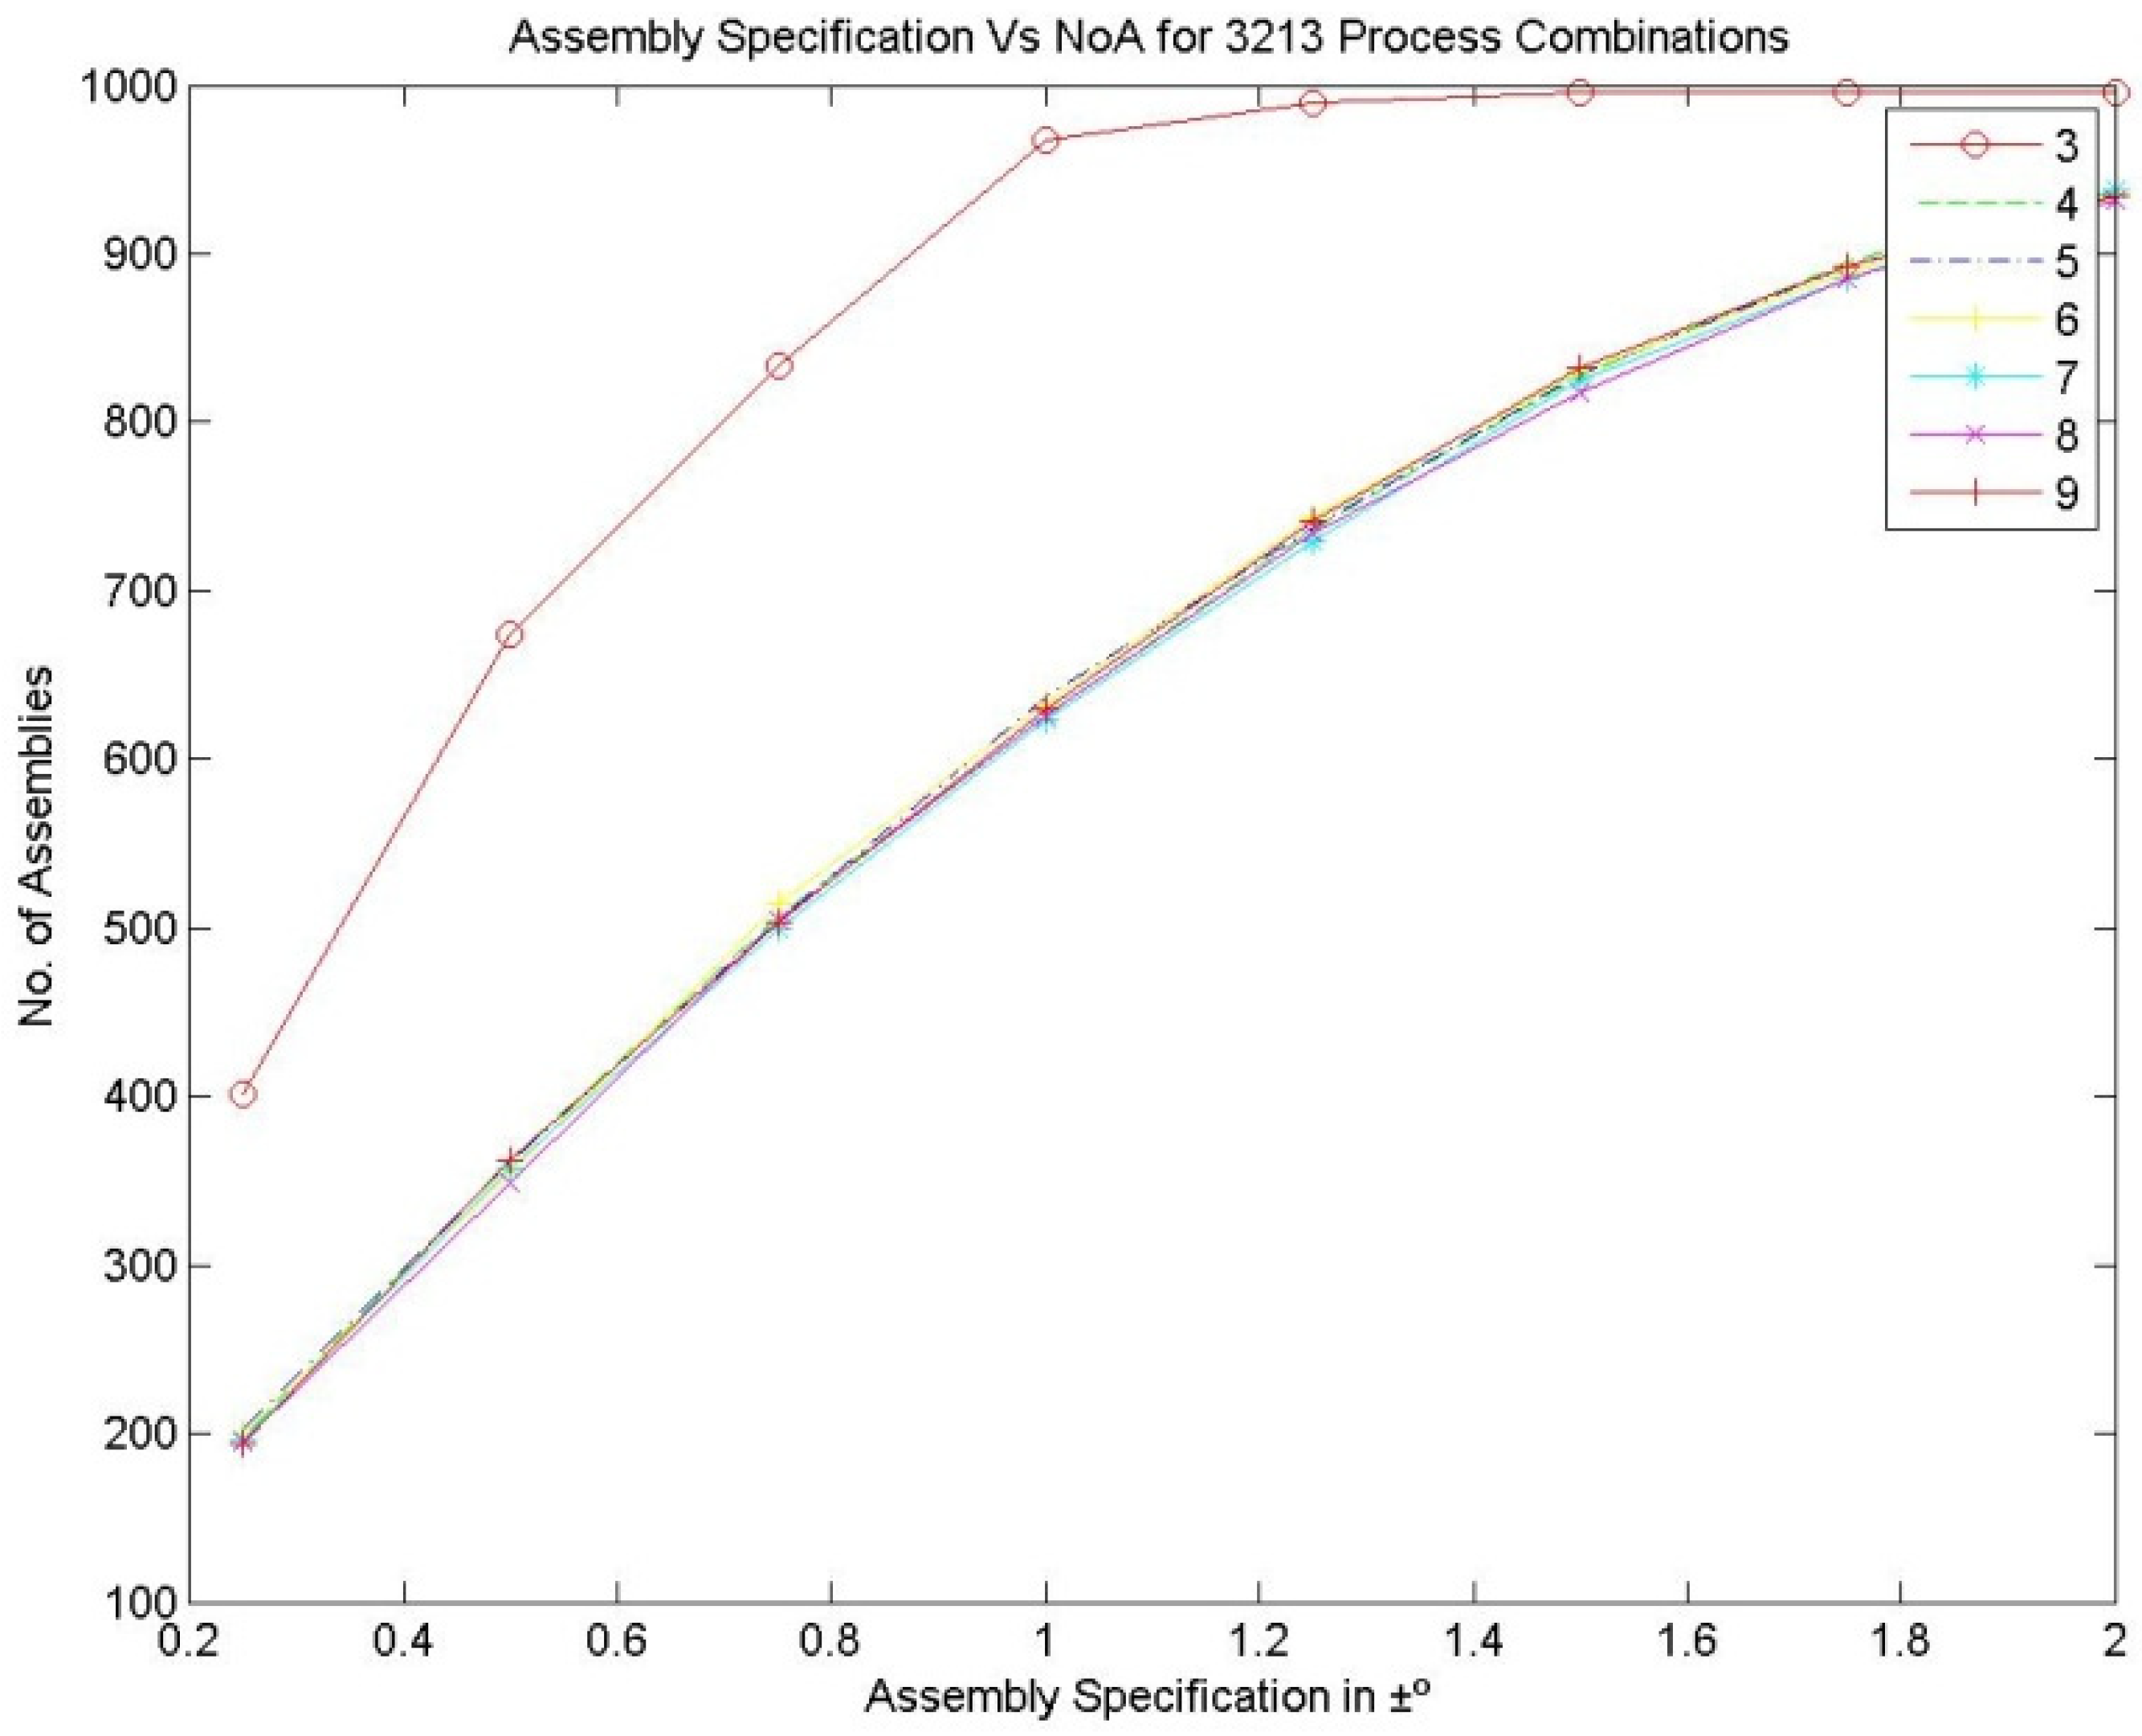
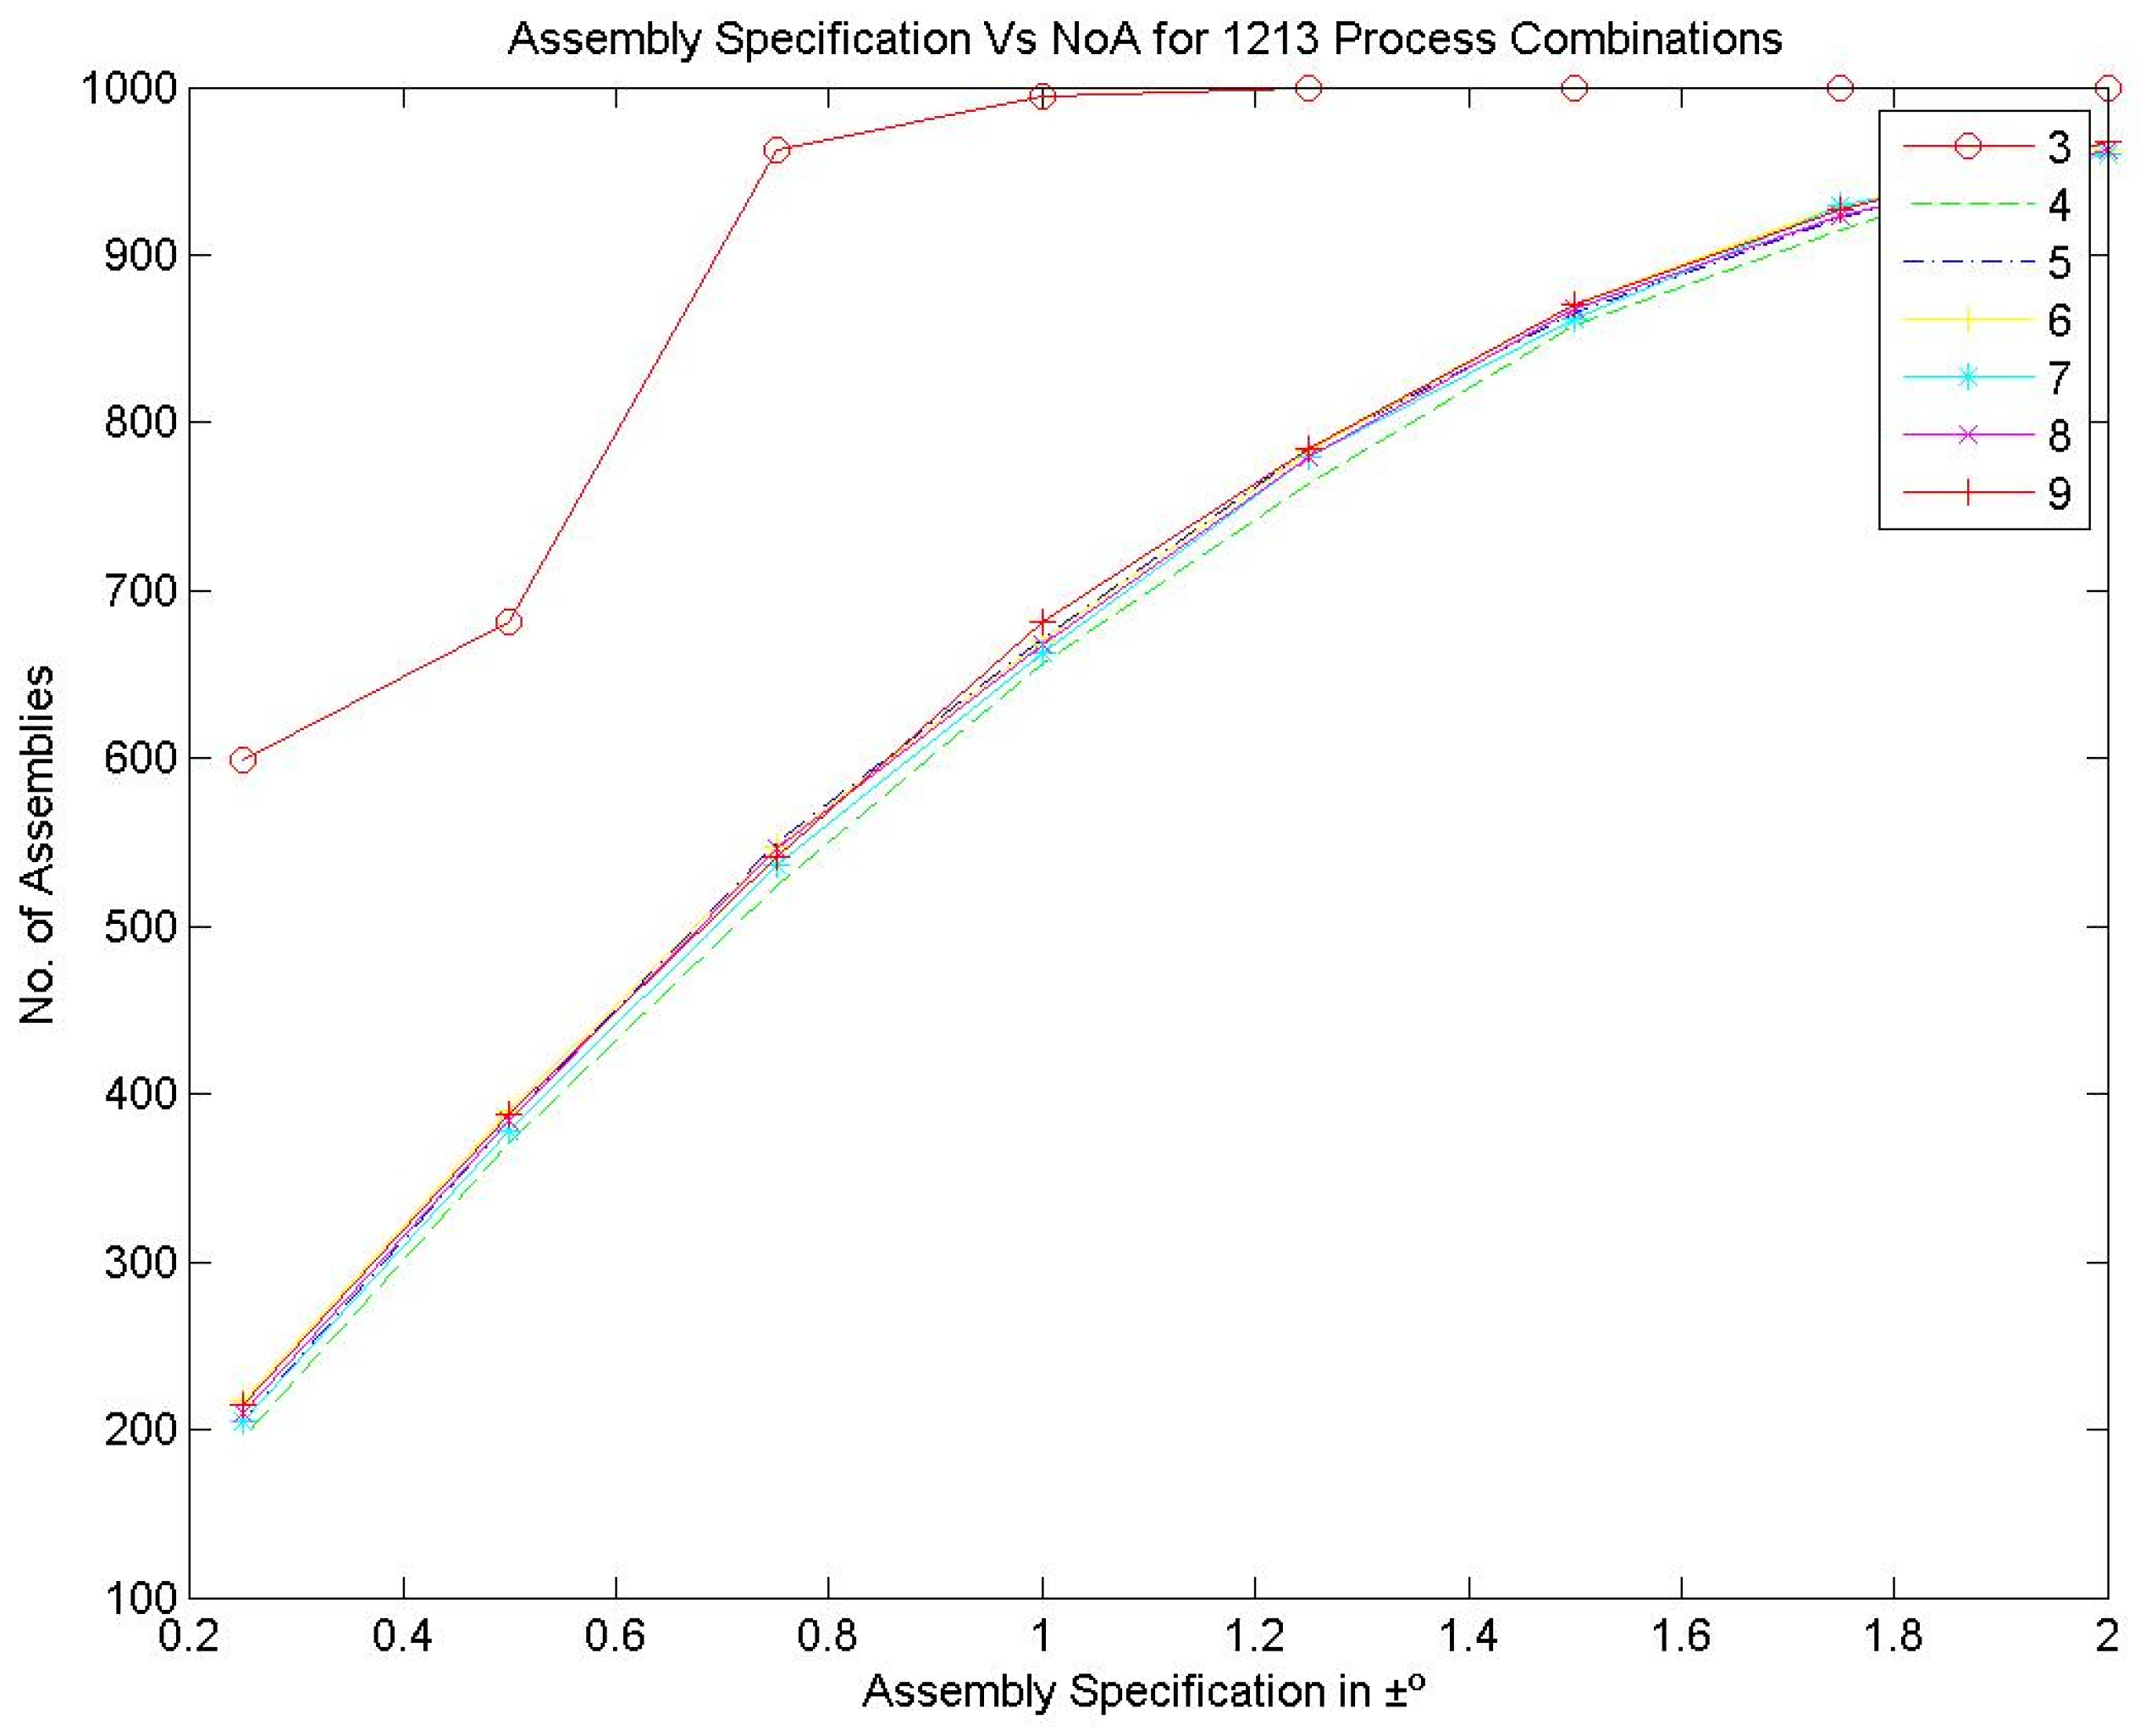
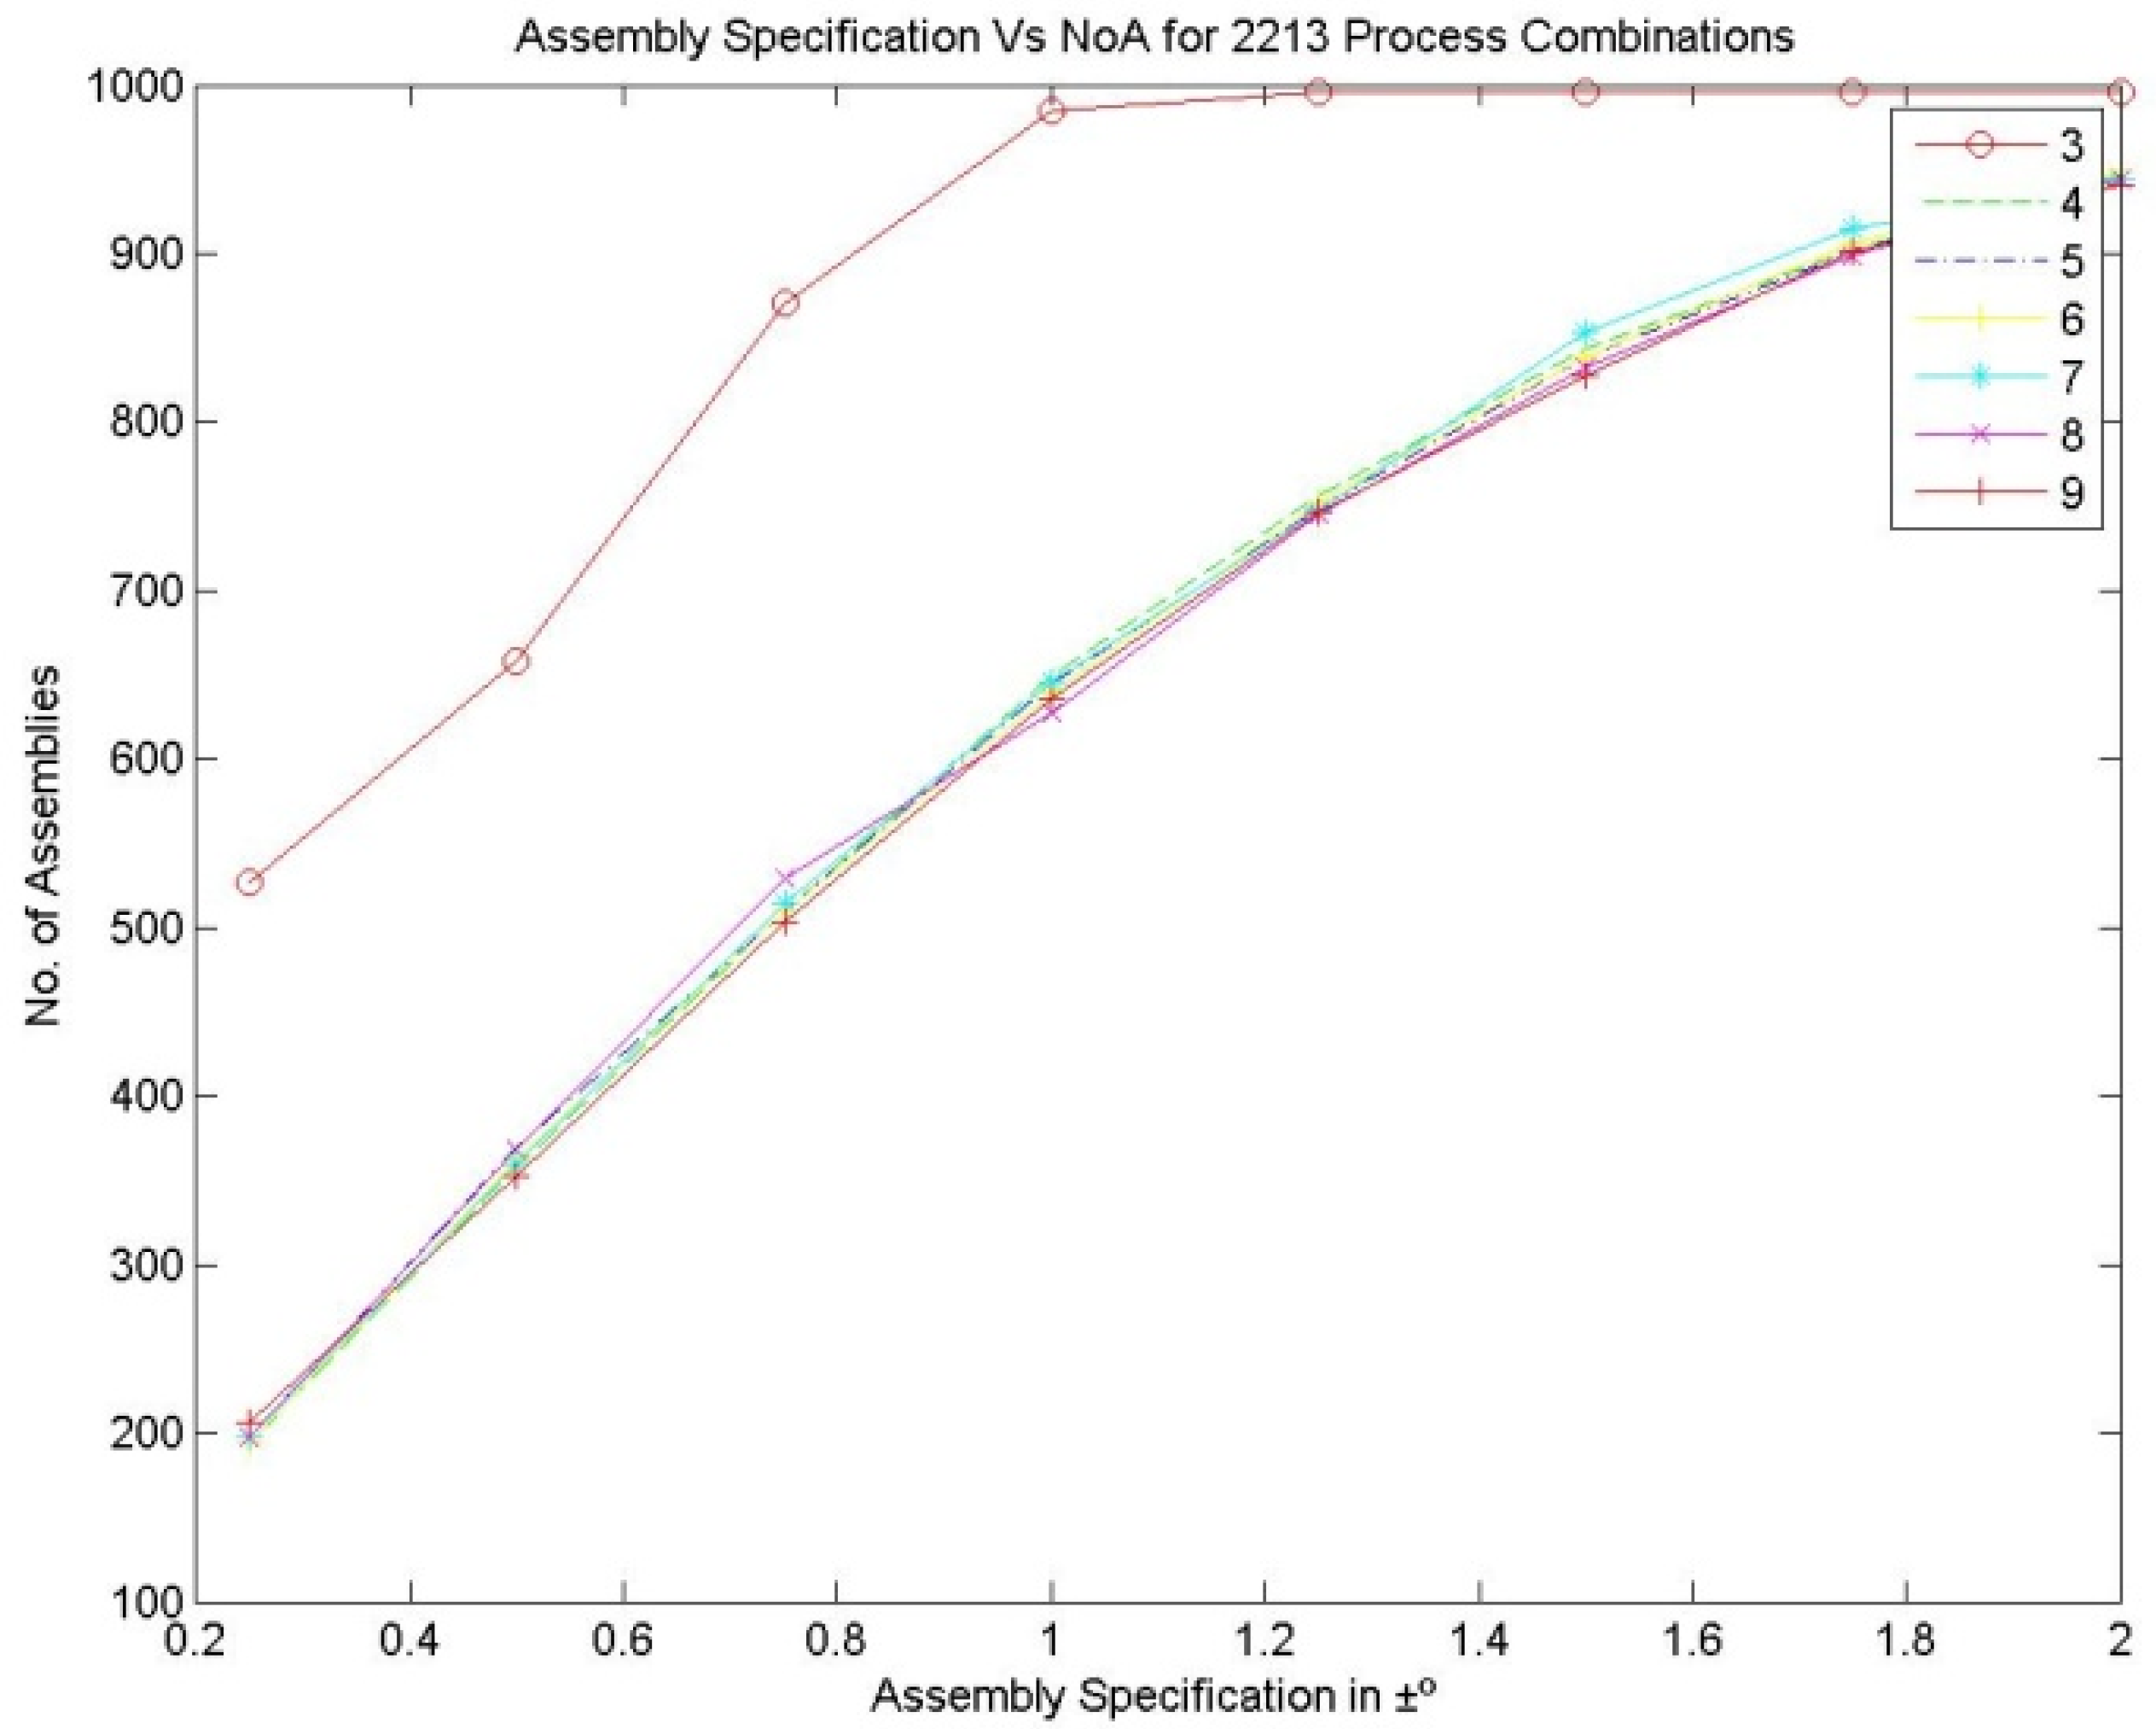
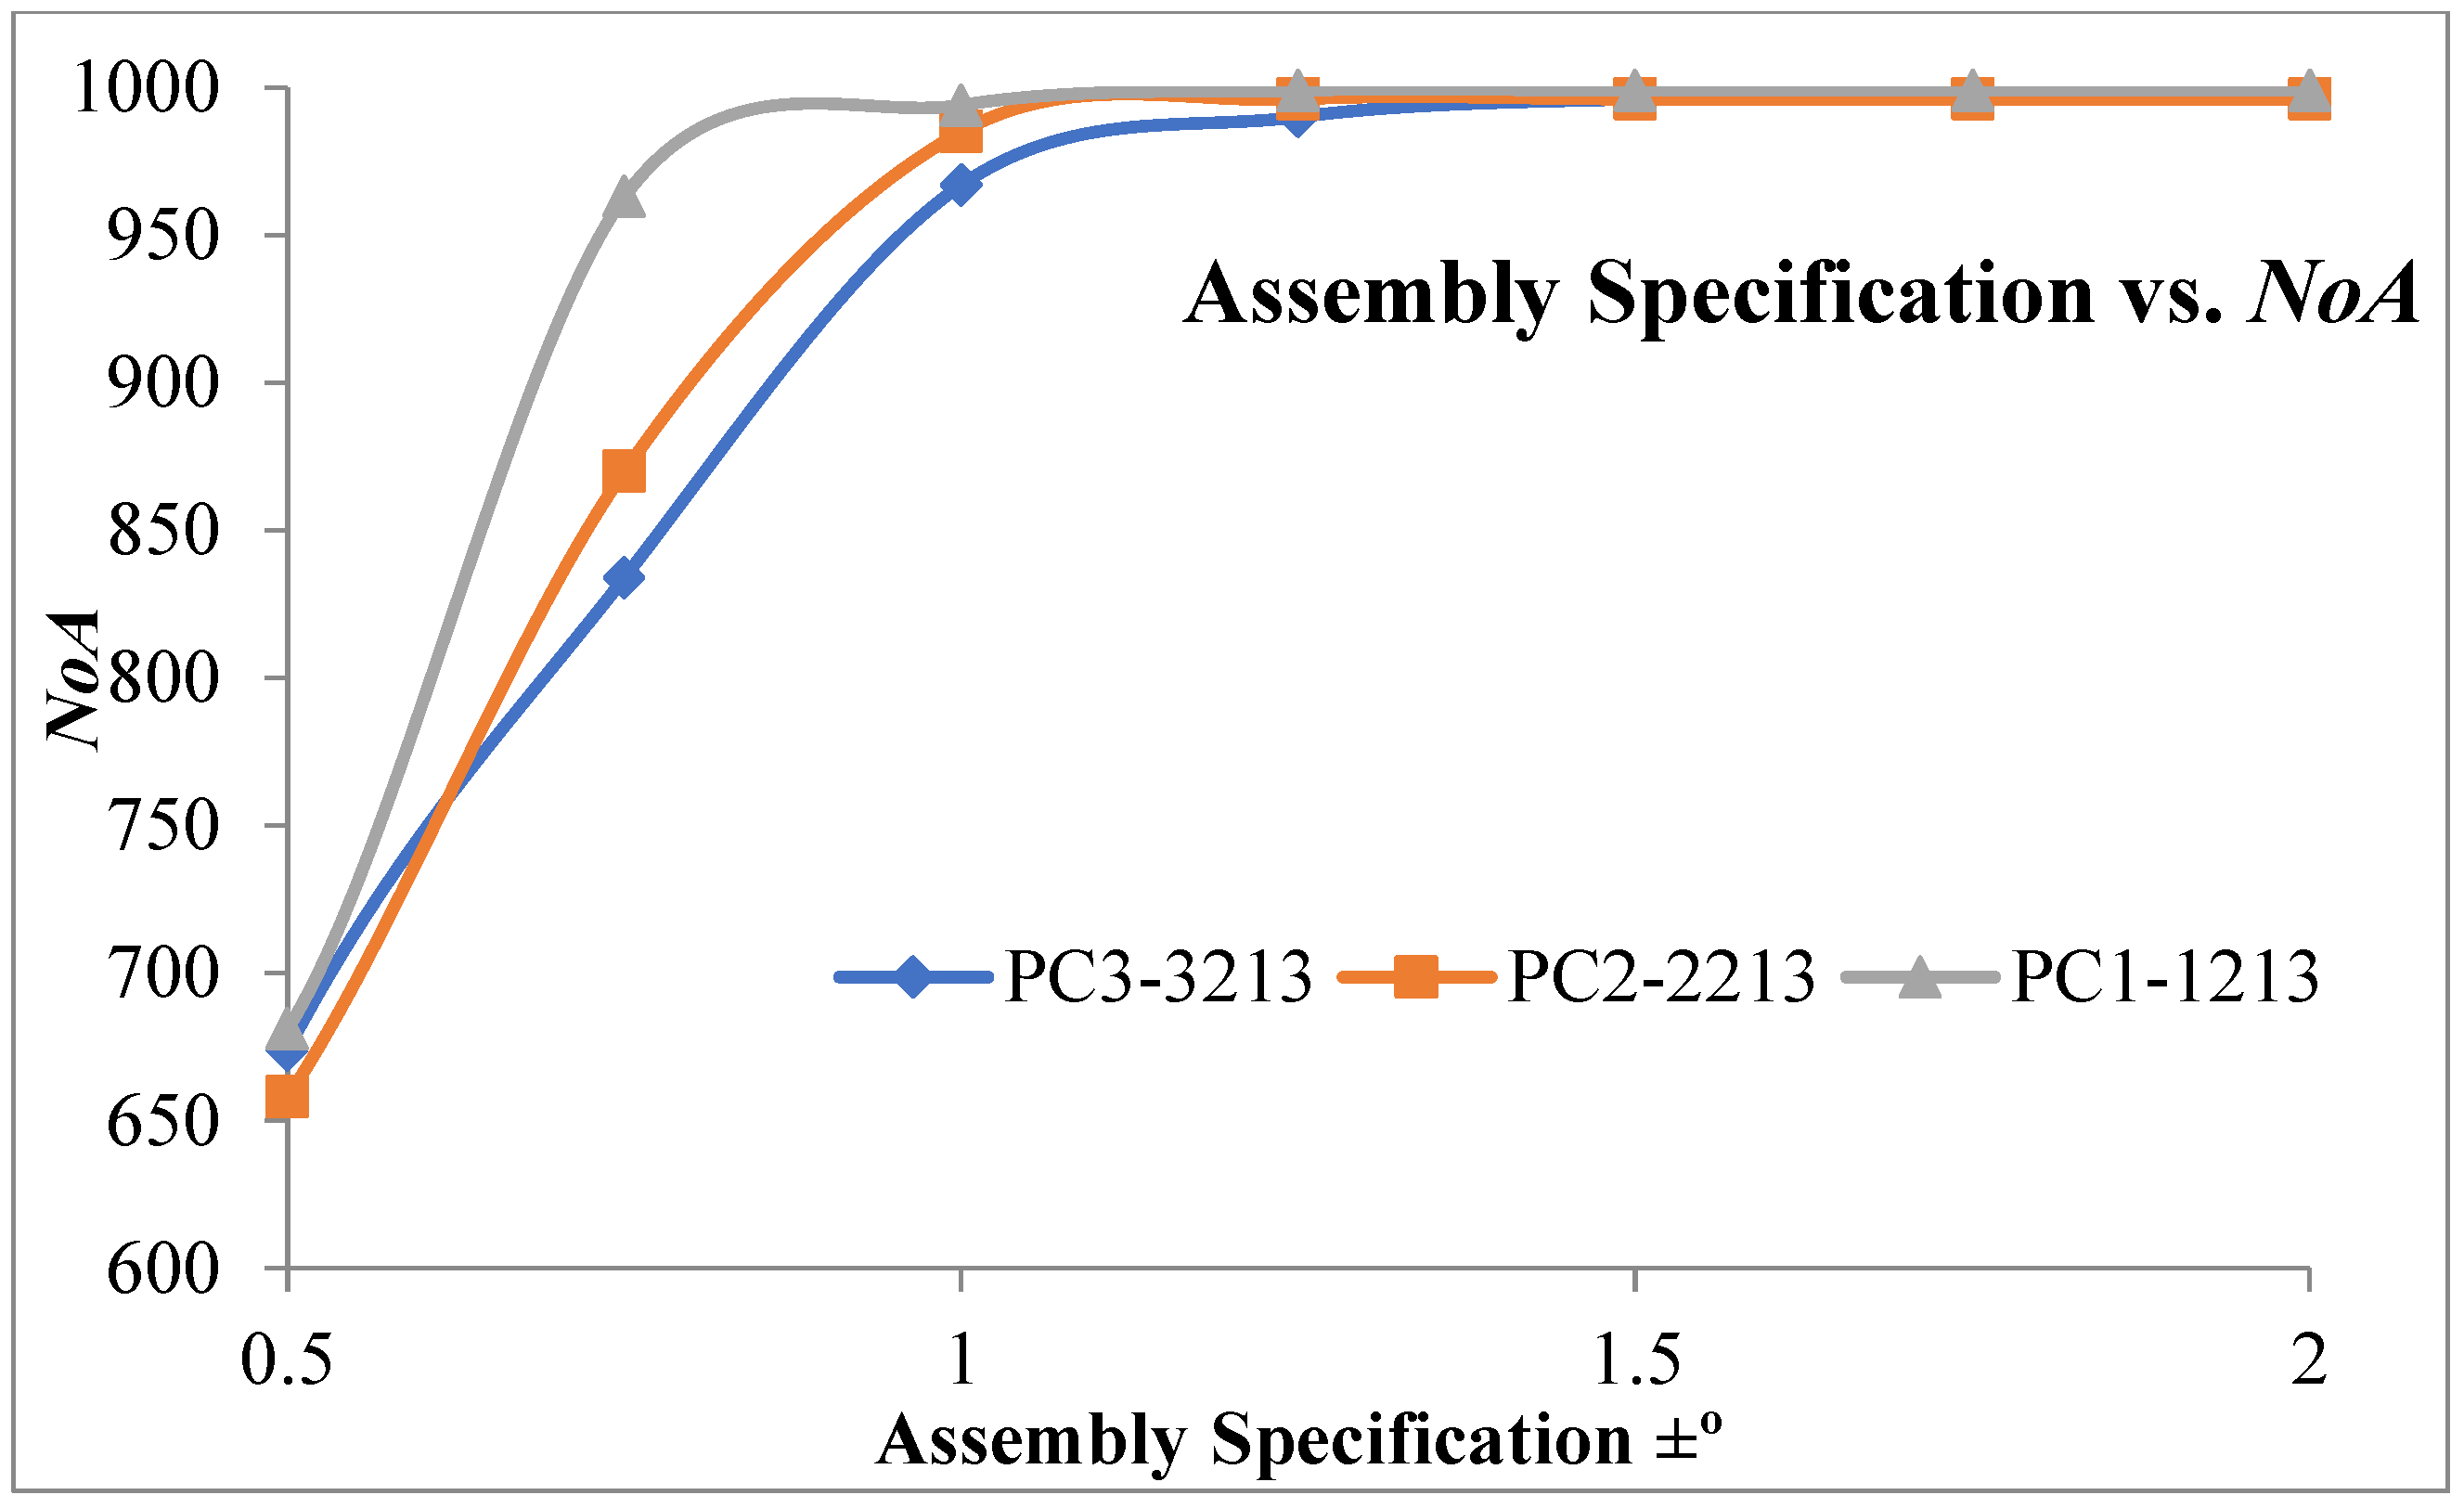
Figure 7, Figure 8 and Figure 9 represent the number of assemblies produced for various assembly specifications while changing the partition number for the same set of 1000 components produced based on process combination 3213. A similarity can be observed from the above figures. Except in three bin partitions, all other partitions of components and matching components according to the best bin combinations obtained through the HSA produced almost a very close number of assemblies for various assembly specifications. Figure 10 indicates that maximum assemblies are produced for various assembly specifications and process combinations while partitioning the components into three bins. The assembly specification value after ±1° in all the process combinations could produce an almost equal number of assemblies for bin number three. Table 15 represents the best bin combinations and their maximum number of assemblies for various process combinations.
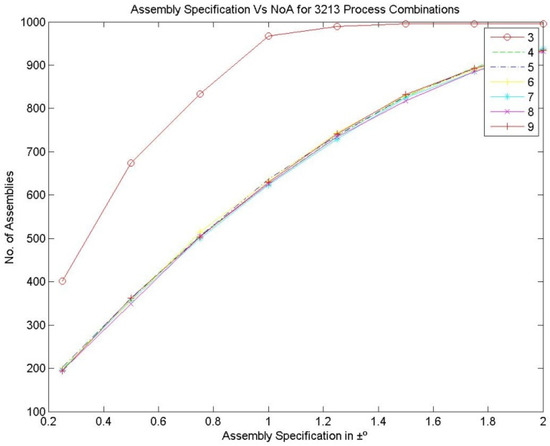
Figure 7.
Assembly specification vs. NoA for various bin numbers—the 3213 process combination.

Figure 8.
Assembly specification vs. NoA for various bin numbers—the 1213 process combination.
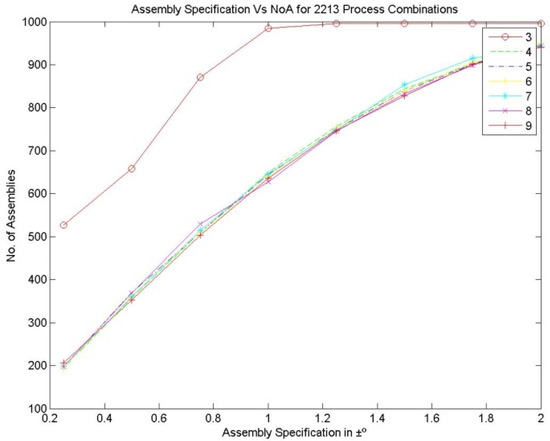
Figure 9.
Assembly specification vs. NoA for various bin numbers—the 2213 process combination.
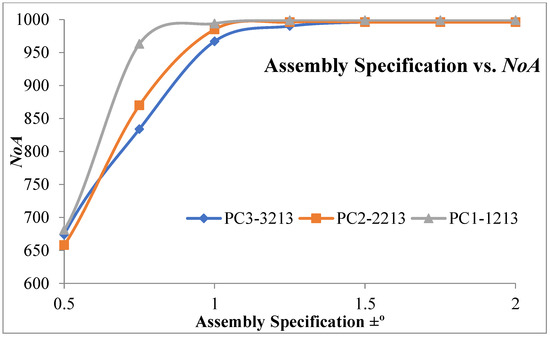
Figure 10.
Maximum NoA produced for different assembly specifications and various process combinations.
Table 15.
Best bin combinations for various assembly specifications and process combinations.
7. Conclusions
This paper addresses a novel methodology by combining the univariate search method and the harmony search algorithm in selective assembly for making non-linear assemblies for various assembly specifications. The best processes for the different components of the assembly are selected from the known alternative processes using the univariate search method, and these components are grouped into 3 to 9 bins. Further, the best bin combinations for making assemblies to reduce manufacturing cost are obtained through the harmony search algorithm. In this work, the component’s dimensions are directly considered for making assemblies from the best bin combinations rather than considering tolerances, as in the existing method. The proposed method is demonstrated on a non-linear overrunning clutch assembly and has proved its efficiency by saving 24.9% of manufacturing cost compared with the existing method for the best process combination of 3213.
Author Contributions
Conceptualization and Methodology by L.N. and S.K.M.; Writing—Original Draft Preparation by L.N. and S.K.M.; Writing—Review and Editing by S.S., E.A.N., J.P.D. and H.M.A.H. All authors have read and agreed to the published version of the manuscript.
Funding
The authors extend their appreciation to King Saud University for funding this work through Researchers Supporting Project number (RSP-2021/164), King Saud University, Riyadh, Saudi Arabia.
Institutional Review Board Statement
Not Applicable.
Informed Consent Statement
Not Applicable.
Data Availability Statement
Not Applicable.
Conflicts of Interest
The authors declare that they have no conflict of interest.
Availability of Data and Material
Not applicable.
References
- Kern, D.C. Forecasting Manufacturing Variation Using Historical Process Capability Data: Applications for Random Assembly, Selective Assembly, and Serial Processing. Ph.D. Thesis, Massachusetts Institute of Technology, Department of Mechanical Engineering, Cambridge, MA, USA, 15 May 2003. [Google Scholar]
- Mease, D.; Nair, V.N.; Sudjianto, A. Selective assembly in manufacturing: Statistical issues and optimal binning strategies. Technometrics 2004, 46, 165–175. [Google Scholar] [CrossRef]
- Matsuura, S.; Shinozaki, N. Selective assembly to minimize clearance variation by shifting the process mean when two components have dissimilar variances. Quality-Tokyo 2008, 38, 73. [Google Scholar]
- Kwon, H.M.; Hong, S.H.; Lee, M.K. Effectiveness of the ordered selective assembly for two mating parts. In Proceedings of the 10th Asia Pacific Industrial Engineering & Management Systems, Kitakyushu, Japan, 6 September 2009; pp. 1402–1405. Available online: https://apiems.org/ (accessed on 6 September 2021).
- Matsuura, S.; Shinozaki, N. Optimal process design in selective assembly when components with smaller variance are manufactured at three shifted means. Int. J. Prod. Res. 2011, 49, 869–882. [Google Scholar] [CrossRef]
- Yue, X.; Wu, Z.; Tianze, H.; Julong, Y. A heuristic algorithm to minimize clearance variation in selective assembly. Rev. Tech. Fac. Ing. Univ. Zulia 2014, 37, 55–65. [Google Scholar]
- Babu, J.R.; Asha, A. Tolerance modelling in selective assembly for minimizing linear assembly tolerance variation and assembly cost by using Taguchi and AIS algorithm. Int. J. Adv. Manuf. Technol. 2014, 75, 869–881. [Google Scholar] [CrossRef]
- Ju, F.; Li, J. A Bernoulli model of selective assembly systems. IFAC Proc. Vol. 2014, 47, 1692–1697. [Google Scholar] [CrossRef] [Green Version]
- Xu, H.-Y.; Kuo, S.-H.; Tsai, J.W.H.; Ying, J.F.; Lee, G.K.K. A selective assembly strategy to improve the components’ utilization rate with an application to hard disk drives. Int. J. Adv. Manuf. Technol. 2014, 75, 247–255. [Google Scholar] [CrossRef]
- Lu, C.; Fei, J.-F. An approach to minimizing surplus parts in selective assembly with genetic algorithm. Proc. Inst. Mech. Eng. Part B J. Eng. Manuf. 2014, 229, 508–520. [Google Scholar] [CrossRef]
- Manickam, N.; De, T.N.; Laboratory, A.S. Optimum group size selection for launch vehicle sections linear assembly by selective assembly method. Int. J. Eng. Res. 2015, 4, 837–843. [Google Scholar] [CrossRef]
- Babu, J.R.; Asha, A. Modelling in selective assembly with symmetrical interval-based Taguchi loss function for minimising assembly loss and clearance variation. Int. J. Manuf. Technol. Manag. 2015, 29, 288. [Google Scholar] [CrossRef]
- Ju, F.; Li, J.; Deng, W. Selective assembly system with unreliable bernoulli machines and finite buffers. IEEE Trans. Autom. Sci. Eng. 2016, 14, 171–184. [Google Scholar] [CrossRef]
- Malaichamy, T.; Sivasubramanian, R.; Sivakumar, M. Selective assem–A software approach. Int. J. Adv. Eng. Technol. 2016, 7, 729–735. [Google Scholar]
- Malaichamy, T.; Sivasubramanian, R.; Kumar, S.M.; Sundaram, M.C. Simulated annealing algorithm for minimising the surplus parts in selective assembly-A software approach. Asian J. Res. Soc. Sci. Humanit. 2016, 6, 1567. [Google Scholar] [CrossRef]
- Liu, S.; Liu, L. Determining the number of groups in selective assembly for remanufacturing engine. Procedia Eng. 2017, 174, 815–819. [Google Scholar] [CrossRef]
- Chu, X.; Xu, H.; Wu, X.; Tao, J.; Shao, G. The method of selective assembly for the RV reducer based on genetic algorithm. Proc. Inst. Mech. Eng. Part C J. Mech. Eng. Sci. 2017, 232, 921–929. [Google Scholar] [CrossRef]
- Geem, Z.W.; Kim, J.H.; Loganathan, G. A new heuristic optimization algorithm: Harmony search. Simulation 2001, 76, 60–68. [Google Scholar] [CrossRef]
- Geem, Z.; Kim, J.; Loganathan, G. Harmony search optimization: Application to pipe network design. Int. J. Model. Simul. 2002, 22, 125–133. [Google Scholar] [CrossRef]
- Lee, K.S.; Geem, Z.W. A new structural optimization method based on the harmony search algorithm. Comput. Struct. 2004, 82, 781–798. [Google Scholar] [CrossRef]
- Lee, K.S.; Geem, Z.W. A new meta-heuristic algorithm for continuous engineering optimization: Harmony search theory and practice. Comput. Methods Appl. Mech. Eng. 2005, 194, 3902–3933. [Google Scholar] [CrossRef]
- Wang, X.; Gao, X.Z.; Ovaska, S.J. Fusion of clonal selection algorithm and harmony search method in optimisation of fuzzy classification systems. Int. J. Bio. Inspired Comput. 2009, 1, 80. [Google Scholar] [CrossRef]
- Ganesan, K.; Suresh, R.K.; Mohanram, P.V.; Vishnukumar, C.H. Optimum tolerance allocation and process selection using simulated annealing. In Proceedings of the 4th Int. Conference on Mechanical Engineering, Theni, Tamil Nadu, India, 26–28 December 2009; Volume VI, pp. 201–205. [Google Scholar]

Publisher’s Note: MDPI stays neutral with regard to jurisdictional claims in published maps and institutional affiliations. |
© 2021 by the authors. Licensee MDPI, Basel, Switzerland. This article is an open access article distributed under the terms and conditions of the Creative Commons Attribution (CC BY) license (https://creativecommons.org/licenses/by/4.0/).