1. Introduction
The continuously increasing carbon dioxide gas (CO
2) emissions in the atmosphere and the continuous accumulation of this gas have ushered in global climate change (GCC) that promises to adversely affect the activities of humankind and alter our ecosystems. There is a wide consensus among scientists and engineers that a rational and feasible strategy to significantly mitigate the effects of GCC is to decrease and perhaps eliminate global CO
2 emissions. One must bear in mind that approximately 40% of the global primary energy sources are used for the generation of electricity and that 64% of the electricity is generated by fossil fuels—most commonly by natural gas, coal, and to a lesser extent petroleum [
1]. Substituting the fossil fuels that generate electricity today with non-carbon energy sources—renewable energy sources (RES), nuclear power plants, or, more likely, a combination of the two—would immediately result in significant global CO
2 emissions reduction [
2,
3]. A report by the Intergovernmental Panel on Climate Change (IPCC) recommends that the CO
2 emissions from the electricity generation sector be reduced globally by 90% or more from the 2010 levels between the years 2040 and 2070 [
4], while another and more recent report by the International Energy Agency (IEA) presents a “roadmap” for this transition to non-carbon energy sources [
5].
Solar energy and wind energy are the most abundant RESs globally that may be harnessed in every region of the globe. However, solar energy is periodically variable, and wind energy is intermittent. On the other hand, the energy demand of consumers is dictated by the weather conditions and consumer habits and not by the availability of these energy sources. Presently, the fluctuating electricity demand of consumers is satisfied with the deployment of intermediate- and peak-power generation units, most of which use natural gas as their fuel [
6]. The substitution of fossil fuels for electricity generation with RES creates a demand–supply mismatch during parts of the year. Oftentimes, the supply of RES-generated electricity exceeds the present demand, a situation that generates the so called “duck curve” for the demand–supply of electricity [
7,
8]. At other times of the year, especially during the night-time, the supply is insufficient to meet the demand. This necessitates the development of significant, utility-level energy storage infrastructure that will be used to compensate for any deficit or surplus and equate the electricity demand to the available supply [
9,
10]. A case study pertinent to France, which generates almost 80% of its electricity from nuclear energy, concluded that the higher utilization of RESs will significantly alter the shape of the hourly demand curve, and this necessitates the employment of other options such as energy storage or the waste of generated power [
11]. A similar study recommended a hybrid system of high temperature gas reactors and RESs for grid stability and improved reliability [
12]. A more recent study determined the needed utility-level energy storage capacity for the substitution of all the fossil power plants with RES in an entire electricity grid, and the potential effect of increased nuclear energy contributions to the electricity generation mix [
13].
It must be noted that reservoirs used for hydroelectric generation also function as energy storage facilities [
8]. As a result, countries with significant hydroelectric energy resources, such as Norway and Nepal, will not experience the demand–supply mismatch and the duck curve effects. However, there are very few countries that possess such high quantities of hydroelectric energy. It is widely expected that the duck curve supply–demand problems will become a reality for all countries, which are expected to primarily rely on solar and wind energy for the decarbonization of their electric power industries [
7,
8,
14].
Zero-energy buildings (ZEBs) are essentially small solar energy power plants that generate electricity during the daytime and rely on the electricity grid during the night-time [
15]. Because of their design and operation, ZEBs significantly contribute to the supply–demand mismatch, especially in regions that heavily rely on air-conditioning for the cooling of the buildings [
16]. On the contrary, grid-independent buildings (GIBs) make use of local energy storage systems to always meet their electricity demand and avoid any type of supply–demand mismatch [
17]. Effectively communities of GIBs are energy independent using sustainable energy sources and local storage.
Because the most efficient wind turbines are of high-power ratings (currently 1–3.5 MW with future designs that may reach 13 MW) wind power cannot be effectively used in single residential GIBs that consume power on the order of a few kW and have to rely on solar energy alone [
17]. However, the demand of clusters of GIBs, which may form small communities, is high enough to allow the utilization of both solar and wind power and to seek an optimal combination of the two RESs. This paper aims at presenting the operation of a microgrid that would utilize solar and wind energy in a community of 1000 grid-independent residential buildings in the North Texas region, where most of the electricity demand is due to the use of air-conditioning. Among the innovative aspect this paper introduces is the hourly power demand that must be immediately satisfied and the combination of solar and wind energy to satisfy this demand. The paper also presents calculations on the level of energy storage needed for the transition to renewables and power dissipated in the storage-regeneration process. Based on the hourly power demand of this cluster of buildings, iterative calculations are performed to determine the required capacity of the wind and solar electricity generation units; the necessary energy storage capacity that would ensure the match of power demand to supply; and the energy dissipation these electricity storage-regeneration processes entail for the microgrid.
2. System Description
The microgrid serves a cluster of 1000 residential buildings in North Texas. The electricity demand in the region is very high in the summer—because of the air-conditioning needs of the population—and significantly less in the other seasons. The hourly electric energy demand of the cluster of buildings was simulated from available data on residences in the area for an entire year [
18].
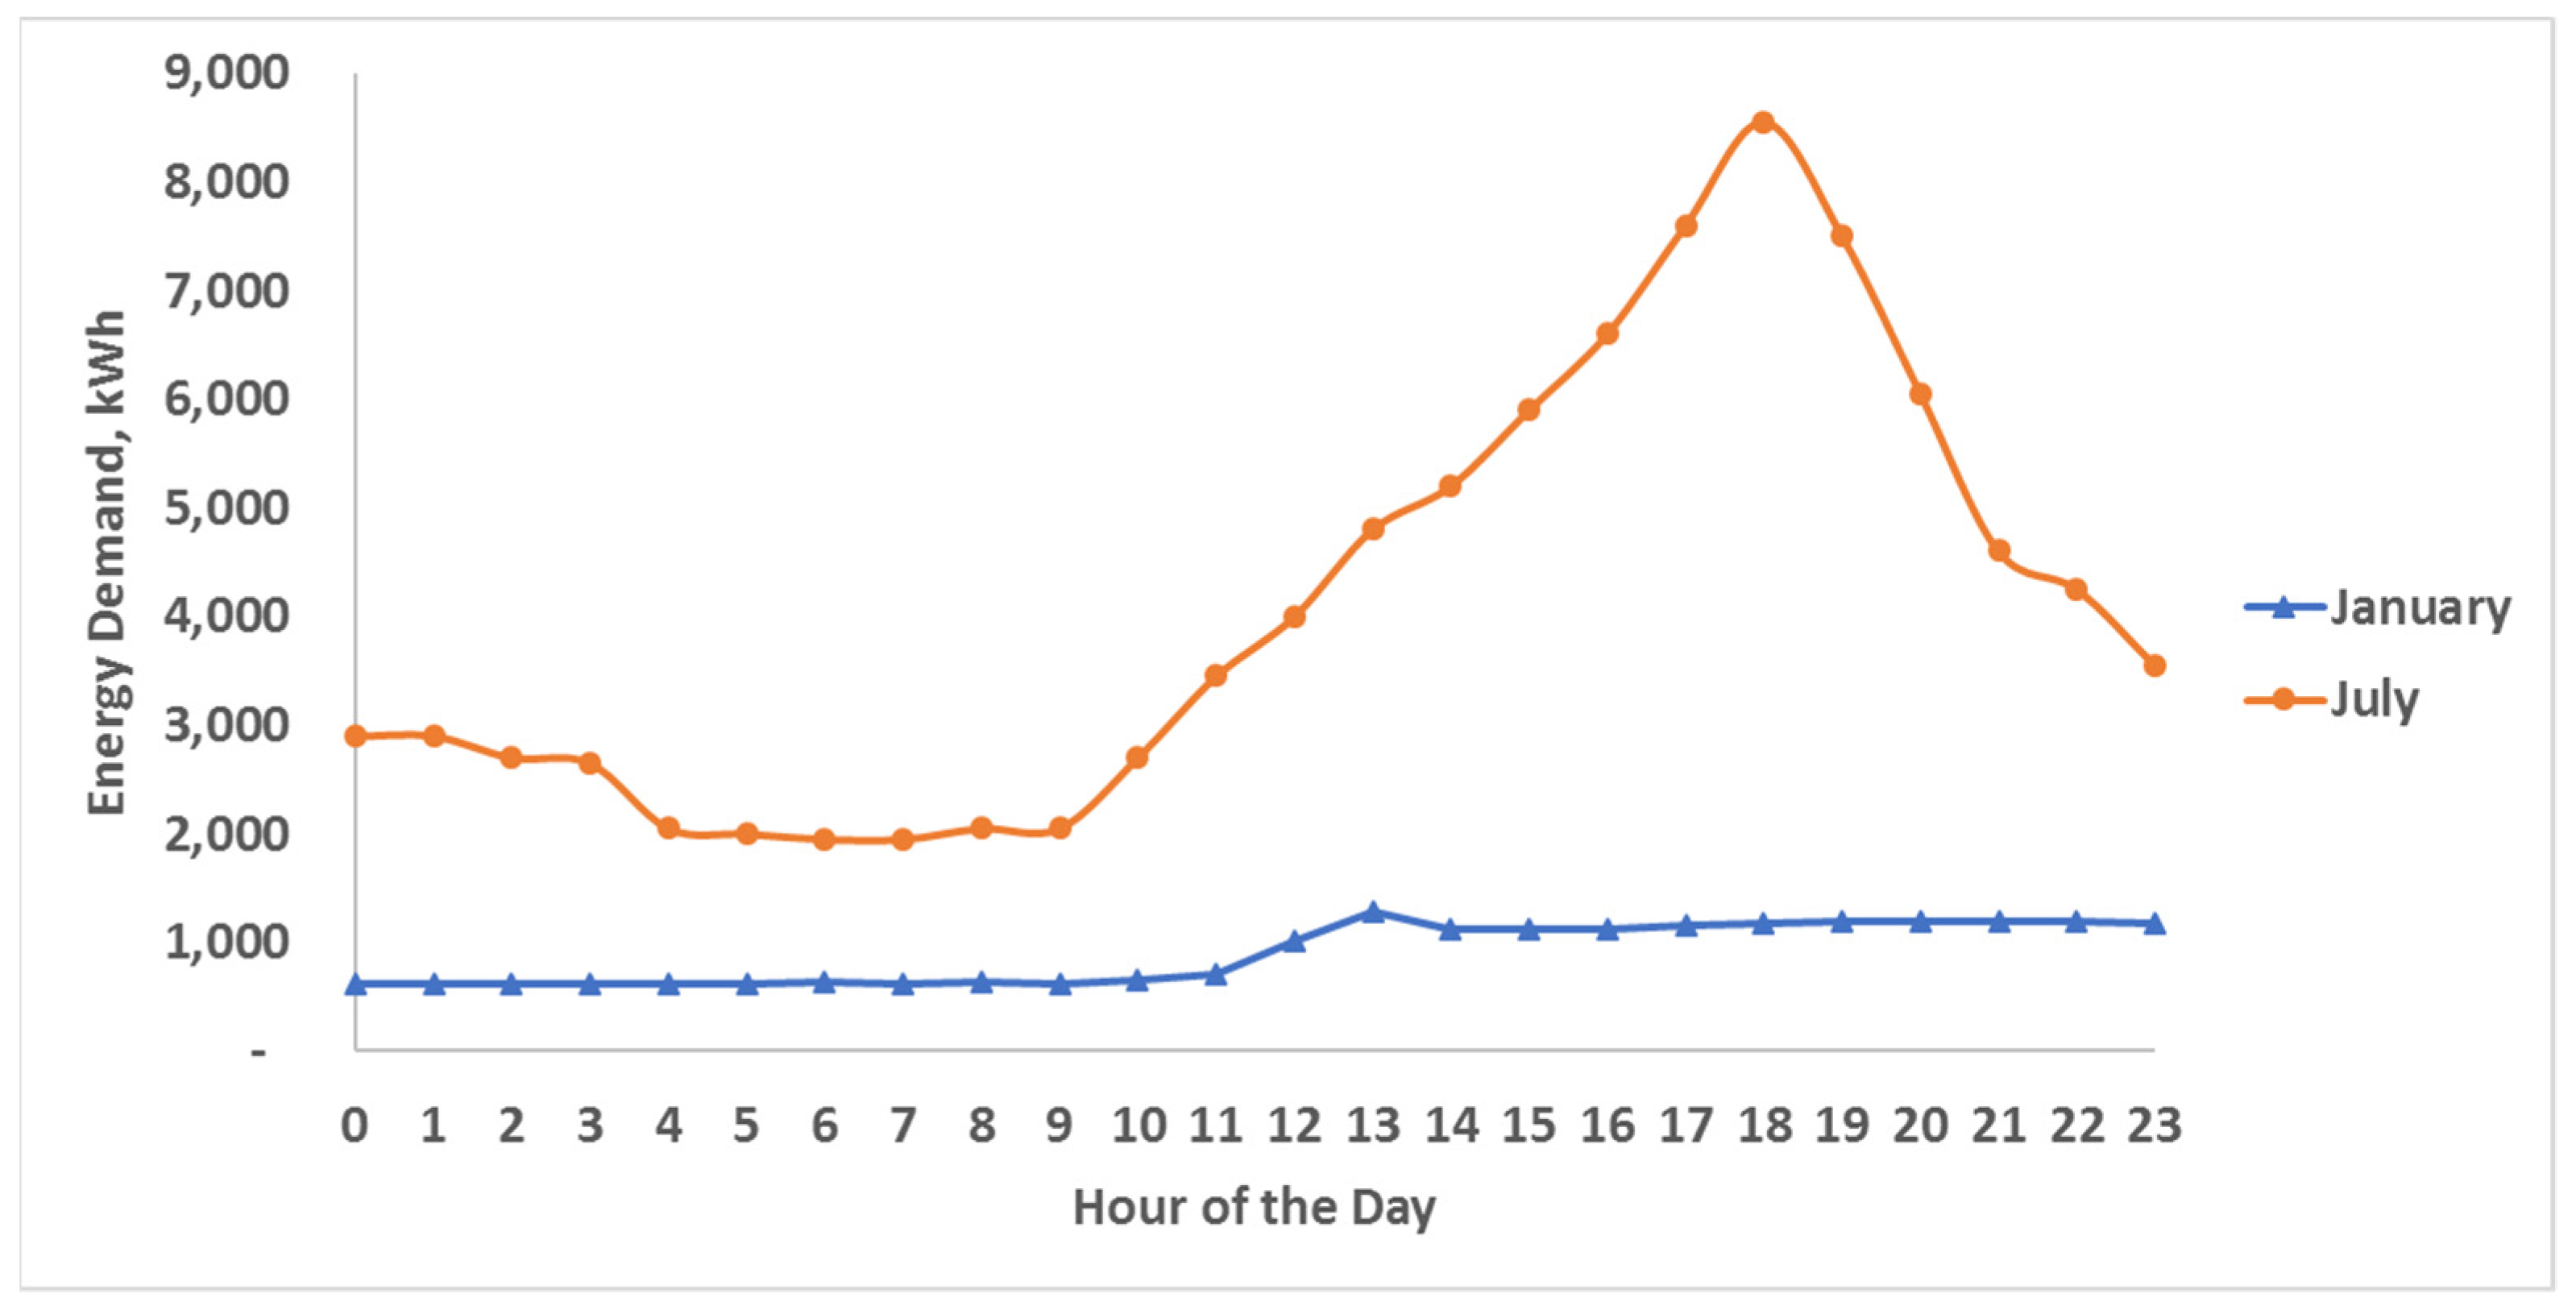
Figure 1 depicts this hourly demand in the microgrid for two typical days, in January and July.
It is observed in
Figure 1 that the peak daily demand in the summer is approximately seven times higher than that in the winter. It was calculated that the total electric energy consumed during the day in July is 4.5 times higher than that of the day in January. The air-conditioning demand in the area is the principal reason for these differences. Winters in the region are mild, and any residential heating needs are supplied by natural gas, which is extracted from the local Barnett shale field and is abundant in the area.
A number of wind turbines, which are placed at a distance of 1–2 km from the residences to avoid noise issues, as well as arrays of solar cells, supply the electric power needs for this community. Since energy storage is necessary for the uninterrupted supply of electric power to the cluster of buildings, hydrogen has been chosen for storage [
19]. There are two reasons for the choice of hydrogen as the storage medium. First, the region does not have the geological features that would enable the installation of pumped-hydro storage (PHS) systems and compressed air energy storage (CAES) systems. Additionally, most battery types exhibit internal current drift and are unable to store energy through seasons, e.g., store energy in the winter and spring when winds are strong to be used in the summer when the electricity demand is high [
8]. A second reason is that hydrogen has very high specific energy for storage (119 MJ/kg), is clean, and does not degrade [
8,
20,
21]. With hydrogen as the energy storage medium, when the demand for electric energy exceeds the supply, a system of hydrogen fuel cells provides the energy deficit.
Figure 2 shows the schematic diagram for the proposed energy system. Photovoltaic (PV) cells and wind turbines supply all the needed energy for the cluster of buildings. Controllers and maximum power point trackers (MPPT) ensure that maximum electric power is produced by the PV cells. The generated power is directed to the cluster of buildings to meet the demand. If the generated power is higher than the present demand, the excess energy is directed to electrolysis systems that feed the hydrogen storage system. When the power supply is less than the demand, the power deficit is provided by the fuel cells, which convert the stored hydrogen to electricity. If the cluster of buildings operates with alternating current (ac), voltage inverters convert the direct current (dc) generated in the fuel cells and the PV cells to ac.
3. Analysis—Governing Equations
The analysis of the microgrid takes into account the hour-by-hour operation of the microgrid for an entire year. The energy generation at a given hour of the year,
i, is the sum of the energy production by the PV cells and the wind turbines:
where
represents the energy generated during the hour,
i,
is the total solar irradiance,
A is the area of the PV system,
is the average power produced by the wind turbines, and
t is the time, which for the calculations that follow is 1 h or 3600 s.
It is known that the efficiency of PV cells drops with rising temperature. Therefore, a closure equation for the efficiency of the PV system is adopted for the hours when the temperature exceeds 25 °C:
where
is the actual efficiency of the PV cell,
is the efficiency at 25 °C,
is the temperature sensitivity coefficient, and
T is the ambient temperature in °C. For the calculations, the sensitivity coefficient was chosen to be
= 0.002 [
22].
For the determination of the hourly wind energy, Vestas V90 3.0 wind turbines were chosen to be employed. The turbines have diameter
D = 90 m and are typically installed on top of a tower with a height
H = 80 m. The cut-in wind velocity for these turbines is 3.5 m/s, and the cut-out velocity is 25 m/s. When the wind velocity is less than the cut-in velocity or greater than the cut-out velocity, the wind turbines do not generate any power. The rated velocity of these turbines is 15 m/s, and this implies that when the wind velocity is in the range 15 <
V < 25 m/s, the turbines produce the rated power of 3.0 MW. When the wind velocity is between the cut-in and the rated velocity, the power produced by the wind turbine is determined by the expression [
8]:
where
is the electric power produced by a single wind turbine at a given hour,
is the diameter of the wind turbine,
is the efficiency of the turbine-generator system,
is the air density, and
is the average wind velocity at the nacelle/tower height. The local wind velocity,
V, was determined from hourly data obtained from the databases of the National Oceanic and Atmospheric Administration [
23].
The hourly energy demand of the cluster of buildings,
ED, is met either by the hourly energy production of the solar and wind systems or by the hydrogen energy storage system. During a given hour of the year, if the energy supply is greater than the demand, the generated excess energy,
, is directed to the electrolysis system and the produced hydrogen is added to the hydrogen tank. If the demand is greater than the generated energy, the fuel cells supply the deficit,
, using the stored hydrogen. Therefore, at the end of the
th hourly time period, the energy storage level,
, is determined by one of the following expressions:
where
is the overall efficiency of the electrolysis system, and
is the efficiency of the fuel cells. It is apparent from the last equation that the storage and recovery of the generated energy entails dissipation, which depends on the efficiencies of the electrolysis and fuel cells systems. It must be noted that the values of these two efficiencies also include any minor losses in the inverters and any transformers.
Solution of the Governing Equations
It was stipulated for the computations that at any hour of the year, the storage system must contain enough hydrogen to meet the entire energy demand of the cluster of buildings for seven days (168 h). This stipulation was adopted so that in the event of any equipment malfunction or damage, e.g., from strong storms or tornadoes, the managers of the microgrid would have enough time to repair the system and, if necessary, purchase hydrogen. This becomes a constraint in the solution of the equations that determine the operation of the microgrid.
The solution of the governing equations was obtained by iteration using the following procedure:
The year starts with an assumed quantity of stored energy, S0.
A number of wind turbines (one to four) is specified for the generation of the wind energy. The hourly wind generated energy is determined.
An area, Ai, for the PV systems is assumed. The hourly solar-generated energy is determined.
The hourly energy surplus or deficit is determined. The total energy in the storage system is calculated at every hour of the year.
The stored energy at the end of the year, S8760, is calculated and compared to S0. If S0 < S8760, the solar system’s area, Ai, is increased. If S0 > S8760, the solar system’s area, Ai, is decreased. The calculations starting at step 3 are repeated until S0 = S8760.
The correct value for S0 for step 1 is obtained by a second iteration. This iteration makes use of the constraint that on the hour of minimum storage, the system must have enough energy to satisfy the entire demand of the microgrid for the next 168 h.
4. Results and Discussion
Calculations were performed using, at first, the base case, where one wind turbine operates, and the PV arrays generate the remainder of the needed energy for the cluster of buildings. The efficiencies for the electrolysis system and fuel cells are 70% and 75%, respectively [
24,
25]. The parameters for the solar cell efficiency and the temperature dependence coefficient are
= 0.22 (22%) and
= 0.002 [
22]. For the hydrogen storage, the maximum pressure is 50 MPa. Under these conditions, the stored energy density of hydrogen is 1.03 MWh/m
3 [
17,
18]. It must be noted that this is not an excessive pressure for hydrogen storage, since several automobile corporations already manufacture hydrogen driven vehicles with the pressure in the fuel tanks in the range of 30–70 MPa.
The calculations show that the needed area for the PV arrays to fully meet the demands of the cluster in the base case is
A = 44,410 m
2 (10.2 MW rating); and the storage capacity of the microgrid is 5345 MWh.
Figure 3 shows the monthly electric energy generation from the PV array and the wind turbine, the monthly energy demand of the cluster, and the maximum energy storage level for each month of the year. For the determination of the monthly values, the hourly values in the entire month were added. It was observed that the electric energy generation is significantly higher than the demand during the period January to July, and the storage level increases. The monthly energy demand in the cluster increases significantly from June through September, when the region uses a great deal of electric power for air-conditioning. The energy storage level from June to mid-October significantly drops to meet this additional demand.
Based on the computational results for the case when one wind turbine is used, the hourly variation of stored energy—the storage level at every hour of the year—was plotted in
Figure 4. It is observed in this figure that the stored energy level increases starting in the month of 16 October and continues increasing—albeit at different rates—throughout the months of autumn, winter, and spring. During the summer months, the storage level decreases at a fast rate, indicating the high electricity demand in the region. The minimum, non-zero energy storage level—approximately 230 MWh—is also evident in this figure. In an emergency, this minimum energy level would supply the entire demand of the microgrid for an entire week. The maximum level of storage is 5345 MWh and occurs on 28 June. This storage level corresponds to 5189 m
3 of hydrogen at 500 bar, or approximately 5.2 m
3 per household. The accumulation of stored energy from mid-October to early June is one of the reasons for the choice of hydrogen as the storage medium.
After considering the base case, a parametric study was performed to determine the effects of the several parameters that influence the energy storage needed, the solar power to be produced, and the energy dissipation in the microgrid. The overall efficiency of the energy storage system, e.g., the round-trip efficiency, defined as the product of the electrolysis efficiency and the fuel cell efficiency, is one of the important parameters in the study. The latter two efficiency components vary in the ranges 0.55
0.78 and 0.60
0.85, and this implies that the round-trip efficiency variation is in the range of 0.33 to 0.67. For the base-case with one wind turbine,
Figure 5 shows the effect of the round-trip efficiency of the storage system on the area needed for the solar cells and the annually dissipated energy due to the storage-recovery processes.
It is observed in
Figure 5 that a well-designed storage-recovery system with high roundtrip efficiency has a significant and beneficial effect on both the area needed for the solar cells and on the necessary storage capacity of the cluster of buildings. The computations show that for every 1% of round-trip efficiency improvement, the needed solar cell area decreases by approximately 70 m
2 (16.1 kW rated capacity) and the annually dissipated energy by 122 MWh.
The needed storage capacity is also significantly decreased with better design and technological advances of the system that lead to improved round-trip efficiency, and
Figure 6 shows this effect. It is observed that for every 1% efficiency improvement, the required energy storage capacity is reduced by approximately 28 m
3, which is equivalent to 29 MWh.
The effect of the number of wind turbines used for the generation of electric power was also considered.
Figure 7 depicts this effect on the required storage capacity and the PV cells area. It was observed that the needed area of PV cells drops by approximately 11,800 m
2 (2.71 MW rated capacity) with every additional turbine, indicating that wind turbines generate a great deal of power in the area. However, the needed energy storage increases by approximately 368 MWh for every additional wind turbine. This happens because solar energy is better correlated with the energy demand in the region, which is dominated by the summer usage of air-conditioning.
A powerful option in the design of this and similar microgrid systems is the reduction of the electric energy demand using energy conservation measures [
8]. With relatively modest investment, improvements can be made in the cluster of buildings that would significantly reduce their energy demand [
26]. For the case when two wind turbines are employed,
Figure 8 depicts the effect of demand reduction and shows that energy conservation measures in the buildings has a salutary effect on both the required PV cell area and storage capacity; for every 1% of energy reduction in the buildings, the PV area decreases by approximately 530 m
2 (121.7 kW rated capacity) and the required storage capacity by 46 MWh.


