
Optimization and Mapping of the Deep Drawing Force Considering Friction Combination


Abstract
:1. Introduction
2. Simulation of Deep Drawing Process
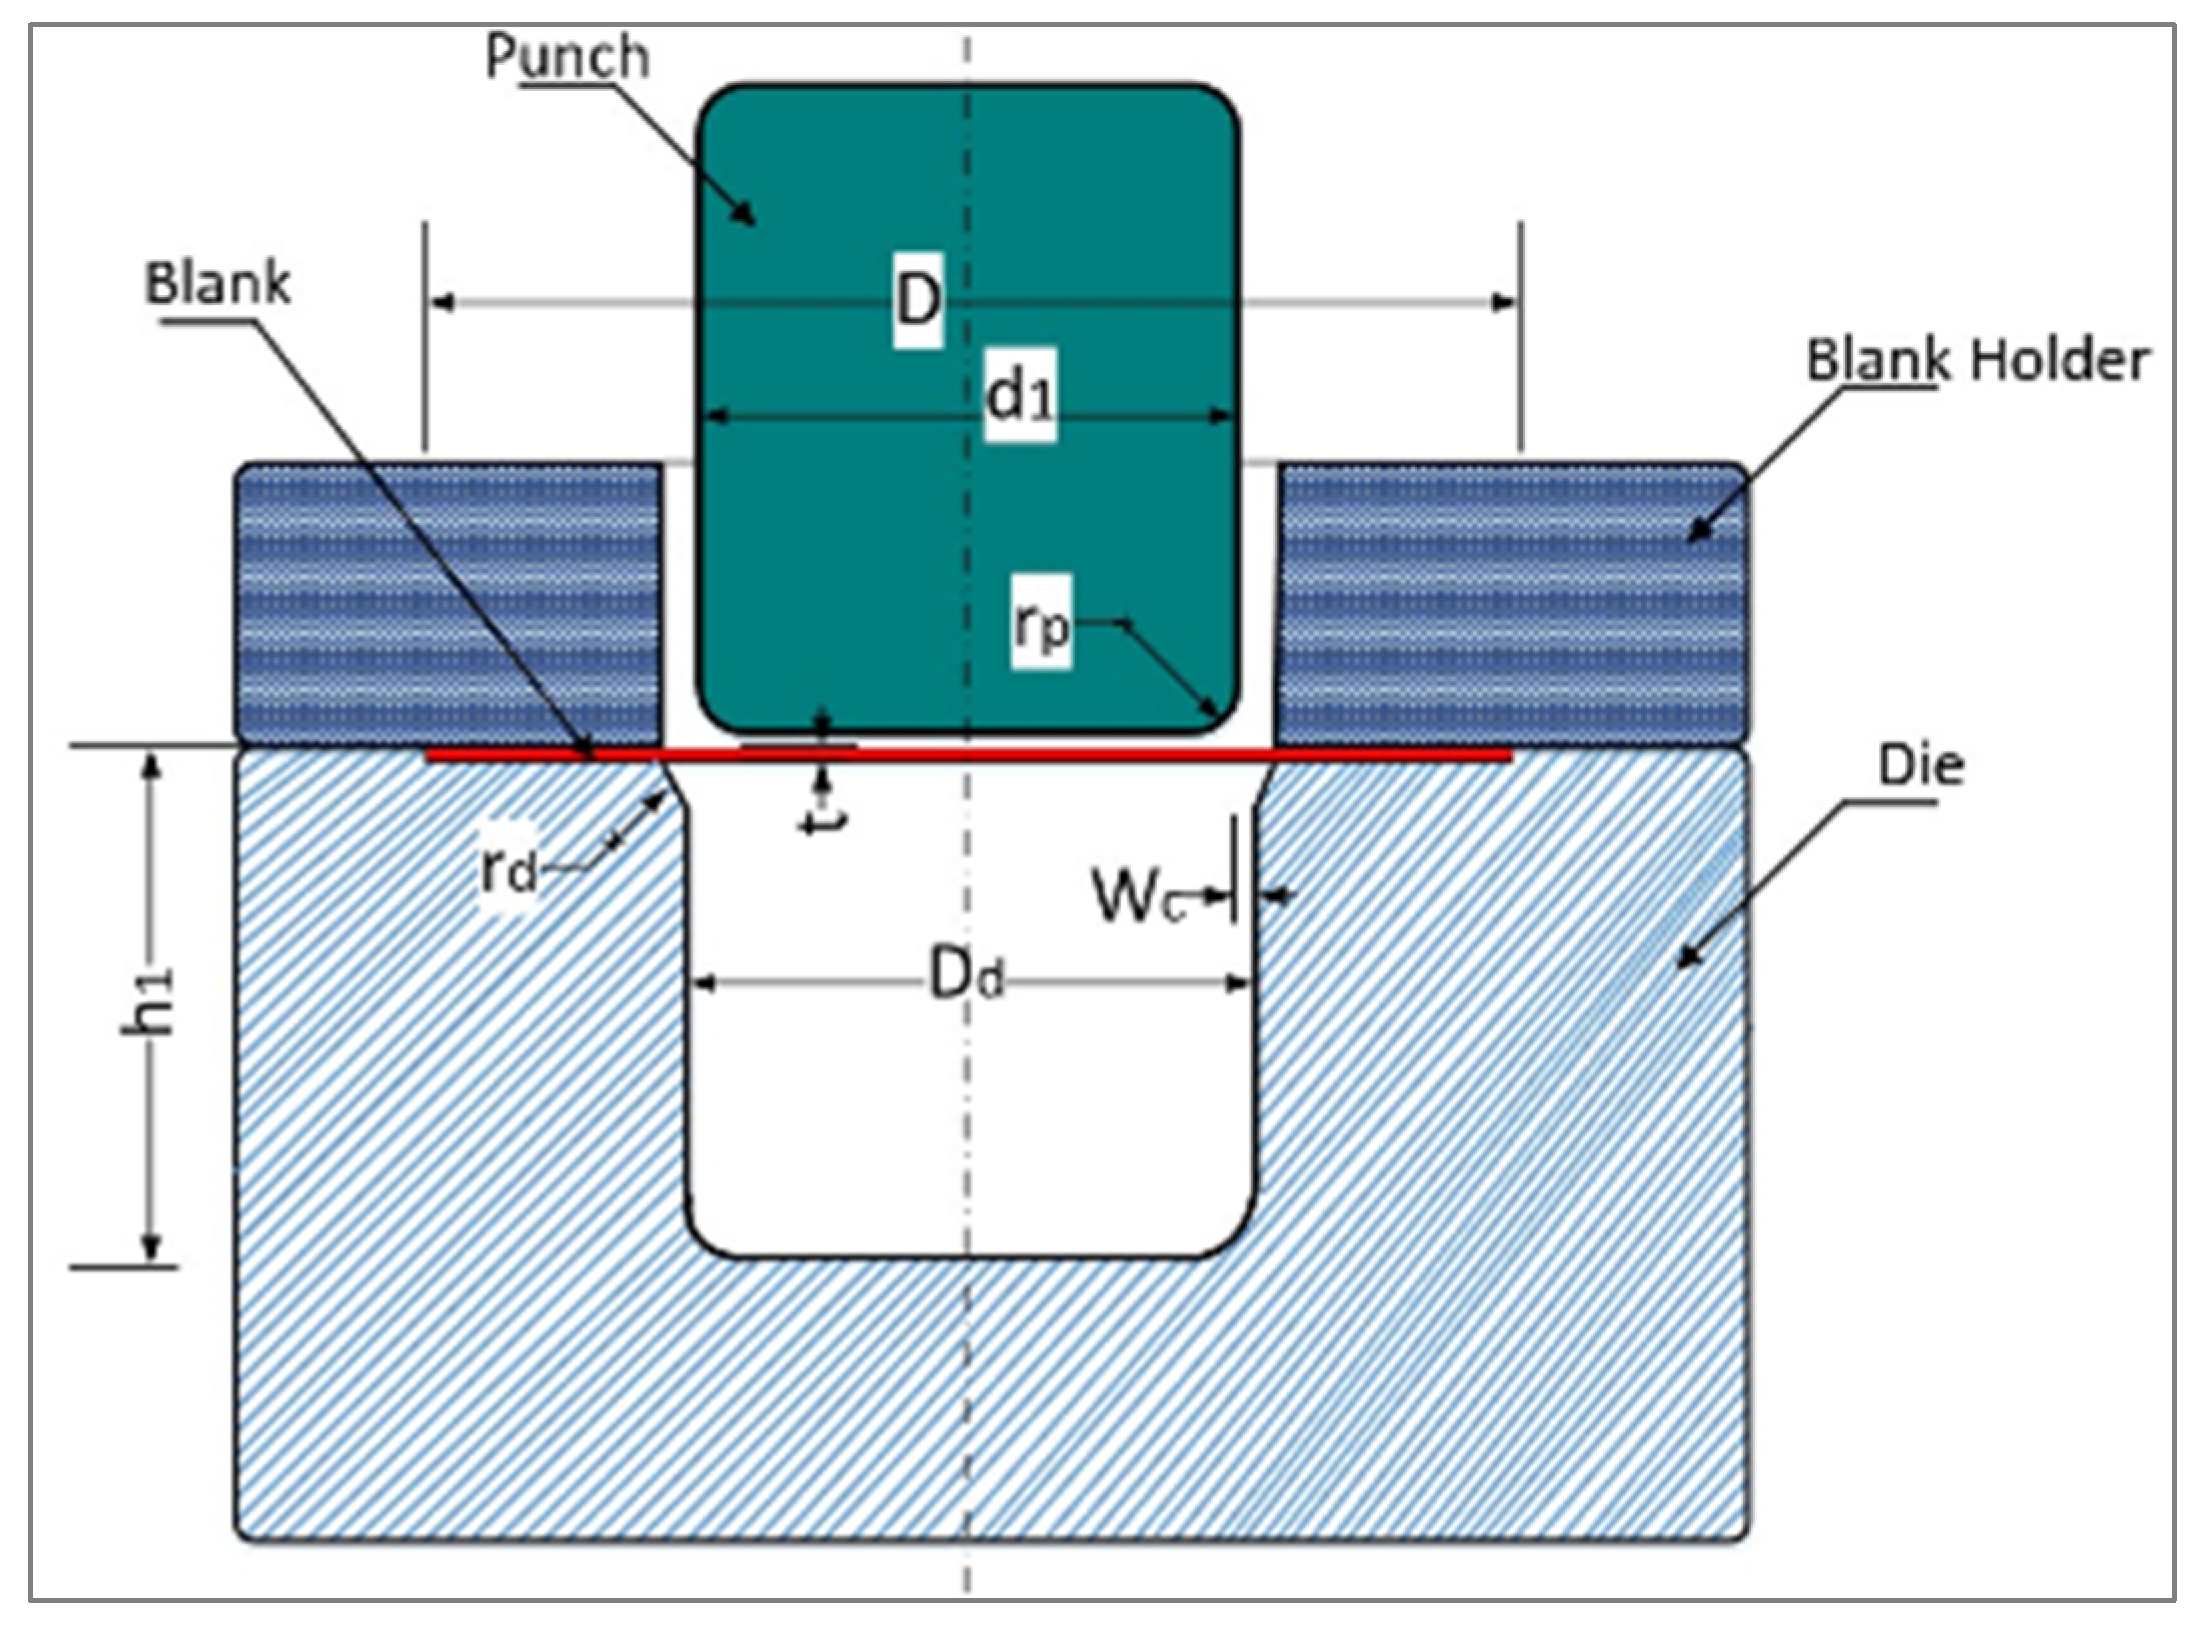
2.1. The Simulation Model
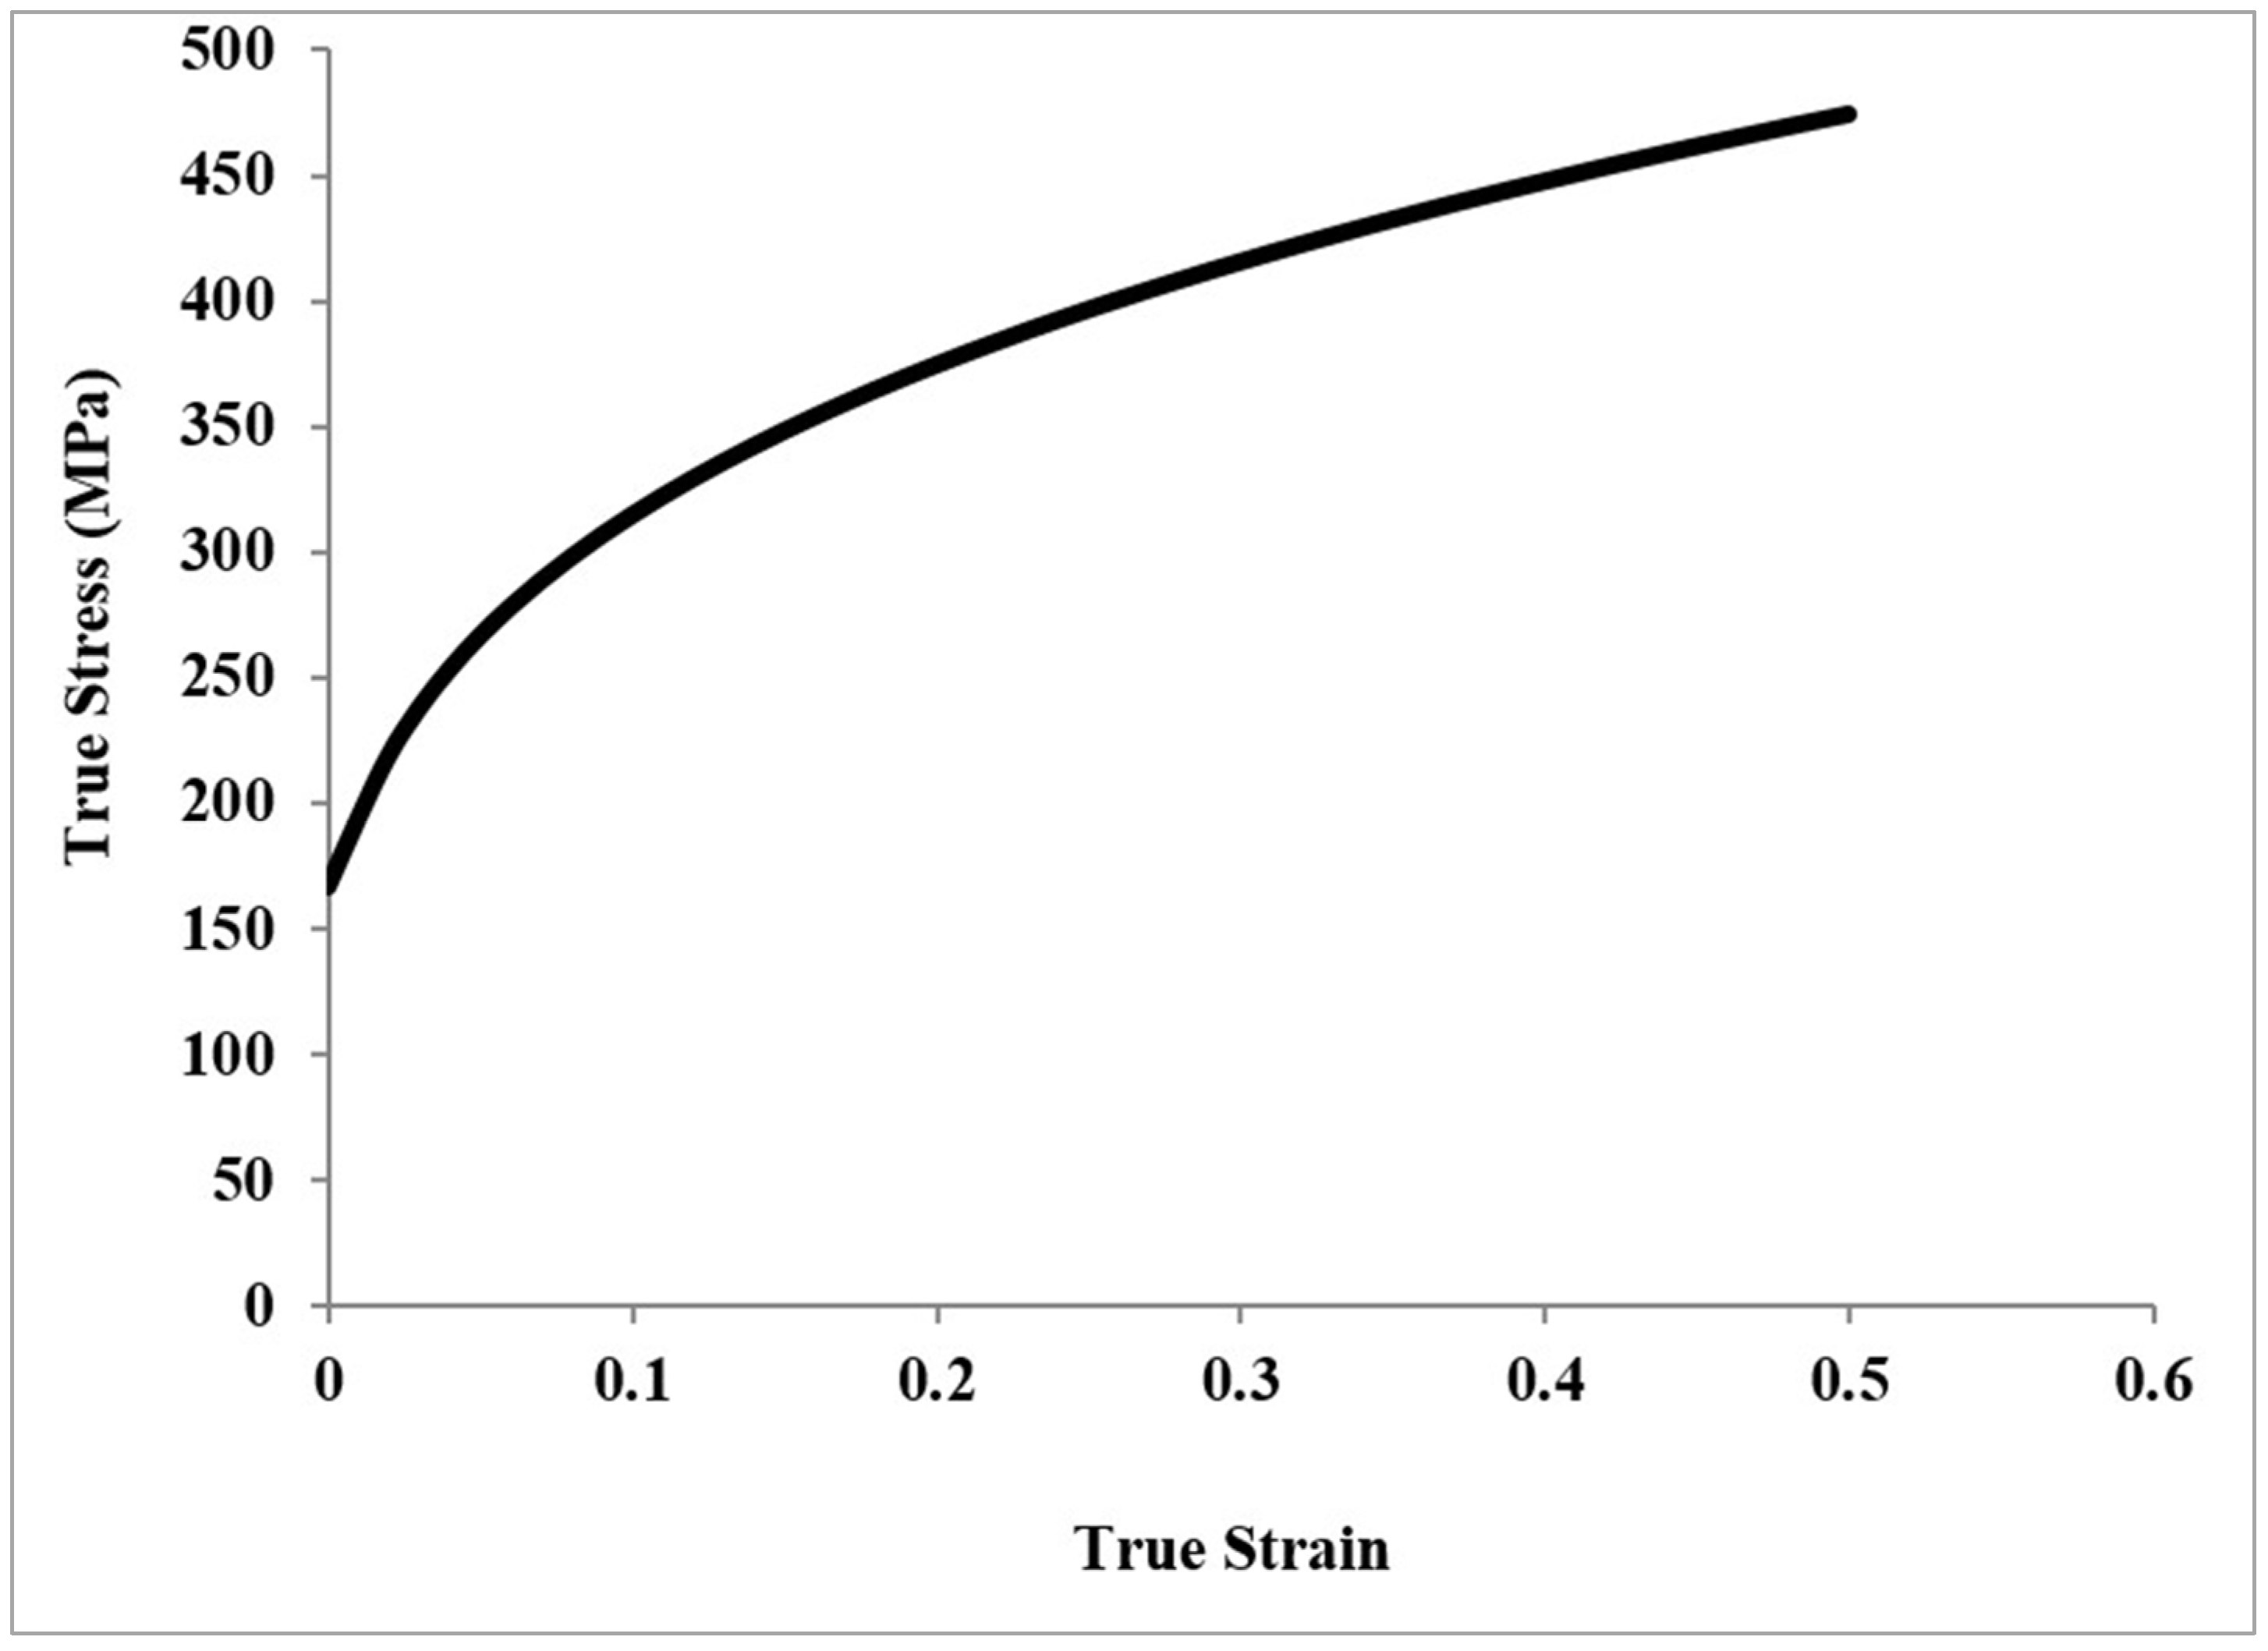
2.2. Material Properties
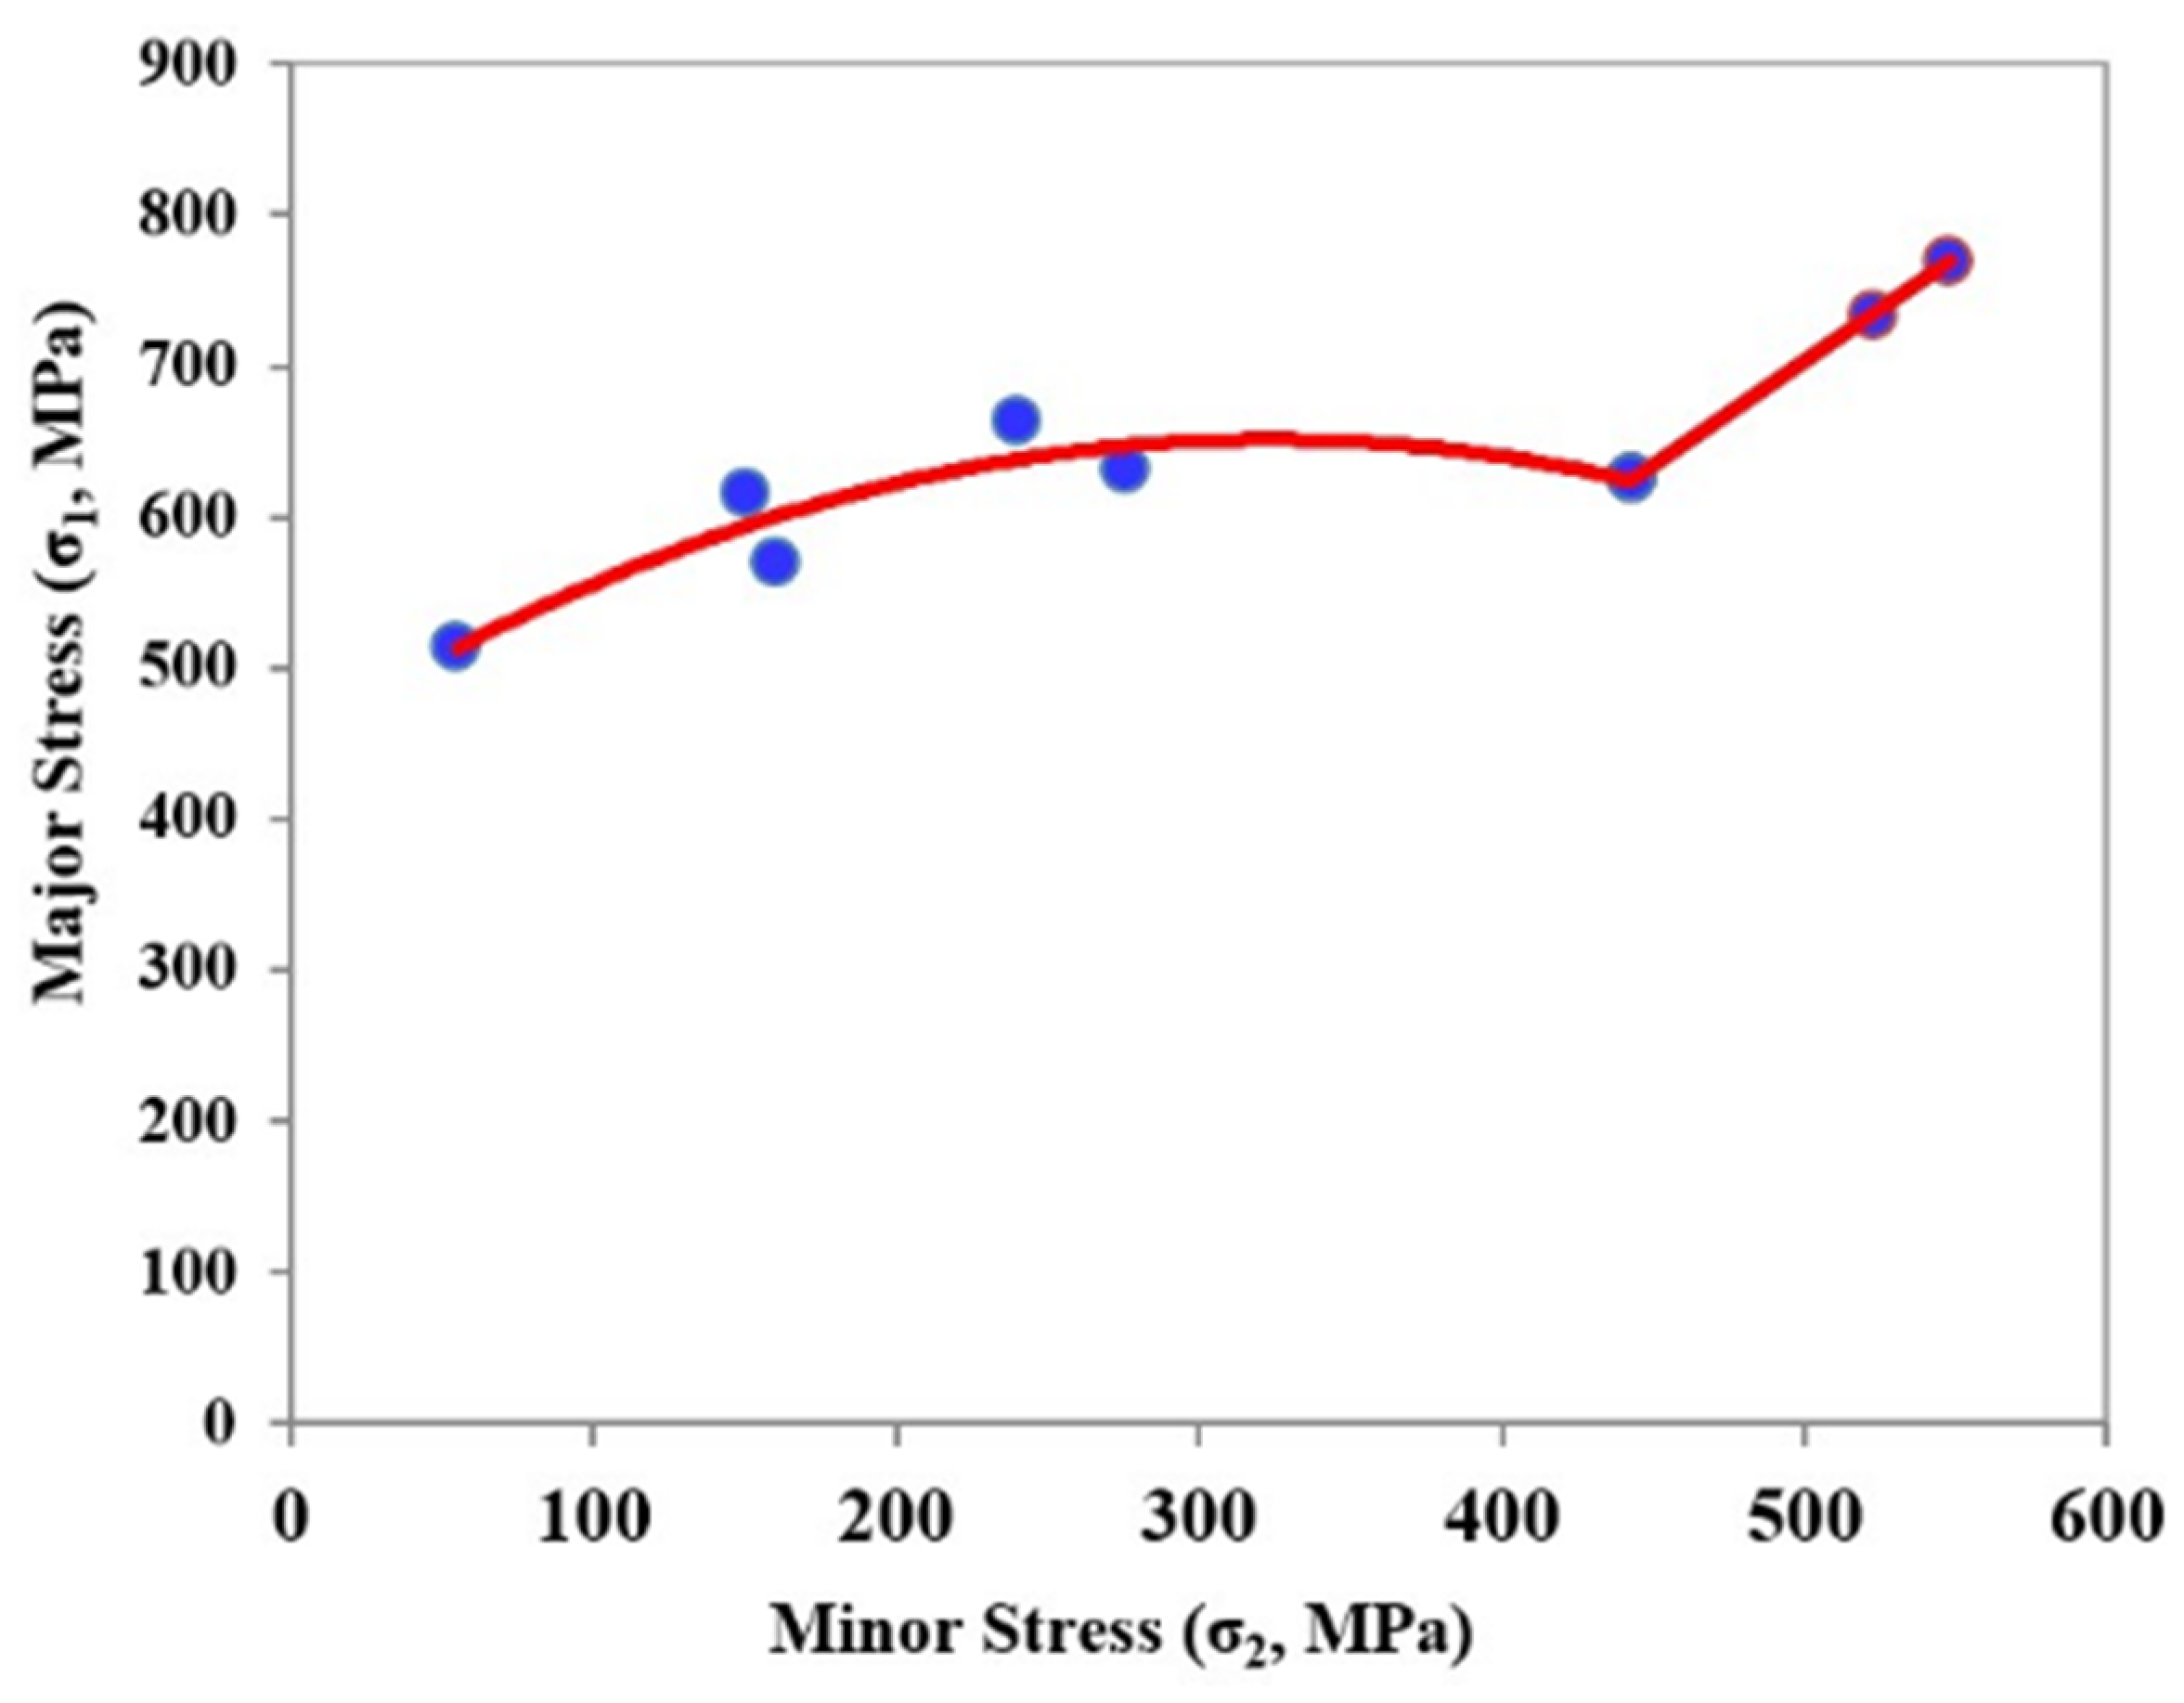
2.3. Forming Limit Stress Diagram (FLSD)
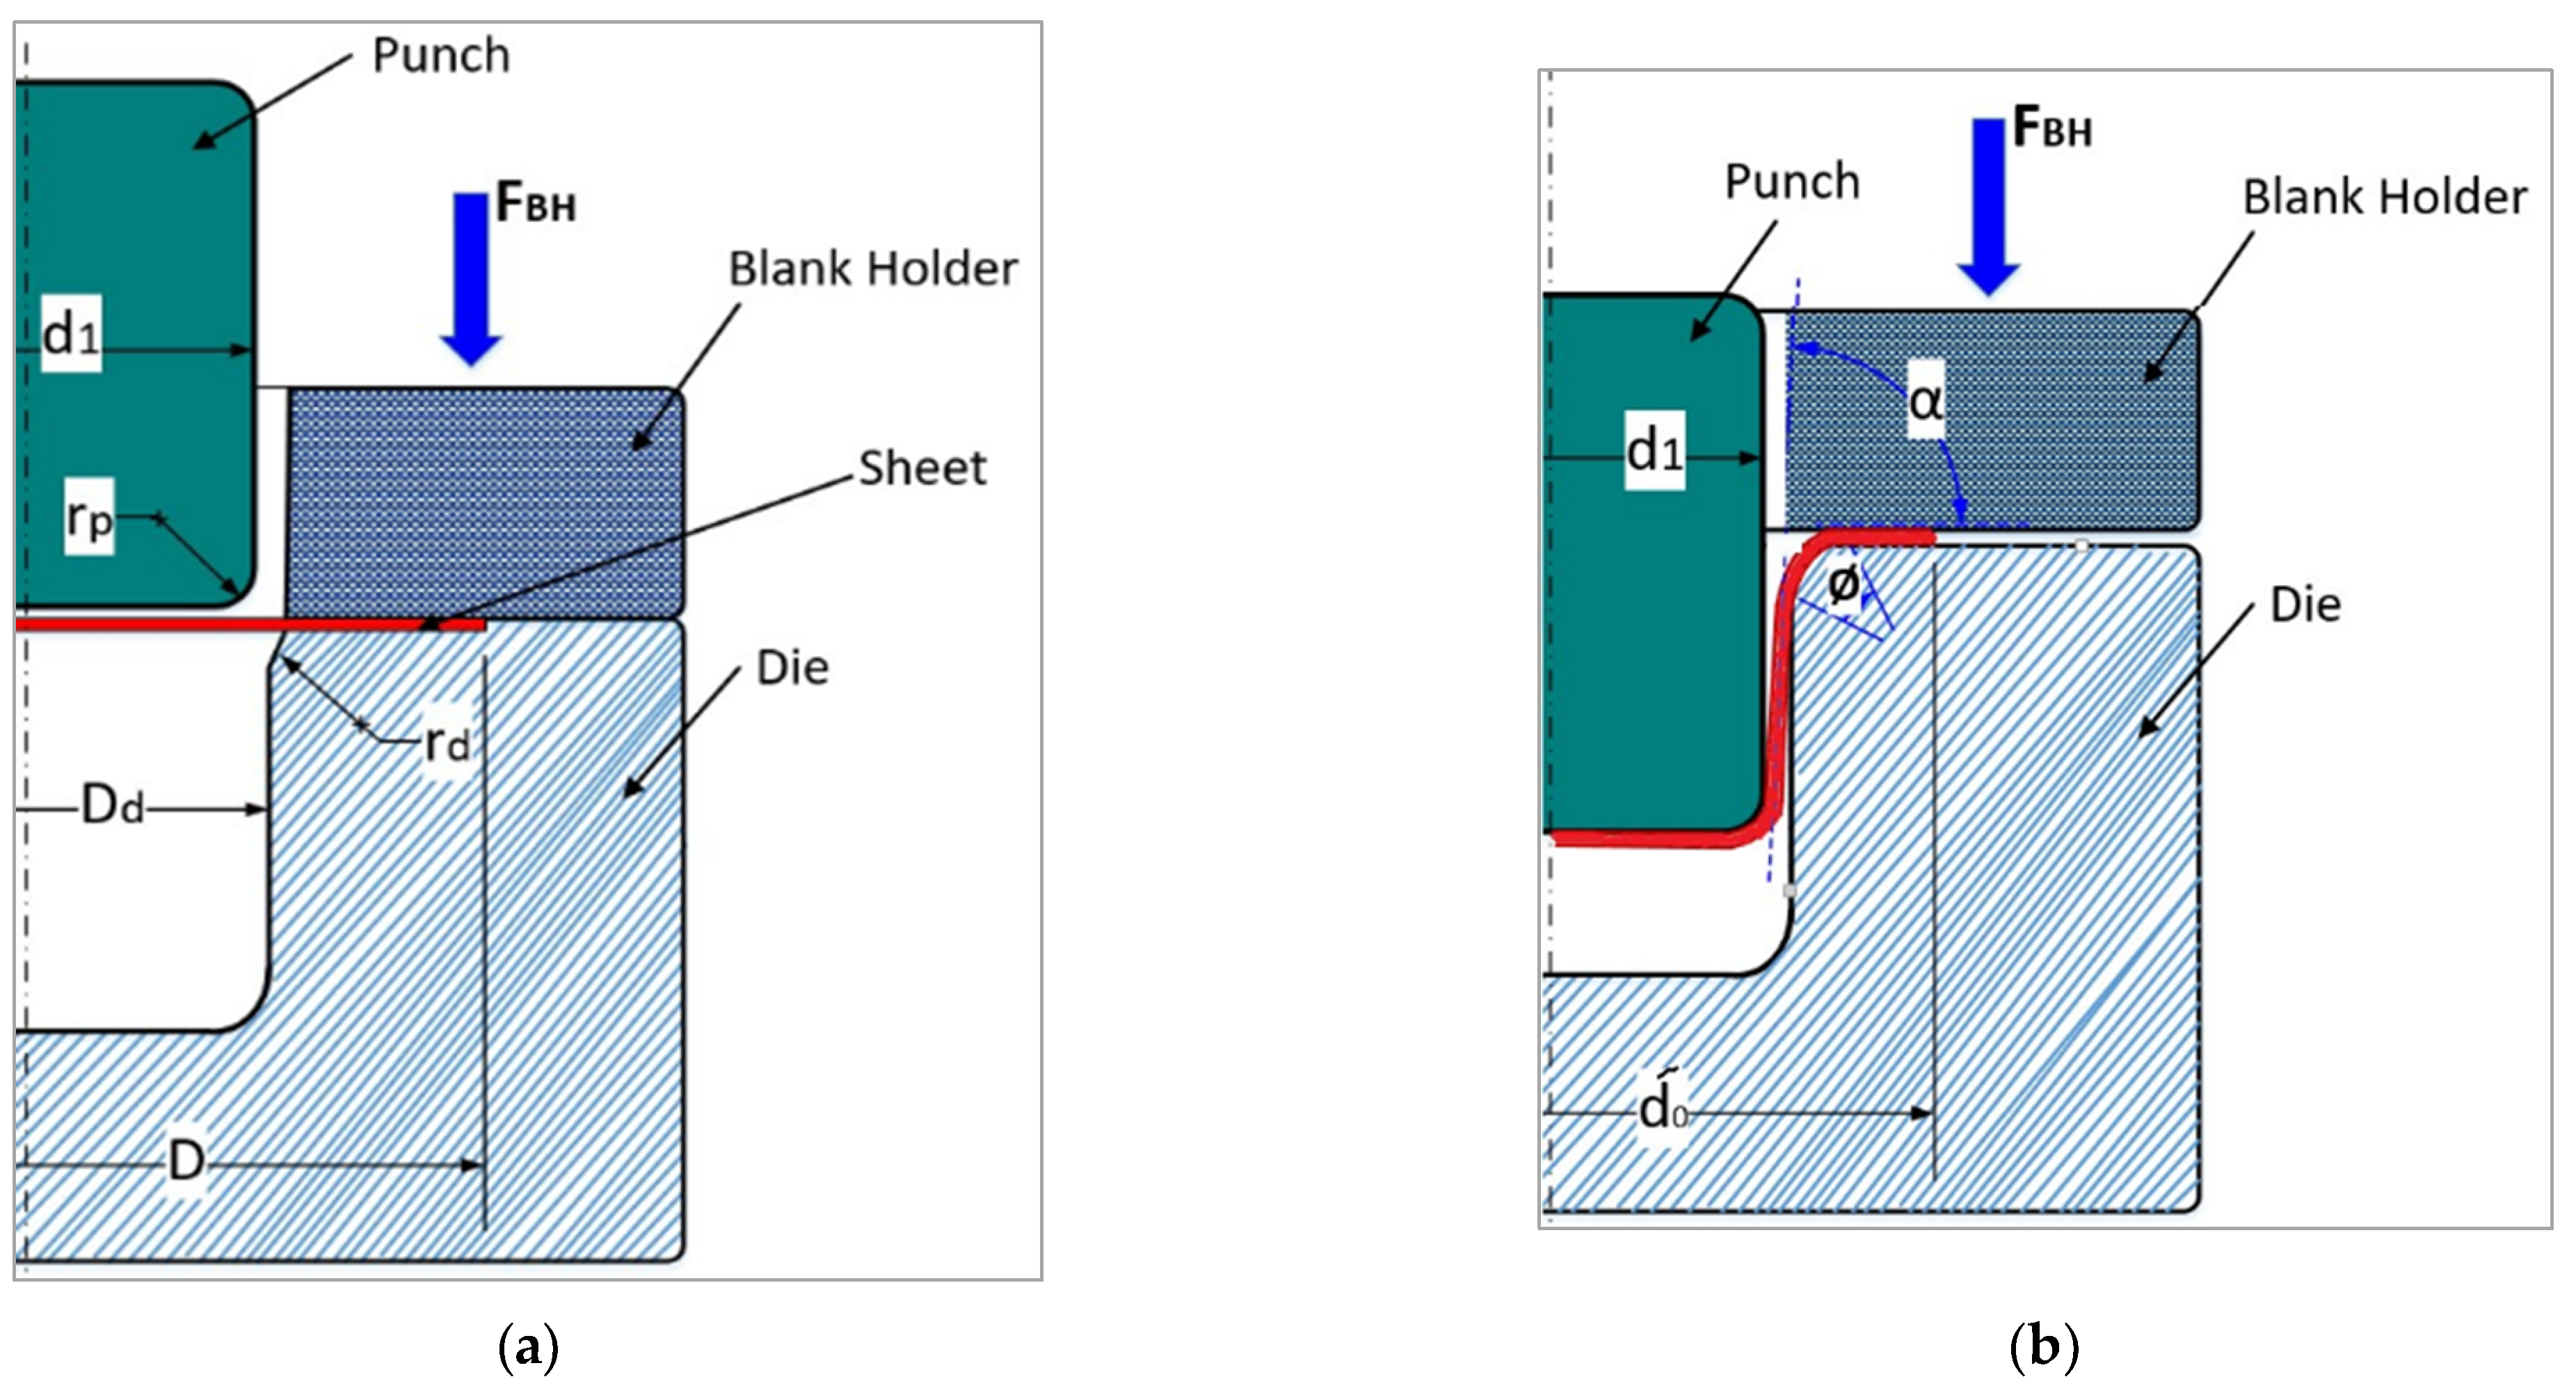
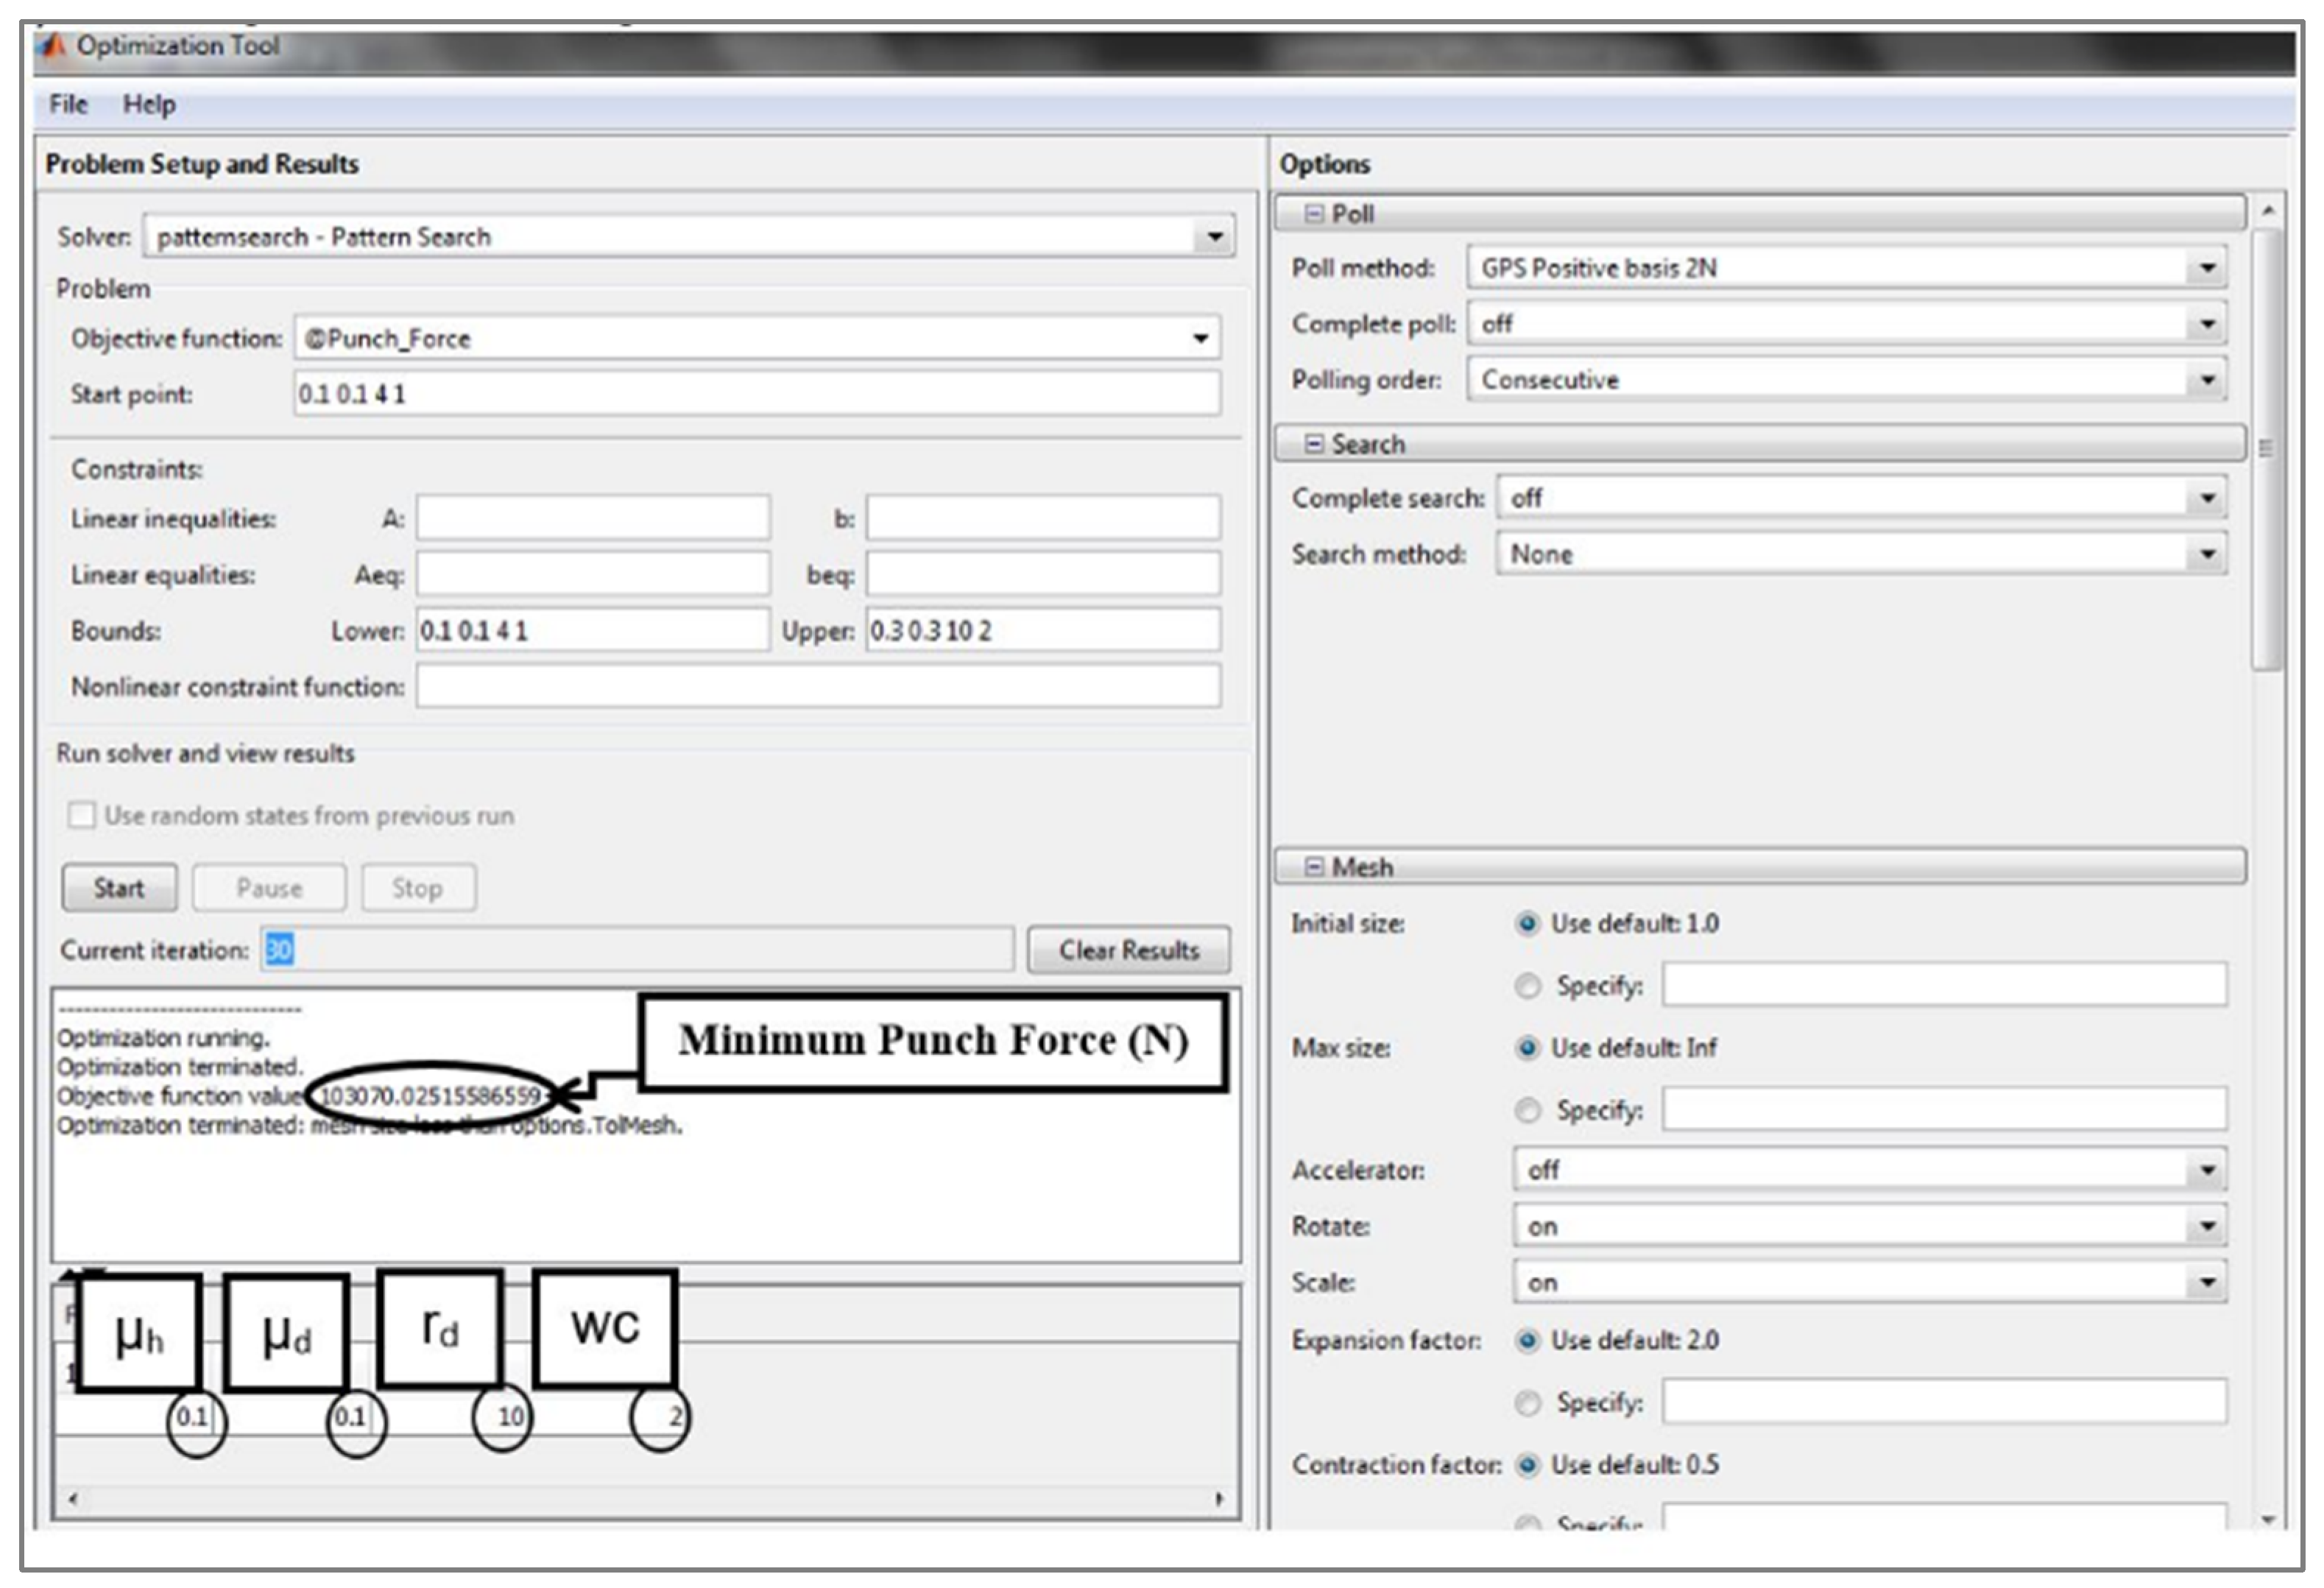
3. Optimization of the Maximum Deep Drawing Force (Fdmax)
4. Determining the Mean Flow Stresses ( and )
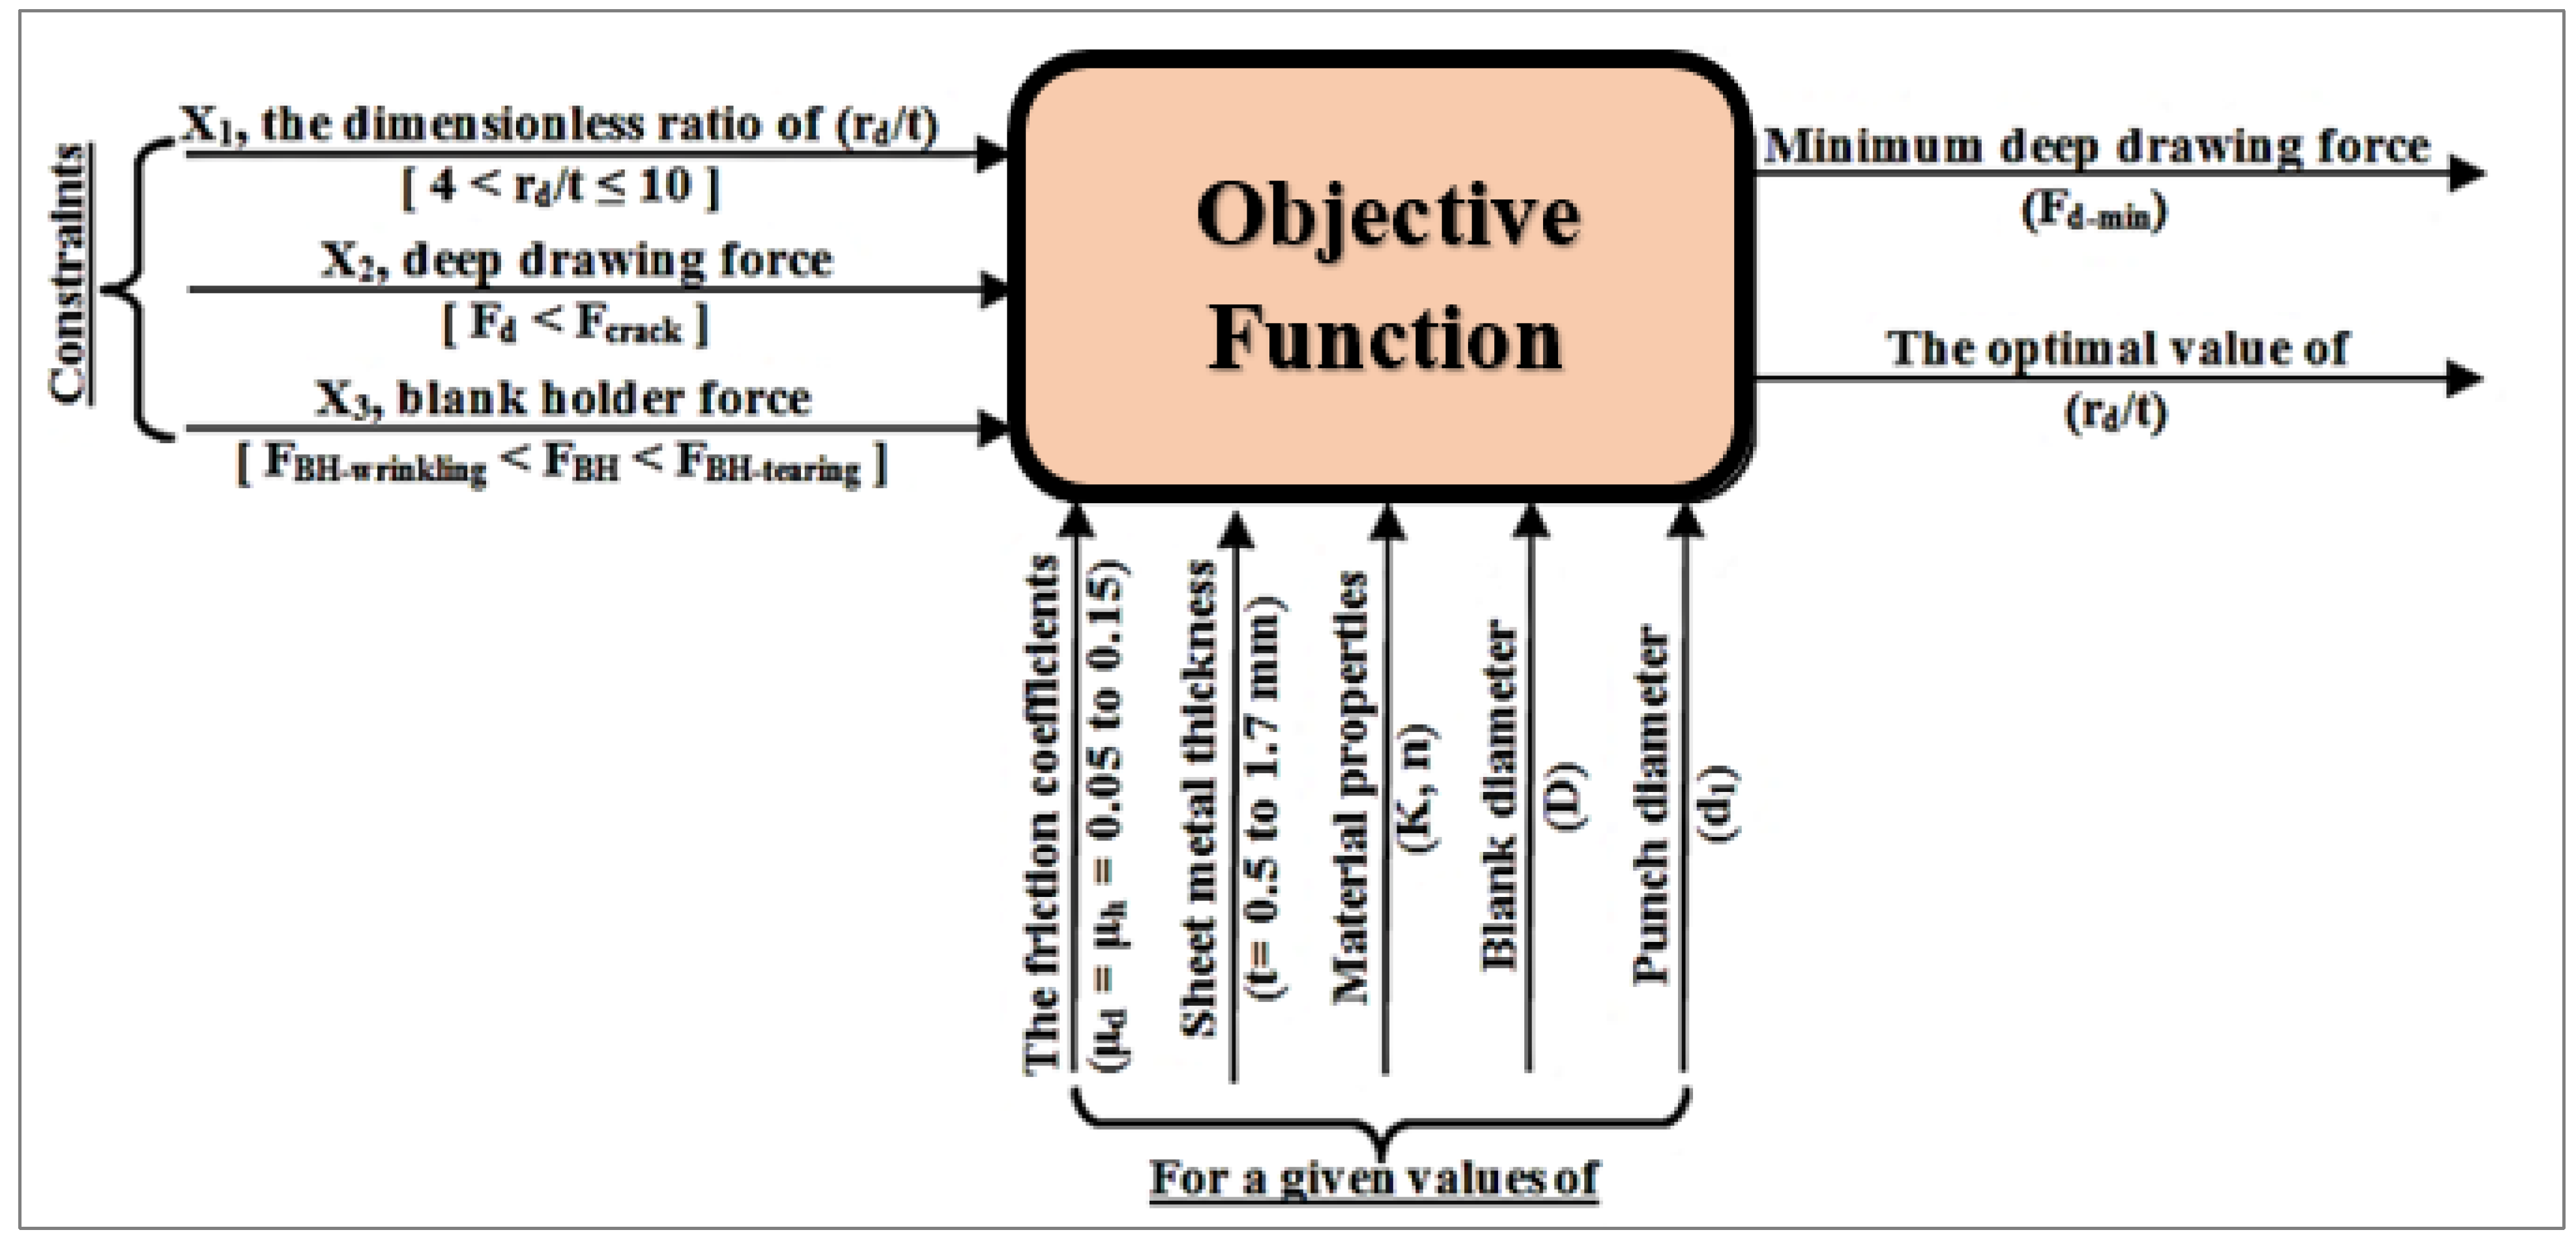
5. Objective Function
6. Cracking Force
7. Constraints
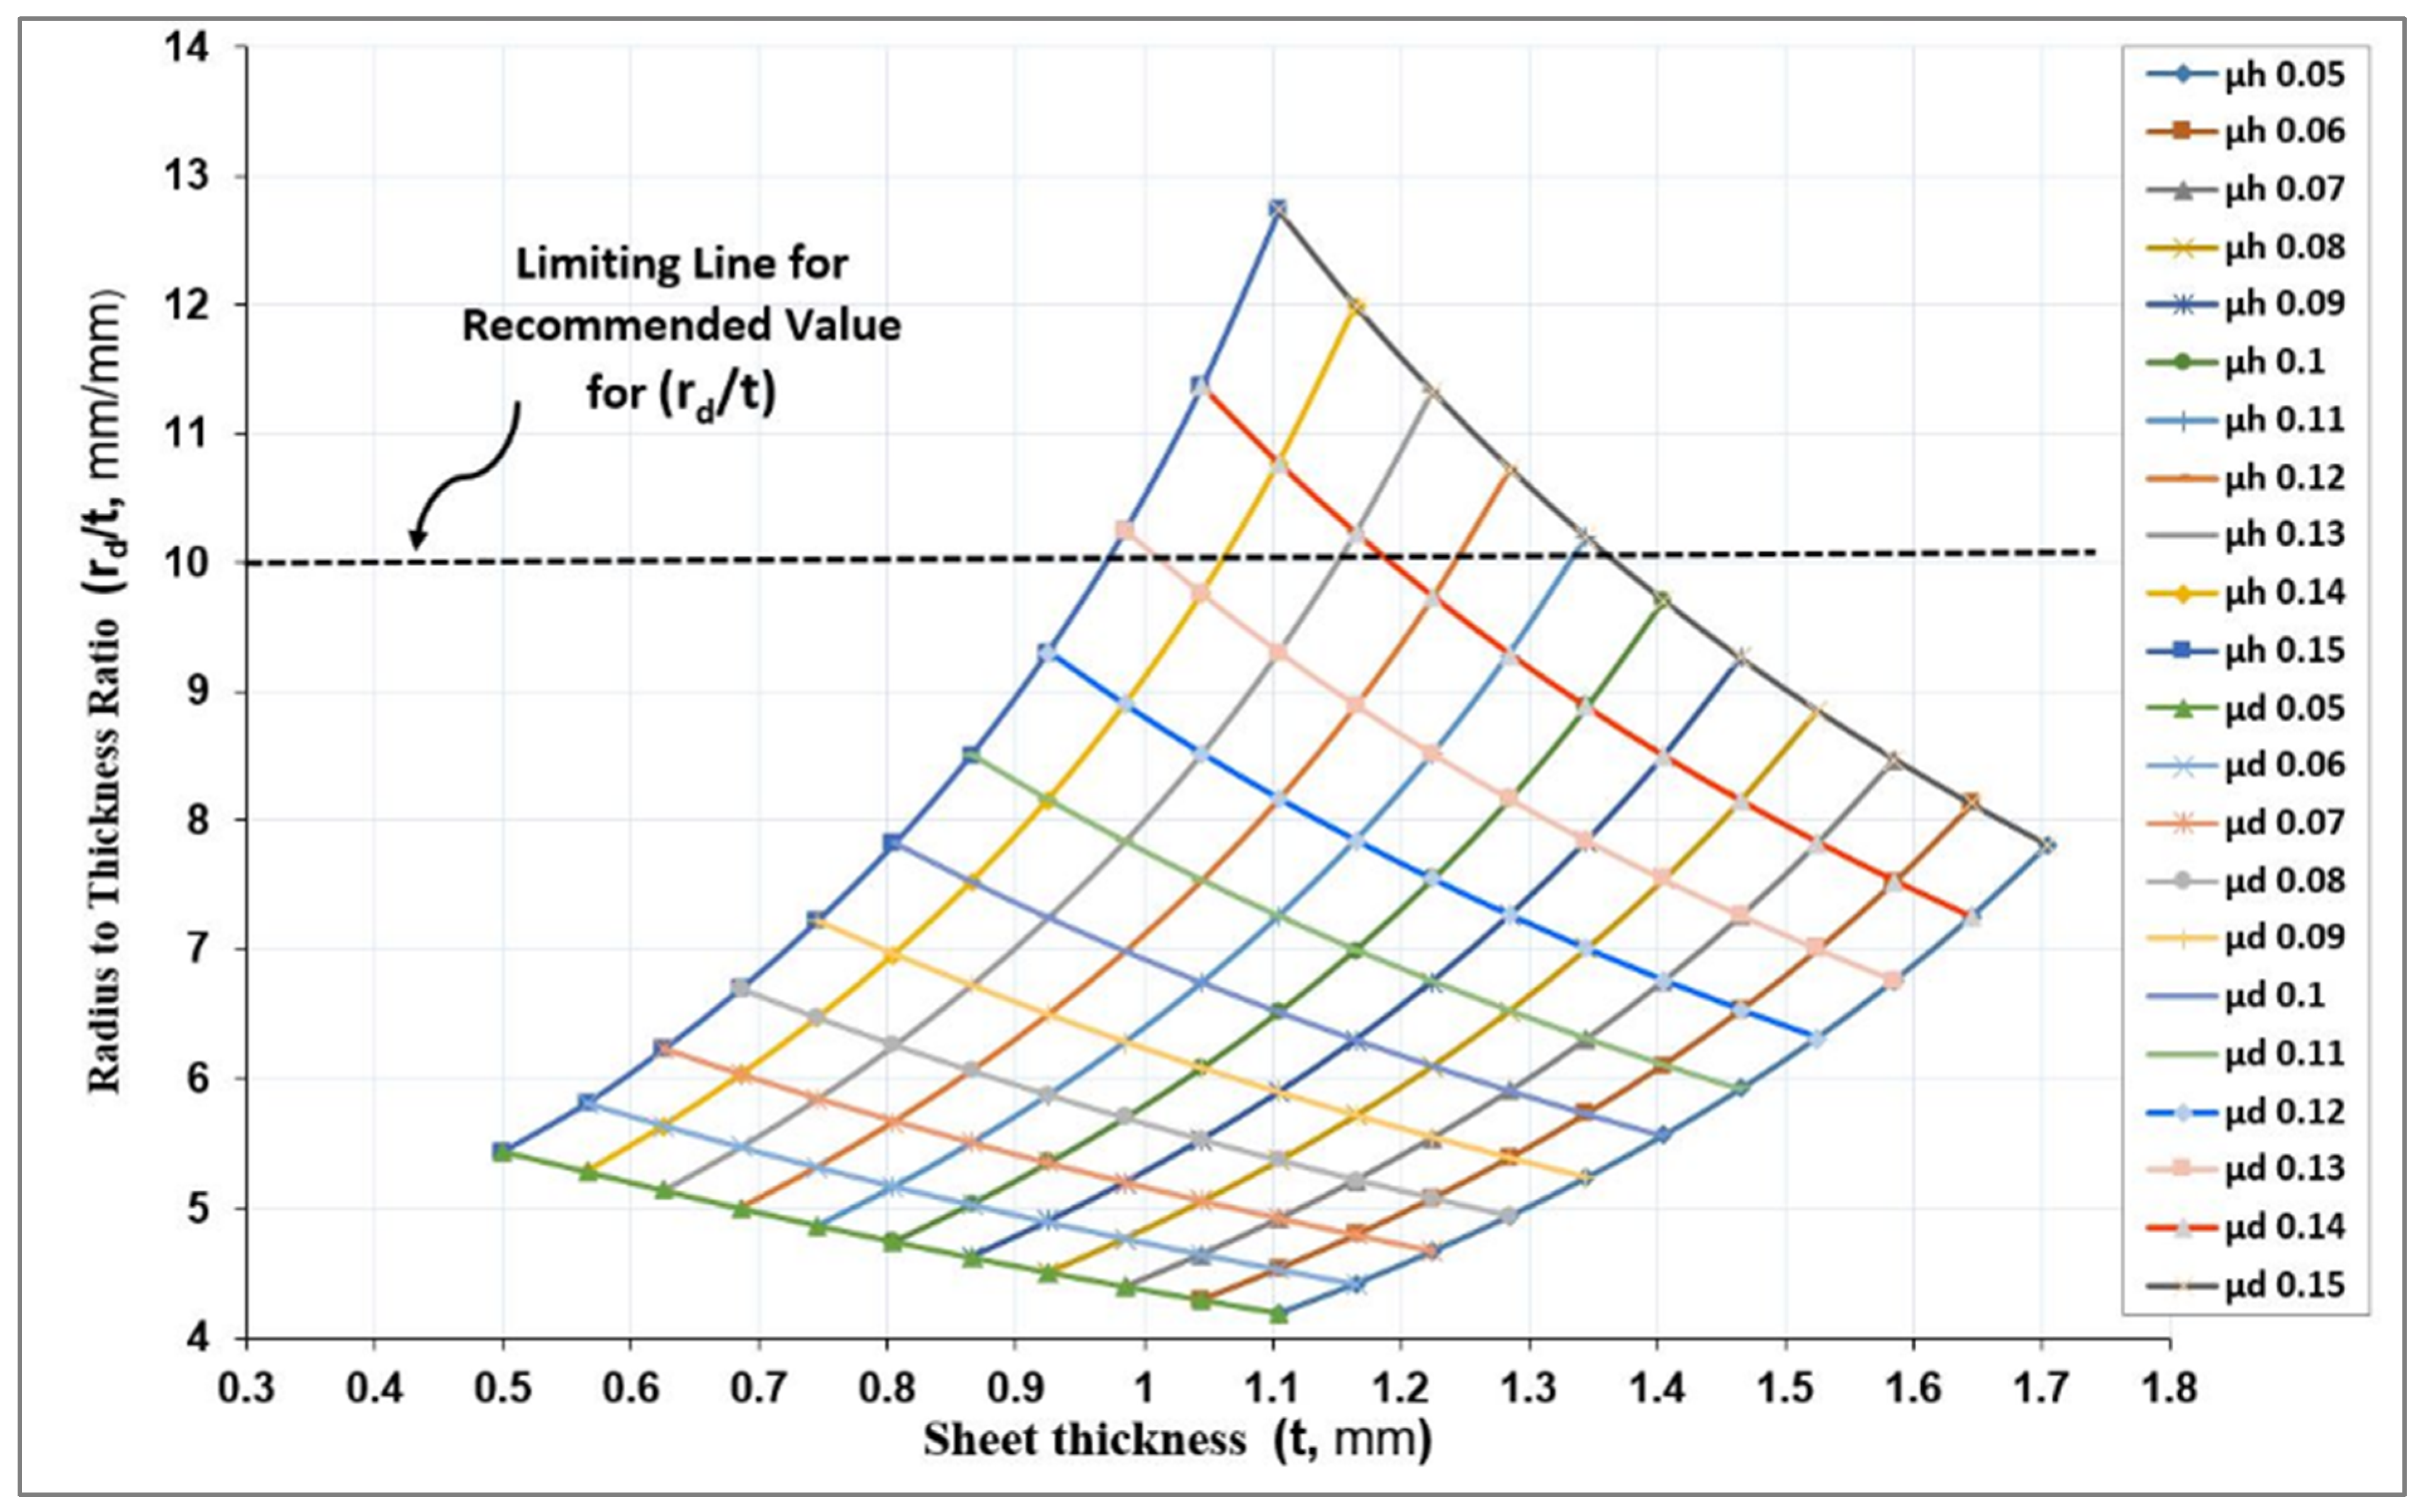
8. Results and Discussion
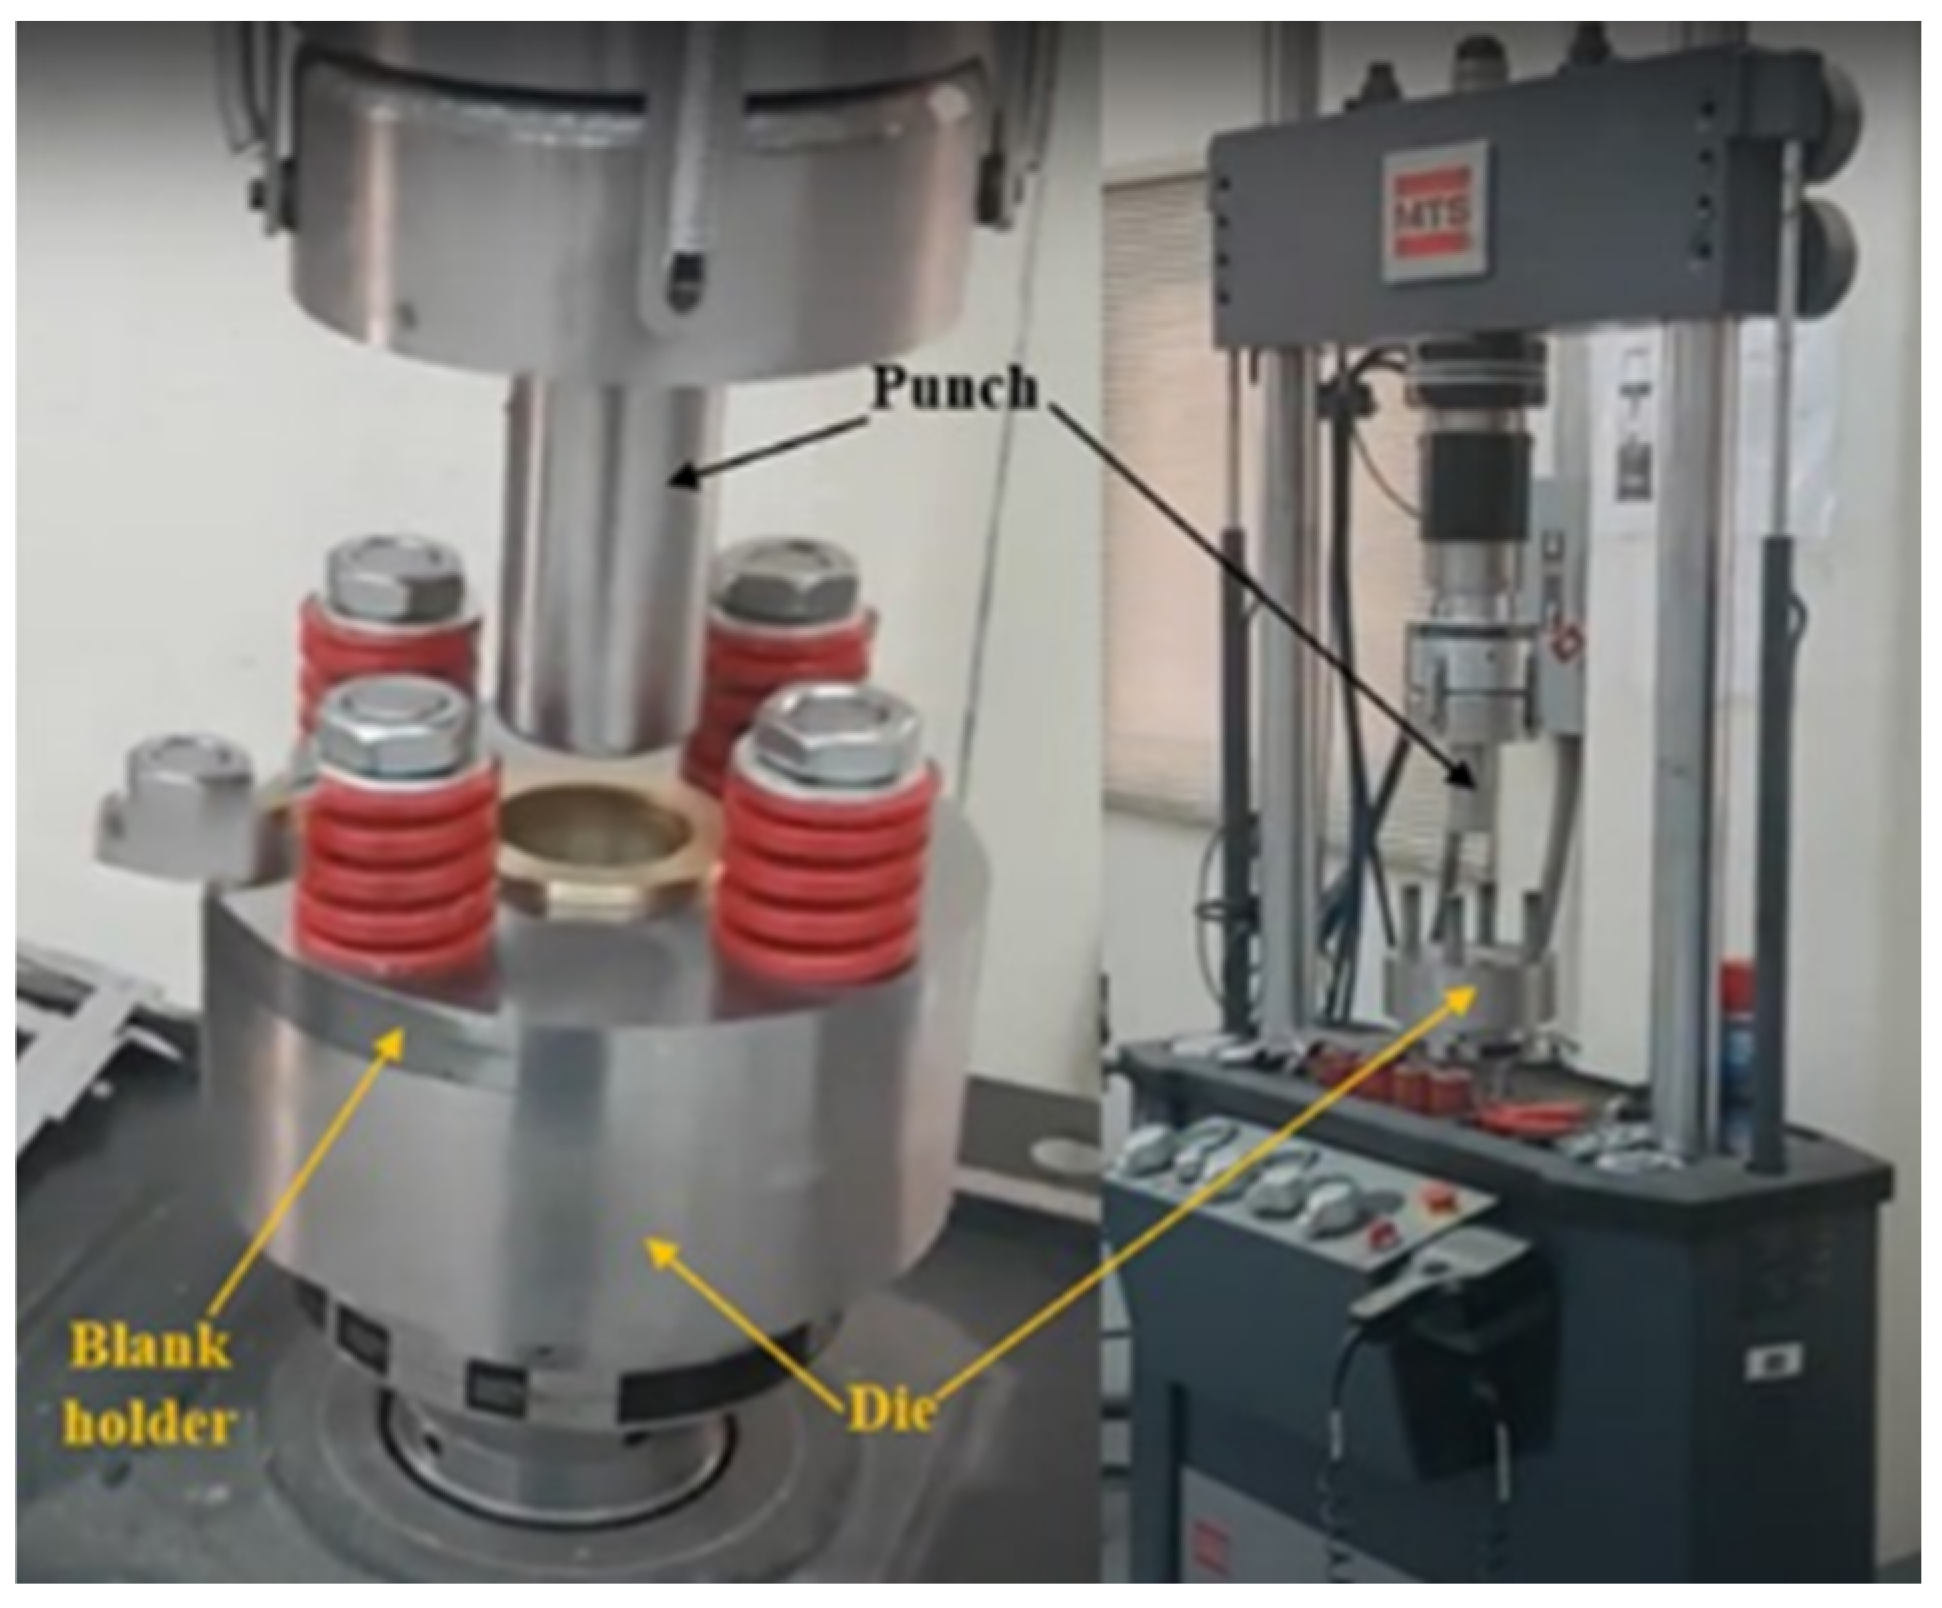
9. Experimental Work
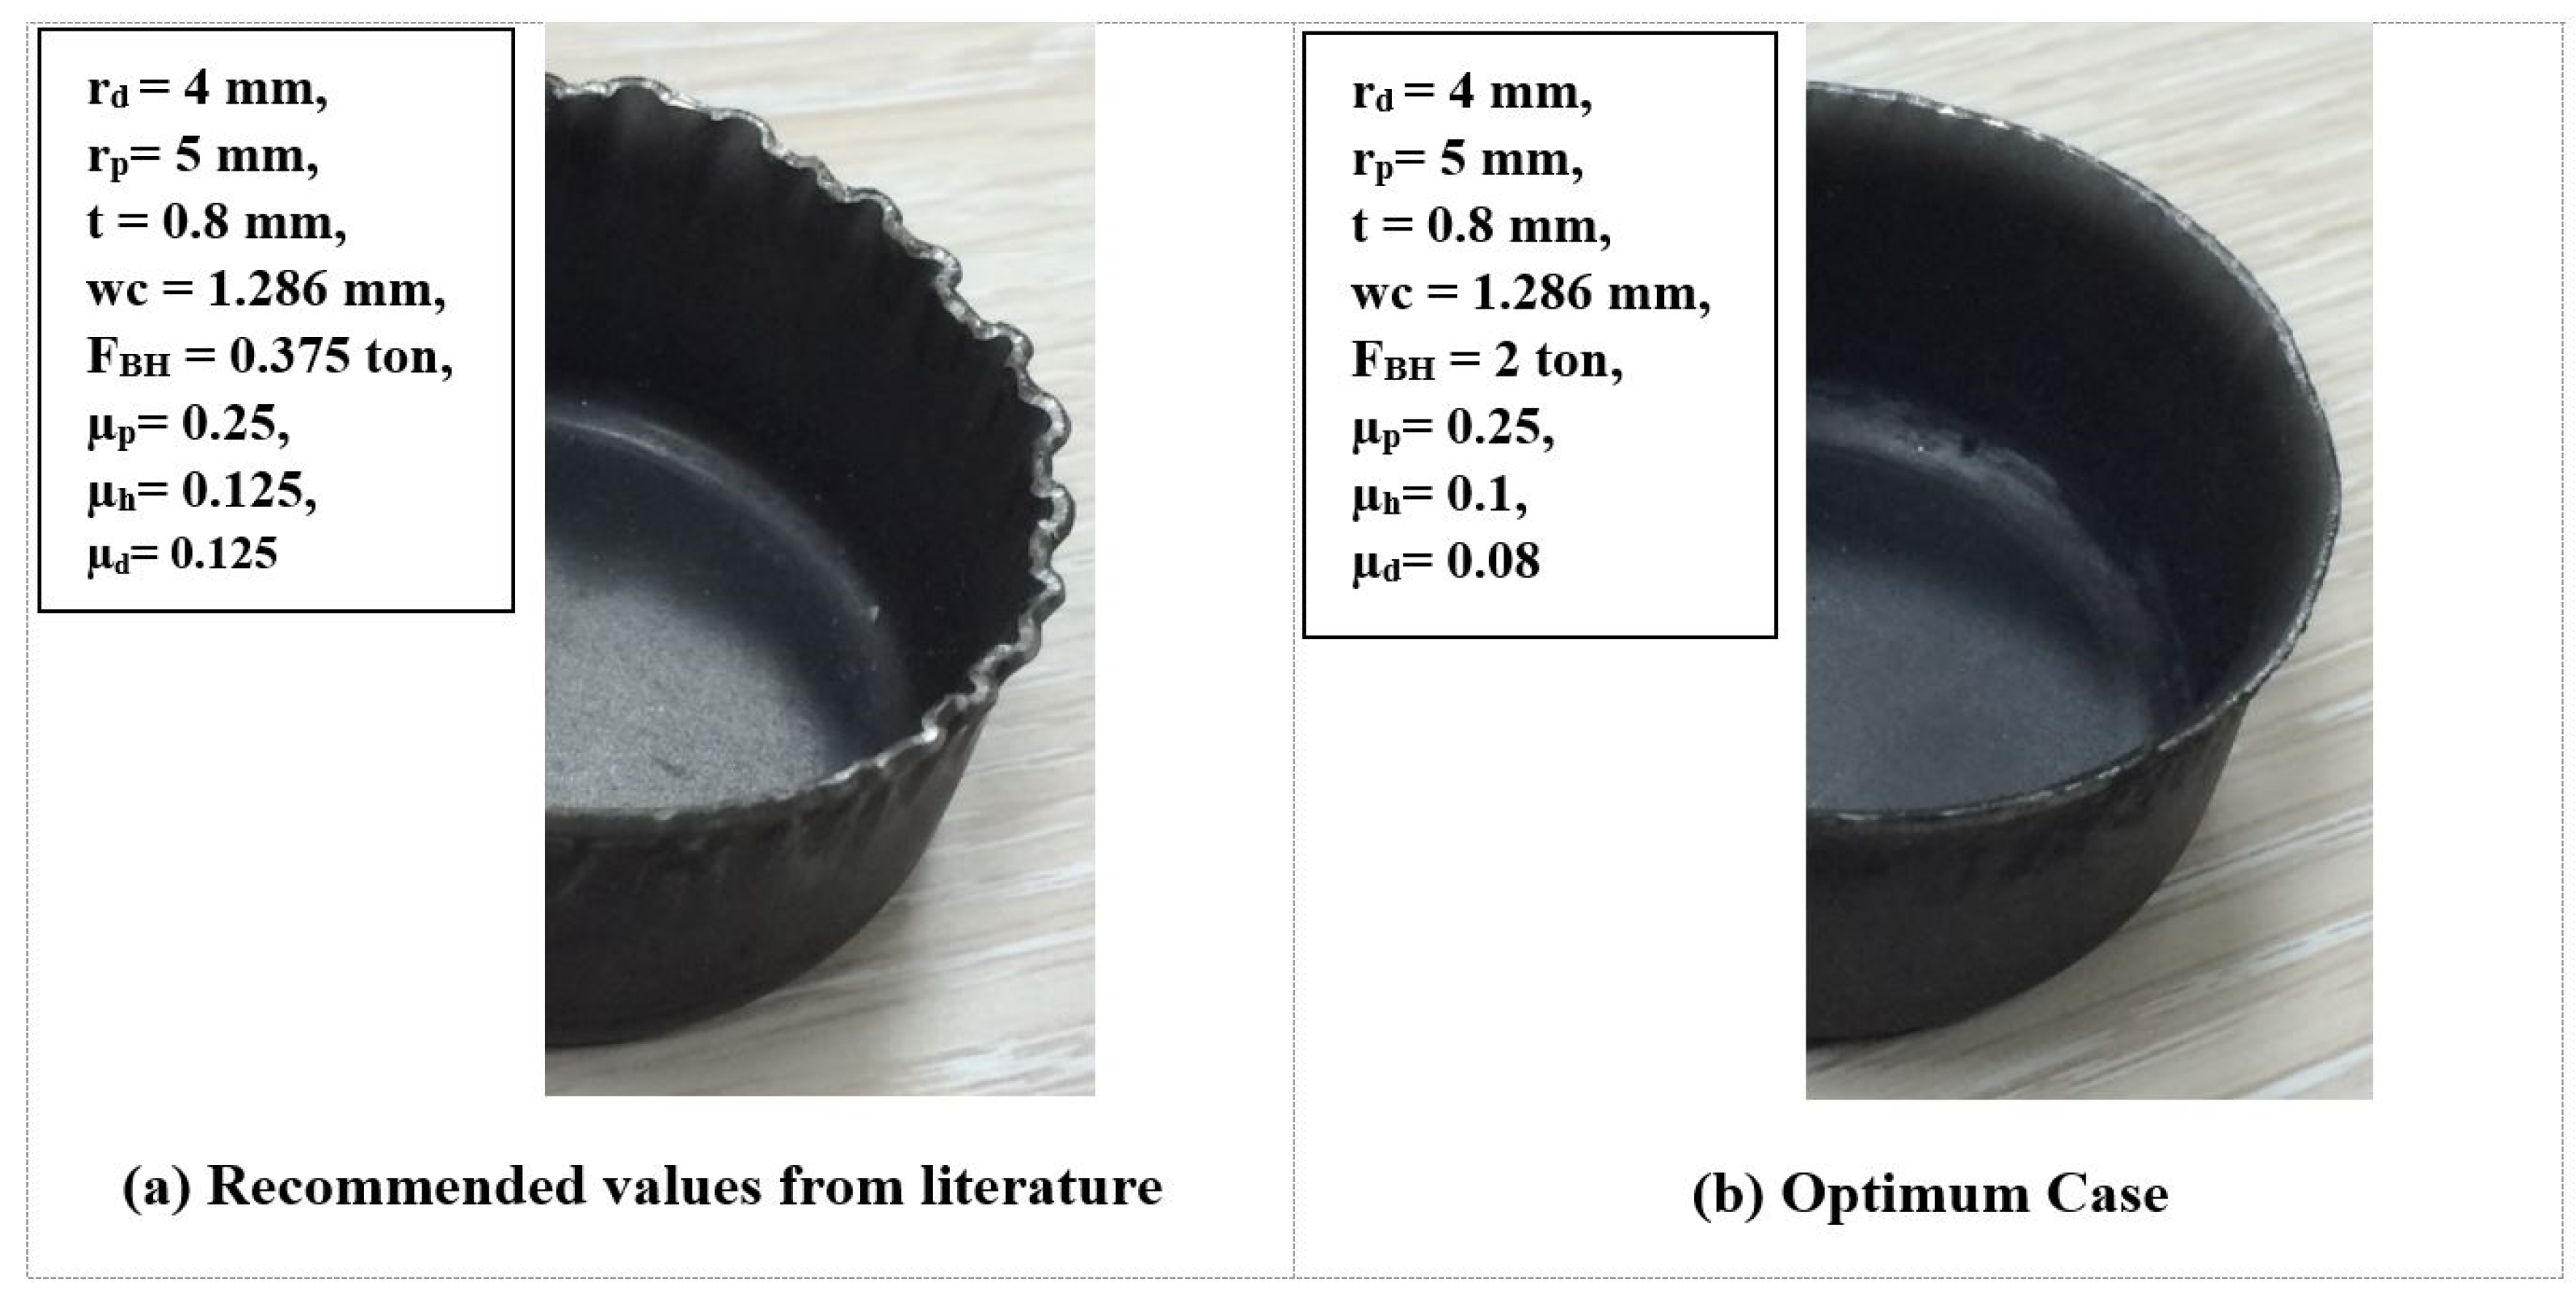
10. Validation
11. Conclusions
Author Contributions
Funding
Informed Consent Statement
Conflicts of Interest
Nomenclature
| Term | Definition |
| Fd | Punch load (deep drawing force) |
| σ1 | The principal stress (major stress) |
| FBH | Blank holder load (force) |
| μ | Friction coefficient |
| h | Drawing cup height (punch stroke) |
| t | Sheet metal thickness |
| n | The exponent of the strain hardening |
| wc | Radial clearance |
| μp | Friction coefficient between punch and blank |
| μh | Friction coefficient between holder and blank |
| μd | Friction coefficient between die and blank |
| E | Young’s modulus |
| υ | Poisson’s ratio |
| x, y, and z | The principal anisotropy axes |
| σ2 | Minor stress |
| σ0 | Yield stress in the rolling direction (0°) of the sheet metal |
| σf.m.die-ring | The mean flow stress in the die ring of the drawn cup (=σf.m.II) |
| dF.max | The outside diameter of the flange when the drawing force is a maximum |
| α and ϕ | Angles at the maximum deep drawing force |
| The instantaneous sheet metal thickness | |
| rM | The radius of curvature of the neutral fiber of the sheet metal |
| The mean bending strain of the cross-section | |
| The total mean bending strain | |
| The corresponding natural strain | |
| σf.2max | The maximum flow stress at point 2 |
| UTS | The ultimate tensile strength |
| FBH-tearing | Blank holder force which caused tearing in the wall of the cup |
| K | The coefficient of the strain hardening |
| r | The coefficient of normal anisotropy |
| D | Blank diameter |
| d1 | Punch diameter |
| rp | Punch nose radius |
| dD | Die diameter |
| rd | Die shoulder radius |
| ρ | Density |
| σy0 | Yield strength |
| r0 | The coefficient of normal anisotropy in the rolling direction (0°) of the sheet metal |
| r45 | The coefficient of normal anisotropy in (45°) to the rolling direction of the sheet metal |
| r90 | The coefficient of normal anisotropy in (90°) to the rolling direction of the sheet metal |
| F, G, H, L, M, and N | Factors particular to anisotropic condition of the material |
| σf.m.flange | The mean flow stress in the flange of the drawn cup (=σf.m.I) |
| dm | The mean diameter of the cup |
| The instantaneous blank diameter | |
| Fd-max | Maximum deep drawing force |
| εθ | Circumferential strain |
| εt | Thickness strain |
| εr | Radial strain |
| εe | The equivalent uniaxial strain |
| εs | The incremental strain of the outside fiber of the sheet metal |
| σf.1-max | The maximum flow stress at point 1 |
| σf.3-max | The maximum flow stress at point 3 |
| Fcrack | The cracking force |
| FBH-wrinkling | Blank holder force which caused wrinkling in the flange of the cup |
References
- Hattalli, V.L.; Srivatsa, S.R. Sheet metal forming processes–recent technological advances. Mater. Today Proc. 2018, 5, 2564–2574. [Google Scholar] [CrossRef]
- Dalong, L.; Yanting, L.; Enlin, Y.; Yi, H.; Feng, L. Theoretical and experimental study of the drawing force under a current pulse. Int. J. Adv. Manuf. Technol. 2018, 97, 1047–1051. [Google Scholar] [CrossRef]
- Nee, A.Y.C. (Ed.) Handbook of Manufacturing Engineering and Technology; Springer: London, UK, 2015. [Google Scholar]
- Merklein, M.; Wieland, M.; Lechner, M.; Bruschi, S.; Ghiotti, A. Hot stamping of boron steel sheets with tailored properties: A review. J. Mater. Process. Technol. 2016, 228, 11–24. [Google Scholar] [CrossRef]
- Becker, N.; Pöhlandt, K.; Lange, K. Improvement of the plane-strain compression test for determining flow curves. CIRP Ann. 1989, 38, 227–230. [Google Scholar] [CrossRef]
- Pöhlandt, K. Materials Testing for the Metal Forming Industry; Springer Science & Business Media: Berlin/Heidelberg, Germany, 2012. [Google Scholar]
- Hingole, R. Advances in Metal Forming; Springer: Berlin, Germany, 2016. [Google Scholar]
- Zein, H.; El Sherbiny, M.; Abd-Rabou, M. Thinning and spring back prediction of sheet metal in the deep drawing process. Mater. Des. 2014, 53, 797–808. [Google Scholar] [CrossRef]
- Grote, K.-H.; Antonsson, E.K. (Eds.) Springer Handbook of Mechanical Engineering; Springer: New York, NY, USA, 2009; Volume 10. [Google Scholar]
- Gharib, H.H.; Wifi, A.S.; Younan, M.Y.; Nassef, A.O. Blank holder force optimization strategy in deep drawing process. Int. J. Comput. Mater. Sci. Surf. Eng. 2007, 1, 226–241. [Google Scholar]
- El Sherbiny, M.; Zein, H.; Abd-Rabou, M. Thinning and residual stresses of sheet metal in the deep drawing process. Mater. Des. 2014, 55, 869–879. [Google Scholar] [CrossRef]
- Kunze, T.; Mousavi, A.; Stucky, T.; Böttcher, F.; Roch, T.; Schomäcker, M.; Brosius, A. Tool Optimization for Dry Forming Applications. In Proceedings of the “A” Coatings—12th International Conference in Manufacturing Engineering, Hannover, Germany, 31 March–1 April 2016. [Google Scholar]
- Milenija, S. Significance and limitations of variable blank holding force application in deep drawing process. Tribol. Ind. 2005, 27, 48. [Google Scholar]
- Jähnig, T.; Mousavi, S.A.; Roch, T.; Beyer, E.; Lasagni, A.F.; Brosius, A. Macro-and microstructuring of deep drawing tools for dry forming processes. Dry Met. Form. Open Access J. 2020, 81, 30–68. [Google Scholar] [CrossRef]
- Wang, H.; Shen, X. A novel hydrodynamic deep drawing utilizing a combined floating and static die cavity. Int. J. Adv. Manuf. Technol. 2021, 114, 829–839. [Google Scholar] [CrossRef]
- Roitero, E.; Lasserre, F.; Anglada, M.; Mücklich, F.; Jiménez-Piqué, E. A parametric study of laser interference surface patterning of dental zirconia: Effects of laser parameters on topography and surface quality. Dent. Mater. 2017, 33, e28–e38. [Google Scholar] [CrossRef] [Green Version]
- Singh, D.; Yousefi, R.; Boroushaki, M. Identification of optimum parameters of deep drawing of a cylindrical workpiece using neural network and genetic algorithm. World Acad. Sci. Eng. Technol. 2011, 78, 211–217. [Google Scholar]
- Luo, L.; Wei, D.; Zu, G.; Jiang, Z. Influence of blank holder-die gap on micro-deep drawing of SUS304 cups. Int. J. Mech. Sci. 2021, 191, 106065. [Google Scholar] [CrossRef]
- Wifi, A.; Mosallam, A. Some aspects of blank-holder force schemes in deep drawing process. J. Achiev. Mater. Manufac. Eng. 2007, 24, 315–323. [Google Scholar]
- Reddy, P.R.; Rao, B.V.S.; Reddy, G.C.M.; Prasad, P.R.; Rao, G.K.M. Parametric studies on wrinkling and fracture limits in deep drawing of cylindrical cup. Int. J. Emerg. Tech. Adv. Eng. 2012, 2, 218–222. [Google Scholar]
- Gharib, H.; Wifi, A.S.; Younan, M.; Nassef, A. Optimization of the blank holder force in cup drawing. J. Optim. 2006, 1, 8. [Google Scholar]
- Chu, T.H.; Fuh, K.H.; Yeh, W.C. Experimental optimization of deep drawing using response surface methodology. Appl. Mech. Mater. 2012, 121, 1495–1499. [Google Scholar] [CrossRef]
- Najiha, M.S.; Rahman, M.M.; Yusoff, A.R. Environmental impacts and hazards associated with metal working fluids and recent advances in the sustainable systems: A review. Renew. Sustain. Energy Rev. 2016, 60, 1008–1031. [Google Scholar] [CrossRef] [Green Version]
- Plevy, T. The role of friction in metal working with particular reference to energy saving in deep drawing. Wear 1980, 58, 359–380. [Google Scholar] [CrossRef]
- Jia, X.; Shen, B.; Chen, Z.; Zhang, L.; Zheng, W. High-performance carbonized waste corrugated boards reinforced with epoxy coating as lightweight structured electromagnetic shields. ACS Sustain. Chem. Eng. 2019, 7, 18718–18725. [Google Scholar] [CrossRef]
- Modi, B.; Kumar, D.R. Optimization of process parameters to enhance formability of AA 5182 alloy in deep drawing of square cups by hydroforming. J. Mech. Sci. Technol. 2019, 33, 5337–5346. [Google Scholar] [CrossRef]
- Jawale, K.; Duarte, J.F.; Reis, A.; Silva, M.B. Microstructural investigation and lubrication study for single point incremental forming of copper. Int. J. Solids Struct. 2018, 151, 145–151. [Google Scholar] [CrossRef]
- Bauer, D.; Krebs, R. Optimization of deepdrawing presses through statistical test planning. Bander Bleche Rohre 1994, 35, 18–29. [Google Scholar]
- Wang, G.; Li, Y.; Liu, S.; Yang, J.; Yang, M. Micro deep drawing of T2 copper foil using proportional decreased tools. Int. J. Adv. Manufac. Tech. 2018, 95, 277–285. [Google Scholar] [CrossRef]
- Zein, H.; Al Mufadi, F. Using Forming Limit Stress Diagram (FLSD) for Investigation the Effect of the Geometrical and the Operating Parameters on the Deep Drawing Force. Minia J. Eng. Technol. 2018, 37, 152–174. [Google Scholar]
- Chen, J.S.; Desai, D.A.; Heyns, S.P.; Pietra, F. Literature review of numerical simulation and optimization of the shot peening process. Adv. Mech. Eng. 2019, 11, 1687814018818277. [Google Scholar] [CrossRef]
- Kakandikar, G.M.; Nandedkar, V.M. Prediction and optimization of thinning in automotive sealing cover using genetic algorithm. J. Comput. Des. Eng. 2016, 3, 63–70. [Google Scholar] [CrossRef] [Green Version]
- Atrian, A.; Fereshteh-Saniee, F. Deep drawing process of steel/brass laminated sheets. Compos. Part B 2013, 47, 75–81. [Google Scholar] [CrossRef]
- Manoochehri, M.; Kolahan, F. Integration of artificial neural network and simulated annealing algorithm to optimize deep drawing process. Int. J. Adv. Manuf. Technol. 2014, 73, 241–249. [Google Scholar] [CrossRef]
- Safdarian, R. Forming limit diagram prediction of 6061 aluminum by GTN damage model. Mech. Ind. 2018, 19, 202. [Google Scholar] [CrossRef]
- Volk, M.; Nardin, B.; Dolsak, B. Determining the optimal area-dependent blank holder forces in deep drawing using the response surface method. Adv. Prod. Eng. Manag. 2014, 9, 71. [Google Scholar] [CrossRef] [Green Version]
- Taylor, L.; Cao, J.; Karafillis, A.P.; Boyce, M.C. Numerical simulations of sheet-metal forming. J. Mater. Process. Technol. 1995, 50, 168–179. [Google Scholar] [CrossRef]


| Item | Parameter | Value |
|---|---|---|
| 1. Blank: | Blank radius (D/2) | 45 mm |
| Blank thickness (t) | 0.8 mm | |
| 2. Punch: | Punch radius (d1/2) | 26 mm |
| Punch nose radius (rp) | 5 mm | |
| Punch stroke (h1) | 26.5 mm | |
| 3. Die: | Die radius (dD/2) | 27.286 mm |
| Die shoulder radius (rd) | 4 mm | |
| Radial clearance (wc) | 1.286 mm | |
| 4. Operating parameters | Blank holder force (FBH) | 0.375 ton |
| Friction coefficient between punch and blank (μp) | 0.25 | |
| Friction coefficient between holder and blank (μh) | 0.125 | |
| Friction coefficient between die and blank (μd) | 0.125 |
| Property | Value |
|---|---|
| Young’s modulus (E) | 206 GPa |
| Poisson’s ratio (ν) | 0.3 |
| Density (ρ) | 7800 kg/m3 |
| Yield strength (σyo) | 167 MPa |
| Anisotropy characteristic values | r0 = 1.79, r45 = 1.51, r90 = 2.27 |
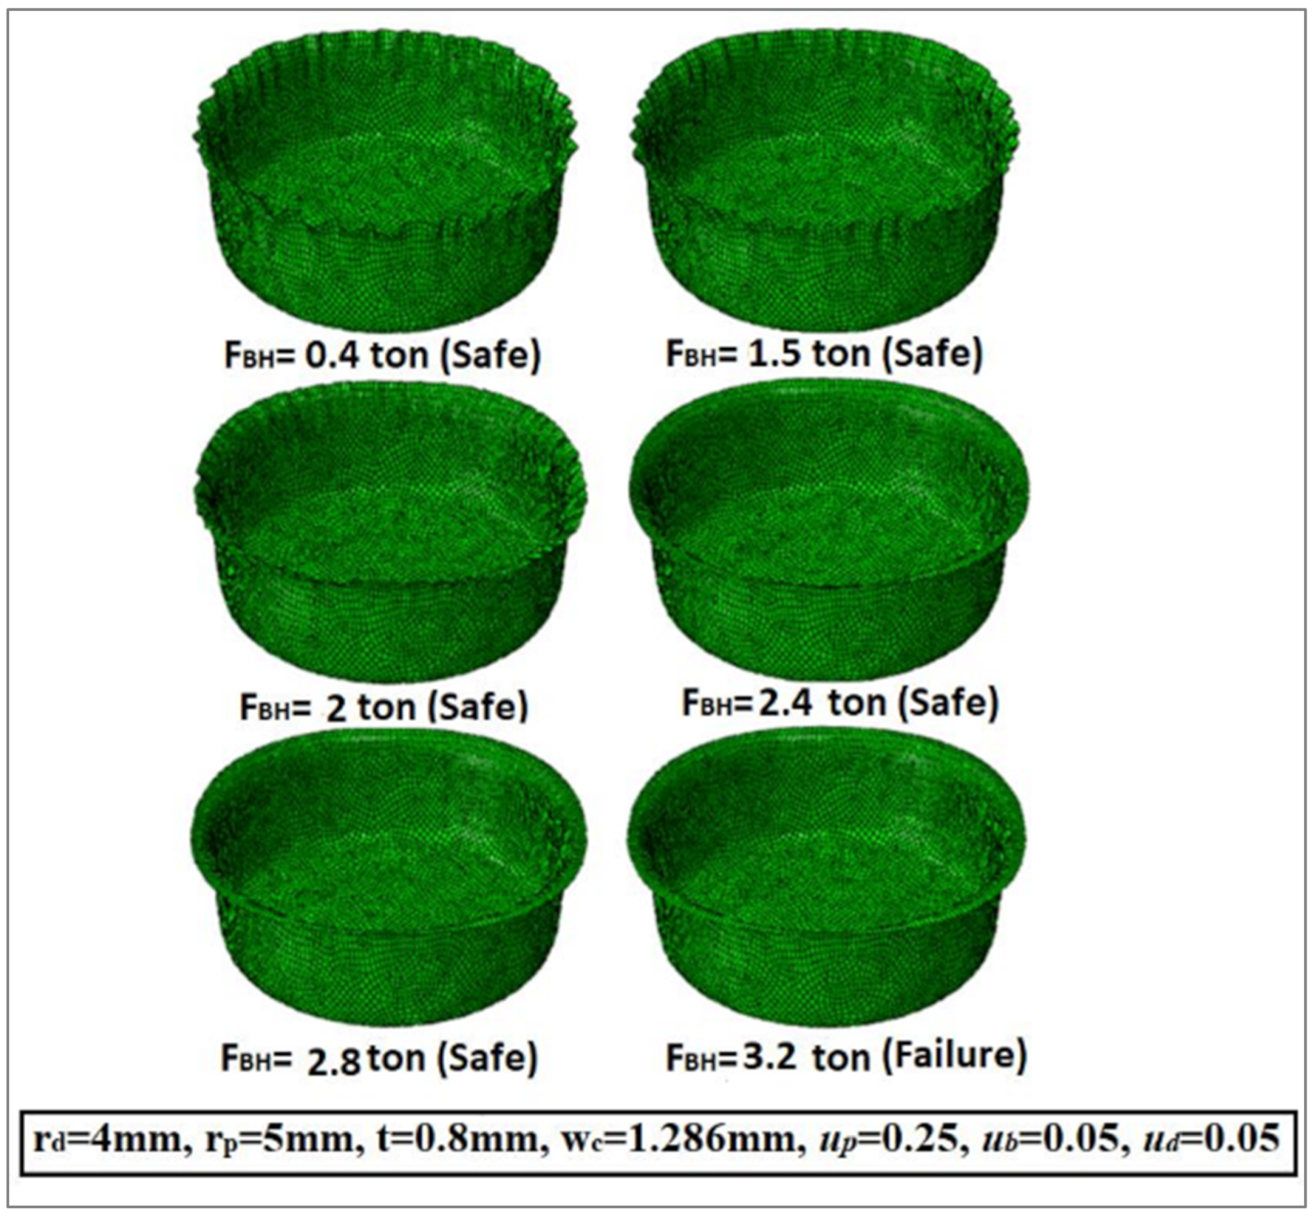
| The Coefficient of Friction | FBH-wrinkling (ton) | FBH-tearing (ton) |
|---|---|---|
| μd = μh = 0.125 | 2 | 2.8 |
| μd = μh = 0.05 | 2 | 3.2 |
Publisher’s Note: MDPI stays neutral with regard to jurisdictional claims in published maps and institutional affiliations. |
© 2021 by the authors. Licensee MDPI, Basel, Switzerland. This article is an open access article distributed under the terms and conditions of the Creative Commons Attribution (CC BY) license (https://creativecommons.org/licenses/by/4.0/).
Share and Cite
Zein, H.; Irfan, O.M. Optimization and Mapping of the Deep Drawing Force Considering Friction Combination. Appl. Sci. 2021, 11, 9235. https://doi.org/10.3390/app11199235
Zein H, Irfan OM. Optimization and Mapping of the Deep Drawing Force Considering Friction Combination. Applied Sciences. 2021; 11(19):9235. https://doi.org/10.3390/app11199235
Chicago/Turabian StyleZein, Hussein, and Osama M. Irfan. 2021. "Optimization and Mapping of the Deep Drawing Force Considering Friction Combination" Applied Sciences 11, no. 19: 9235. https://doi.org/10.3390/app11199235