Article

Time-Dependent Damage Estimation of a High-Rise Steel Building Equipped with Buckling-Restrained Brace under a Series of Earthquakes and Winds

Department of Architecture and Civil Engineering, Toyohashi University of Technology, Aichi 441-8580, Japan
*
Author to whom correspondence should be addressed.
Appl. Sci. 2021, 11(19), 9253; https://doi.org/10.3390/app11199253
Submission received: 17 September 2021 / Revised: 29 September 2021 / Accepted: 30 September 2021 / Published: 5 October 2021
(This article belongs to the Special Issue Seismic Assessment and Design of Structures)

Abstract

:
This study investigates the cumulative damage of a 20-story high-rise steel building equipped with buckling-restrained braces (BRB) under the likely occurrence of earthquake and wind events in the design life of the building. The objective of this research is to introduce a method for evaluating the cumulative damage of BRBs under multi-hazard events that are expected to occur during the service life of a high-rise building in order to achieve a safer building. A methodology is proposed using a Poisson point process to estimate the timeline of earthquake and wind events, wherein the events are assumed to be independent in nature. The 20-story high-rise steel building with BRBs is designed according to the Japanese standard and analyzed using the finite element approach, considering nonlinearities in the structural elements and BRBs. The building is analyzed consecutively using the timeline of earthquakes and winds, and the results are compared with those under individual earthquakes and winds. In addition to the responses of the frame such as the floor displacement and acceleration, the damage of BRBs in terms of the damage index, the energy absorption, the plastic strain energy, and the maximum and cumulative ductility factor are evaluated. It is observed that the BRB’s fatigue life under multi-hazard scenarios is a multi-criteria issue that requires more precise investigation. Moreover, the overall building’s performance and BRB’s cumulative damage induced by the sequence of events in the design life of the building is significantly larger than that under an individual event.

1. Introduction

The buckling-restrained brace (BRB) is an energy-absorbing device that consists of a detached steel core brace inside a steel restrainer infilled with concrete mortar. This unique combination enables the BRB to exhibit stable hysteresis behavior both in compression and tension. The BRB was originally invented in Japan, and the first practical application was reported by Fujimoto et al. in 1988 [1]. Since the first successful application of BRB for 10- and 15-story steel frame buildings in 1989, the device has gained popularity in seismically active regions around the world [2]. The excellent performance of BRB as an energy-absorbing device has been proved by many experimental tests [3,4,5,6,7,8,9,10]. The use of BRB has become one of the efficient measures to minimize the effect of seismic loadings in low- to high-rise buildings [11,12]. Moreover, the BRB is extensively employed to retrofit the existing buildings to increase the building strength and energy dissipation capacity [13,14,15,16,17].
The use of BRBs is common in Japan for high-rise buildings [18] to mitigate their performance since the high-rise buildings experience a large amplitude shaking due to the effect of resonance with the long period component of earthquake ground motions. Since Japan is a country that experiences frequent earthquakes and typhoons [19], the performance of the high-rise building with BRBs must be examined under the multi-hazard scenario of earthquakes and long-duration winds. Although the performance of BRBs in high-rise buildings under either earthquake and wind loads is extensively studied in Japan and worldwide, limited studies had been conducted to evaluate the cumulative damage of BRBs in the successful application of wind and earthquakes. It is because most of the seismic provisions and design guidelines specify the design method for the single event of earthquakes and winds [20].
Under the multi-hazard scenario, high-rise buildings are exposed to a series of high-cycle low-strength dynamic wind loads and low-cycle high-strength earthquake loads. The literature review of BRB’s fatigue life under the low-cycle excitation [21,22,23,24,25] indicates that the devices are capable of withstanding the design load and enduring the design threshold successfully. The effect of low-cycle fatigue of BRBs for three consecutive Level-2 earthquakes is investigated by Usami et al. [21] and the BRBs’ fatigue performance is found to be in an acceptable range. On the other hand, although the failure mechanism of wind-induced fatigue for steel buildings has been examined by researchers [26,27,28,29], there are few studies to discuss the BRBs under the combination of low- and high-cycle excitations in high-rise buildings.
The objective of this research is to evaluate the cumulative deformation capacity of BRBs installed along the height of a 20-story steel frame building under multi-hazard scenarios. The target building is designed to satisfy the design criteria recommend in the Japanese regulation. Then, the performance of the building and the cumulative deformation of BRBs are evaluated under successive application of multi-hazards in the building lifetime, consisting of the low-cycle earthquake and high-cycle wind loadings. The damage assessment method presented in this study can help designers to achieve safer buildings evaluating the cumulative damage of BRBs under multi-hazard events.

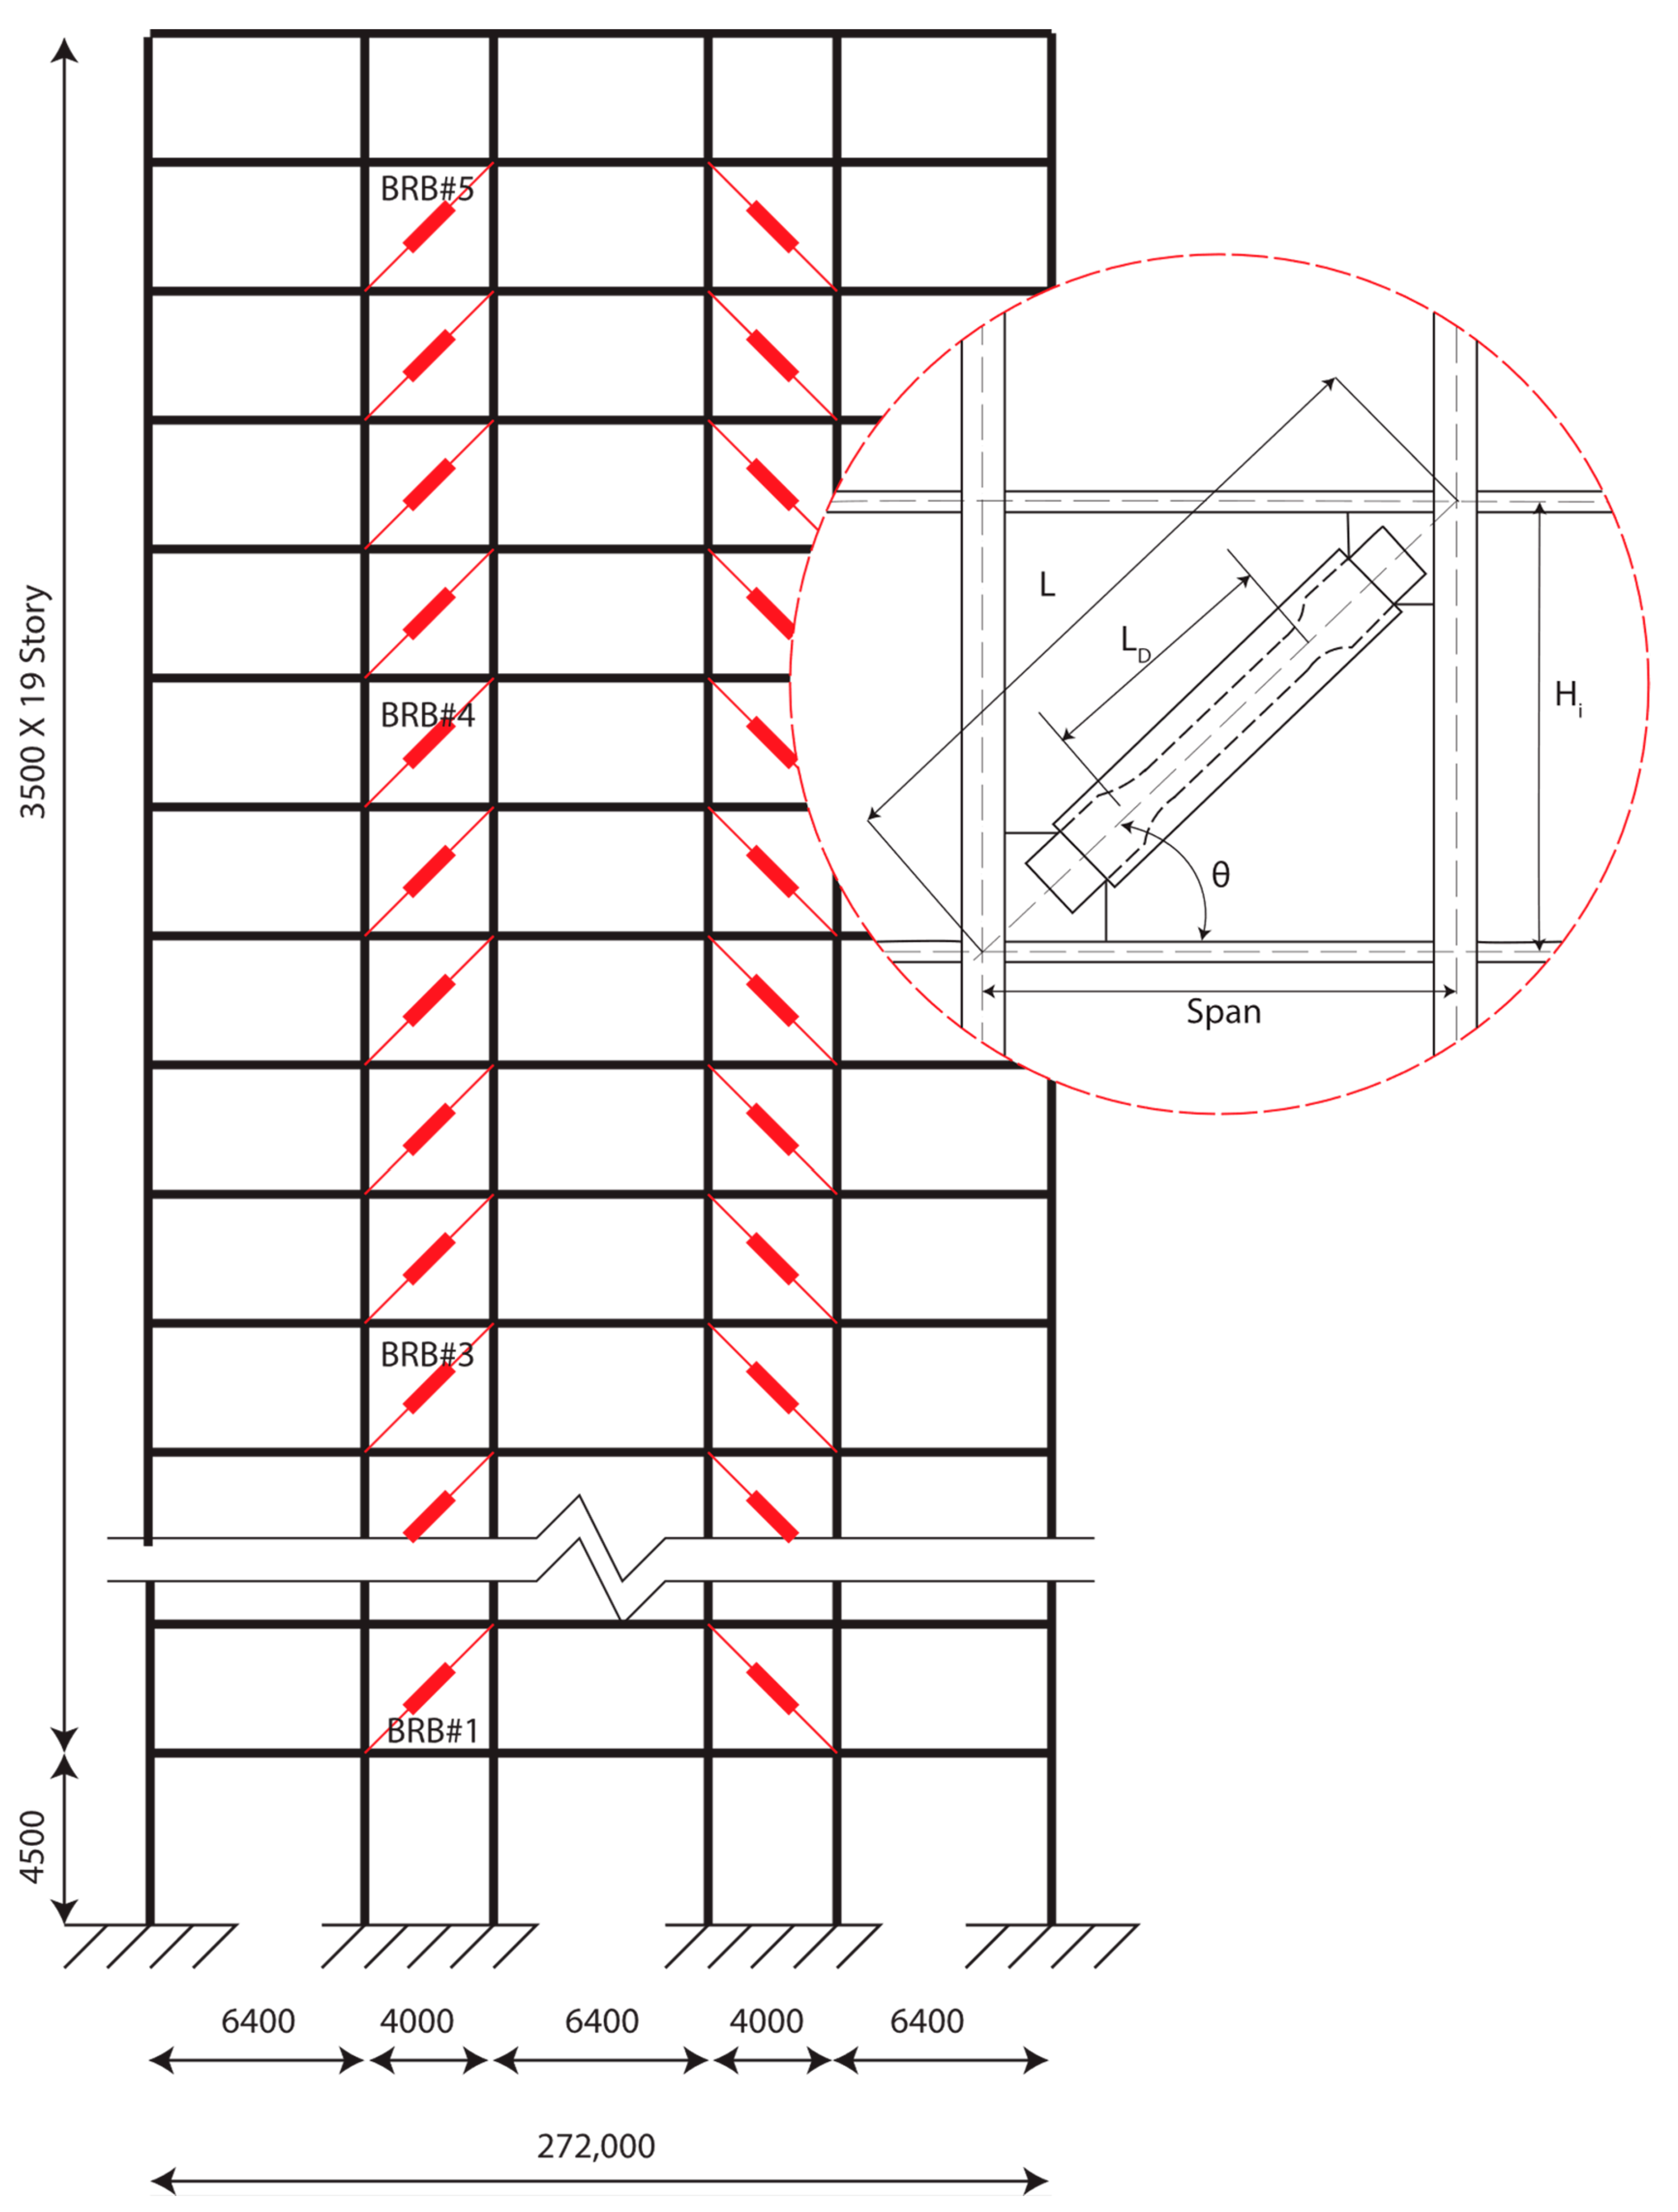
2. Target Steel Building with BRB Devices

2.1. Building Description

The target building is a 20-story steel moment-resisting frame designed according to Japanese standards [30,31,32]. It is assumed that the target building is located in the Aichi Prefecture, Japan, with a 100-year service period. The elevation of the frame and the configuration of BRBs along the height of the frame are presented in Figure 1. The total height of the frame is 71 m, while the ground floor height is 4.5 m, and the remaining floor height is 3.5 m. There are five spans, with three spans of 6.4 m and two spans of 4 m. The hollow square-box and wide flange of SN490B steel type are selected for the column and beam elements, with the yield strength of 325 MPa and tensile strength of 490 MPa. The member size and thickness of the elements in each story are summarized in Table 1.
The design guideline of buildings with passive control devices, JSSI [32], is used to determine the size and number of BRBs. The JSSI guideline adopts the procedure developed by Kasai et al. (1998) [33] to obtain the necessary stiffness and damping of additional BRBs. The method idealizes the building as an equivalent single degree of freedom (SDOF) system and estimates the amount of additional stiffness and damping of passive control devices according to the target performance level under design earthquake loads. For the current example, the target performance levels are the maximum inter-story drift ratio of less than 1% and the ductility factor of BRBs of less than 7, under the design earthquake and wind loads. Table 2 presents the estimated parameters of BRBs, while the device configuration is shown in Figure 1.

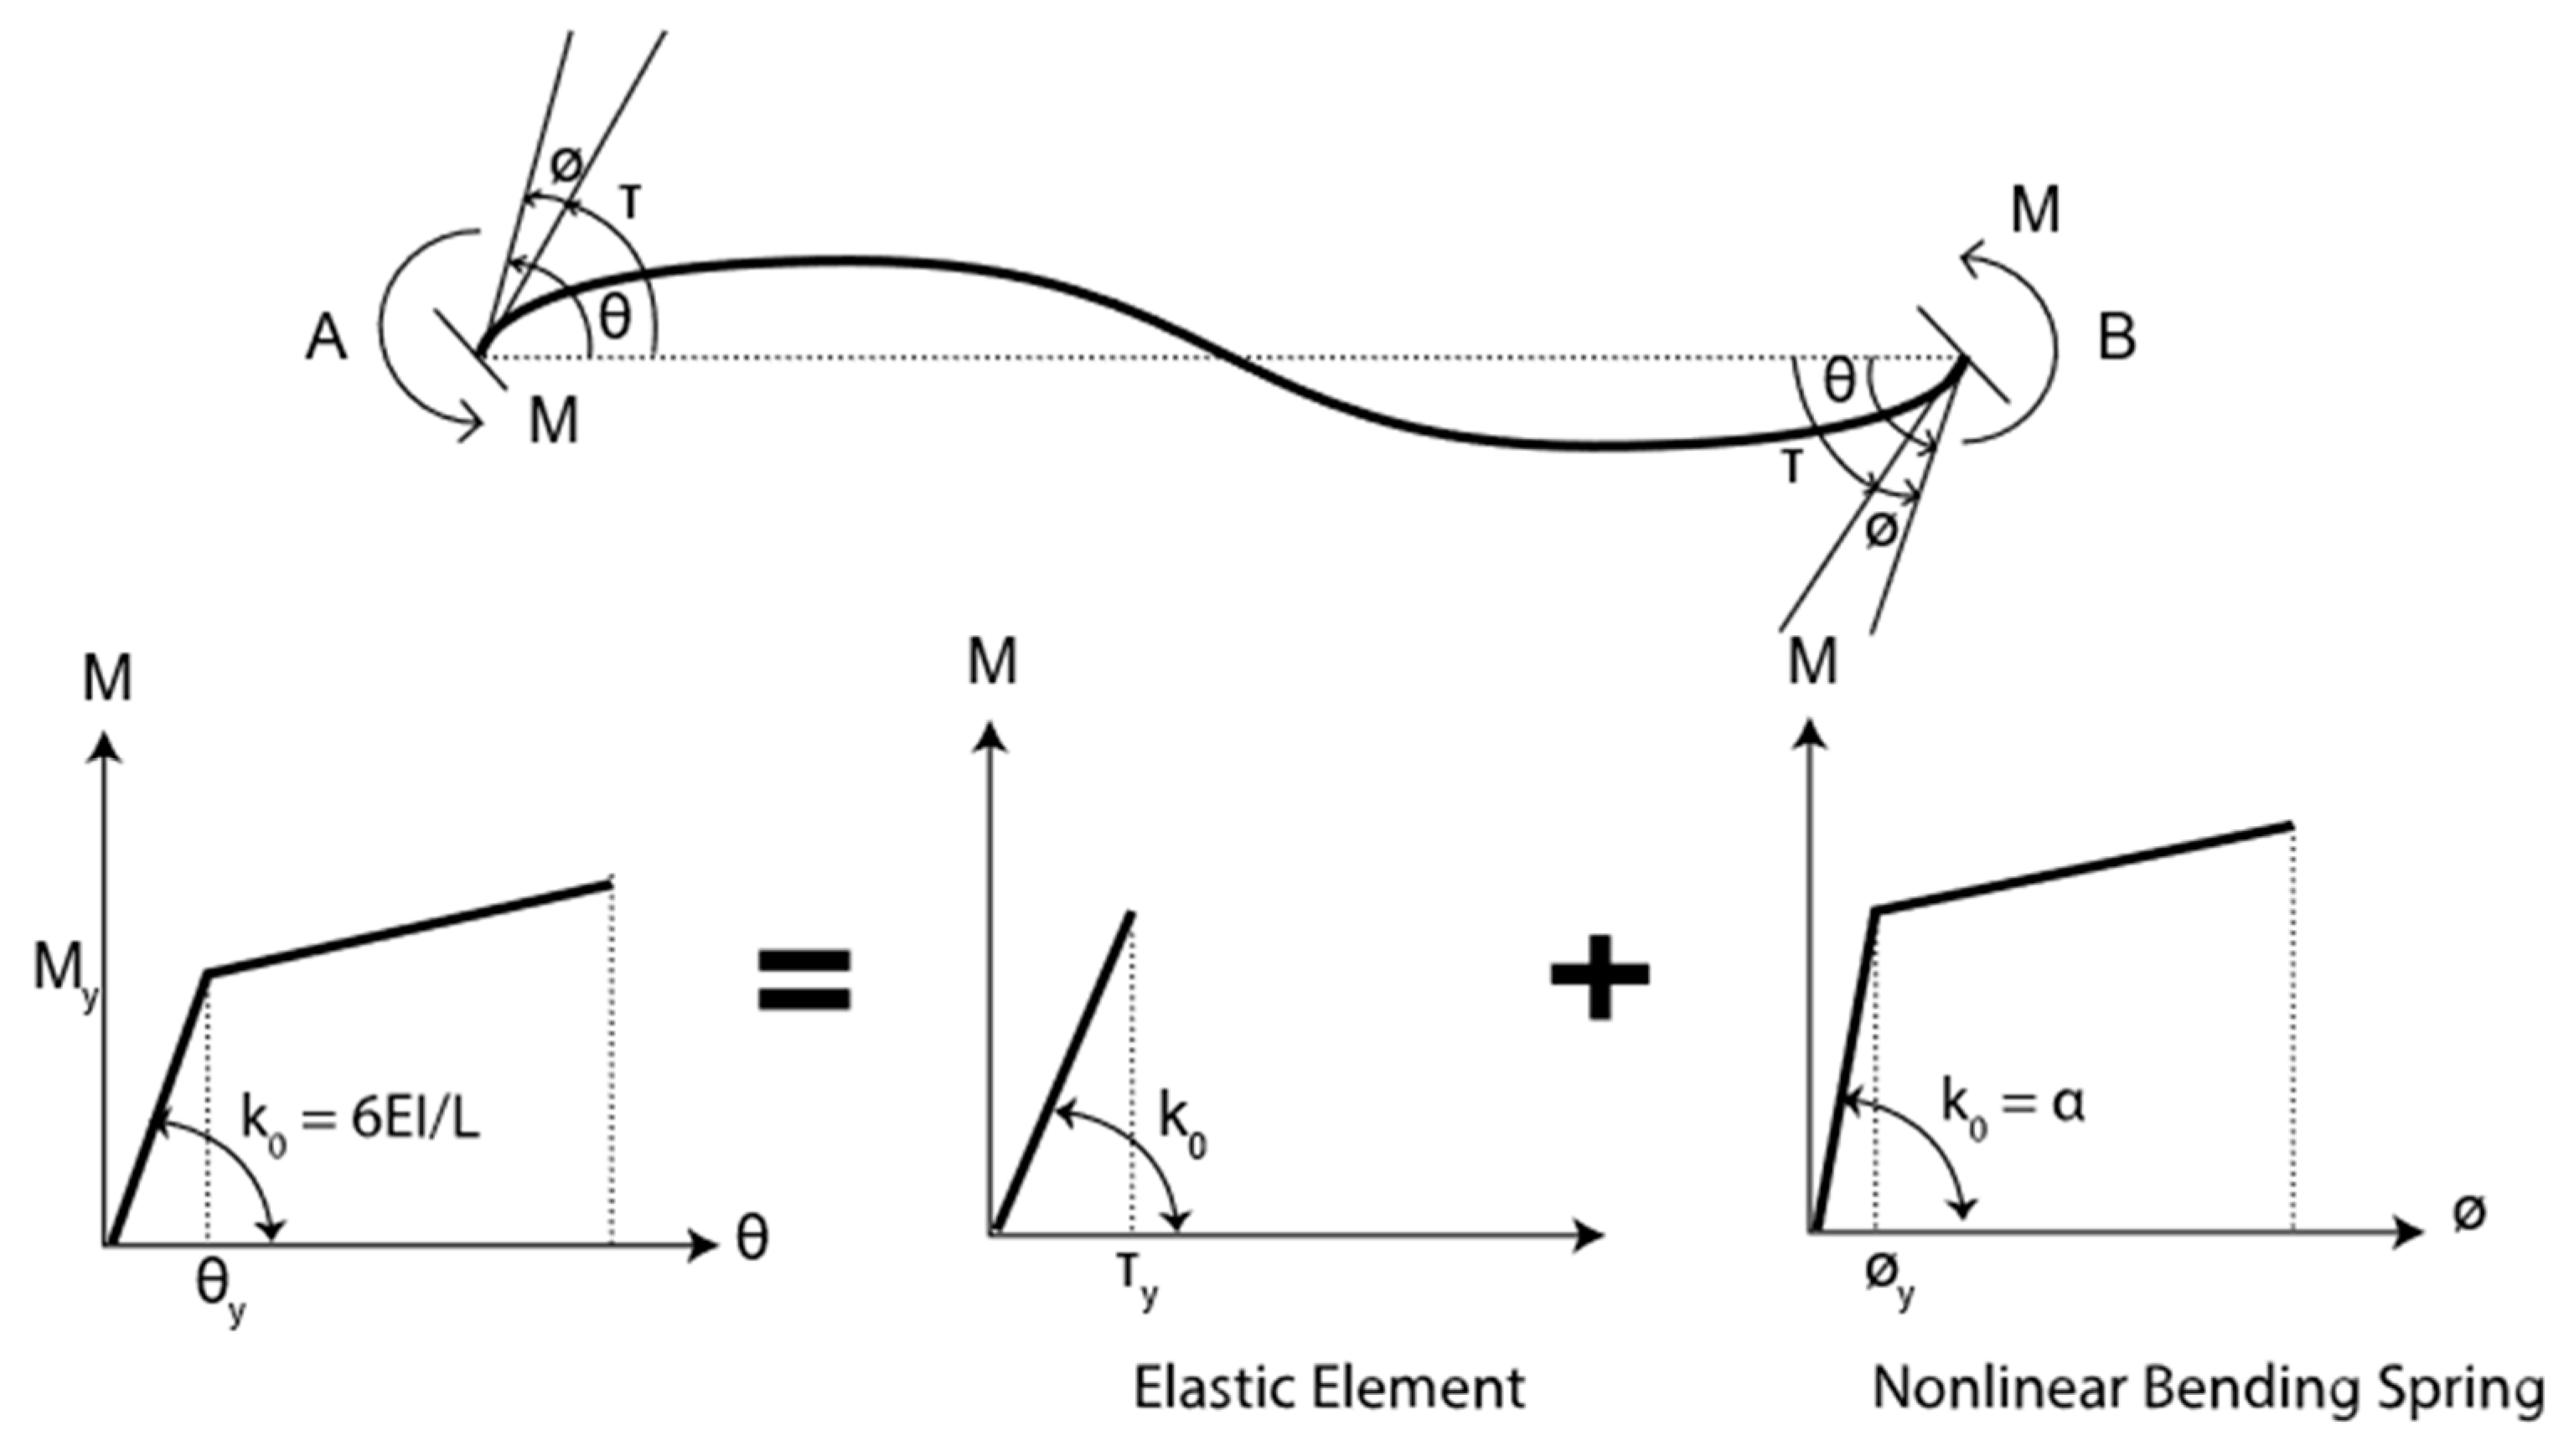
2.2. Numerical Model of the Target Building

The 20-story steel frame is modeled by finite element software, STERA_3D (STructural Earthquake Response Analysis 3D), which was developed by one of the authors [34]. The beam elements are presented by two nonlinear flexural springs at both ends. The column elements have nonlinear axial springs distributed in the sections of both ends. The steel strength is modified to be 1.1 times more than the nominal strength, and the ratio of post-yield stiffness to the initial stiffness is 0.001. Figure 2 represents the hysteresis behavior of the nonlinear bending spring, which is defined as the moment–rotation relationship under cyclic loadings. The beam–column connection is assumed to be rigid, where the rigid zone length for the beam element is set to be half of the column width. The BRB element, as presented in Figure 3, is defined as a shear spring in a frame with the bilinear hysteresis and initial stiffness, K1, and secondary stiffness, K2.

2.3. Performance Evaluation of Target Building

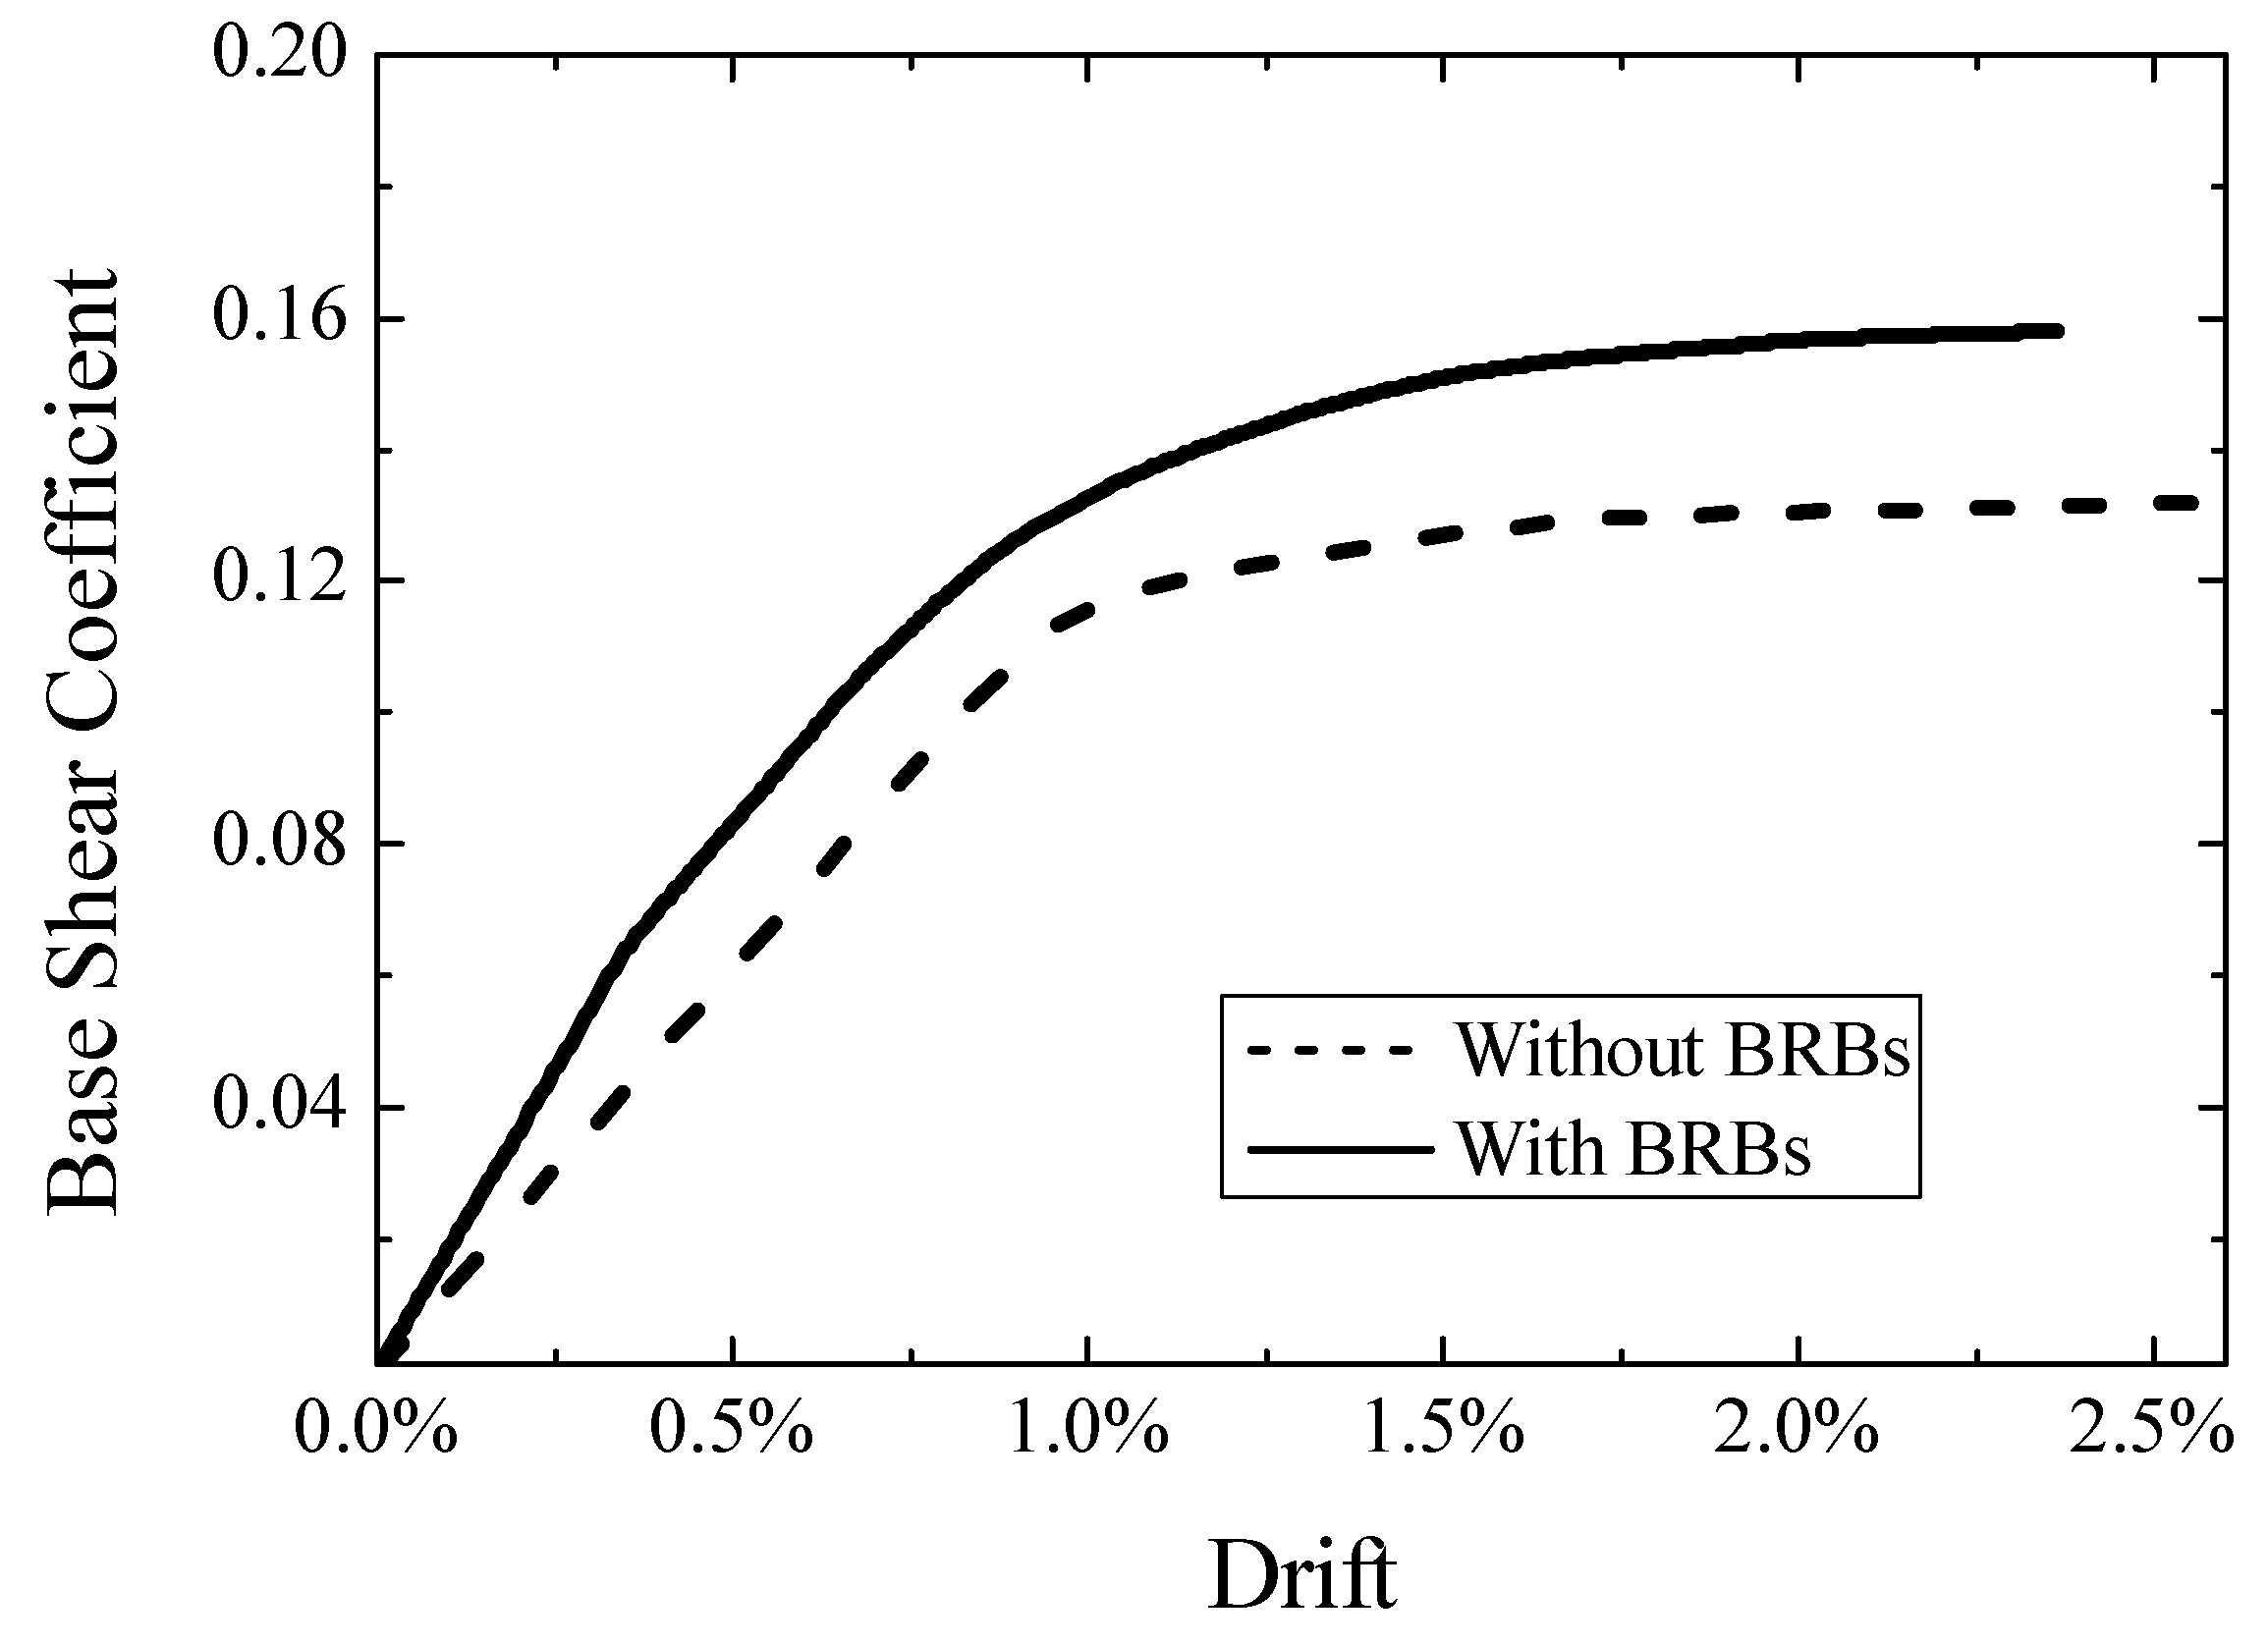
2.3.1. Pushover Analysis

The strength capacity and story drift distribution of the target building are evaluated using the nonlinear static pushover analysis. The model is pushed horizontally until the drift ratio at the equivalent height of the model reached 1/50 using the lateral load distribution given by the Japanese standard [30,31]. The relationship between the base shear coefficient and the drift ratio at the equivalent height of the model, for both cases, without and with supplemented BRBs, is illustrated in Figure 4. The result indicates that the lateral strength of the target frame is increased for the frame with supplemented BRBs by 135%, 115%, and 120% when the building pushover reaches 0.5%, 1.0%, and 2.0% of the drift ratio, respectively.

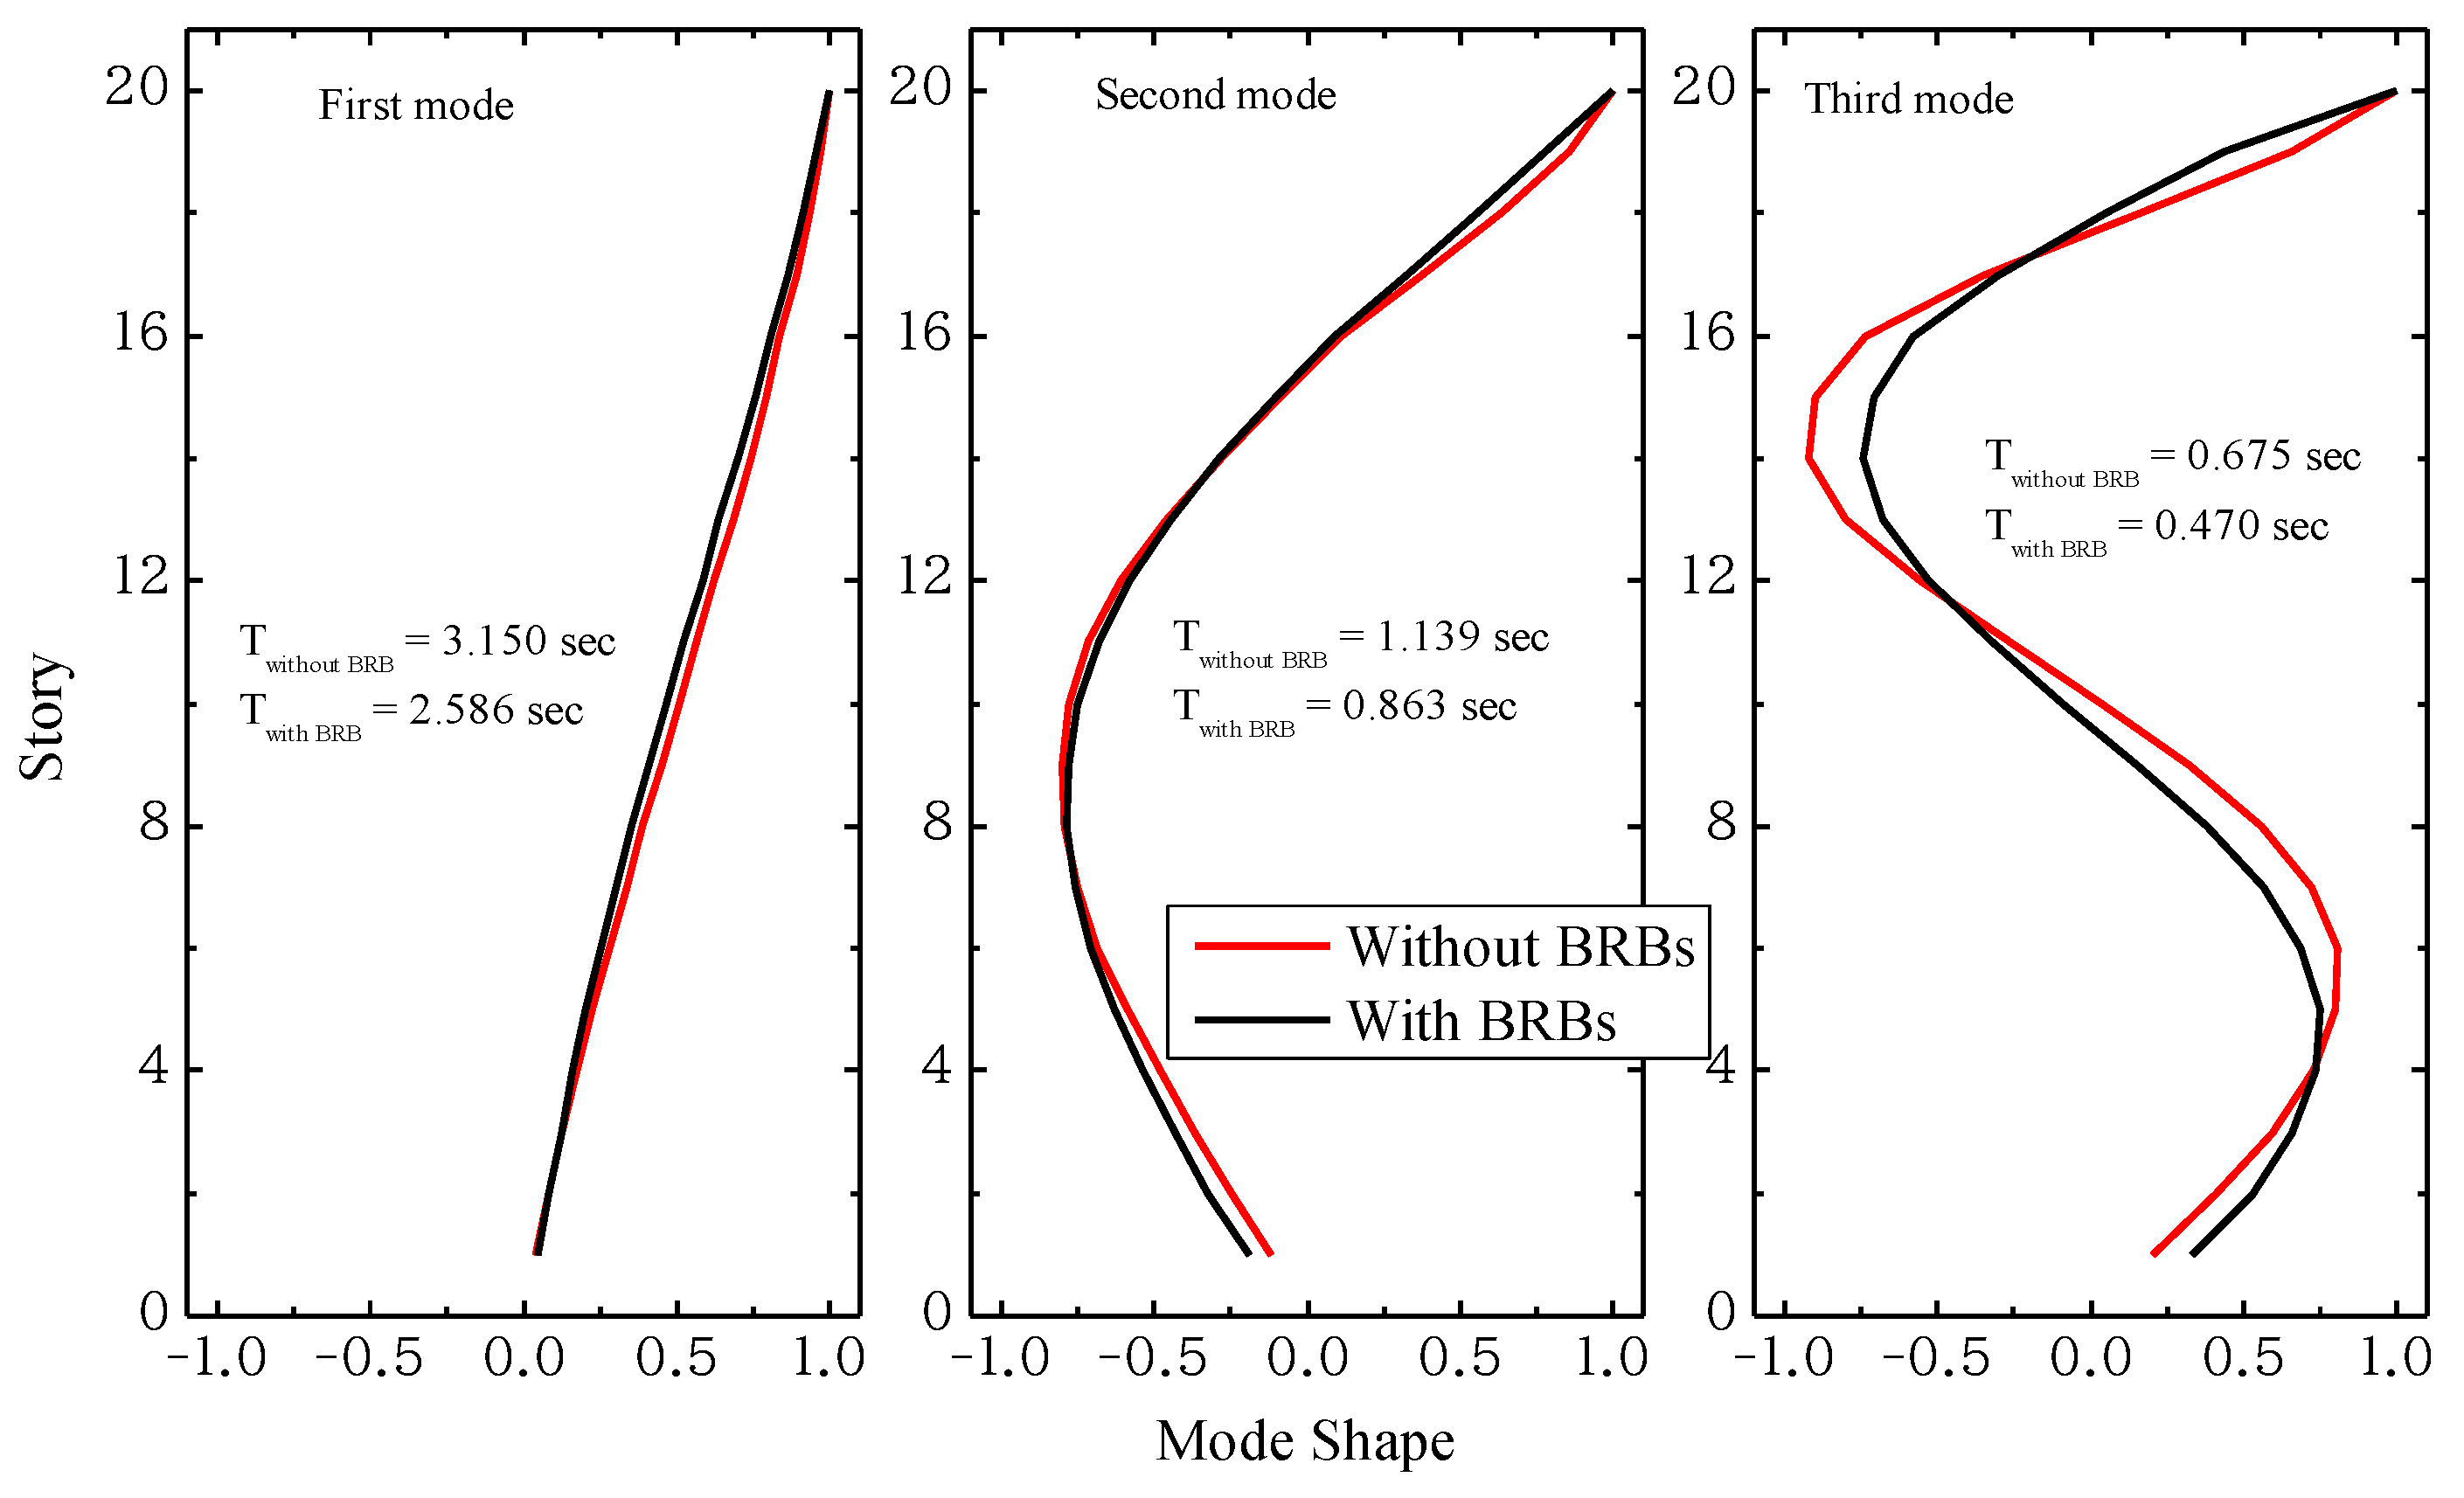
2.3.2. Natural Period and Mode Shape

The dynamic characteristics of the target frame corresponding to the 1st to 3rd modes of vibration are obtained by the eigenvalue analysis. As shown in Figure 5, the natural period becomes shorter after installing BRBs, while the mode shape is not changed significantly.

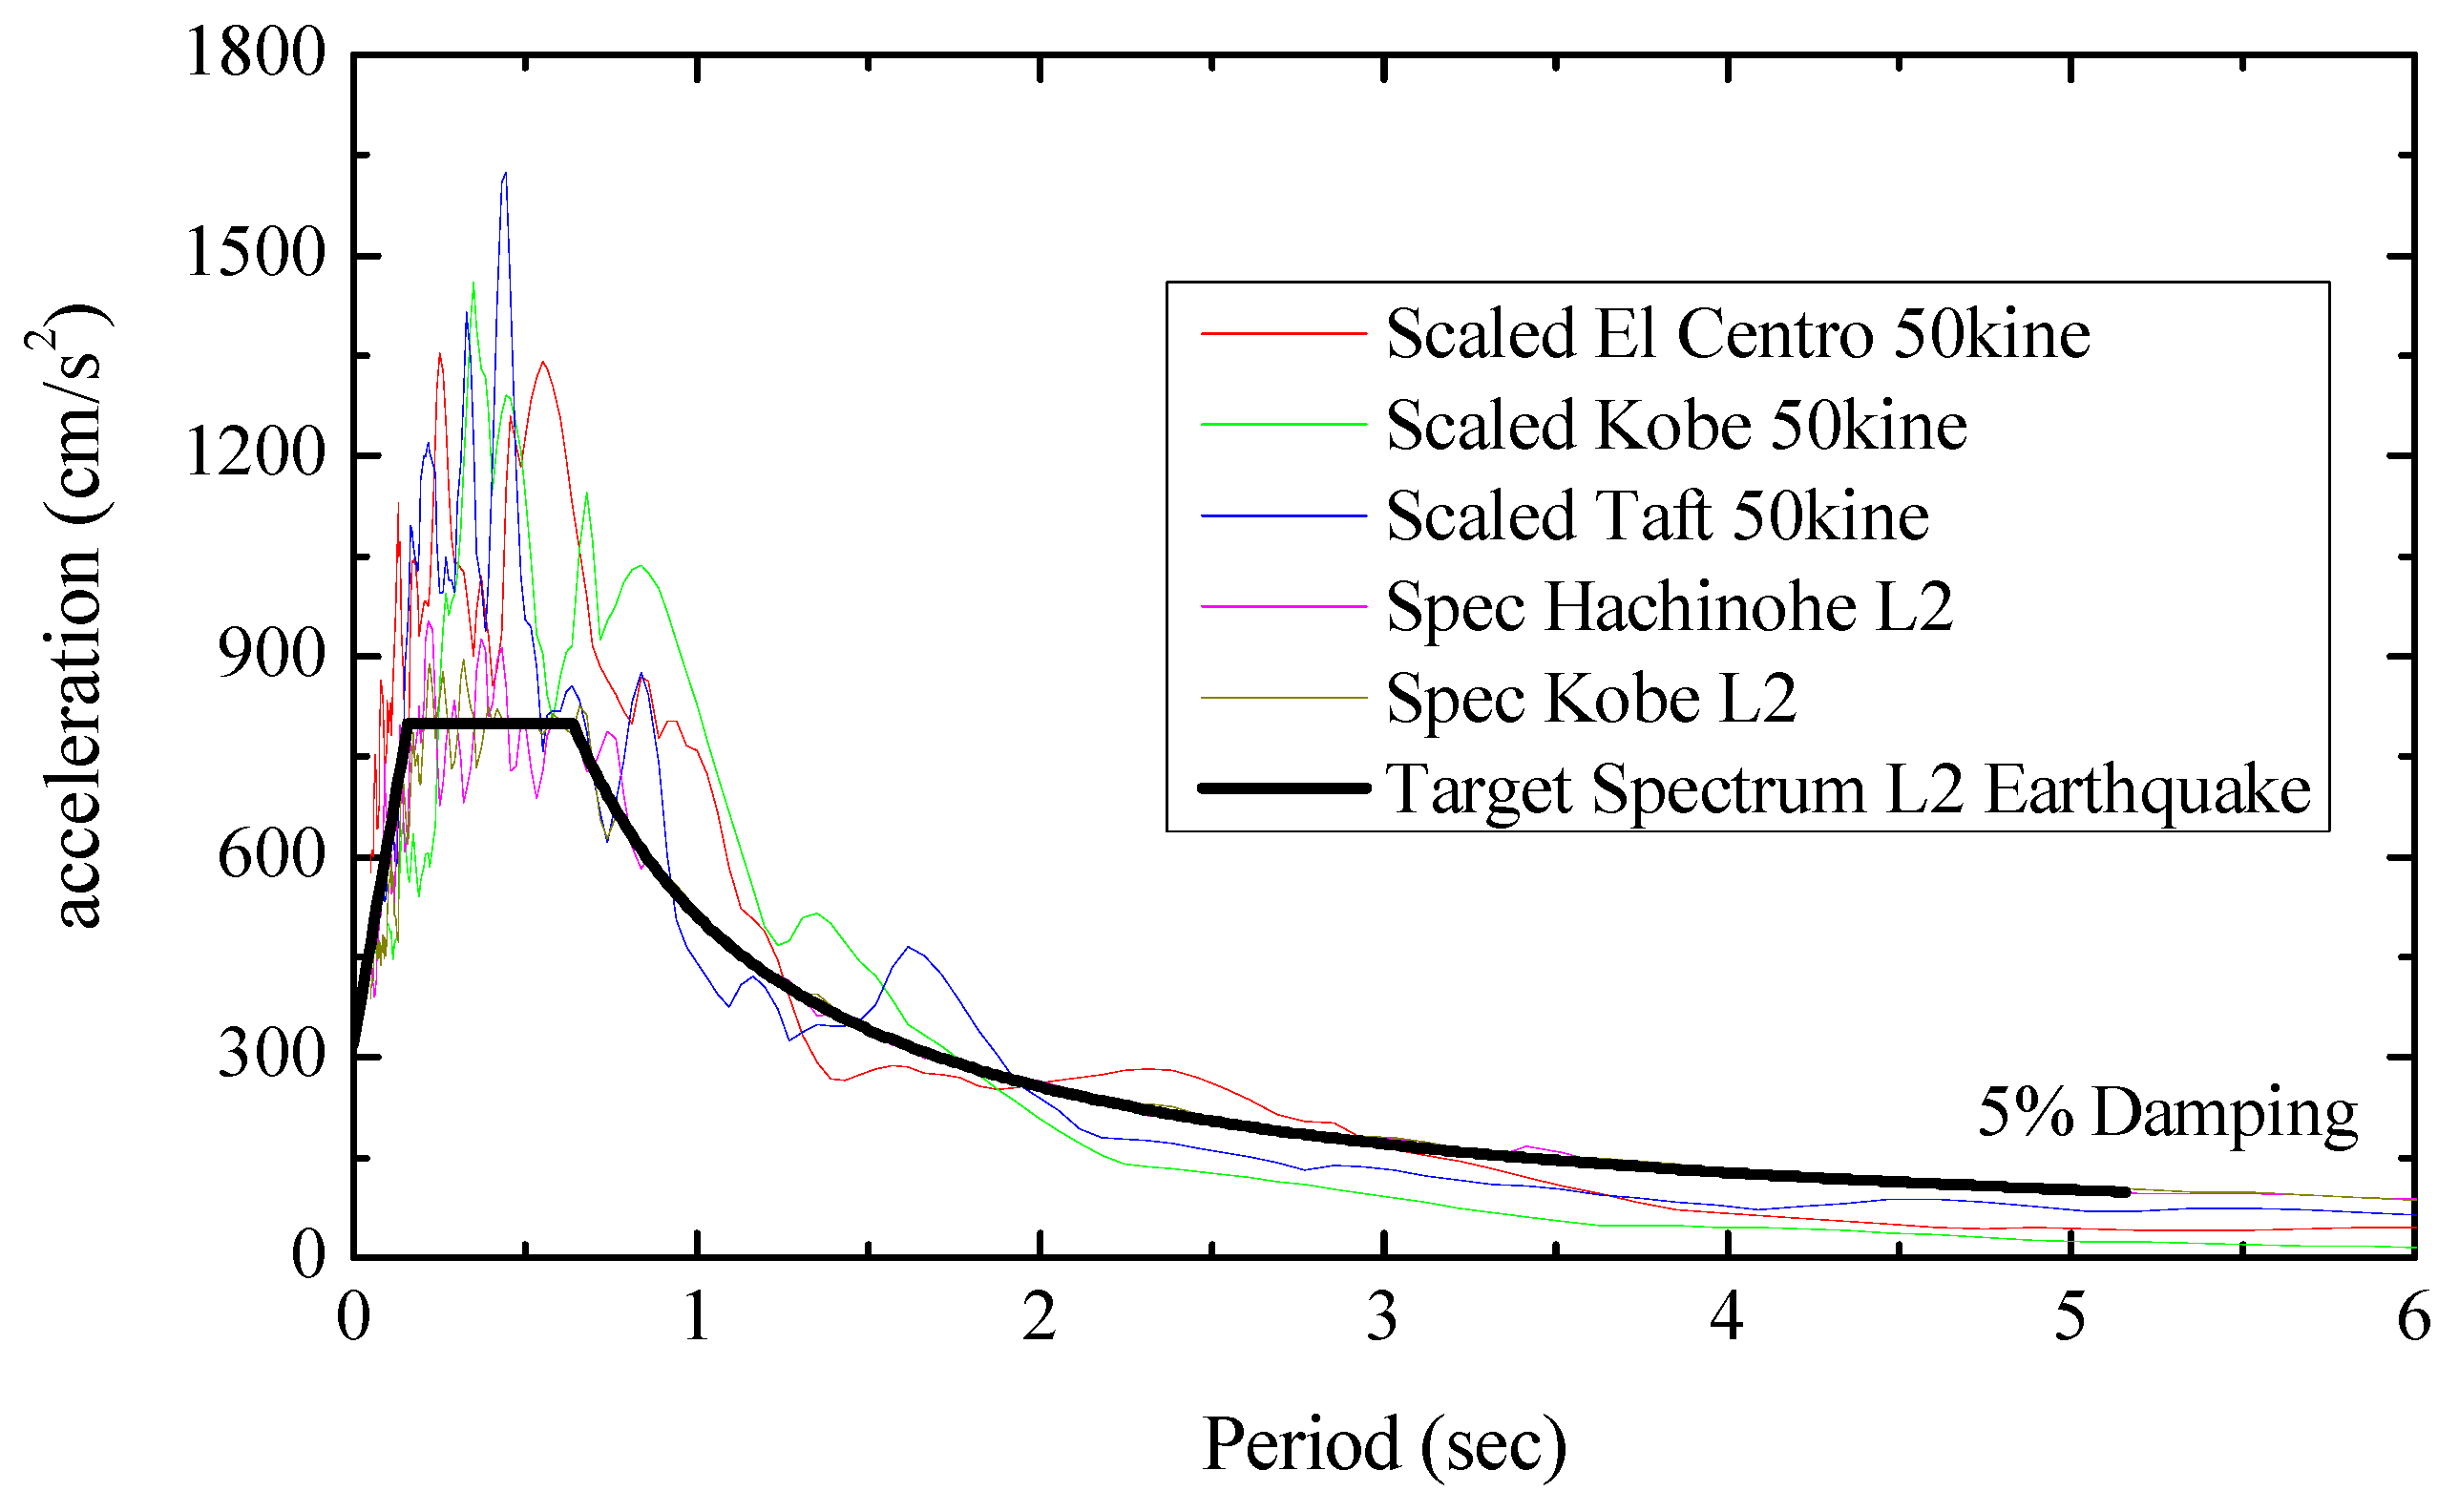
2.3.3. Time History Analysis under Design Earthquakes

The target frame is analyzed under the design earthquakes and wind loads prescribed in the Japanese standard [30] to validate the design procedure and evaluate the contribution of BRBs. Five sets of earthquake ground motions are considered as listed in Table 3. Three of them are the observed earthquake ground motions scaled to Level 2 to have the maximum velocity of 50 cm/s. The other two earthquakes are artificial earthquake ground motions to have the response spectra to be compatible with the Level 2 design spectrum of the Japanese standard [31] and the phase spectra of historical earthquakes. The acceleration response spectra of selected earthquakes are illustrated in Figure 6. As for the wind load, four sets of design wind load of the different average speeds of 17, 20, 25, and 31 m/s are generated according to the AIJ recommendations [30]. Since the shape of the building is regular, the wind loads are applied at the center of gravity on each floor, while the distribution of the wind loads along the height of the building is decided according to the Japanese standard [31].
The maximum story drift ratio of the target frame with and without BRBs under the design earthquake and wind loads is presented in Figure 7. For the design earthquake loads, the maximum story drift is controlled to satisfy the 1% design drift, while the average result indicates a 50% decrease in the critical stories compared to the target frame without BRBs. On the other hand, the maximum story drift under the wind loads also indicated an improvement of 50% in contrast to the model without BRBs, which reaches the 1.2% story drift in critical floors, in the case of a design wind load of 31 m/s. Hence, the design procedure is a straightforward tool that can determine the amount of additional stiffness to be provided by BRBs without any iteration to satisfy the design targets.
Furthermore, in Figure 8, for the earthquake and wind loads, the maximum ductility factor and the amount of dissipated energy of each BRB along the height of the building are evaluated. For most of the earthquake loads, the ductility factor of BRBs is in the range of the pre-defined design drift, which is considered to be μ = 7, except for the lower stories for which it is exceeded. In the case of design wind loads, the ductility factor is decreasing significantly in upper stories. As for the amount of dissipated energy, in both cases, the BRBs in the upper floors are less effective at dissipating the earthquake or wind loads.

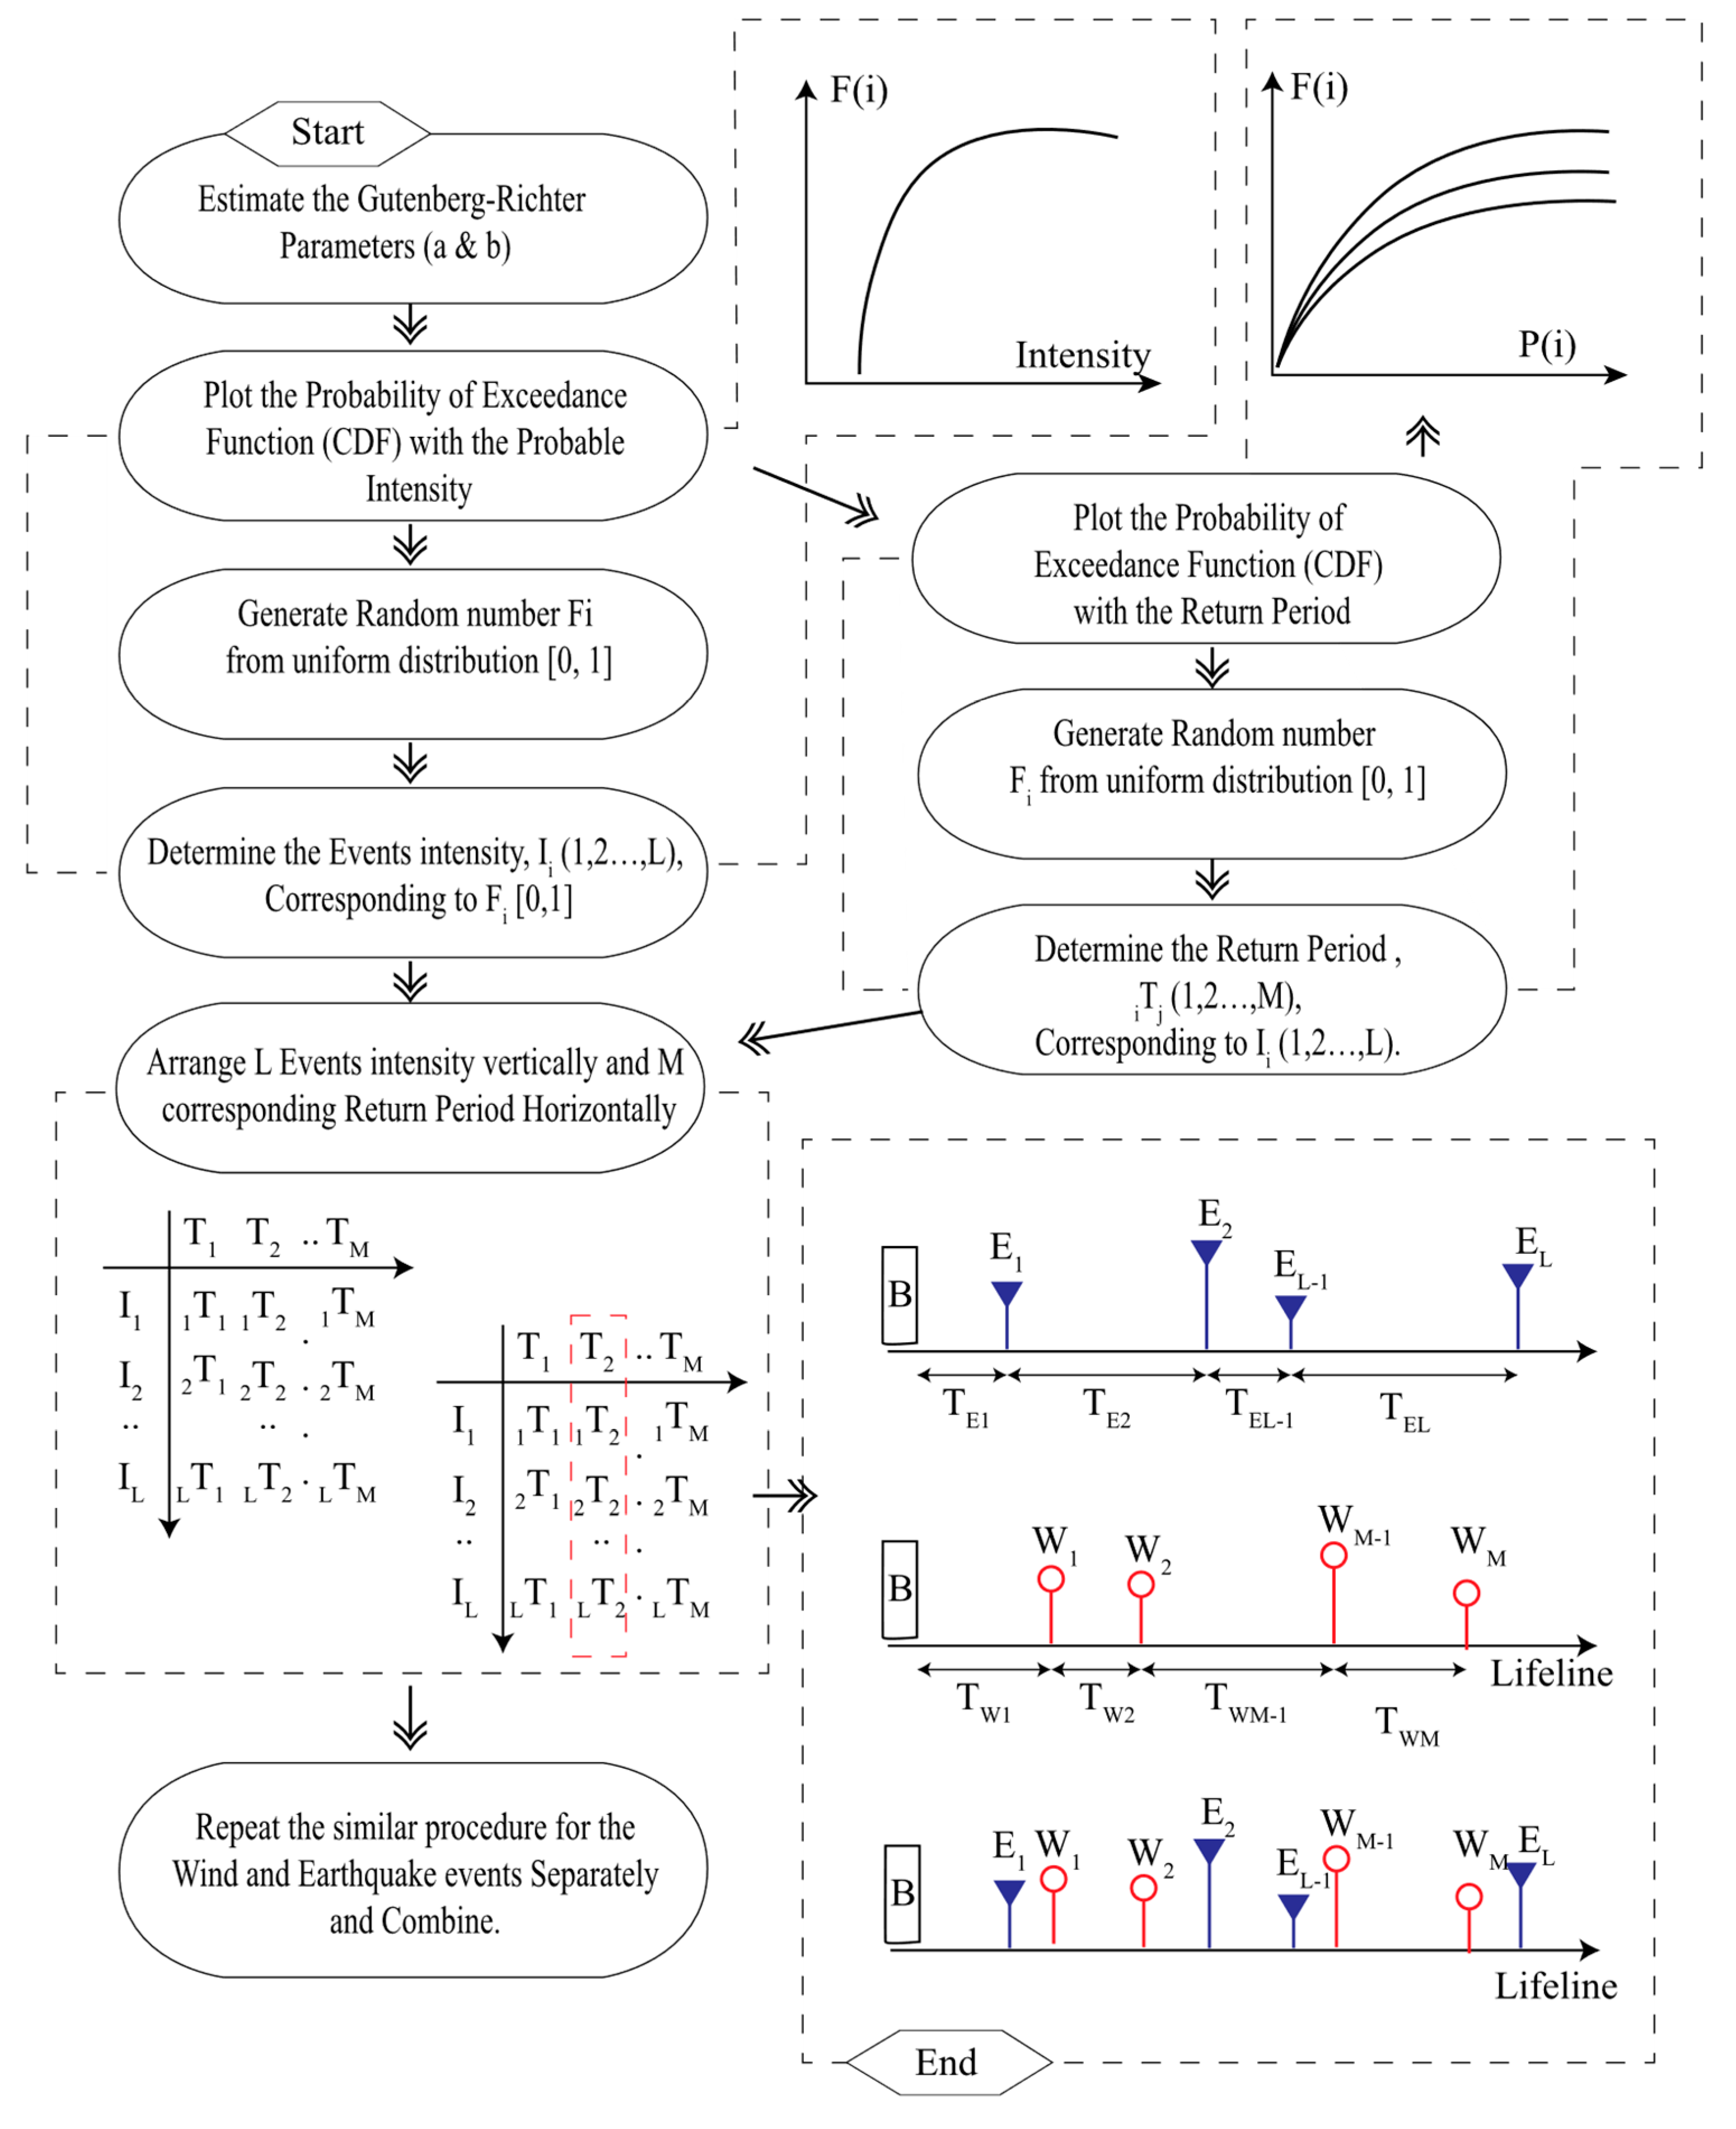
3. Procedure to Generate Probable Multi-Hazard Scenarios in Building Lifetime

The likely recurrence of earthquake and wind events during the building lifetime is crucial to be addressed, as it enables the decision-makers to evaluate the building performance in any specific service period. Thus, a practical procedure to estimate the likelihood of the occurrence of multi-hazard scenarios in the structural design life is developed and presented by Roy et al. [35]. The procedure is based on the Poisson process, which uses the anticipated return period and intensity to generate the earthquake and wind events.
From the Gutenberg–Richter equation, the annual occurrence rate, N(I), of earthquake loads with an intensity more than I is given as,
ln N ( I ) = a b I .
The average recurrence period, T(I), satisfies the following relationship,
N ( I ) = 1 T ( I ) .
If we consider two earthquake events having the intensity of I100 and I500, with the correspondent return periods of 100 and 500 years, respectively, the constants, a and b, of the Gutenberg–Richter equation can be obtained as given in Equations (4) and (5) and Table 4.
{ ln ( 0.01 ) = a b I 100 ln ( 0.002 ) = a b I 500 }
b = ln ( 0.01 ) ln ( 0.002 ) I 500 I 100
a = ln ( 0.01 ) + b I 100
Now, if N(I0) is an earthquake event with intensity more than the I0, the cumulative distribution function (CDF) of the intensity I is given as
F ( i ) = P ( I i ) = 1 N ( i ) N 0 ,
where N 0 = N ( I 0 ) .
Once the probability of earthquake intensity is determined, the probability of earthquake occurrence, P(t), assuming that the earthquake events occur individually with an average occurrence rate N(I), can be estimated. The probability of n earthquake events of intensity more than I in the t-years is expressed as the Poisson process as
P n ( t ) = { N ( I ) t } n     e N ( I ) t n ! .
In Equation (7), setting n = 0, the probability of no earthquake events of intensity more than I in the t-years can be determined as
P 0 ( t ) = e N ( I ) t .
Similarly, the probability of occurrence of more than one earthquake event exceeding intensity I in the t-years could be given as
P ( t ) = 1 P 0 ( t ) = 1 e N ( I ) t .
The probabilistic model of the occurrence of wind events is created in the same way.
In order to generate the events in the expected lifetime, the proposed procedure initially consists of estimation of the probable earthquake and wind intensity, and subsequently, for the estimated intensity, calculating the probable occurrence with the generation of earthquake and wind events. In the first step, the sample of wind or earthquake intensity, Ii (i = 1, 2, .., L), is generated from the CDF, Equation (6), using the uniform random variable Fi, where F i [ 0 , 1 ] . In conjunction, the sample of the returned period of intensity, iTj(j = 1, 2, .., M), is generated from the CDF, Equation (8), using the uniform random variable Pi, where P i [ 0 , 1 ] . Lastly, the L events with different intensity, Ii (i = 1, 2, .., L), is arranged corresponding to the M return period, iTj(j = 1, 2, .., M). For the multi-hazard scenarios, the earthquake and wind events are assumed to occur independently, where the final timeline is added together, as further illustrated in the proposed procedure’s flowchart; see Figure 9.

4. Multi-Hazard Events

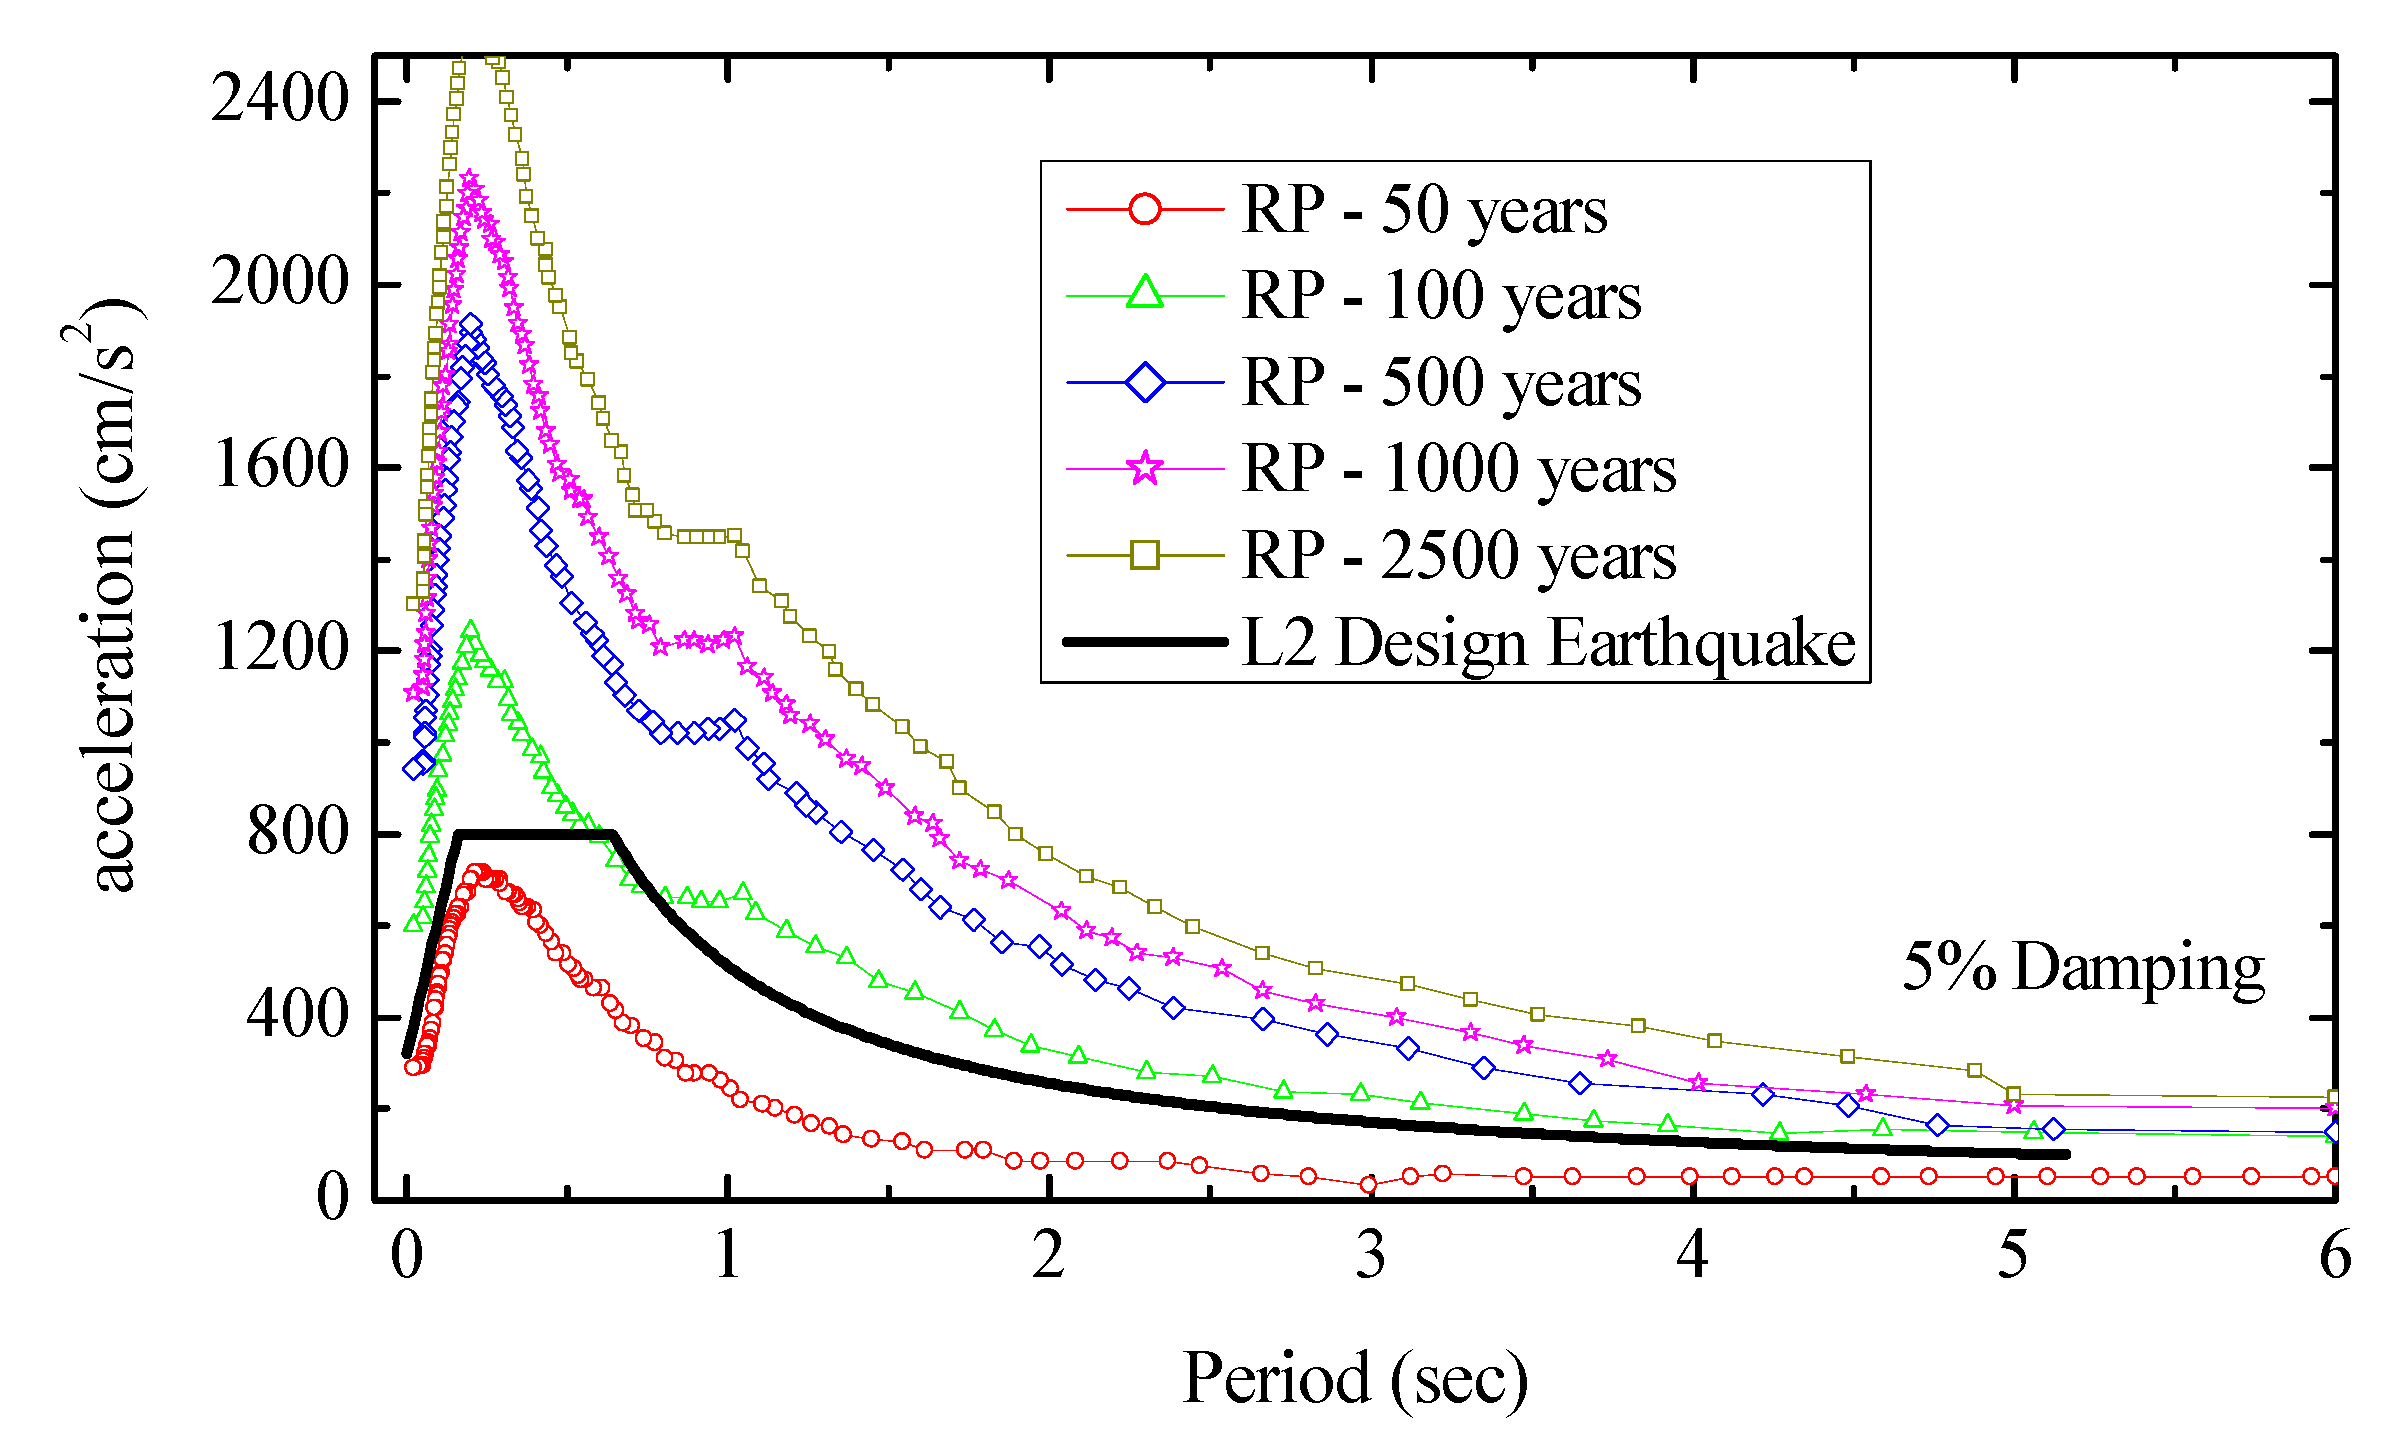
4.1. Earthquake Loads

Once the probable earthquake events are sampled for the project lifetime, the next task is to generate the ground motion time history data to be compatible with sampled earthquake intensities. In this regard, the Uniform Hazard Spectrum (UHS) provided in the AIJ (2019) for Nagoya City is used, as shown in Figure 10.
The recommended UHS is the acceleration response spectrum of 5% damping in the engineering bedrock (Vs = 292 m/s) level, with the probability of exceedance of 39%, 10%, 5%, and 2% over the 50 years. In case the intensity (PGA) of the probable earthquake is not matching the intensity of the recommended UHSs, the interpolation technique is used to generate the appropriate response spectra. Figure 11 illustrates the steps required to generate spectrum-compatible ground motions using the Fourier and phase spectra, following the algorithm developed by one of the authors, STERA_WAVE [36]. For the phase spectrum, corresponding to the PGA intensity of the estimated probable earthquake in the project lifetime, the historical earthquake has been carefully selected from Table 5, which has a similar PGA. The sequence of the selected phase spectrum to generate the sampled earthquake ground motion in each case is presented in Figure 12. In the case that the probably estimated intensity is smaller than 250 gal, the uniform random phase angle is adopted, and the ground motion is generated by multiplying the envelope function proposed by Jennings et al. [37].

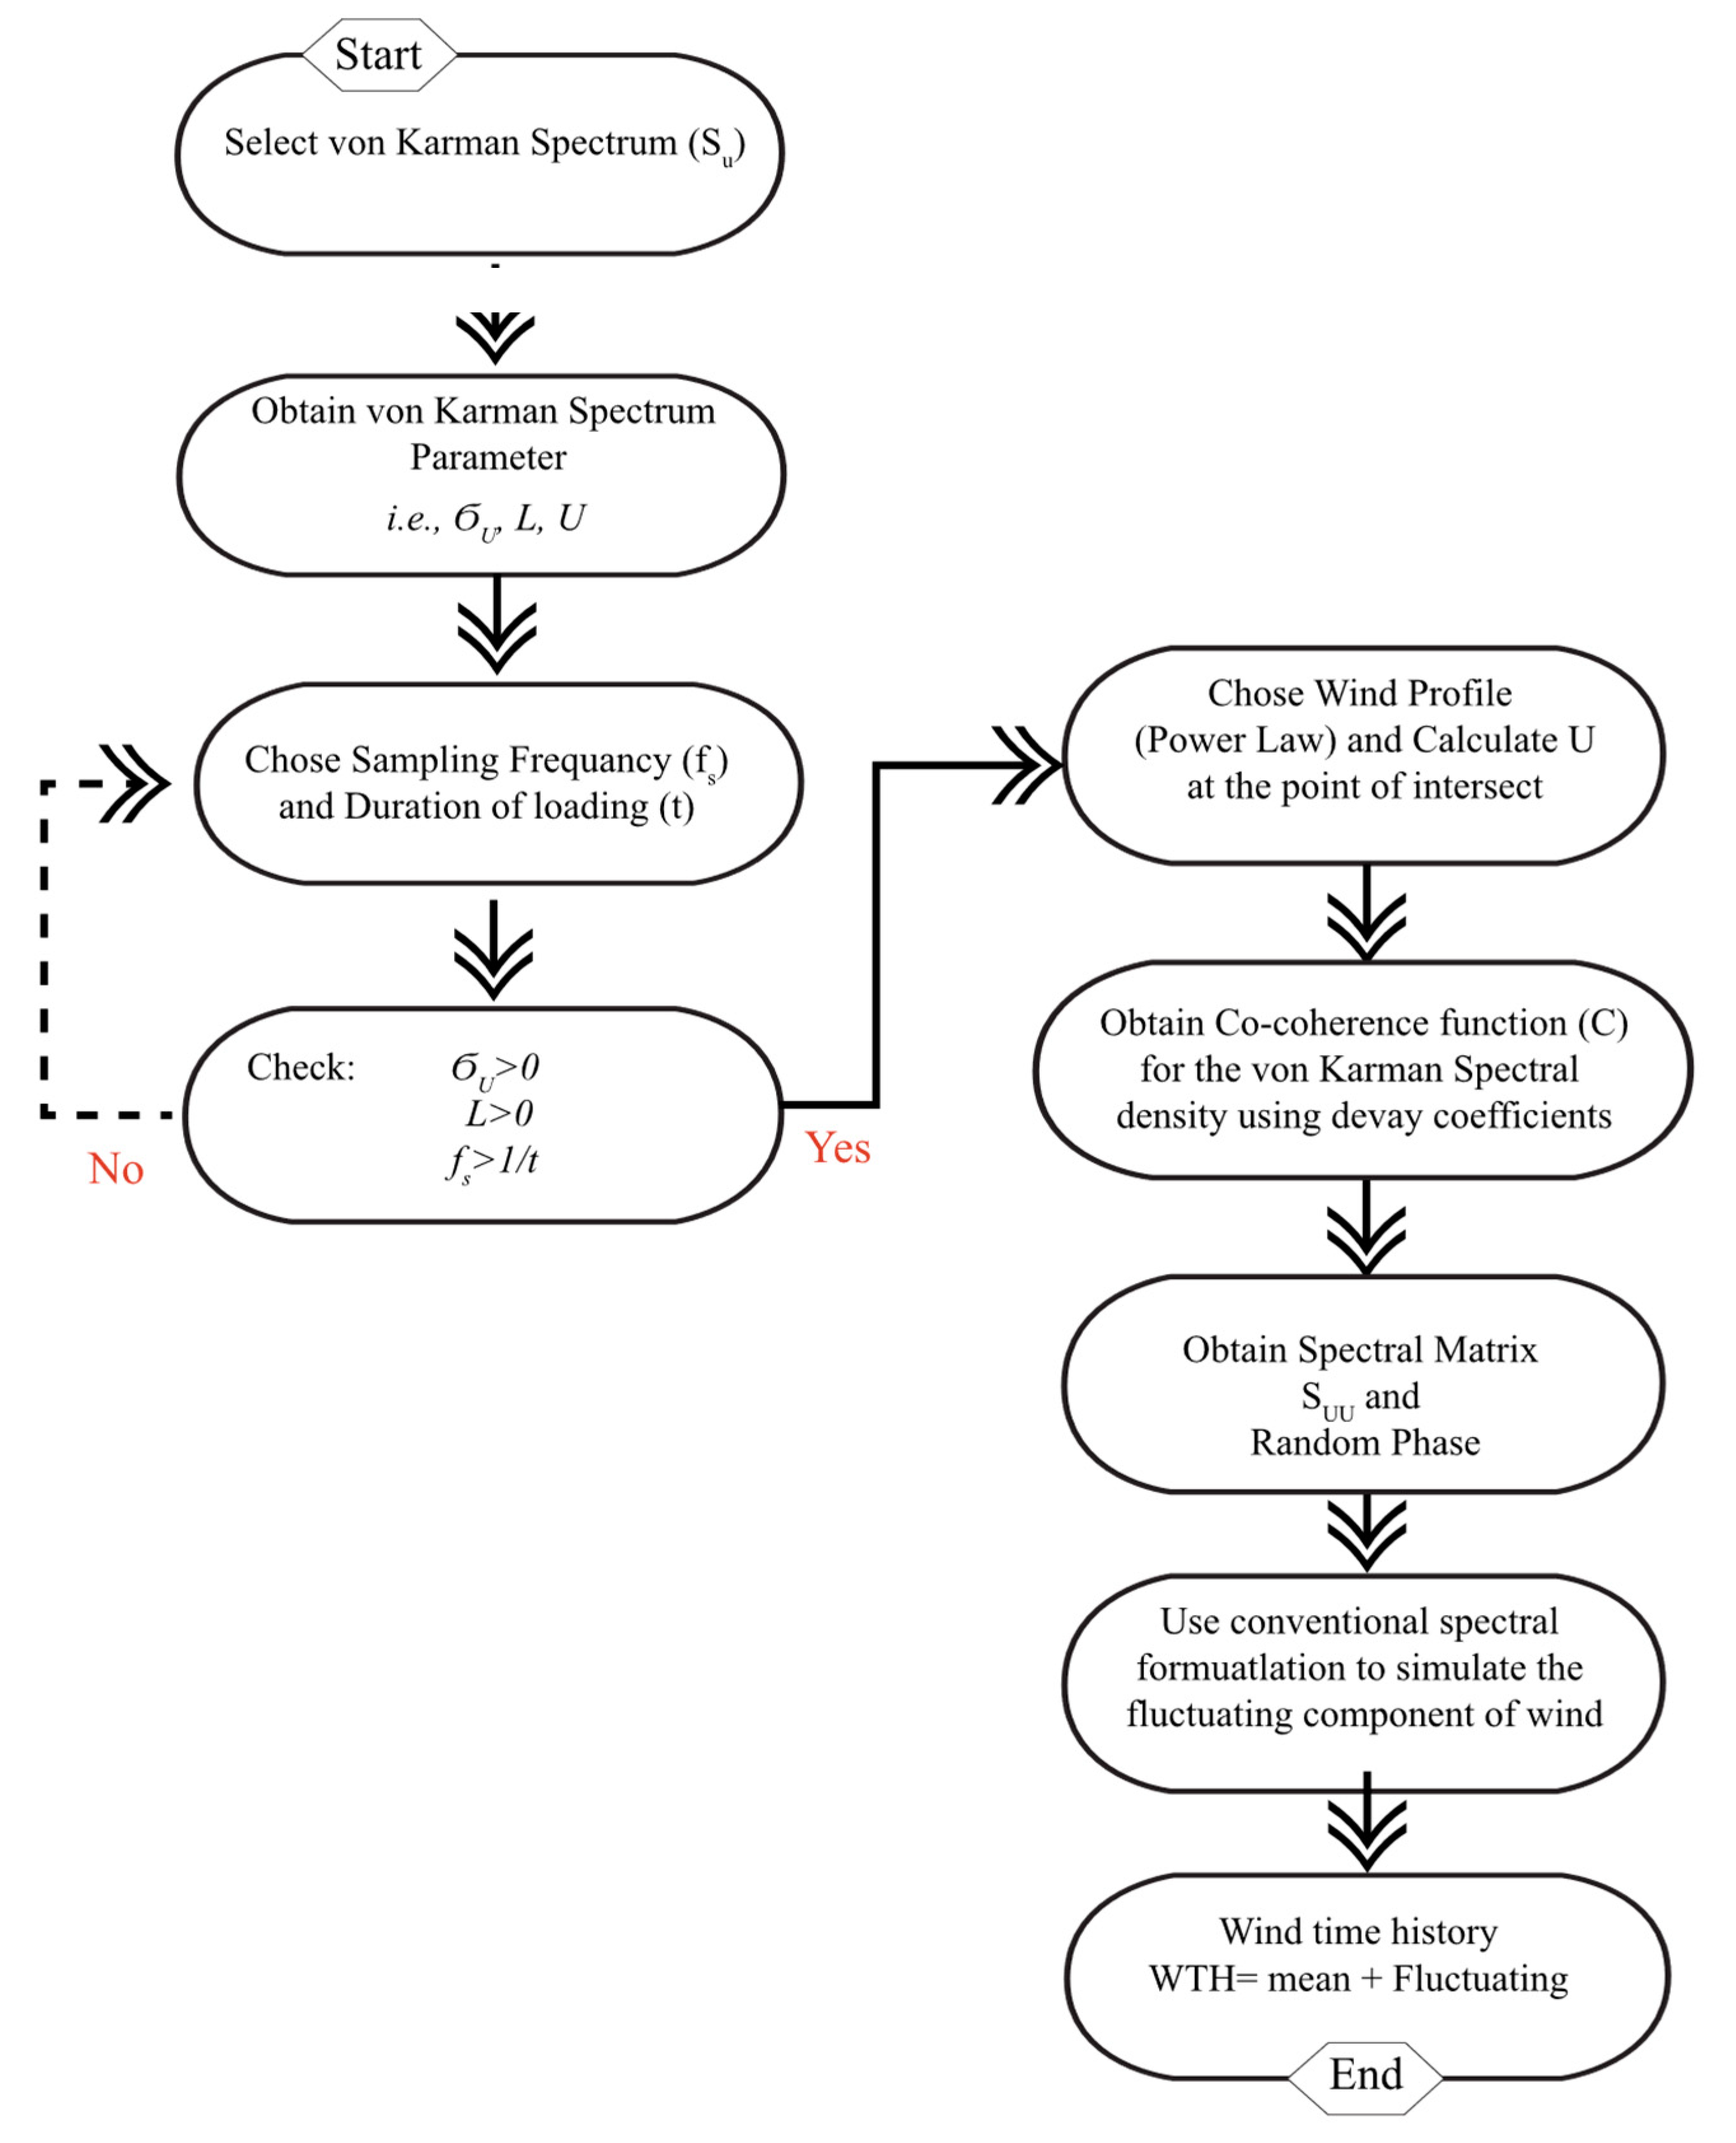
4.2. Long-Duration Wind Loads

Similar to the earthquake, after the wind events in the project lifetime are sampled, the wind load time-history data are generated following the AIJ (2015) [30] recommendations. The natural wind speed is consisting of the mean wind speed component ( U ¯ ( z ) ) and the fluctuating component (u(t)) in the longitudinal direction, which is changing with time. The AIJ (2015) [30] adopted the von Karman power spectrum to present the power spectral density of the fluctuating component of wind events, as given,
S u ( f ) = 4 σ u 2 { L z / U ¯ ( z ) } [ 1 + 70.8 { f L z / U ¯ ( z ) } 2 ] 5 / 6
where in the equation, f is the frequency spectrum of wind loads, σu is the standard deviation of the fluctuating component, U ¯ ( z ) is the mean wind speed at 10 m of ground level, and LZ is the turbulence scale.
The co-coherence of wind turbulence along with the structure height, which defines the frequency-dependent spatial correlation of wind speed fluctuation, is also considered as given below,
γ ( f , d j ) = Re   [ S i 1 , i 2 ( f , d j ) ] S i 1 ( f ) · S i 2 ( f ) = e x p ( C i j f d j U ( z ) ¯ ) ,   i = u , v , w ;   j = v , w
γ ( f , d j ) = e x p ( ( C u y · f d y ) 2 + ( C u z · f d z ) 2 U ¯ ( z ) )
where dj is the distance of two referenced nodes of Euclidian distance, Su is the power spectral density of turbulence in the longitudinal direction of a single point, and Cij is the decay coefficients. The current work employed the decay coefficients from the Norwegian Public Roads Administration (NPRA) Handbook N400 [38], and the power law is employed as well to estimate the wind speed force at story levels. Furthermore, the conventional spectral method introduced by Deodatis and Shinozuka (1991) [39] and Deodatis (1996) [40] is adopted to estimate the fluctuating component of wind load by simulating the multivariate random process in the time domain. The entire process discussed in this section is further illustrated in the flowchart, see Figure 13, and the corresponding parameters are summarized in Table 6.

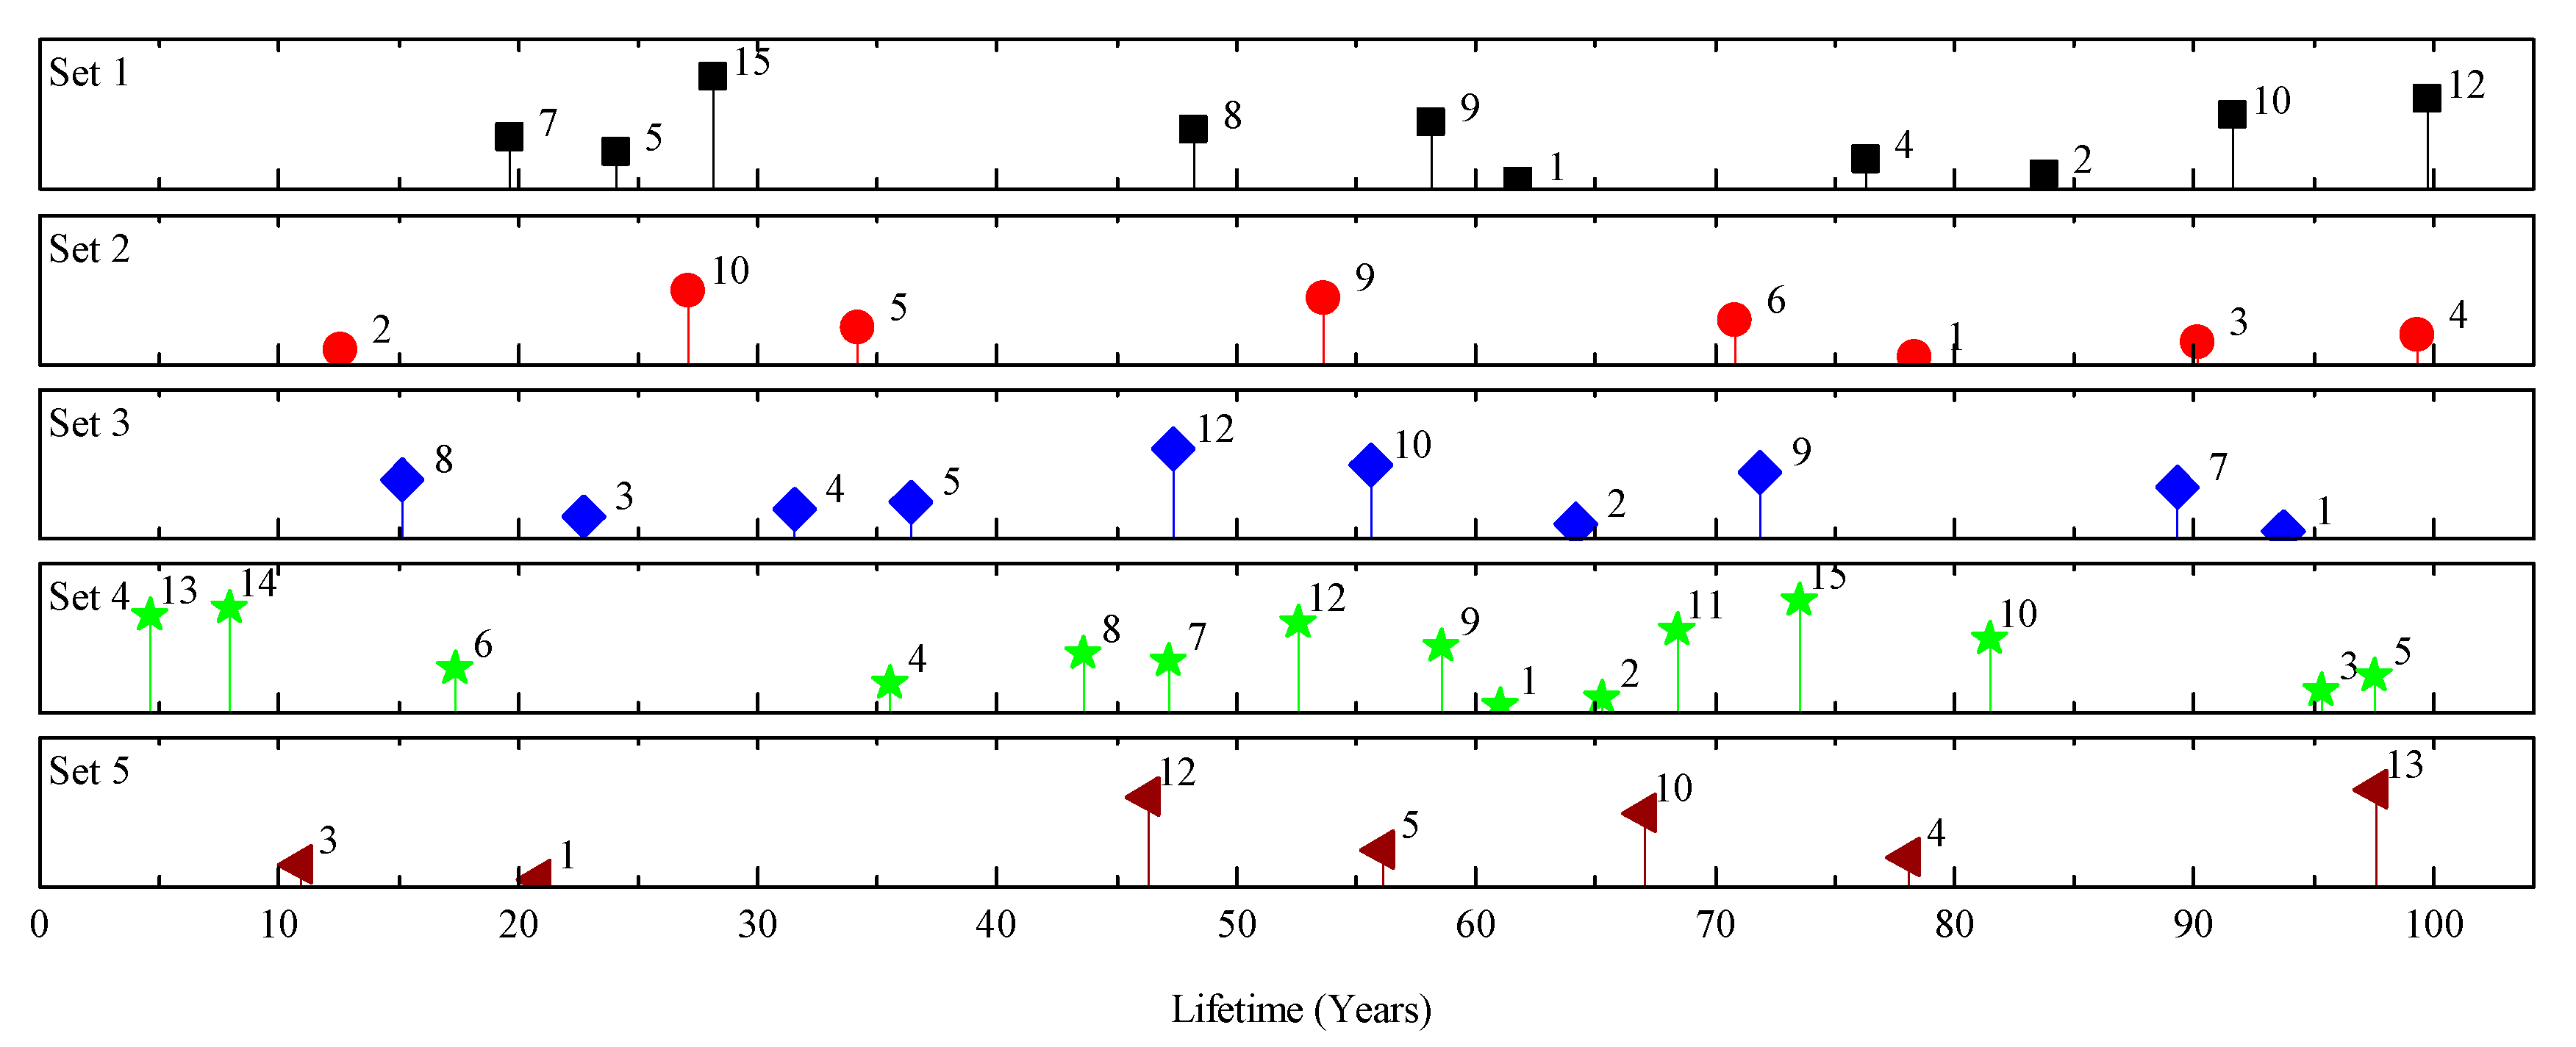
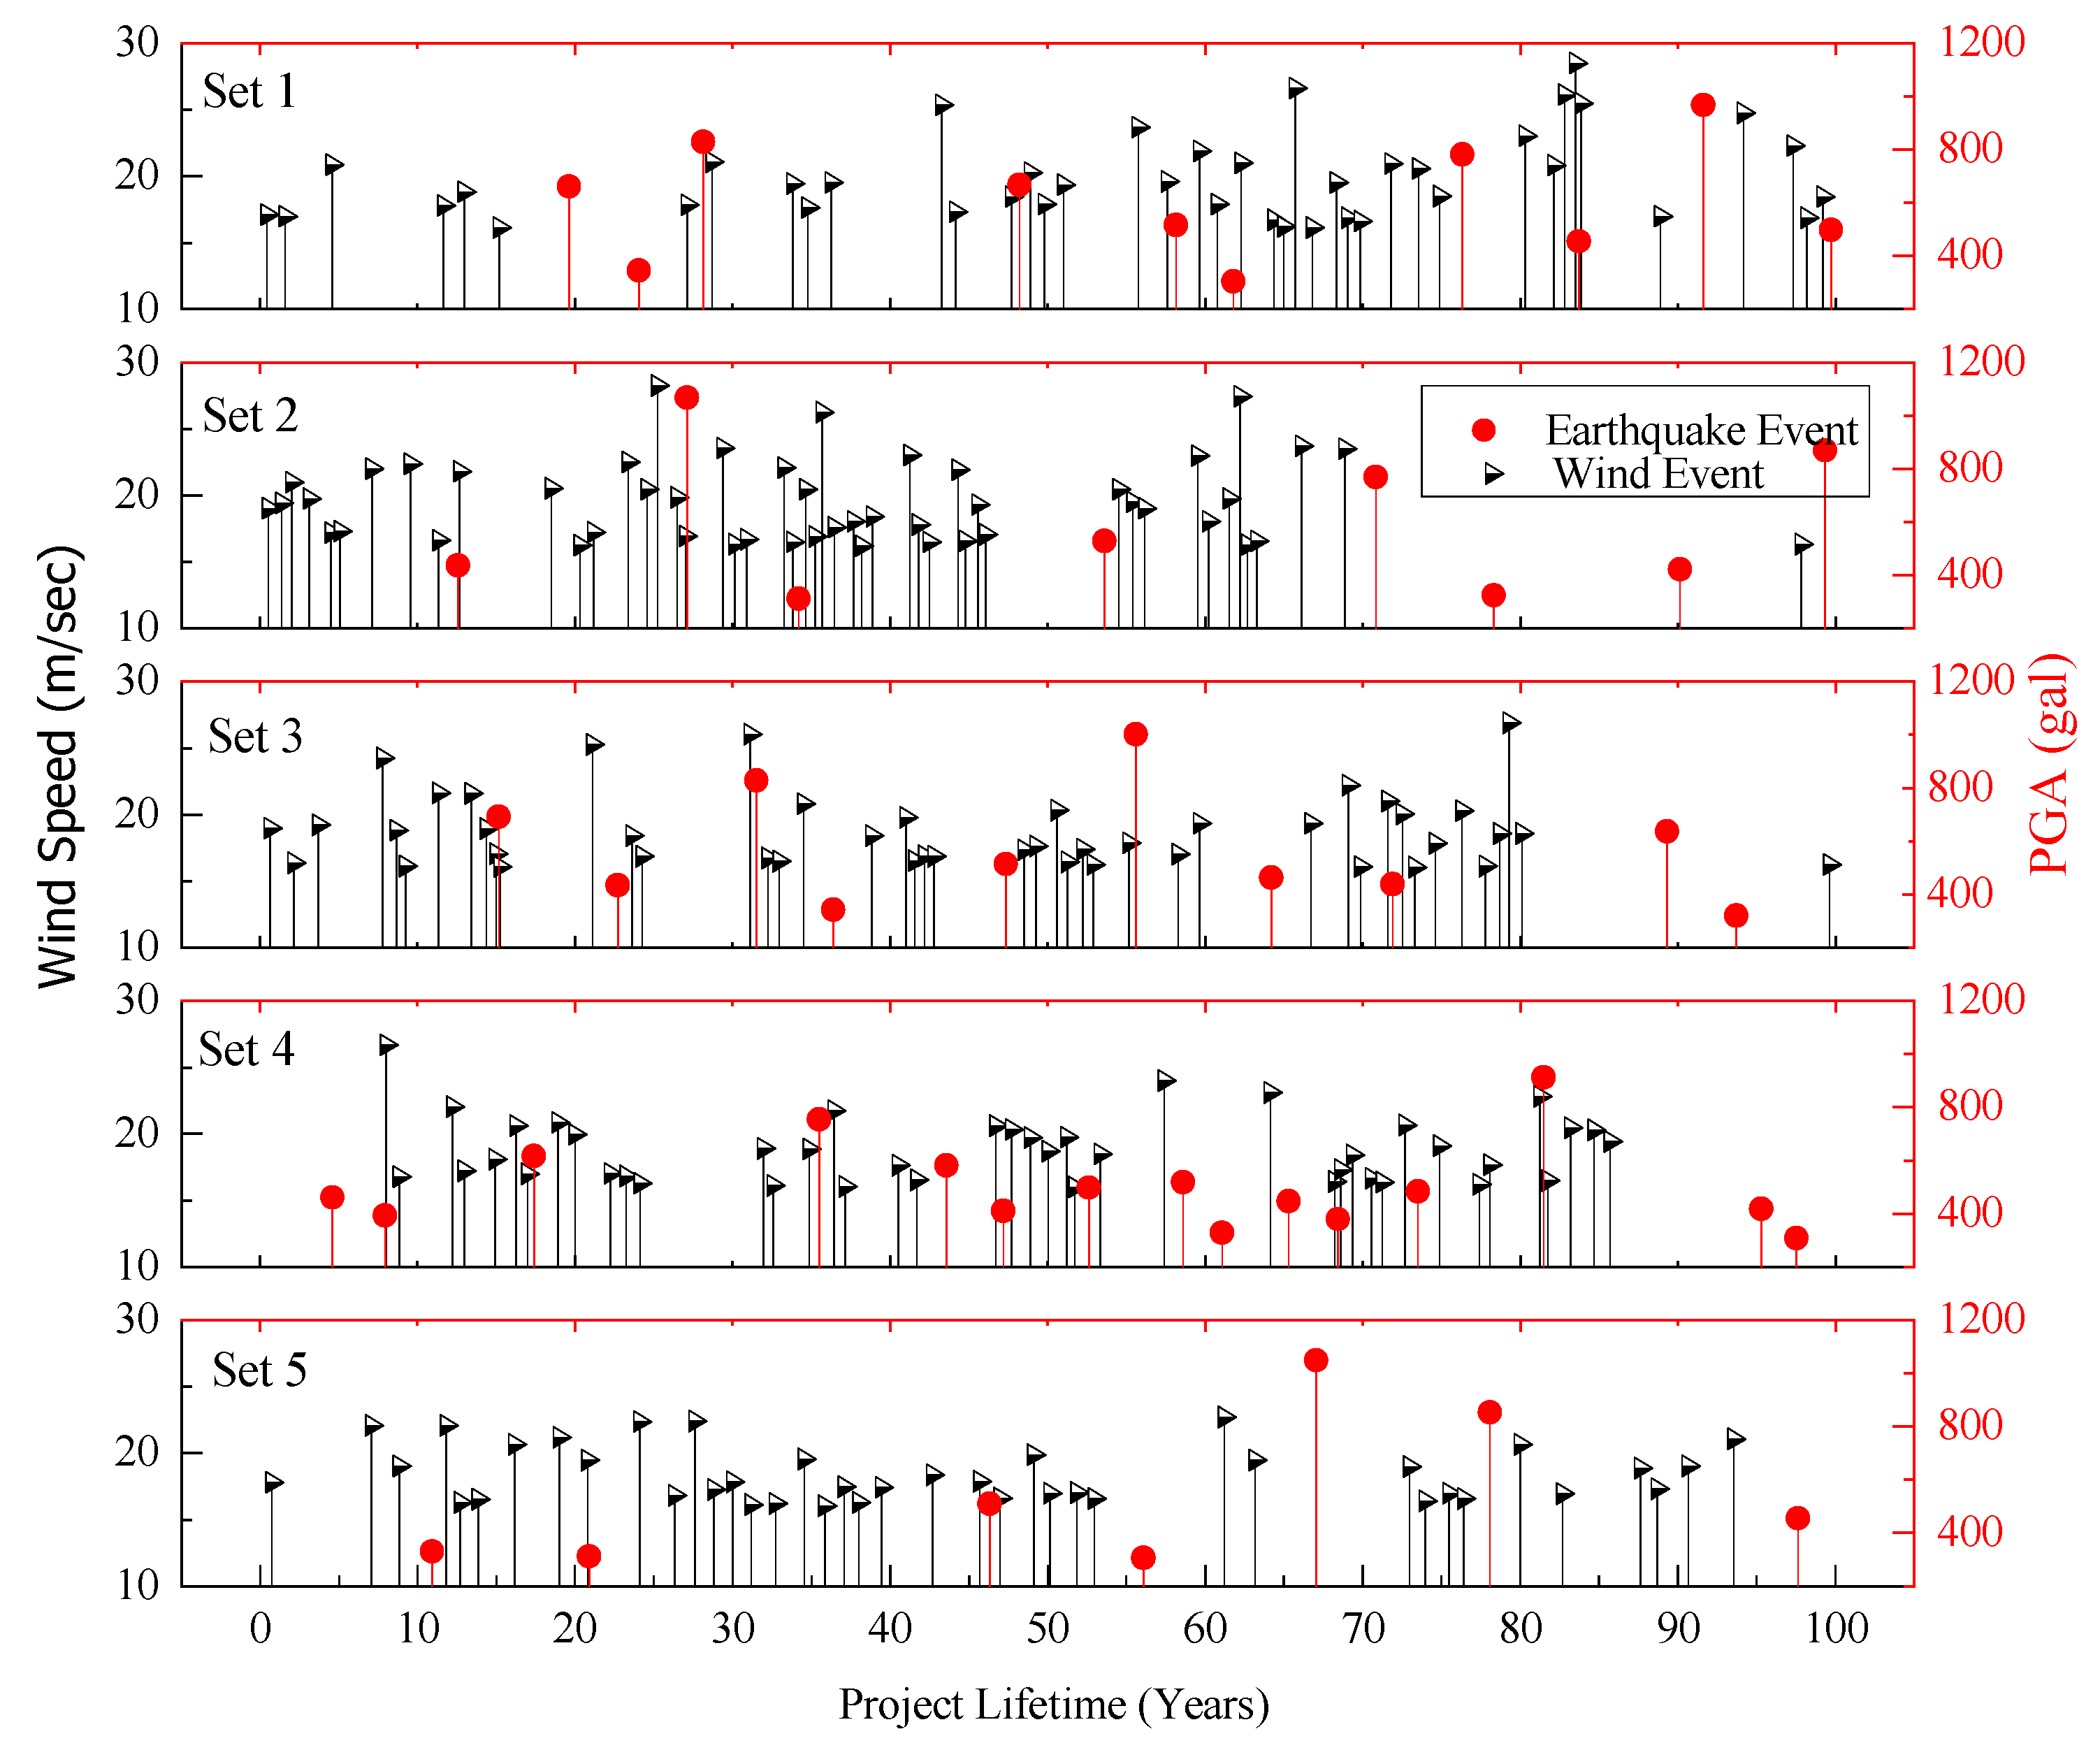
4.3. Multi-Hazard Timeline for the Target Building

Five random sets of timelines are developed from the earthquake and wind events of different return periods, as discussed in previous sub-sections, and presented in Figure 14. In each set of timelines, an average of ten earthquakes of different PGA (range from 250 to 1100 gal) is anticipated, where the earthquake events’ details and sequence are summarized in Table 5. Similarly, in each set of timelines, an average of 43 wind events (range from 16 to 31 m/s) is expected to occur.

5. Cumulative Damage Model

5.1. Fatigue Evaluation of BRBs Device

The fatigue life of BRBs is originated with the initiation of fatigue by the first yielding, and it grows slowly and gradually under each cyclic loadings until it reaches the failure thresholds. Thus, the fatigue life can be defined from the number of cycles Nf of the specific intensity that a BRB can sustain before the failure happens. For the earthquake and wind loads, which induce cyclic loads with variable intensities, the strain-based estimation of fatigue life is suitable. For this purpose, first, the random cyclic loads are sorted in bins of similar strain; then, for each of the bins, the cumulative damage is computed from the S-N curves, and finally, using the Miner’s rule, the fatigue failure is evaluated.

5.2. Variable-Load Cycle Counting

The BRBs under earthquake and wind events experience variable-load cycles over the time of excitation. Therefore, it requires a proper procedure to estimate the number of cycles and classify the time-varying load history to a constant and equivalent load of similar amplitude. The rainflow counting method, which was developed by Matsuishi and Endo (1968), has demonstrated good agreement with the observed fatigue damage and was widely adopted by researchers [41]. Thus, the current work practiced the rainflow counting method to estimate the number of cycles corresponding to the strain amplitude of BRBs under wind and earthquake excitations.

5.3. Strain–Cycle Relationship of BRBs

Coffin (1962) and Manson (1966) defined the relationship between the number of cycles until the failure, Nf, and the strain amplitude, Δεt, which leads to fatigue failure, as given in Equation (13). Usually, this relationship is derived from experimental results or empirical formulas based on statistical data. The fatigue life of BRBs, manufactured in Japan, has been studied extensively under different loading scenarios such as the shaking table test [42], the constant amplitude fatigue test [43], the BRB frame shaking table test under random amplitude [44], and the truss frame test under gradually increasing amplitude [45]. Takeuchi et al. [46] observed that the fatigue properties of BRBs are not considerably changed for different types of steel material, wherein the approximate strain-failure cycle relation is given as below,
Δ ε t [ % ] = 0.5 N f 0.14   ( Δ ε t < 0.1 % ) Δ ε t [ % ] = 20.48 N f 0.49 ( 0.1 % Δ ε t < 2.2 % ) Δ ε t [ % ] = 54.0 N f 0.71 ( Δ ε t 2.2 % ) .

5.4. Miner’s Damage Rule

According to the Miner rule, if there are j number of strains of different intensities in a strain profile, the cumulative damage index (CDI) is defined as,
C D I = i = 1 j n i N i   1
where ni is the number of cycles of the ith strain, and Ni is the number of cycles to the failure point under the ith strain. The failure occurs when the CDI reaches one.
Now, by substituting the BRBs strain–cycle relation, Equation (13), into the Miner rule, Equation (14), the cumulative damage of BRBs subjected to random cyclic loads of earthquake and wind excitations can be presented as follows,
C D I = i = 1 j n i ( Δ ε t 0.50 ) 1 0.14   ( Δ ε t < 0.1 % ) C D I = i = 1 j n i ( Δ ε t 20.48 ) 1 0.49 ( 0.1 % Δ ε t < 2.2 % ) C D I = i = 1 j n i ( Δ ε t 54.0 ) 1 0.71 ( Δ ε t 2.2 % ) .

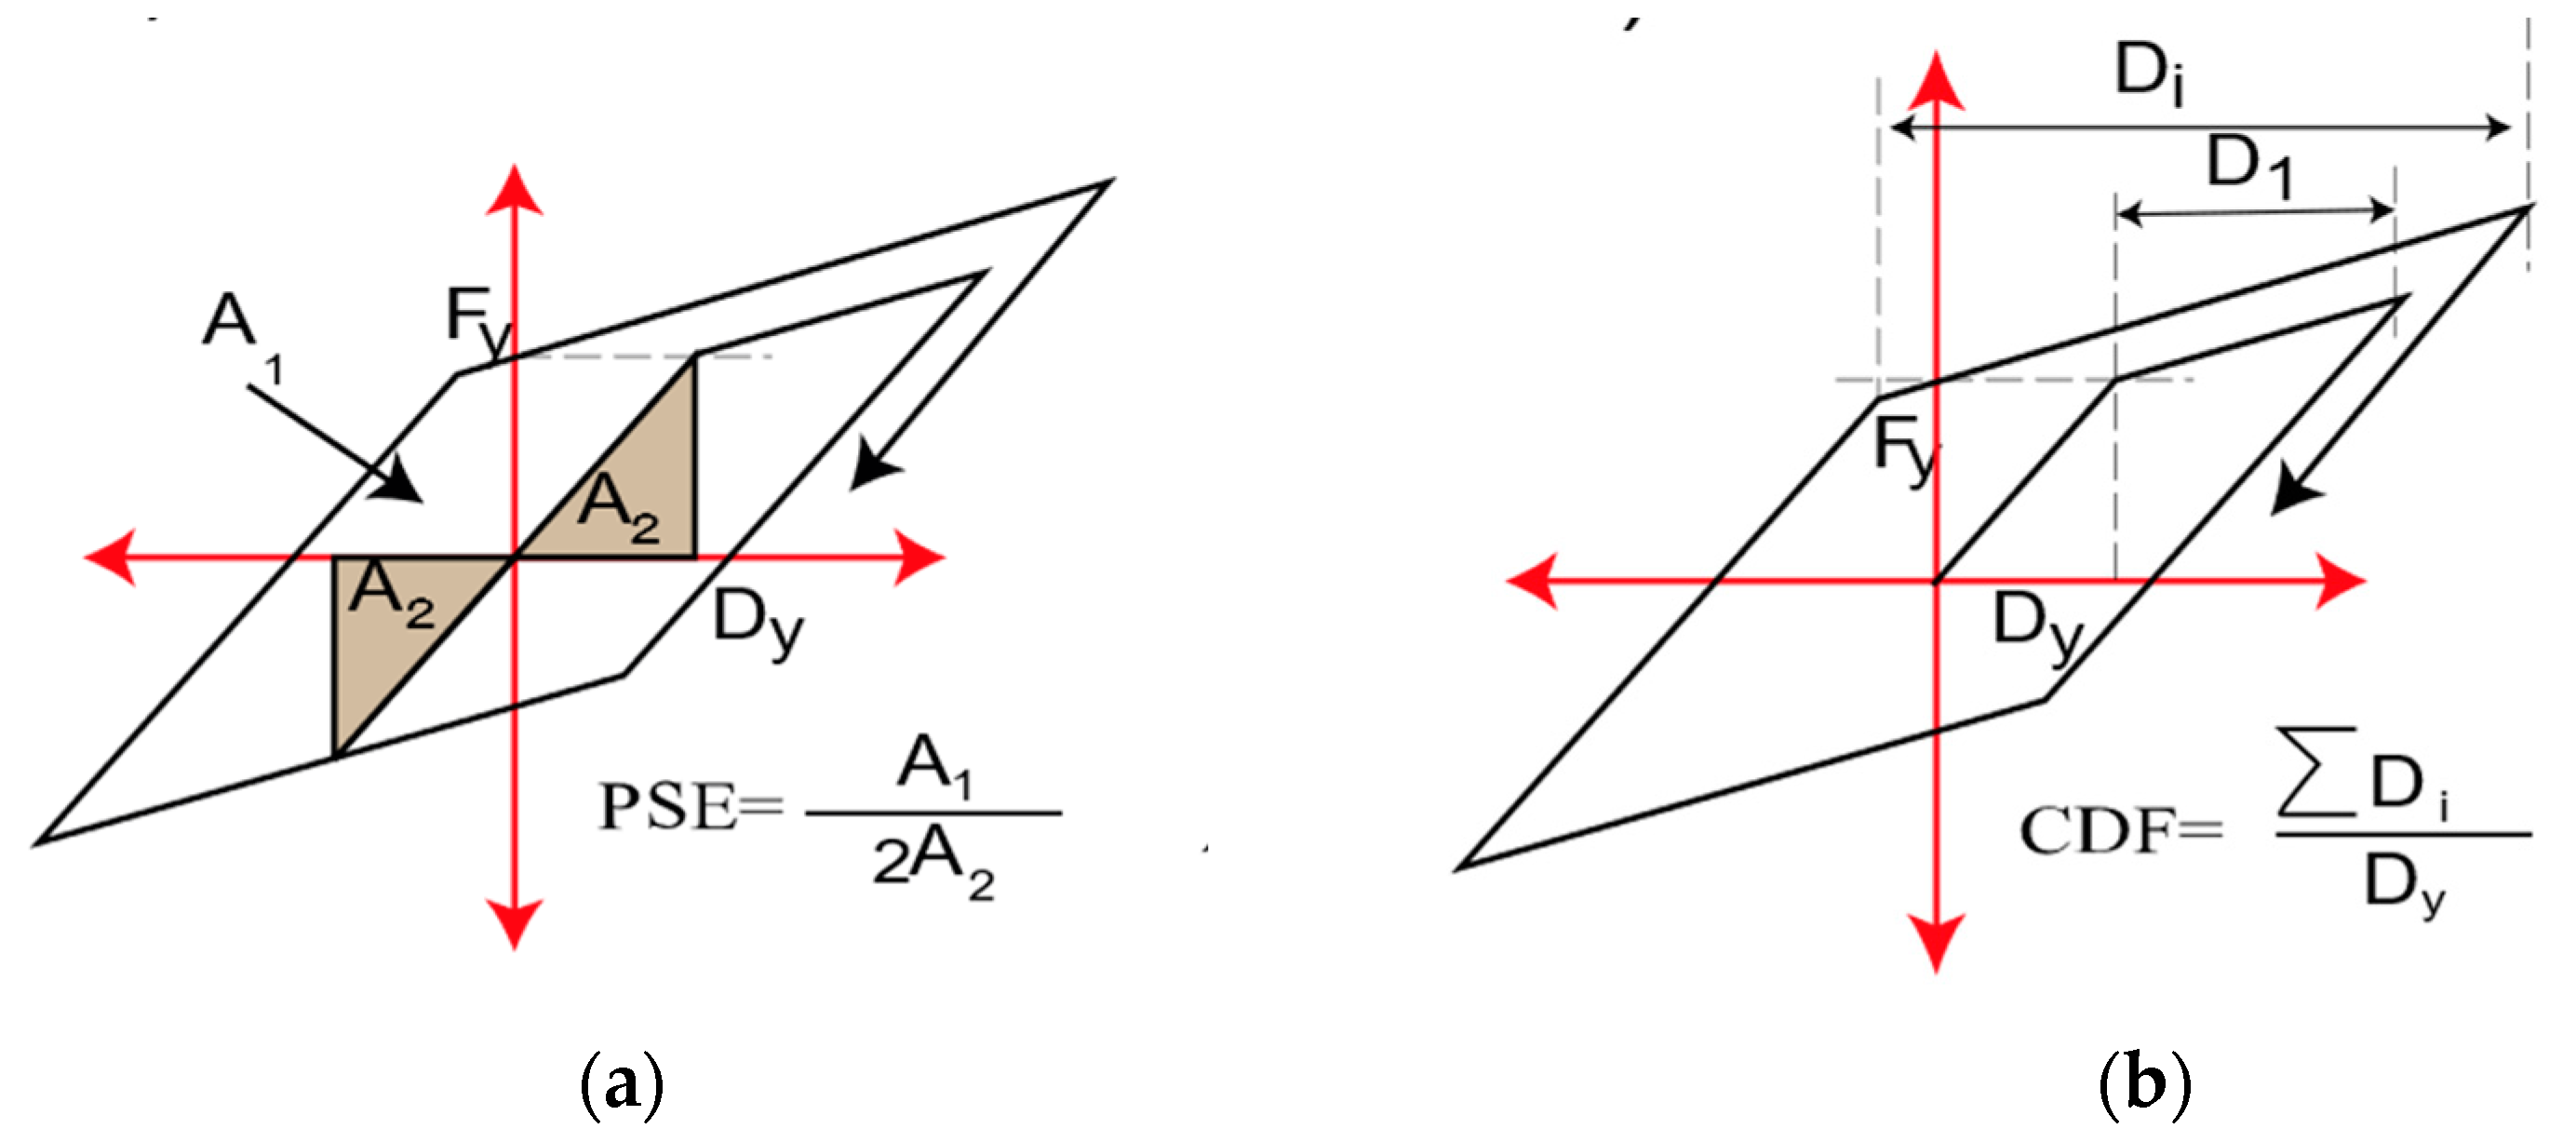
5.5. Plastic Strain Energy (PSE)

The study conducted by Chung and Lee (1994) [47] introduces the plastic strain energy (PSE) as a damage criterion, because in each cycle of excitation, an irrecoverable amount of PSE is inserted into the steel elements, which in response initiates and propagates the fatigue crack. Therefore, the cumulative damage of BRBs is further evaluated in terms of plastic strain energy (PSE), which is defined as the ratio of the area of plastic strain energy (Et) by the triangular area (Ey) shaped by the yield and deformation strengths of RBR, as shown in Figure 15a. The experimental study conducted by Iwata and Murai (2006) [48] introduces the PSE as a suitable indicator for the performance evaluation of BRBs in moment frames. The study recommends Equation (16) as a threshold to evaluate the safety of BRB in terms of cumulative plastic strain energy [48].
P S E = 150   R
  R = P E P y
In the equation, PE is the buckling strength of the restrainer, and Py is the yield strength of the steel core plate. The R factor is an indicator of the stable energy absorption capacity of BRBs.

5.6. Cumulative Ductility Factor (CDF)

Similarly, the accumulative damage of BRBs in the high-rise steel building under successive application of multi-hazard scenarios is investigated in terms of cumulative ductility factor (CDF). The CDF is an important indicator that describes the plastic deformation capability of the BRB devices before resulting in structural destruction. As presented in Figure 15b, the CDF is the normalized summation of total plastic deformation to the yield strength of BRB, as defined in Equation (18).
C D F =   ( D i ) D y
C D F = 75   R
Researchers extensively examined the low-cycle fatigue capacity of BRBs in terms of cumulative ductility demands [49,50,51,52,53,54] and recommend the minimum criteria. FEMA-450 [51] and ANSI/AISC [54] recommend that the CDF demand should be at least 140 and 200, respectively, to ensure the cumulative ductility capability of the device. In the current research study, the result of the experimental study conducted by Iwata and Murai (2006) [48], as given in Equation (19), is utilized to evaluate the BRBs performance in the building lifetime.

6. Result and Discussion

6.1. Outline of Analysis and Results

For the target building, the overall performance is investigated in terms of story drift and shear force. The cumulative damage index, plastic strain energy, cumulative and maximum ductility demands are used to investigate the progressive damage of BRBs. For this purpose, five BRBs are selected along with the height of the target building to examine the results. The selected BRBs that are located in the 2nd, 5th, 10th, 15th, and 19th stories are denoted as BRB#1-#5, respectively, as shown in Figure 1. For the selected dampers, Table 7 summarizes the absorbed energy, the number of cycles, and strain amplitude obtained from the rainflow counting method after successive analysis of the five sets of lifetime multi-hazard scenarios. Since the average strain amplitude is higher for the damper installed in lower stories, the BRBs’ contribution to absorb the MH energy becomes larger in response the accumulative damage increase. Table 7 also indicates that the energy absorption rate in upper stories is significantly smaller in comparison to the BRBs in lower stories.

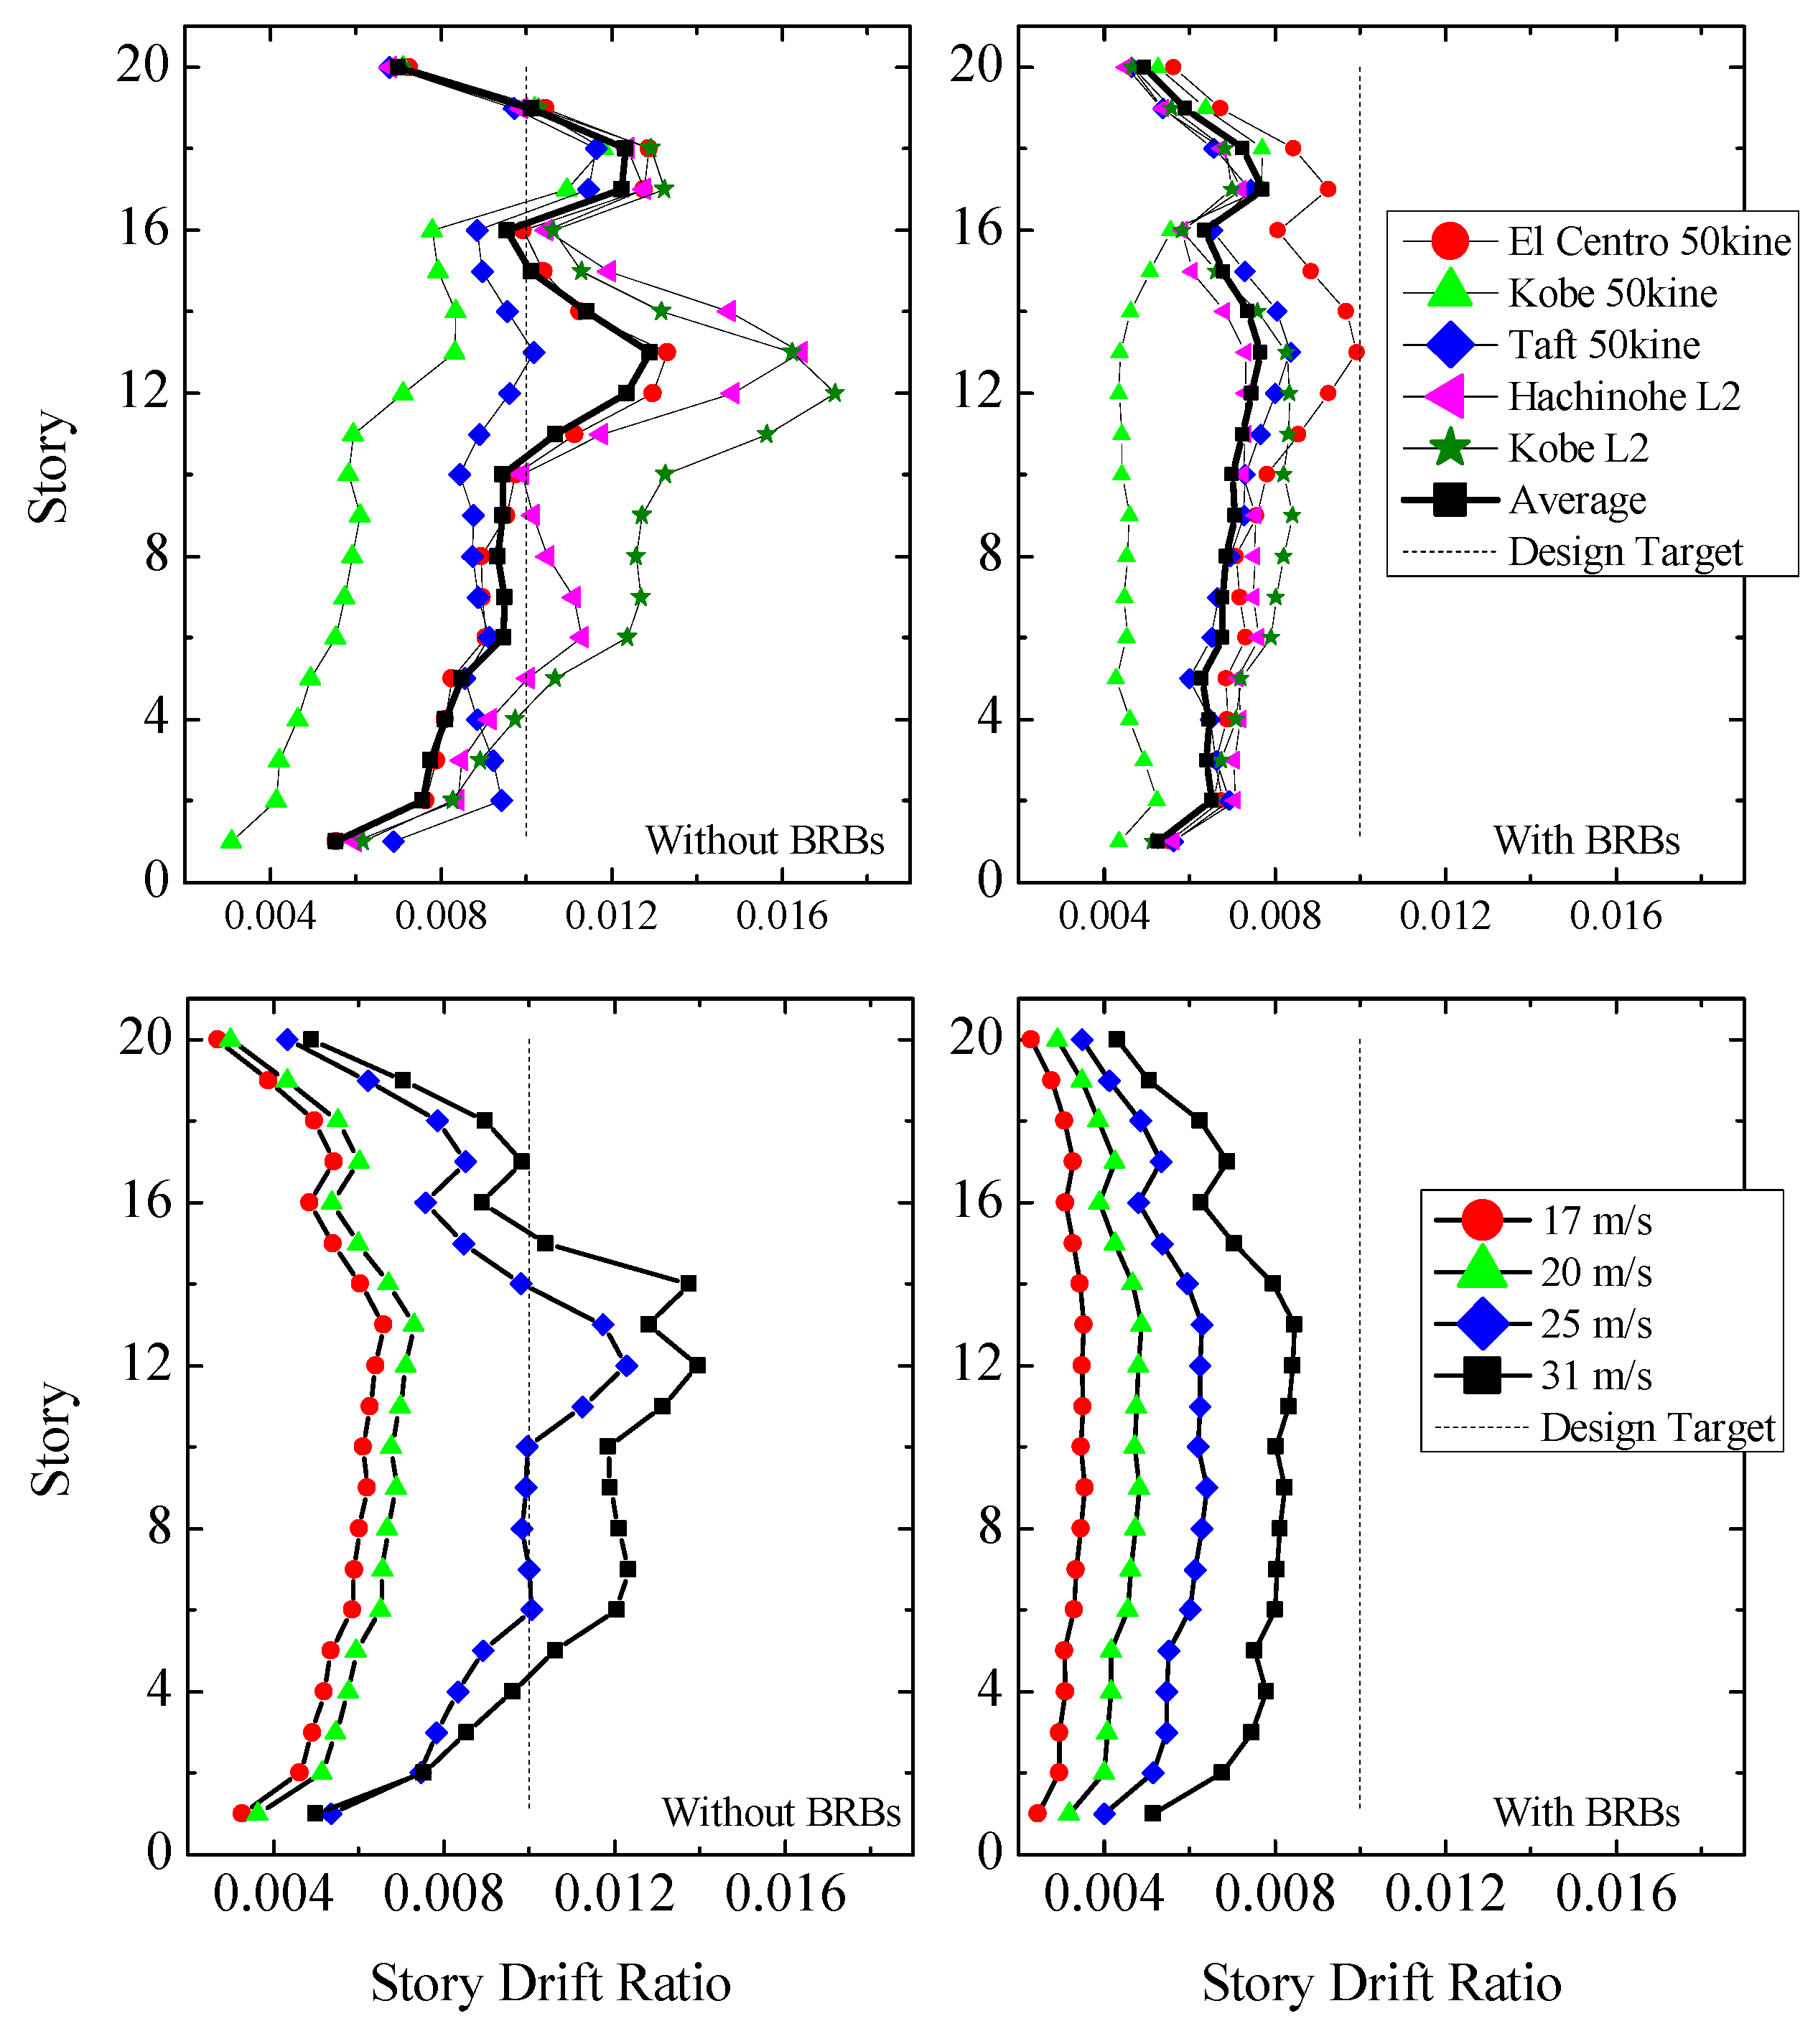
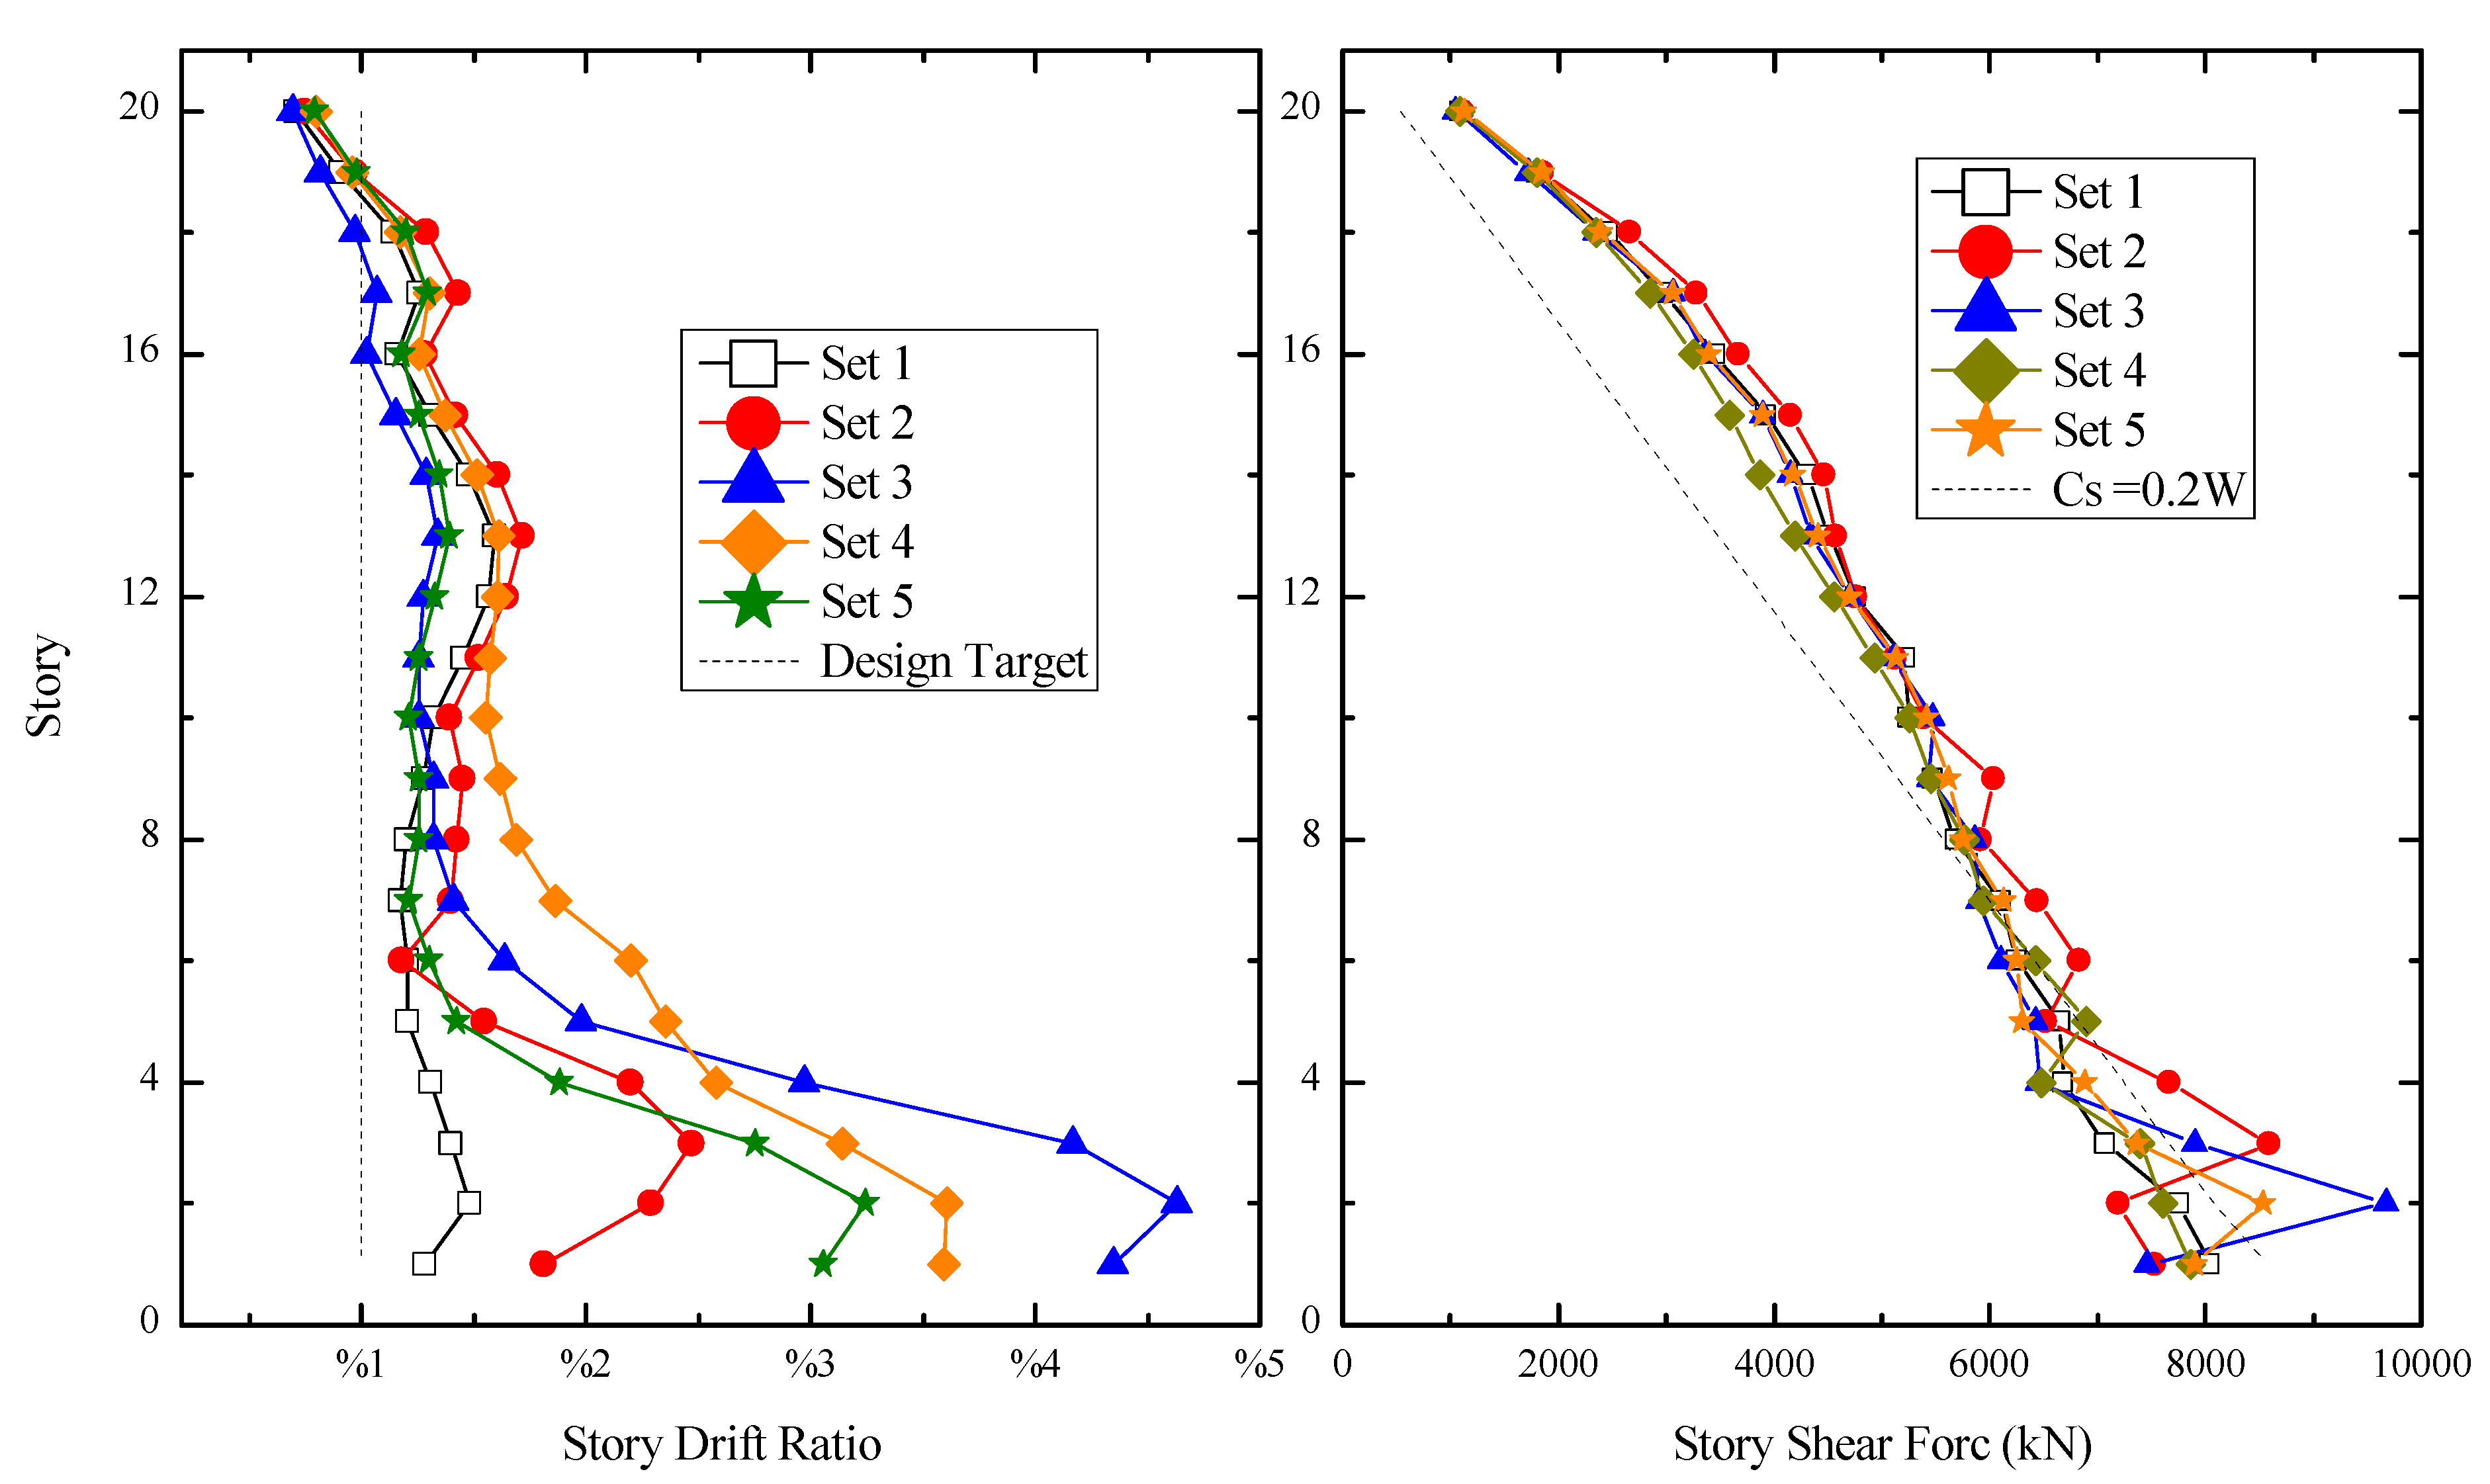
6.2. Story Drift Ratio of the Target Building

Figure 16 presents the envelope of maximum story drift and shear force of the target building under the five sets of multi-hazard scenarios. Comparing the maximum story drift ratio with the design target of 1%, the maximum story drift obtained from multi-hazard timelines is 2.0–5.5 times larger than the design target. Although the story drift amplification for the lower story in contrast to the upper story is three times larger, the upper stories are not able to endure the design drift as well. In addition, the distribution of the maximum story shear force is approximately equal to the distribution of the story shear force (dotted line) when the seismic base shear is CS = 0.2 W, where W is the weight of the building.

6.3. Cumulative Damage Index (CDI)

Figure 17 demonstrates the increase in cumulative damage index (CDI) for the selected BRBs under the application of five sets of multi-hazard scenarios. As indicated in Table 1 and Table 7, the estimated CDI for BRB#1–5 with an average strain amplitude of 0.05, 0.03, 0.025, 0.02, and 0.01% is about 0.64, 0.1, 0.03, 0.015, and 0.005, respectively, which indicates that CDI is decreasing in upper stories. Accordingly, none of the selected BRBs are reaching the failure status (CDI = 1.0) according to Miner’s rule.

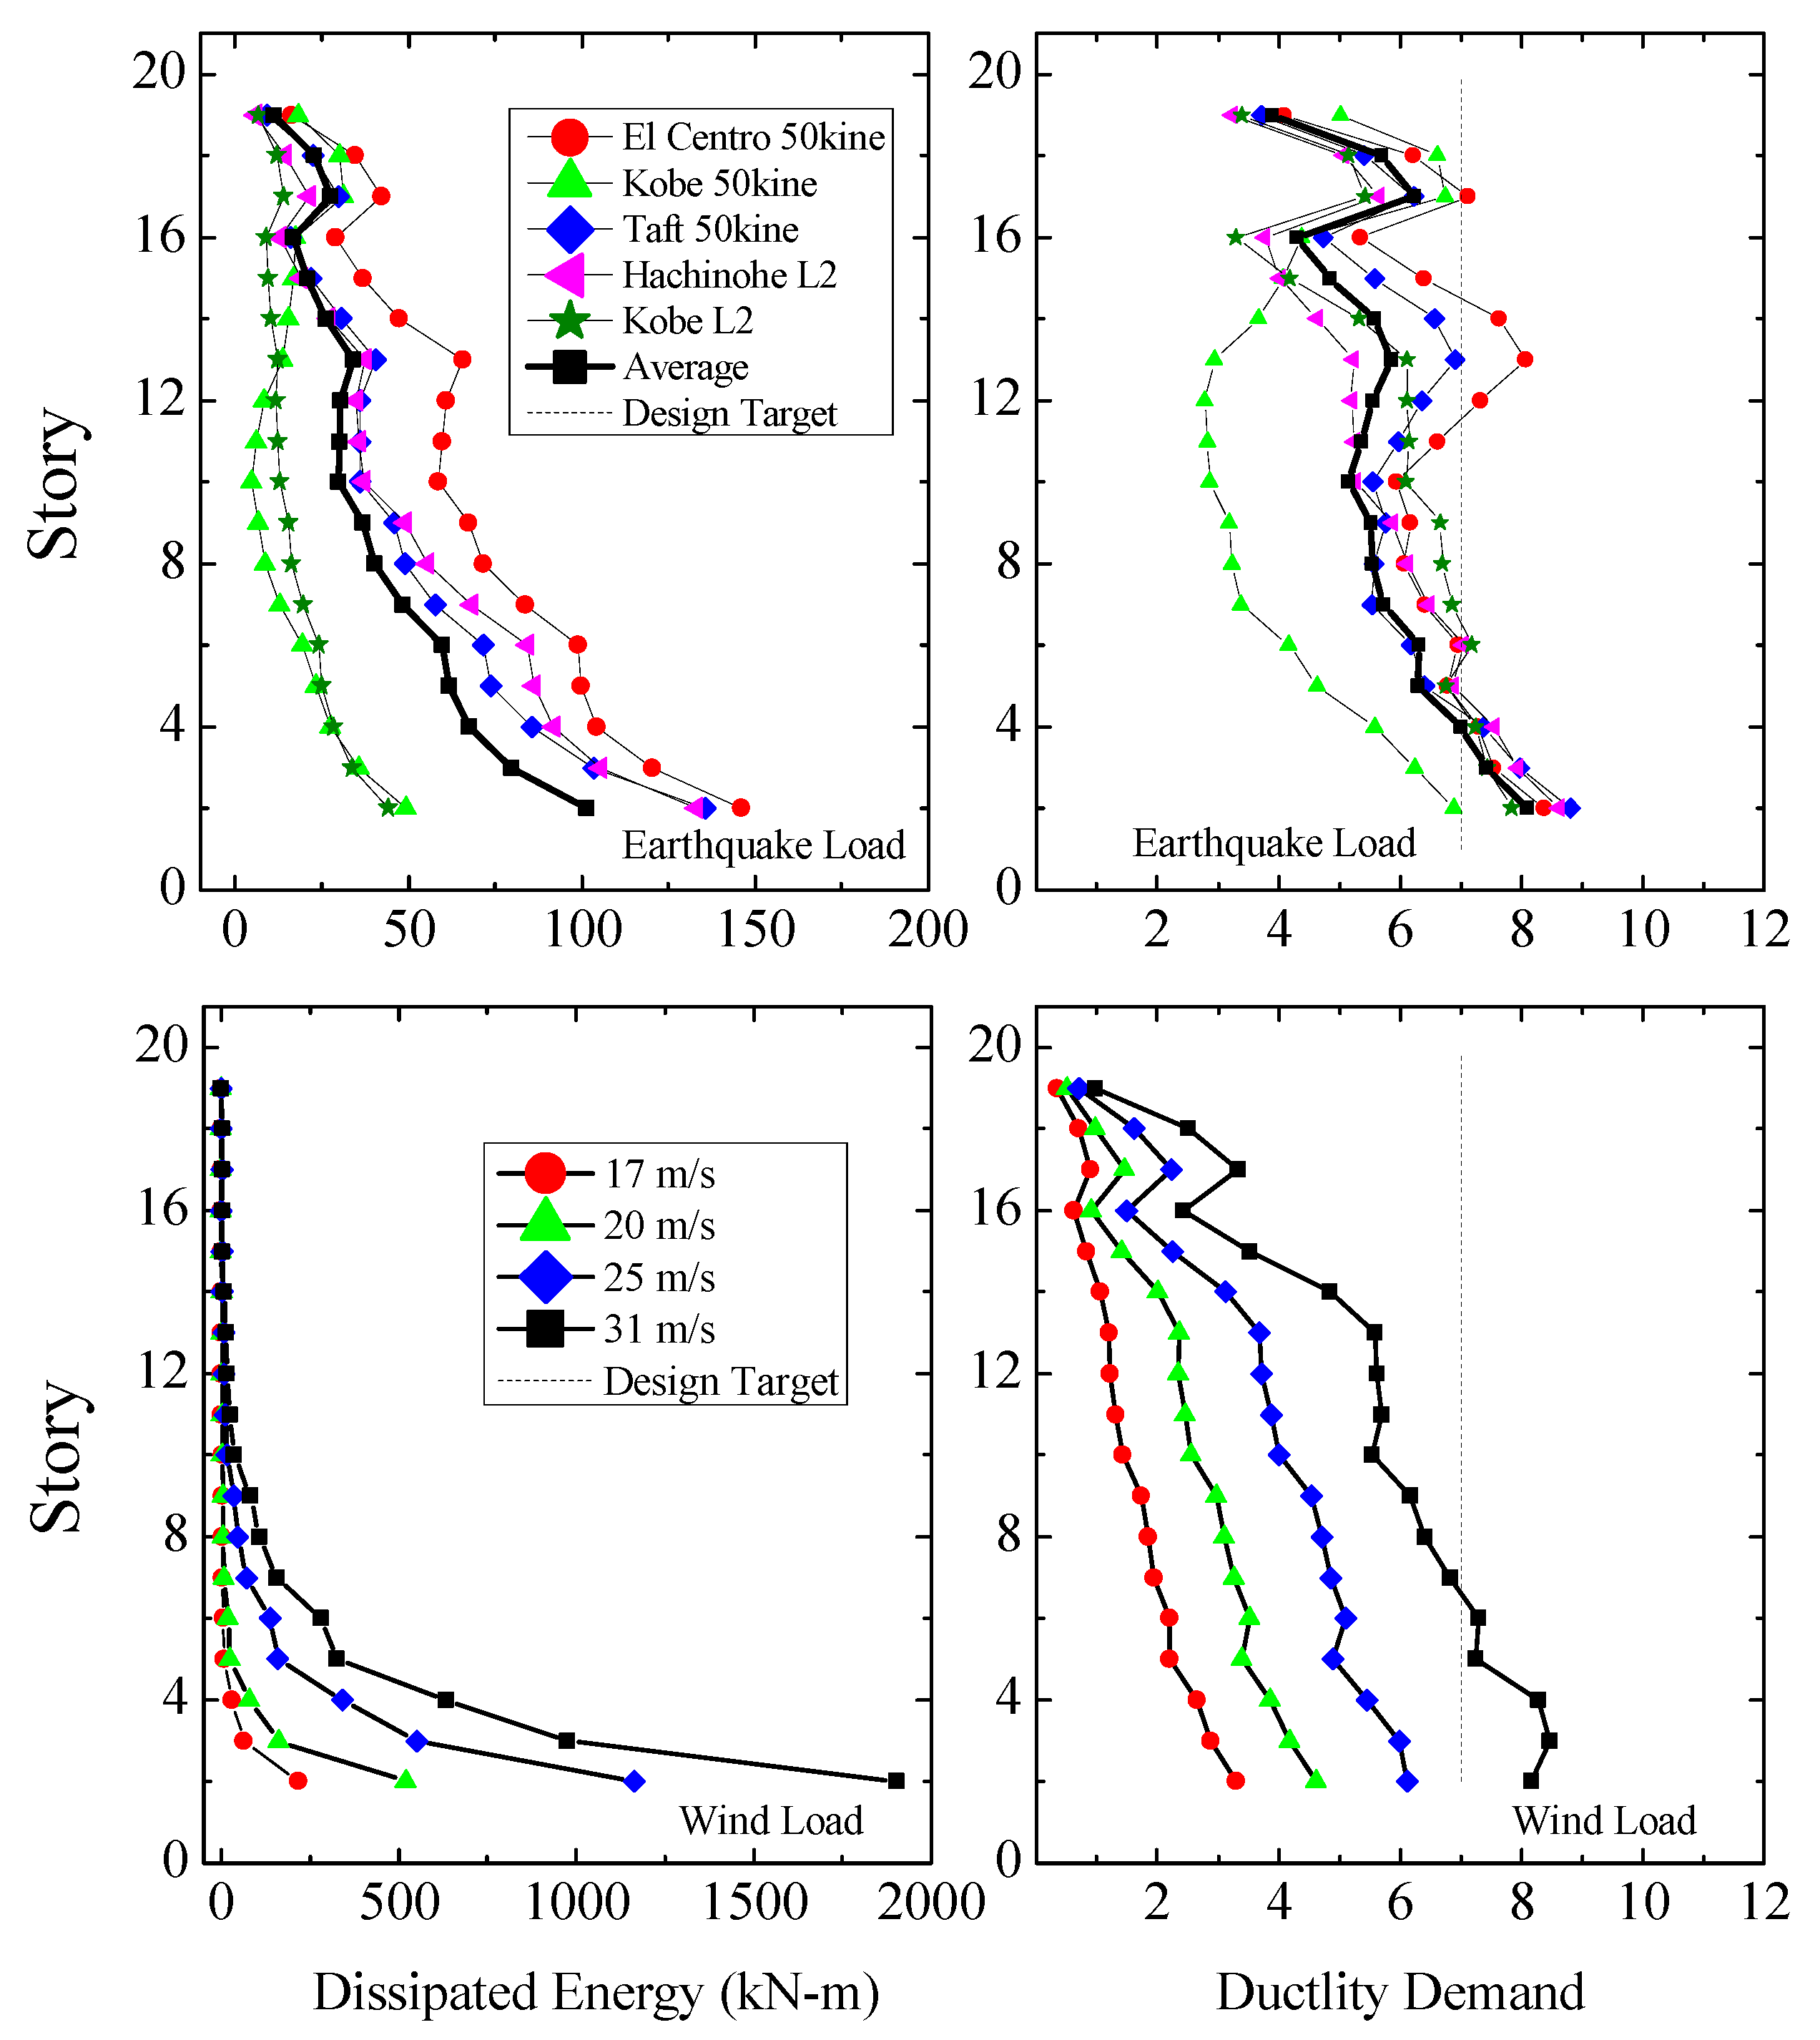
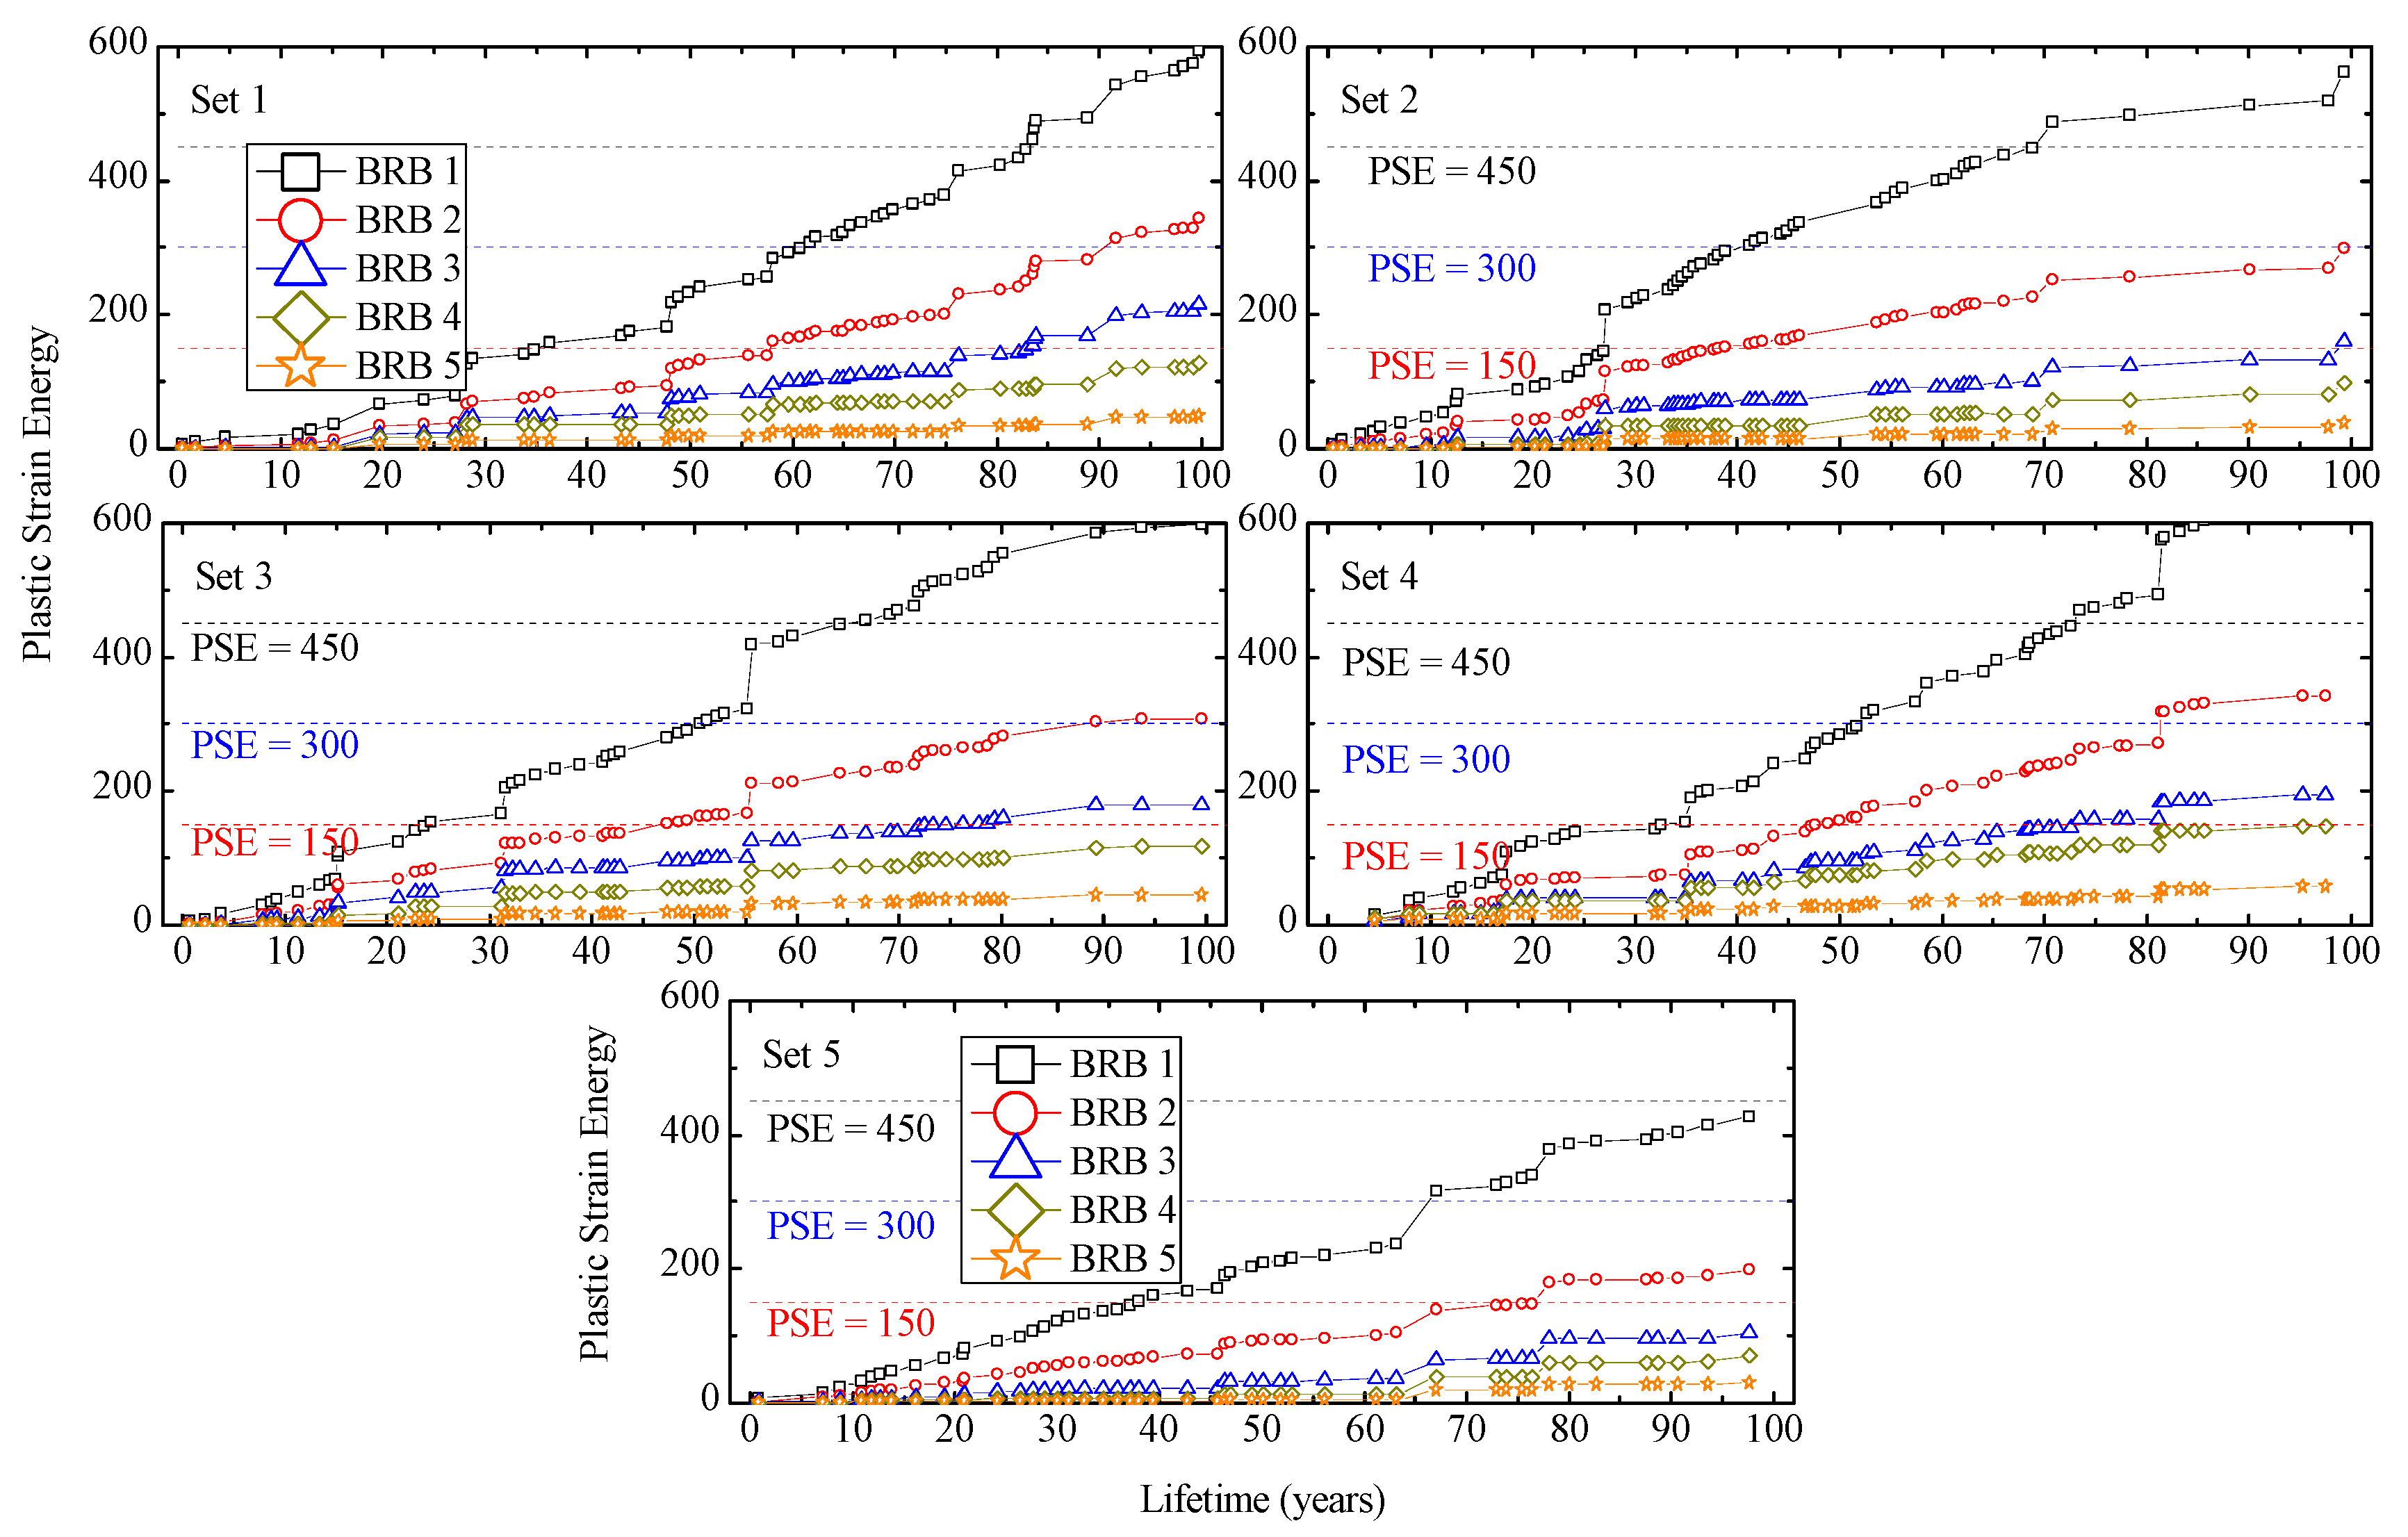
6.4. Plastic Strain Energy (PSE)

Figure 18 presents the increase in estimated plastic strain energy (PSE) for the five selected BRBs under the successive analysis of multi-hazard scenarios. Since the PSE of BRB is associated with the R factor as PSE = 150 R [48], for a certain (R = 1, 2, 3, and 4), the PSE is marked to illustrate the BRB’s progress damage. It is observed that the fatigue life of BRB#1, in terms of plastic strain energy, is about 25 years and 80 years for R = 1 and 4, respectively. Meanwhile, the estimated plastic strain for the BRB#5 (CDI = 0.005, R = 1) is below 150 after a service period of 100 years. In contrast to the CDI, the PSE reveals that even the BRBs with an average strain amplitude of less than >0.03% are prone to progressive damage under multi-hazard scenarios.

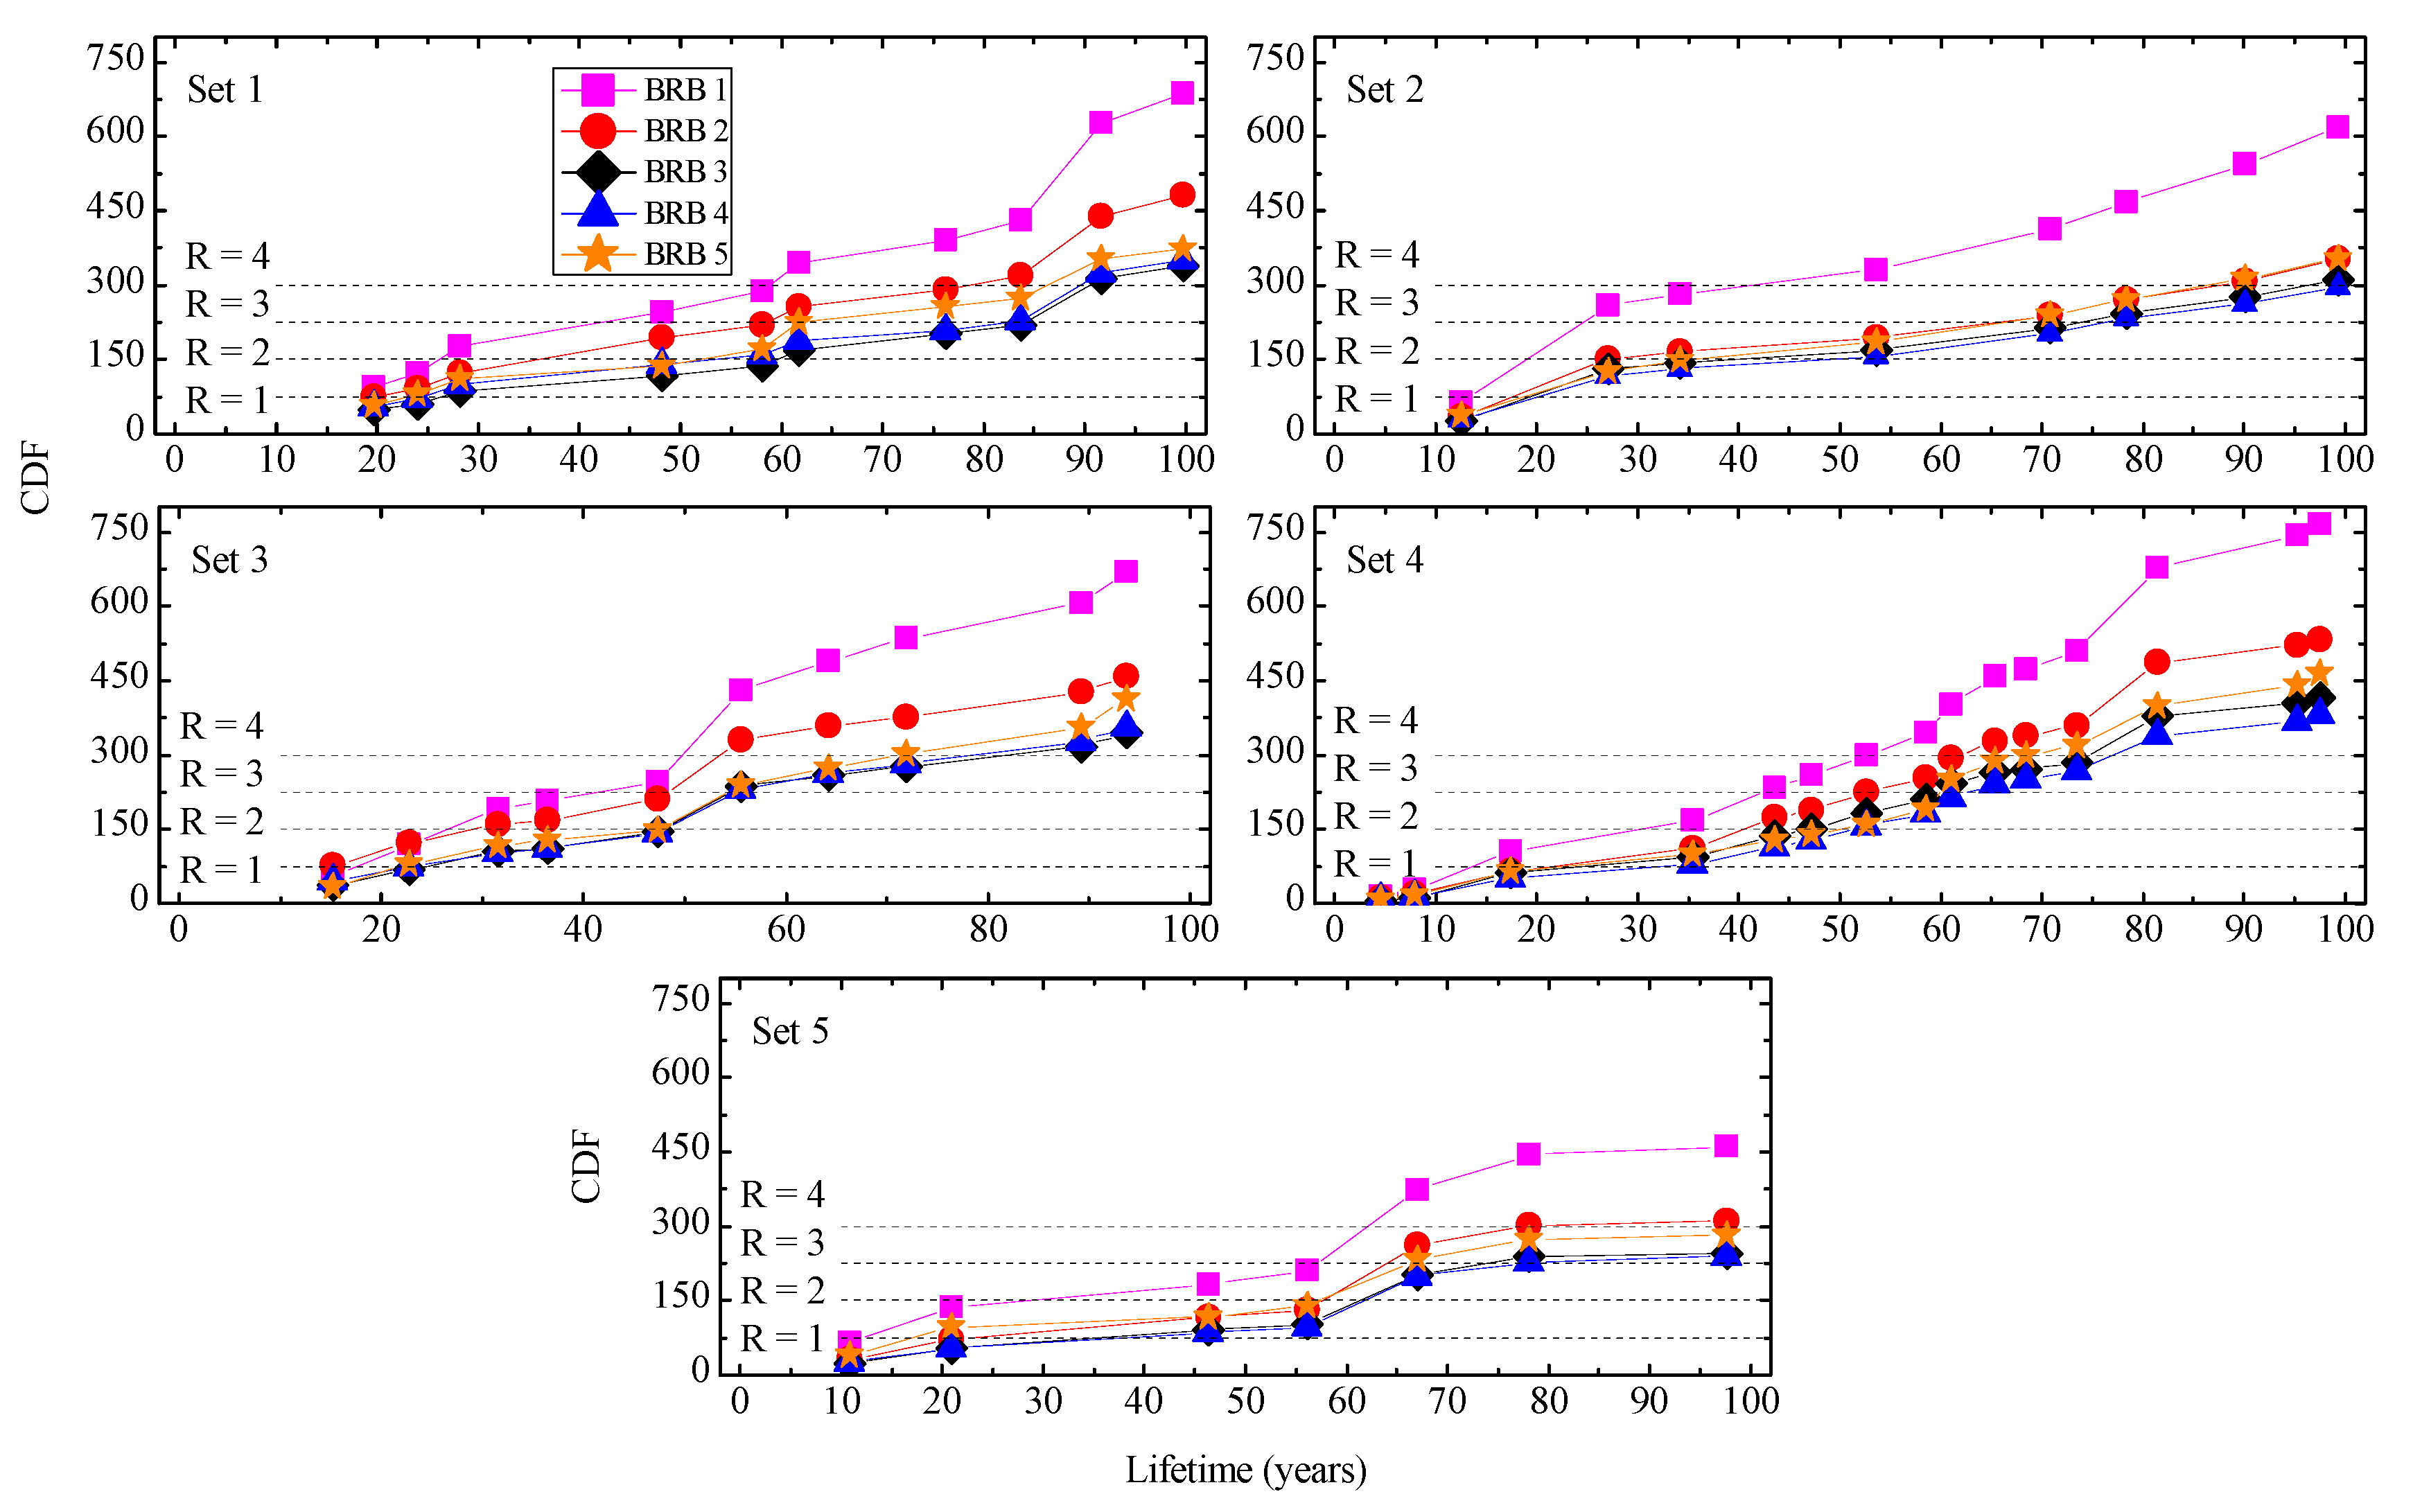
6.5. Cumulative Ductility Factor (CDF)

Figure 19 shows the increase in cumulative ductility factor (CDF) for the selected BRBs corresponding to the five sets of the multi-hazard scenarios. In the figure, the horizontal lines mark the CDF criteria according to Equation (18) for the certain R factors (R = 1, 2, 3, and 4, CDF = 75, 150, 225, and 300) to measure the progressive damage of selected BRB in terms of CDF. In contrast to the CDI and PSE, it is observed that all the selected BRBs are reaching their maximum capacity in terms of cumulative ductility factor. The effective age of the BRBs (with R = 4) is about 40–75 years corresponding to the BRB’s location in the high-rise building and average strain amplitude. On the other hand, the CDF capacity of the BRBs (with R = 1) is about 20 years, regardless of the average strain amplitude and damper location. Comparing the results of CDI and PSE with the cumulative ductility factor, it is important to point out that the BRBs that satisfy the CDI and PSE indexes are severely prone to progressive damage in terms of CDF. Therefore, the current study recommends precisely evaluating the fatigue life BRBs under different multi-hazard scenarios in terms of different fatigue criteria.

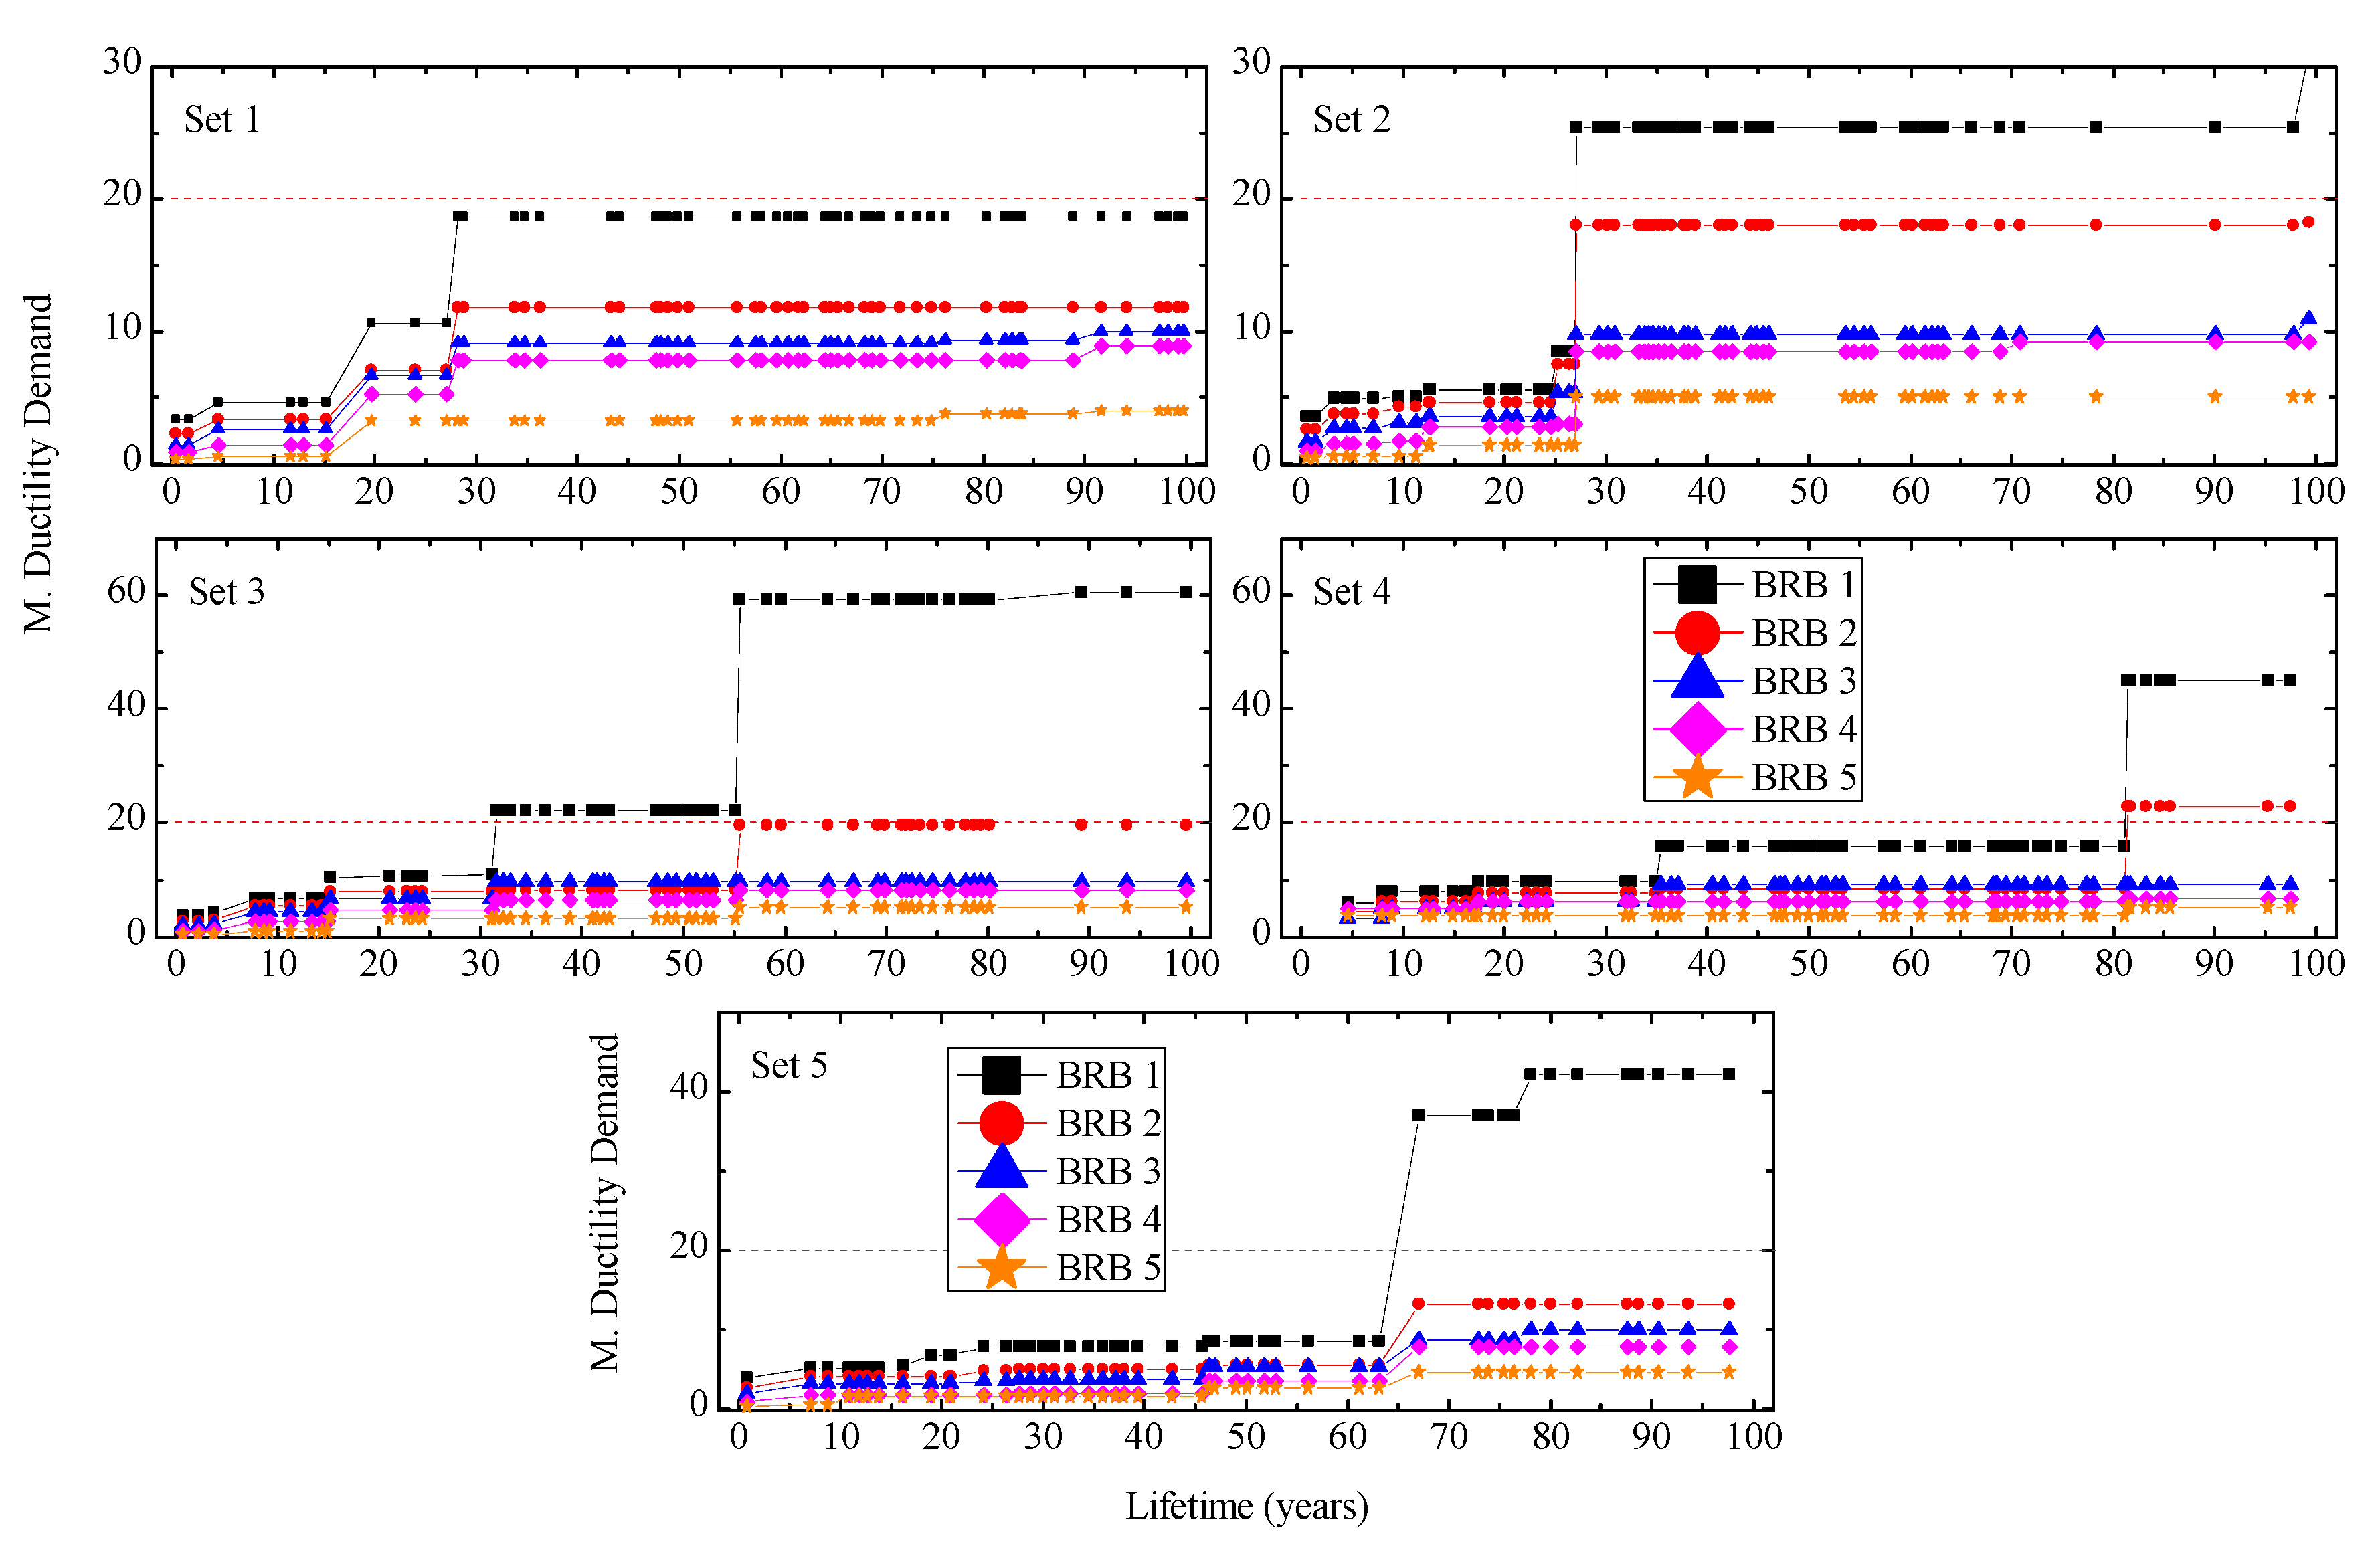
6.6. Maximum Ductility Factor of BRBs

For the selected BRBs, the envelope of maximum ductility factor under successive application of multi-hazard scenarios is presented in Figure 20. According to the literature review, for the common types of BRB in Japan [47,48,49], the maximum ductility demand for BRBs with different configuration and cyclic loading protocols are reported to have a range of 20–24 before exceeding the ultimate capacity. Comparing the maximum ductility factor under Level-2 earthquake (μ = 3–8) and multi-hazard scenarios (μ = 10–25), it is seen that the ductility demand is three times larger in comparison to a Level-2 earthquake, as recommend in Japanese design provision.

7. Conclusions

The current research investigated the fatigue life of BRBs elements and their effect on the overall performance of high-rise steel buildings by predicting the sequence of multi-hazard scenarios in the building lifetime. Toward this objective, first, a 20-story moment resisting frame is designed to resist the gravitational loads; then, the simplified method presented in the JSSI manual is applied to design the required BRB elements to satisfy the 1% story drift ratio (design target) imposed by the lateral excitation. In the next step, the Poisson process-based procedure is used to randomly approximate the probable multi-hazard scenarios during the project’s lifetime. The proposed concept is applied to generate five random scenarios, and the target building performance under multi-hazard scenarios is assessed. The main conclusions of the study are drawn as follows.
  • Although for the design earthquake and wind loads, as recommend by AIJ (2019), the target building satisfies the 1% story drift ratio, but the building performance under multi-hazard scenarios is about 2.0–5.0 times larger. It is because, first, the estimated intensities of multi-hazard events from the proposed procedure are slightly larger in comparison to the design earthquake; second, the contribution of multi-hazard scenarios to the progressive damage of BRBs amplifies the overall building’s performance.
  • Under the multi-hazard scenarios, the progressive damage of BRBs that are in upper stories is considerably smaller than that of the BRBs located in lower stories. This is indicating that the BRBs in lower stories are severely prone to low-cycle fatigue damage in the building service period.
  • The progressive damage of BRBs under multi-hazard scenarios, which is studied in terms of cumulative damage index (CDI), cumulative ductility factor (CDF), plastic strain energy (PSE), and maximum ductility, reveal that the fatigue life of a BRB is a multi-criteria issue. It is found that although the BRBs can satisfy one or two of the thresholds, under the successive application of wind and earthquake excitation, the devices fail to endure all the aforementioned criteria. Corresponding to the designated criteria, the fatigue life is variable as well. Therefore, the current study recommends the multi-criteria be incorporated in the design phase of the high-rise building with BRBs.
  • Considering the multi-criteria investigated in this study, this study observed that the effective service life of BRBs is much smaller than the design service life.
  • Under the successive analysis of multi-hazard scenarios, the ductility demand of BRBs is three times larger than that during Level-2 earthquakes.

Author Contributions

Conceptualization, T.S. and A.N.; methodology, A.N. and T.R.; software, T.S.; writing—original draft preparation, A.N.; writing—review and editing, T.S.; supervision, T.S. All authors have read and agreed to the published version of the manuscript.

Funding

This research received no external funding.

Institutional Review Board Statement

Not applicable.

Informed Consent Statement

Not applicable.

Data Availability Statement

The data presented in this study are available on request from the corresponding author.

Conflicts of Interest

The authors declare no conflict of interest.

References

  1. Fujimoto, M.; Wada, A.; Saeki, E.; Watanabe, A.; Hitomi, Y. A study on the unbounded brace encased in buckling-restraining concrete and steel tube. J. Struct. Eng. 1988, 34, 249–258. (In Japanese) [Google Scholar]
  2. Takeuchi, T. Buckling-Restrained Brace: History, Design and Applications. Key Eng. Mater. 2018, 763, 50–60. [Google Scholar] [CrossRef]
  3. Black, C.J.; Makris, N.; Aiken, I.D. Component Testing, Seismic Evaluation and Characterization of Buckling-Restrained Braces. J. Struct. Eng. 2004, 130, 880–894. [Google Scholar] [CrossRef]
  4. Tremblay, R.; Bolduc, P.; Neville, R.; Devall, R. Seismic testing and performance of buckling-restrained bracing systems. Can. J. Civ. Eng. 2006, 33, 183–198. [Google Scholar] [CrossRef]
  5. Ju, Y.K.; Kim, M.-H.; Kim, J.; Kim, S.-D. Component tests of buckling-restrained braces with unconstrained length. Eng. Struct. 2009, 31, 507–516. [Google Scholar] [CrossRef]
  6. Fahnestock, L.A.; Ricles, J.M.; Sause, R. Experimental Evaluation of a Large-Scale Buckling-Restrained Braced Frame. J. Struct. Eng. 2007, 133, 1205–1214. [Google Scholar] [CrossRef]
  7. Tsai, C.S.; Chen, W.S.; Lin, Y.C.; Yang, C.T.; Tsou, C.P. Seismic Responses of a Full-Scale Steel Structure Using Multi-Curved Buckling Restrained Braces. In Proceedings of the ASME 2007 Pressure Vessels and Piping Conference. Volume 8: Seismic Engineering, San Antonio, TX, USA, 22–26 July 2007; pp. 55–61. [Google Scholar] [CrossRef]
  8. Kaneki, Y.; Hikone, S.; Yamashita, T.; Iwata, M. Seismic Strengthening by buckling restrained braces arranged diagonally. J. Struct. Constr. Eng. 2008, 73, 2215–2222. [Google Scholar] [CrossRef]
  9. Shima, Y.; Ding, Y.; Zhao, J. Proposal for the structural design method of a sustainable building structure system. J. Struct. Constr. Eng. 2009, 74, 1179–1185. (In Japanese) [Google Scholar] [CrossRef] [Green Version]
  10. Alemayehu, R.W.; Kim, Y.; Bae, J.; Ju, Y.K. Cyclic Load Test and Finite Element Analysis of NOVEL Buckling-Restrained Brace. Materials 2020, 13, 5103. [Google Scholar] [CrossRef] [PubMed]
  11. Guerrero, H.; Ji, T.; Teran-Gilmore, A.; Escobar, J.A. A method for preliminary seismic design and assessment of low-rise structures protected with buckling-restrained braces. Eng. Struct. 2016, 123, 141–154. [Google Scholar] [CrossRef]
  12. Watanabe, A. Design and application of buckling-restrained braces. Intern. J. High-Rise Build. 2018, 7, 215–221. [Google Scholar]
  13. Çelebi, M.; Kashima, T.; Ghahari, F.; Koyama, S.; Taciroğlu, E.; Okawa, I. Before and after retrofit behavior and performance of a 55-storey tall building inferred from distant earthquake and ambient vibration data. Earthq. Spectra. 2017, 34, 1599–1626. [Google Scholar] [CrossRef]
  14. Di Sarno, L.; Manfredi, G. Seismic retrofitting with buckling restrained braces: Application to an existing non-ductile RC framed building. Soil Dyn. Earthq. Eng. 2010, 30, 1279–1297. [Google Scholar] [CrossRef]
  15. Almeida, A.; Ferreira, R.; Proença, J.M.; Gago, A.S. Seismic retrofit of RC building structures with Buckling Restrained Braces. Eng. Struct. 2017, 130, 14–22. [Google Scholar] [CrossRef]
  16. Saingam, P.; Sutcu, F.; Terazawa, Y.; Fujishita, K.; Lin, P.; Celik, O.C.; Takeuchi, T. Composite behavior in RC buildings ret-rofitted using buckling-restrained braces with elastic steel frames. Eng. Struct. 2020, 219, 110896. [Google Scholar] [CrossRef]
  17. Castaldo, P.; Tubaldi, E.; Selvi, F.; Gioiella, L. Seismic performance of an existing RC structure retrofitted with buckling restrained braces. J. Build. Eng. 2021, 33, 101688. [Google Scholar] [CrossRef]
  18. Takeuchi, T.; Wada, A. Review of buckling-restrained brace design and application to tall buildings. Key Eng. Mater. 2018, 763, 50–56. [Google Scholar] [CrossRef]
  19. RSMC Tokyo-Typhoon Center: Best Track Data (1951–2020), Japan Meteorological Agency (JMA). Available online: https://www.jma.go.jp/jma/jma-eng/jma-center/rsmc-hp-pub-eg/besttrack.html (accessed on 3 February 2021).
  20. Duthinh, D.; Simiu, E. Safety of Structures in Strong Winds and Earthquakes: Multihazard Considerations. J. Struct. Eng. 2010, 136, 330–333. [Google Scholar] [CrossRef]
  21. Usami, T.; Wang, C.; Funayama, J. Low-Cycle Fatigue Tests of a Type of Buckling Restrained Braces. Procedia Eng. 2011, 14, 956–964. [Google Scholar] [CrossRef] [Green Version]
  22. Wang, C.-L.; Usami, T.; Funayama, J. Improving Low-Cycle Fatigue Performance of High-Performance Buckling-Restrained Braces by Toe-Finished Method. J. Earthq. Eng. 2012, 16, 1248–1268. [Google Scholar] [CrossRef]
  23. Liu, Y.S.; Chen, K.P.; Li, G.Q.; Sun, F.F. Low-Cycle Fatigue Performance of Buckling Restrained Braces and Assessment of Cumulative Damage under Severe Earthquakes. Key Eng. Mater. 2018, 763, 867–874. [Google Scholar] [CrossRef]
  24. Xu, Z.-D.; Dai, J.; Jiang, Q.-W. Study on fatigue life and mechanical properties of BRBs with viscoelastic filler. Steel Compos. Struct. 2018, 26, 139–150. [Google Scholar]
  25. Tong, C.; Wu, J.; Hua, K.; Xie, L. Low-Cycle Fatigue Life Estimation Curve for Buckling-Restrained Braces Based on Cumulative Plastic Deformation. J. Earthq. Eng. 2020, 1–29. [Google Scholar] [CrossRef]
  26. Repetto, M.P.; Solari, G. Wind-induced fatigue collapse of real slender structures. Eng. Struct. 2010, 32, 3888–3898. [Google Scholar] [CrossRef]
  27. Jia, J. Wind and structural modelling for an accurate fatigue life assessment of tubular structures. Eng. Struct. 2011, 33, 477–491. [Google Scholar] [CrossRef]
  28. Fang, Z.; Li, A.; Li, W.; Shen, S. Wind-Induced Fatigue Analysis of High-Rise Steel Structures Using Equivalent Structural Stress Method. Appl. Sci. 2017, 7, 71. [Google Scholar] [CrossRef] [Green Version]
  29. Hoveidae, N. Ultra-low cycle fatigue fracture life of a type of buckling restrained brace. J. Rehabil. Civ. Eng. 2018, 6, 29–42. [Google Scholar]
  30. AIJ. Recommendations for Loads on Buildings; Architectural Institute of Japan: Tokyo, Japan, 2019. [Google Scholar]
  31. BSL. The Building Standard Law of Japan; The Building Center of Japan: Tokyo, Japan, 2004. [Google Scholar]
  32. JSSI. Report of Investigation Committee on Response Control Buildings; The Japan Society of Seismic Isolation: Tokyo, Japan, 2012. [Google Scholar]
  33. Kasai, K.; Fu, Y.; Watanabe, A. Passive Control Systems for Seismic Damage Mitigation. J. Struct. Eng. 1998, 124, 501–512. [Google Scholar] [CrossRef]
  34. Saito, T. Structural Earthquake Response Analysis 3D, Version 10.5 (STERA_3D v10.5). 2020. Available online: http://www.rc.ace.tut.ac.jp/saito/software-e.html (accessed on 27 February 2021).
  35. Roy, T.; Saito, T.; Matsagar, V. Multihazard framework for investigating high-rise base-isolated buildings under earthquakes and long-duration winds. Earthq. Eng. Struct. Dyn. 2020, 50, 1334–1357. [Google Scholar] [CrossRef]
  36. Saito, T. Structural Earthquake Response Analysis WAVE Version 1.0 (STERA_WAVE v1.0). 2019. Available online: http://www.rc.ace.tut.ac.jp/saito/software-e.html. (accessed on 27 February 2021).
  37. Jennings, P.C.; Housner, G.W.; Tsai, N.C. Simulated earthquake motions for design purpose. In Proceedings of the 4th World Conference on Earthquake Engineering, Santiago, Chile, 13–18 January 1969; pp. 145–160. [Google Scholar]
  38. Wang, J.; Cheynet, E.; Snæbjörnsson, J.; Jakobsen, J.B. Coupled aerodynamic and hydrodynamic response of a long span bridge suspended from floating towers. J. Wind. Eng. Ind. Aerodyn. 2018, 177, 19–31. [Google Scholar] [CrossRef]
  39. Deodatis, G.; Shinozuka, M. Weighted Integral Method. II: Response Variability and Reliability. J. Eng. Mech. 1991, 117, 1865–1877. [Google Scholar] [CrossRef]
  40. Deodatis, G. Simulation of Ergodic Multivariate Stochastic Processes. J. Eng. Mech. 1996, 122, 778–787. [Google Scholar] [CrossRef]
  41. Marsh, G.; Wignall, C.; Thies, P.R.; Barltrop, N.; Incecik, A.; Venugopal, V.; Johanning, L. Review and application of Rain-flow residue processing techniques for accurate fatigue damage estimation. Int. J. Fatigue 2016, 82, 757–765. [Google Scholar] [CrossRef] [Green Version]
  42. Hasegawa, H.; Takeuchi, T.; Iwata, M.; Yamada, S.; Akiyama, H. Dynamic performances of unbonded braces. AIJ Tech. Rep. 1999, 9, 103–106. (In Japanese) [Google Scholar] [CrossRef] [Green Version]
  43. Nakamura, H.; Takeuchi, T.; Maeda, Y.; Nakata, Y.; Sasaki, T.; Iwata, M.; Wada, A. Fatigue properties of practical-scale unbonded braces. Nippon. Steel Tech. Rep. 2000, 82, 51–57. [Google Scholar]
  44. Yamaguchi, M.; Yamada, S.; Takeuchi, T.; Wada, A. Seismic performance of buckling resistant brace within a steel frame in the case of ultimate earthquake. J. Constr. Steel. 2004, 12, 207–210. (In Japanese) [Google Scholar]
  45. Takeuchi, T.; Uchiyama, T.; Suzuki, K.; Ookouchi, Y.; Ogawa, T.; Kato, S. Seismic retrofit of truss tower structures using buckling restrained braces. J. Struct. Constr. Eng. 2005, 589, 129–136. (In Japanese) [Google Scholar] [CrossRef] [Green Version]
  46. Takeuchi, T.; Ida, M.; Yamada, S.; Suzuki, K. Estimation of Cumulative Deformation Capacity of Buckling Restrained Braces. J. Struct. Eng. 2008, 134, 822–831. [Google Scholar] [CrossRef]
  47. Chung, Y.W.; Lee, W.J. Cyclic plastic strain energy as a damage criterion and environmental effect in Nb-bearing high strength, low alloy steel. Mater. Sci. Eng. A 1994, 186, 121–128. [Google Scholar] [CrossRef]
  48. Iwata, M.; Murai, M. Buckling-restrained brace using steel mortar planks; performance evaluation as a hysteretic damper. Earthq. Eng. Struct. Dyn. 2006, 35, 1807–1826. [Google Scholar] [CrossRef]
  49. Takeuchi, T.; Ohyama, T.; Ishihara, T. Cumulative cyclic deformation capacity of high-strength steel frames with energy dis-sipation braces—Seismic performance of high-strength steel frames with energy braces part 1. J. Struct. Constr. Eng. 2010, 75, 1671–1679. [Google Scholar] [CrossRef] [Green Version]
  50. Takeuchi, T.; Hajjar, J.F.; Matsui, R.; Nishimoto, K.; Aiken, I.D. Effect of local buckling core plate restraint in buckling restrained braces. Eng. Struct. 2012, 44, 304–311. [Google Scholar] [CrossRef]
  51. FEMA-450. NEHRP Recommended Provisions for Seismic Regulations for New Buildings and Other Structures; Federal Emergency Management Agency: Washington, DC, USA, 2003. [Google Scholar]
  52. Sabelli, R. Research on Improving the Design and Analysis of Earthquake-Resistant Steel Braced Frames; EERI: Oakland, CA, USA, 2001. [Google Scholar]
  53. Usami, T.; Kasai, A.; Kato, M. Behavior of buckling restrained brace members. In Proceedings of the 4th International Con-ference on STESSA 2003—Behavior of Steel Structures in Seismic Areas, Naples, Italy, 9–12 June 2003; pp. 211–216. [Google Scholar]
  54. ANSI/AISC 360-10. Seismic Provisions of Structural Steel Buildings; American Institute of Steel Construction: Chicago, IL, USA, 2010. [Google Scholar]
Figure 1. Twenty-story steel prototype building elevation and BRB configuration (dimensions in mm).
Applsci 11 09253 g001
Figure 2. Hysteresis model of nonlinear bending spring of steel column and beam.
Applsci 11 09253 g002
Figure 3. Configuration scheme and bilinear hysteresis model of nonlinear shear springs for BRBs.
Applsci 11 09253 g003
Figure 4. Base shear coefficient and drift ratio at the equivalent height of the target model.
Applsci 11 09253 g004
Figure 5. Normalized mode shape of the target high-rise building with and without BRBs devices.
Applsci 11 09253 g005
Figure 6. Response acceleration spectrum of selected ground motions (5% damping).
Applsci 11 09253 g006
Figure 7. Maximum story drift ratio of high-rise steel building with and without BRBs under design earthquake and wind loads.
Applsci 11 09253 g007
Figure 8. Ductility demand and energy dissipation rate of BRBs along the height of a high-rise steel building under earthquake and wind loads.
Applsci 11 09253 g008
Figure 9. Flowchart of probable earthquake and wind events generation in the project lifetime.
Applsci 11 09253 g009
Figure 10. Uniform hazard spectrum provided in AIJ (2019) for Nagoya city, Aichi, Japan.
Applsci 11 09253 g010
Figure 11. Flowchart of the STERA_Wave algorithm to generate spectrum-compatible earthquakes.
Applsci 11 09253 g011
Figure 12. The sequence of the phase spectrum earthquakes used to generate compatible earthquakes in multi-hazard scenarios (the numbers are assigned according to Table 5).
Applsci 11 09253 g012
Figure 13. Flowchart for generating wind loads time history.
Applsci 11 09253 g013
Figure 14. Probable multi-hazard scenarios in the target building lifetime.
Applsci 11 09253 g014
Figure 15. (a) Plastic strain energy (PSE); (b) cumulative ductility factor (CDF).
Applsci 11 09253 g015
Figure 16. Maximum story drift ratio and shear force under multi-hazard scenarios.
Applsci 11 09253 g016
Figure 17. Cumulative damage index (CDI) of selected BRBs under multi-hazard scenarios.
Applsci 11 09253 g017
Figure 18. Plastic strain energy (PSE) of selected BRBs under multi-hazard scenarios.
Applsci 11 09253 g018
Figure 19. Cumulative ductility factor (CDF) of selected BRBs under multi-hazard scenarios.
Applsci 11 09253 g019
Figure 20. Maximum ductility demand of selected BRBs under multi-hazard scenarios.
Applsci 11 09253 g020
Table 1. Structural details of beam and column elements (mm).
Steel BeamSteel Box Column
StoryH × BtWtFStoryH × Bt
19–20450 × 250916---
17–18450 × 25091617–20350 × 35019
14–16500 × 250122213–16400 × 40019
11–13500 × 30012169–12450 × 45019
8–10500 × 30012256–8450 × 45022
5–7550 × 30012164–5500 × 50022
2–4550 × 30012252–3500 × 50025
1600 × 30012191550 × 55035
In the table, tw and tF are the web and flange thickness of the I-beam, where t is the thickness of the box column.
Table 2. Technical parameters of design BRBs.
StoryYielding CapacityInitial Stiffness K1/Kai1 1
Fiy (kN)Kai (kN/mm)
20---
17–192501000.02
14–163451400.02
11–134351750.02
8–104301720.02
5–74601850.02
2–43851550.02
1---
1 Ratio of post-yield to pre-yield stiffness.
Table 3. List of selected earthquake ground motions.
CategoriesNo.EventYearStation
Scaled earthquake to be compatible of 50 cm/s1Imperial Valley1940El Centro
2Kern County1952Taft
3Kobe1995JMA
Artificially generated earthquake to be compatible with Level 24Tohoku1978Tohoku Univ.
5Tokachi Oki1968Hachinohe
Table 4. Parameters of the probabilistic distribution of earthquake and wind intensity for Aichi Prefecture Japan.
EventIntensity
I 1,2
UnitReturn Period
(Years)
Recurrence RateParameters
ab
Earthquake600gal1000.01−1.78980.0047
943gal5000.002
Wind16m/s114.97170.3107
36m/s5000.002
1 in case of an earthquake: “I” denotes zero-period (PGA) acceleration from the response spectrum. 2 in case of wind: “I” denotes the mean wind speed.
Table 5. List of the earthquake used for a phase spectrum to scale the probable earthquake events.
No.Phase SpectrumComponentDateStationRecorded PGA (gal)
1Random Phase--->250.000
2KumamotoNS3 January 2019Wadamachi Eda261.697
3TottoriNS6 October 2000Yonago City280.233
4TottoriEW21 October 2016Kurayoshi City285.811
5Toho-OkiNS4 October 1994Honamachi454.975
6Noto HantoNS25 March 2007Wajima City463.544
7MiyagiEW26 May 2003Izumimachi655.161
8IburiNS6 September 2018Atsuma Kananuma662.241
9OsakaNS18 June 2018Hirakata City690.169
10Tokachi-OkiNS26 September 2003Makuhetsu-cho754.200
11Niigata-ChuetsuNS23 October 2004Ojiya City Castle779.244
12Kushiro OkiNS15 January 1993Kushiro814.906
13KobeNS17 January 1995JMA818.066
14TohokuEW11 March 2011Ofunato944.072
Table 6. Corresponding parameters of long-duration wind loads.
No.DescriptionParameterUnit
1Turbulence Length Scale75.27m
2Standard Deviation of Fluctuating Component6.73m/s
3Cutoff Frequency5.00Hz
4Mean of Duration7500.00s
5Coefficient of Variation 10.00%
Table 7. Cycle counting, strain amplitude, and CDI of selected BRBs under multi-hazard timelines.
Selected DamperMH ScenariosCDIStrain Amplitude (%)CycleEnergy
Ave.MaxNo.kN-m
BRB#1Set 10.6430.0481.210129,09425,400
Set 20.5730.0461.440141,64722,310
Set 30.5010.0421.018138,56621,310
Set 40.4340.0401.362138,98816,240
Set 50.3630.0431.092126,92713,120
BRB#2Set 10.1050.0310.800128,9683838
Set 20.0740.0290.783140,6023074
Set 30.0870.0281.067136,8153564
Set 40.0600.0261.214138,1872038
Set 50.0430.0270.844126,1731356
BRB#3Set 10.0320.0250.762129,226930
Set 20.0260.0240.758139,249751
Set 30.0270.0230.754135,340932
Set 40.0240.0210.701137,201654
Set 50.0190.0220.780126,453461
BRB#4Set 10.0150.0190.654129,787385
Set 20.0140.0180.708140,681307
Set 30.0150.0180.664134,786365
Set 40.0110.0160.582137,618321
Set 50.0110.0160.698126,165234
BRB#5Set 10.0050.0091.210142,08599
Set 20.0040.0080.339152,14294
Set 30.0050.0080.406148,79388
Set 40.0040.0080.367151,67183
Set 50.0040.0070.422135,93069
Publisher’s Note: MDPI stays neutral with regard to jurisdictional claims in published maps and institutional affiliations.

