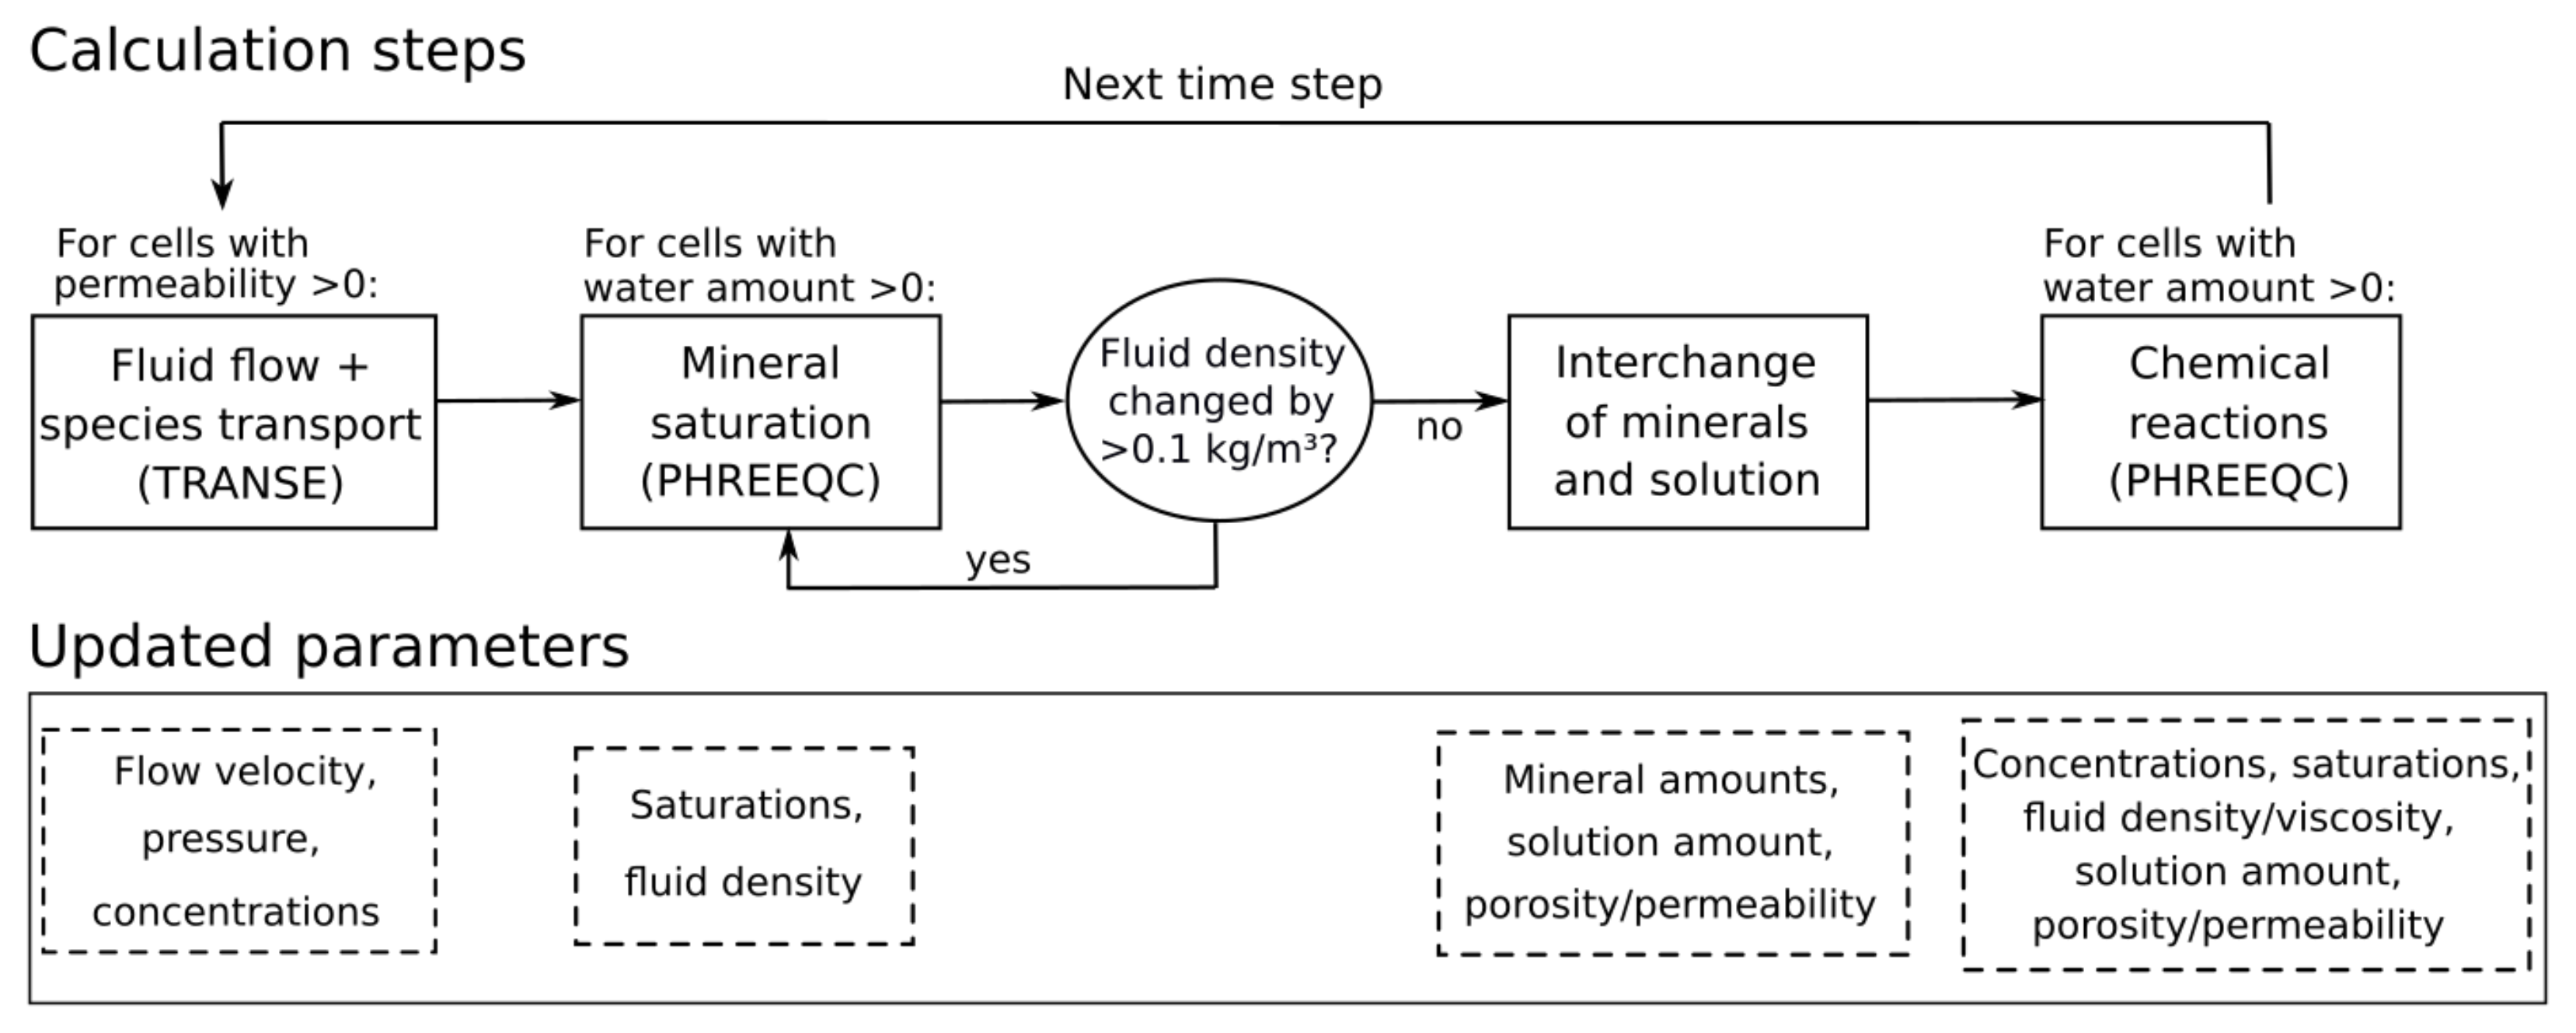
The concept of the applied reactive transport model is shown in
Figure 1. Each simulation time step starts with the solution of the partial differential equations for the fluid flow and transport of chemical species using the TRANsport Simulation Environment (TRANSE) [
13]. TRANSE is coupled with the geochemical reaction module PHREEQC [
14], applied in combination with the THEREDA database [
15]. In the second calculation step, PHREEQC is used to update fluid densities and mineral saturations following transport. After that, the “interchange” step is performed, which describes the dissolution of minerals from (nearly) dry into permeated cells and allows the dissolution front to progress [
6]. The terms “dry” and “permeated” are used in view of the fluid saturation in the pore space, whereas the term “saturated” refers to the chemical equilibration of the solution with respect to salt minerals. In the final calculation step, the chemical reactions resulting from transport and interchange are determined using PHREEQC. Thereby, thermodynamic equilibrium is assumed within each cell. The updated concentrations and fluid properties, such as density and viscosity, are then transferred back to TRANSE to calculate flow and transport in the next simulation time step (
Figure 1). More details on this procedure are presented in Steding et al. [
6]. The interchange of minerals and solution has been extended in the present study and will be described in detail in the following subsection.
2.1. Extended Interchange Approach
In Steding et al. [
6], constant dissolution rates were used to calculate the interchange of salt minerals. However, it is known that close to equilibrium, the dissolution rates decrease considerably [
16,
17,
18]. Based on the results of Alkattan et al. [
19], a linear saturation dependency is assumed:
where
kmax (cm/s) is the dissolution rate in an infinitely dilute solution. Q is the activity product and K the equilibrium constant. The saturation index SI (-) results from log(Q/K). Leaching zones can contain several primary and secondary minerals that differ in maximum dissolution rate
kmax as well as in saturation state [
20]; therefore, an average dissolution rate for the potash seam (
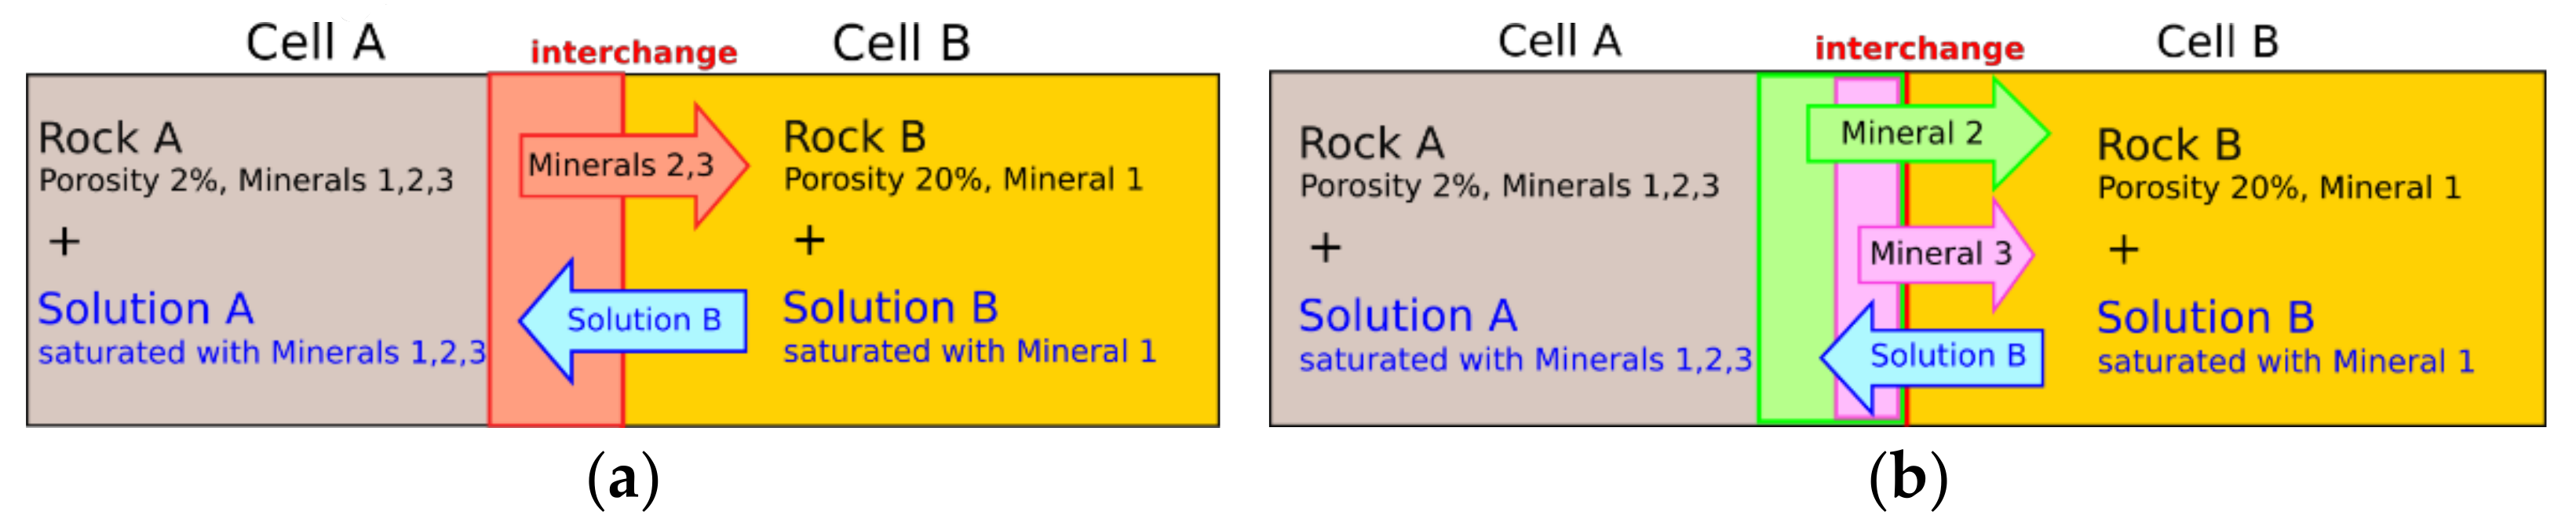
Figure 2a) is not applicable here. Instead, the dissolution rate according to Equation (1) and the amount of minerals dissolved into an adjacent cell
Minsol (mol) need to be calculated individually for each mineral (
Figure 2b). Thereby,
rate (cm/s) always refers to the saturation state of the solution into which the mineral is dissolved. Between Cell A and Cell B, the amount of interchanged mineral
n can be calculated with Equation (2):
The amount of mineral
n present in Cell A,
MinA,n (mol), divided by the cell diameter perpendicular to the dissolution front
di (cm), gives the affected amount of mineral
n if the width of 1 cm is dissolved from Cell A. To take into account the contact area between the rock in Cell A and the solution in Cell B, this amount is multiplied with the porosity difference between both cells
(ΦB−ΦA) and divided by the volume fraction of the rock in Cell A
(1−ΦA). If
ΦA ≥ ΦB, the interchange is zero, i.e., minerals can only be dissolved into adjacent cells with higher porosity.
dt (s) is the length of the simulation time step. If the solution in Cell B is already saturated with respect to
n,
raten becomes zero and the mineral is not dissolved. The interchange takes place at each interface between two cells within the model. The volumes of all minerals dissolved at one interface are cumulated to determine the amount of solution that is transferred in return to keep the volume of both cells constant (
Figure 2).
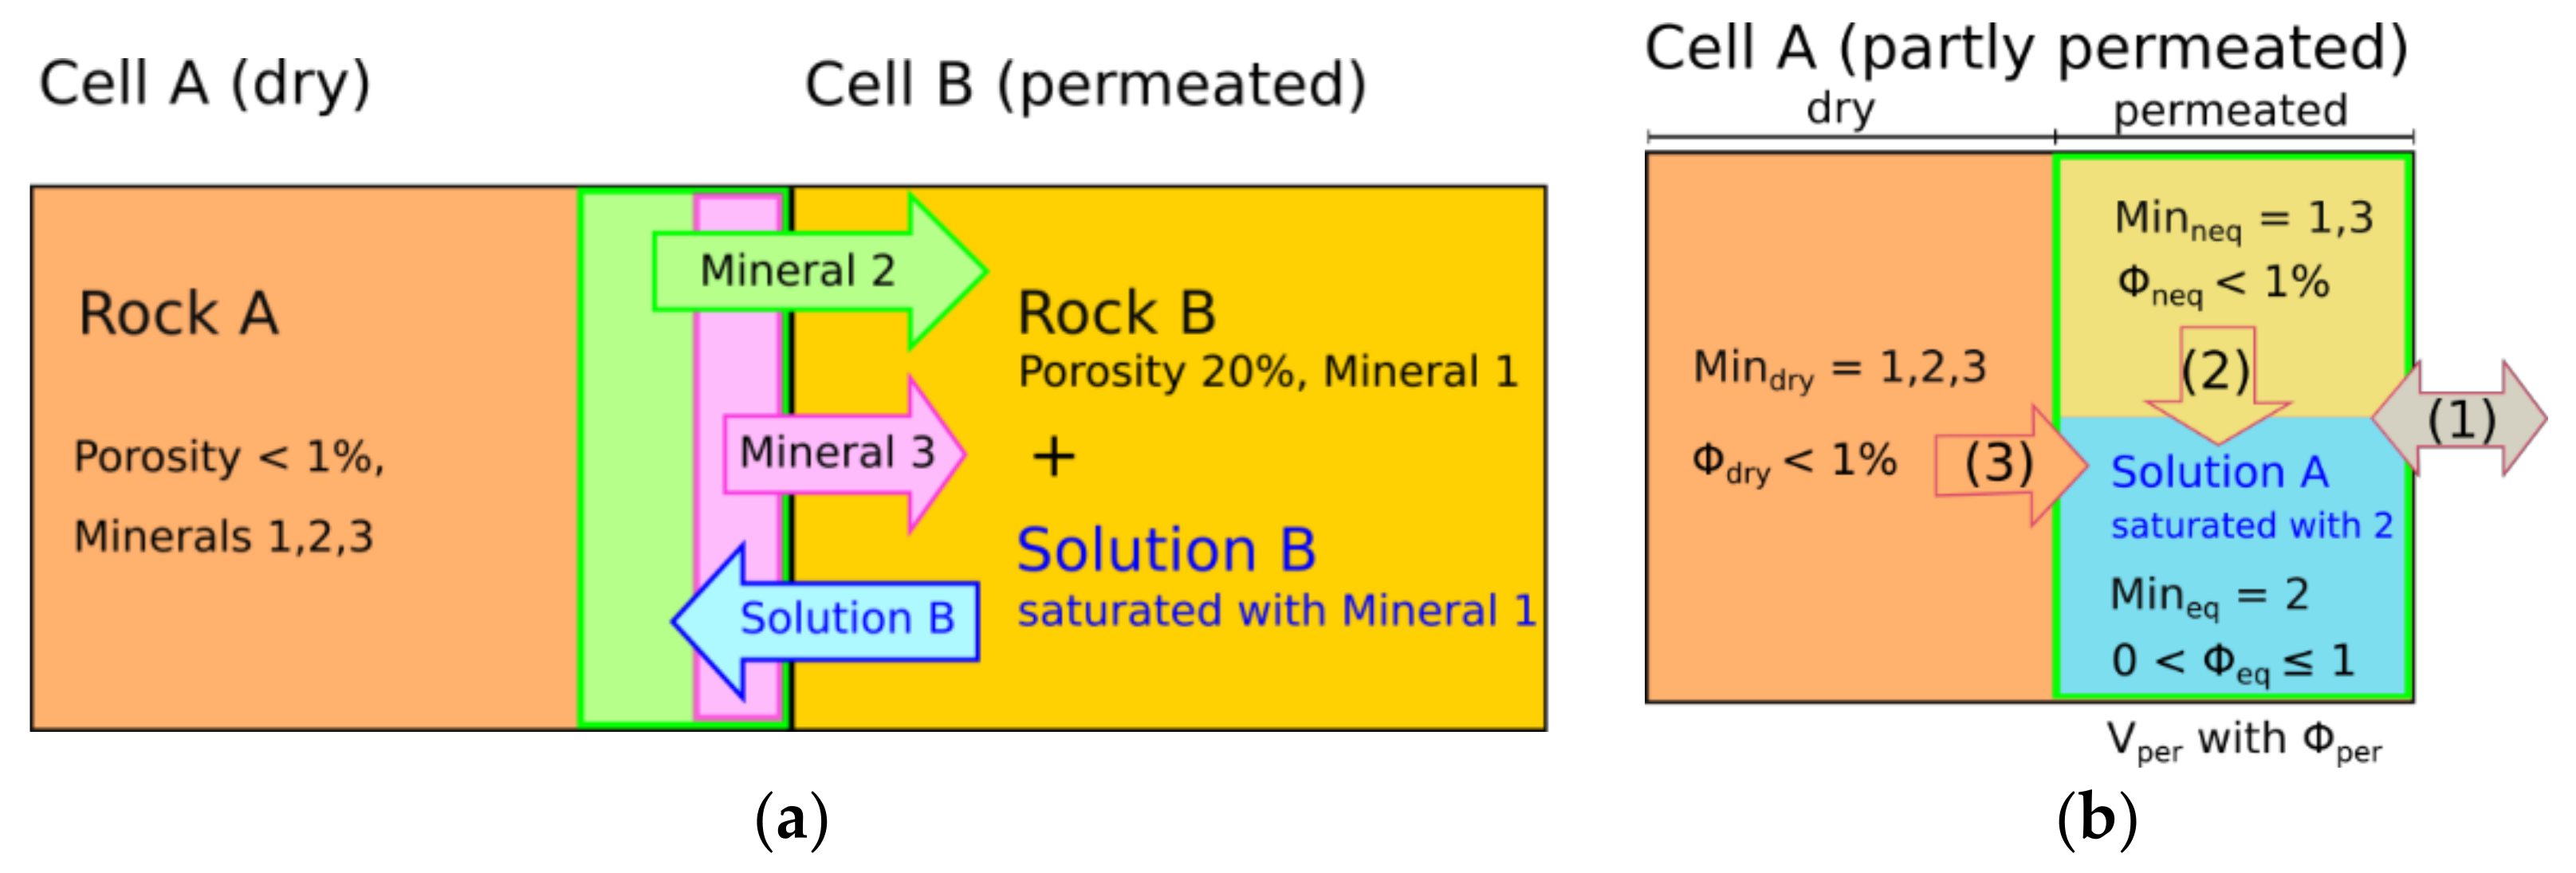
At the dissolution front, the interchange approach enables originally dry cells to receive solution for the first time from an adjacent cell (
Figure 3a). The solution needs to be undersaturated with at least one of the minerals from the dry rock; otherwise, no interchange takes place. Newly permeated cells are divided into a permeated and a dry sub-cell to avoid immediate drying out due to high solid-fluid-ratios (
Figure 3b). In cases of constant dissolution rates, all minerals in the permeated part were assumed to be in equilibrium with the solution of the cell, whereas minerals in the dry part were not considered in the subsequent calculation of chemical reactions [
6]. However, as shown in
Figure 3a, the varying dissolution rates challenge the identification of a clear borderline between dry and permeated or equilibrated and non-equilibrated parts, respectively. It can be seen that Mineral 2 has the highest dissolution rate, and therefore limits the region of increased porosity where mineral solution occurs (green). Within this region, it is reasonable to equilibrate the solution with regard to Mineral 2. However, Mineral 3 has a lower dissolution rate, and can therefore only be equilibrated with the solution in the pink subregion. Following this reasoning, one would end up with an additional subregion for each mineral, which is of course not practical. Instead, the permeated part within each cell is split up into minerals that are in equilibrium with the solution (equilibrated minerals
Mineq) and such that are not (non-equilibrated minerals
Minneq;
Figure 3b). Thereby, the volume of the permeated part
Vper is determined by the most soluble mineral (Mineral 2, green area). Outside of this area, the salt rock is still dry and the composition
Mindry corresponds to the originally unaffected potash seam. In contrast, minerals within the permeated area
Vper are surrounded by solution, whereby it is not yet in equilibrium with all minerals. Minerals that remain undissolved during the interchange due to their lower dissolution rates (Mineral 1 and parts of Mineral 3 within the green area,
Figure 3a) are assigned to the non-equilibrated minerals
Minneq. In contrast, precipitations from Solution B belong to the minerals equilibrated with the solution
Mineq.
In the case of partly permeated cells, three different types of dissolution can occur (
Figure 3b): the first one is interchange with the (fully permeated) adjacent cells according to Equation (2). For this, all three mineral compositions
Mindry,
Mineq and
Minneq, are added together to determine
MinA.
ΦA is the average porosity of the cell calculated from the volume of
MinA related to the cell volume. If the partly permeated cell shows a higher average porosity than the fully permeated one, the interchange of minerals is possible in the reverse direction as well. The dissolved amount of each mineral is split among
Mindry,
Mineq and
Minneq, according to their contribution to the total amount of this mineral. The solution transferred in return is mixed with the pre-existing solution in the permeated part. The chemical reactions resulting from the mixing and the following equilibration with
Mineq are determined after the interchange (
Figure 1).
In addition to the interchange, internal dissolution processes within cells containing dry (
Mindry) or non-equilibrated (
Minneq) minerals need to be taken into account (
Figure 3b). The interface area between a dry part and the adjacent permeated part(s) is assumed to be constant over time. At the beginning, when the cell is completely dry, the adjacent permeated area is the neighbor cell and dry minerals can only be dissolved via interchange. Accordingly, the interface area is the interface between both cells, which is the cell width multiplied by its height. As
Vper increases,
Mindry makes up a smaller part of the total mineral amount within the partly permeated cell and its interchange amount decreases. At the same time, the interface area between the dry and permeated parts within the partly permeated cell increases, enhancing the internal dissolution of dry minerals. To account for that, the permeation state of the cell
Sper (-) is calculated referring to the volume of the permeated part
Vper in relation to the cell volume
Vcell:
The higher the
Sper, the more the dry rock is dissolved into the solution of its own cell (by internal dissolution) instead of the adjacent cell (by interchange). Equation (4) is used to determine the amount of mineral
n dissolved from
Mindry into the solution within the permeated part:
Generally, Equation (4) is identical to Equation (2), but multiplied by the permeation state
Sper.
rate is calculated from the saturation state within the partly permeated cell using Equation (1). In order to determine the affected amount of mineral
n if a width of 1 cm of the dry part is dissolved, the present amount,
Mindry,n (mol), is divided by the diameter of the dry part perpendicular to the dissolution front. Therefore, the cell diameter
di (cm) is now multiplied by the volume ratio of the dry part
(1–Sper). The porosity within the dry part is nearly zero, simplifying the term
(ΦB–ΦA)/
(1–ΦA) in Equation (2) to
ΦB, which equals the average porosity of the permeated part
Φper. The dissolved amount of each mineral
Minsol,dry is added to
Mineq. The same applies to precipitations resulting from the equilibration after the interchange (
Figure 1). Similar to the interchange of dry minerals, the highest dissolution rate according to Equation (1) determines the volume that is newly added to the permeated part
Vper (
Figure 3). For minerals with lower dissolution rates, the difference between the amount within this volume and the dissolved amount is added to
Minneq.
Finally, the internal dissolution of non-equilibrated minerals (
Minneq) has to be taken into account (
Figure 3b). These minerals belong to the permeated part of a cell and are already surrounded by solution. However, when the area is permeated for the first time, their dissolution rate is too low to dissolve all minerals. Basically, there are two possible reasons for this: either the maximum dissolution rate
kmax is (much) lower than that of the other minerals, or the solution is already (nearly) saturated with these. In the latter case, one could add them to
Mineq without changing the solution or rock composition of the permeated part. However, the solution composition changes over time, and originally saturated minerals may become undersaturated. In this case, an immediate equilibration could induce errors because the lower dissolution rates would be neglected. To account for the variation of dissolution rates,
Minneq is added stepwise to the solution. The dissolved amount
Minsol,neq (mol) of each mineral is determined by Equation (5):
The rate law is similar to those used for interchange (Equation (2)) and the internal dissolution of dry minerals (Equation (4)). Again,
rate (cm/s) is calculated from the saturation state within the partly permeated cell according to Equation (1).
Minneq (mol) divided by the volume of the non-equilibrated minerals
Vneq (cm
3) and multiplied by the contact area between non-equilibrated minerals and solution (cm
2) gives the amount of mineral
n if a width of 1 cm of the non-equilibrated minerals is dissolved.
Vneq is calculated from the mineral amounts and densities in
Minneq, neglecting small porosities. However, the contact area between non-equilibrated minerals and solution is hard to determine, because the pore structure and spatial arrangement of the different minerals in the original rock are unknown. Therefore, a variable called
factor (-) is introduced. If it is set to 1, a rectangular contact area similar to that between
Mindry and the solution (Equation (4)) is assumed. This can be seen as a minimum value. If precipitations do not block the access to
Minneq, the contact area to the solution flowing between the non-equilibrated minerals should be several times higher. Therefore, it can make sense to simplify the approach and to directly add
Minneq to
Mineq. In this case, it is assumed that the contact area is large enough to immediately equilibrate minerals and solution within an originally dry volume as soon as the first mineral has been dissolved from it. However, this is only realistic if the maximum mineral dissolution rates do not vary by several orders of magnitude. Furthermore, the first mineral dissolved should make up more than a few vol.% of the dry rock in order to create a sufficiently large contact area. If this is not the case, the internal dissolution of non-equilibrated minerals has to be considered. For some minerals, this may take much longer than the permeation of the cell, i.e., fully permeated cells can still contain non-equilibrated minerals (
Figure 4). For the interchange according to Equation (2),
Mineq and
Minneq are added up to determine
MinA and
ΦA is defined as the average porosity of equilibrated and non-equilibrated areas.
Generally, it is assumed that minerals belonging to
Mineq are first dissolved if an undersaturation occurs. As a result, the interchange or internal dissolution of minerals present in
Mineq is not possible. Chemical reactions resulting from the processes described above are determined in the final calculation step of the simulation (
Figure 1). Thereby, thermodynamic equilibrium is assumed in every cell. The average porosity of the cell is always used in the flow and transport simulation step.
2.2. Scenario Analysis
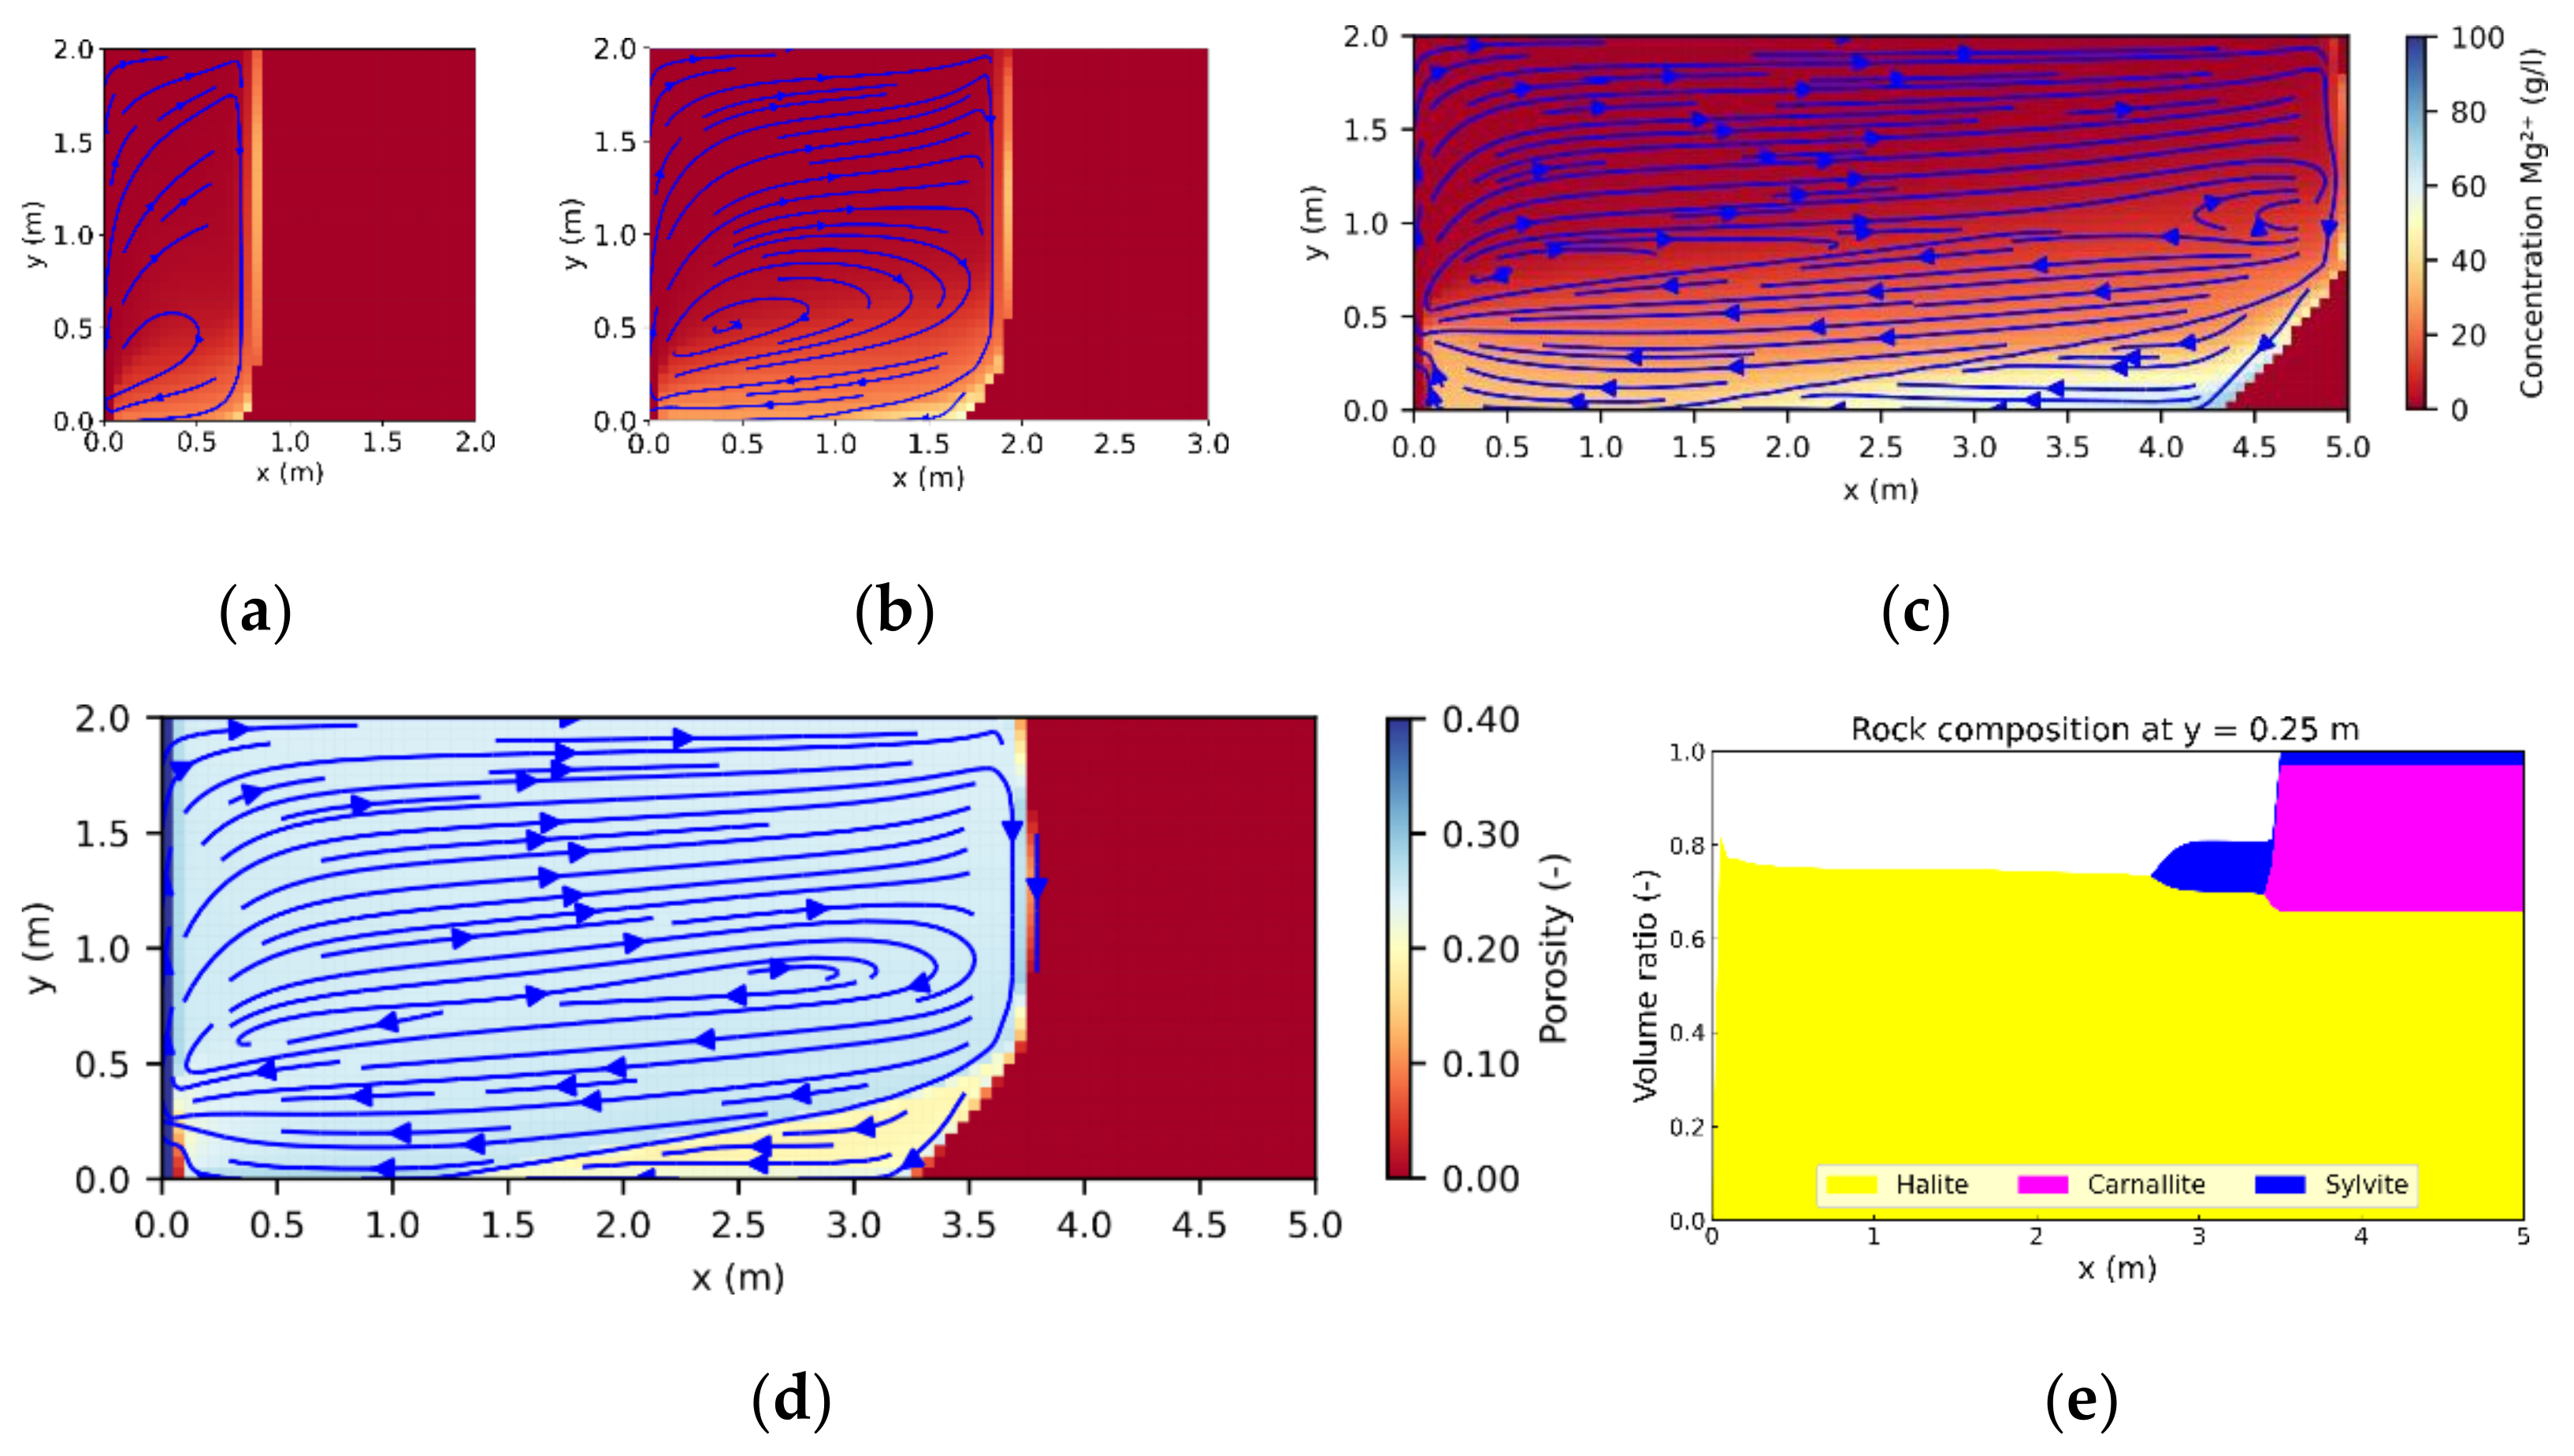
In order to study the influence of heterogeneities, leaching processes in a carnallite-bearing potash seam containing insoluble layers or inclusions were simulated. Carnallitite is a very common, globally occurring potash salt whose leaching behavior was studied for homogeneous rock compositions by Steding et al. [
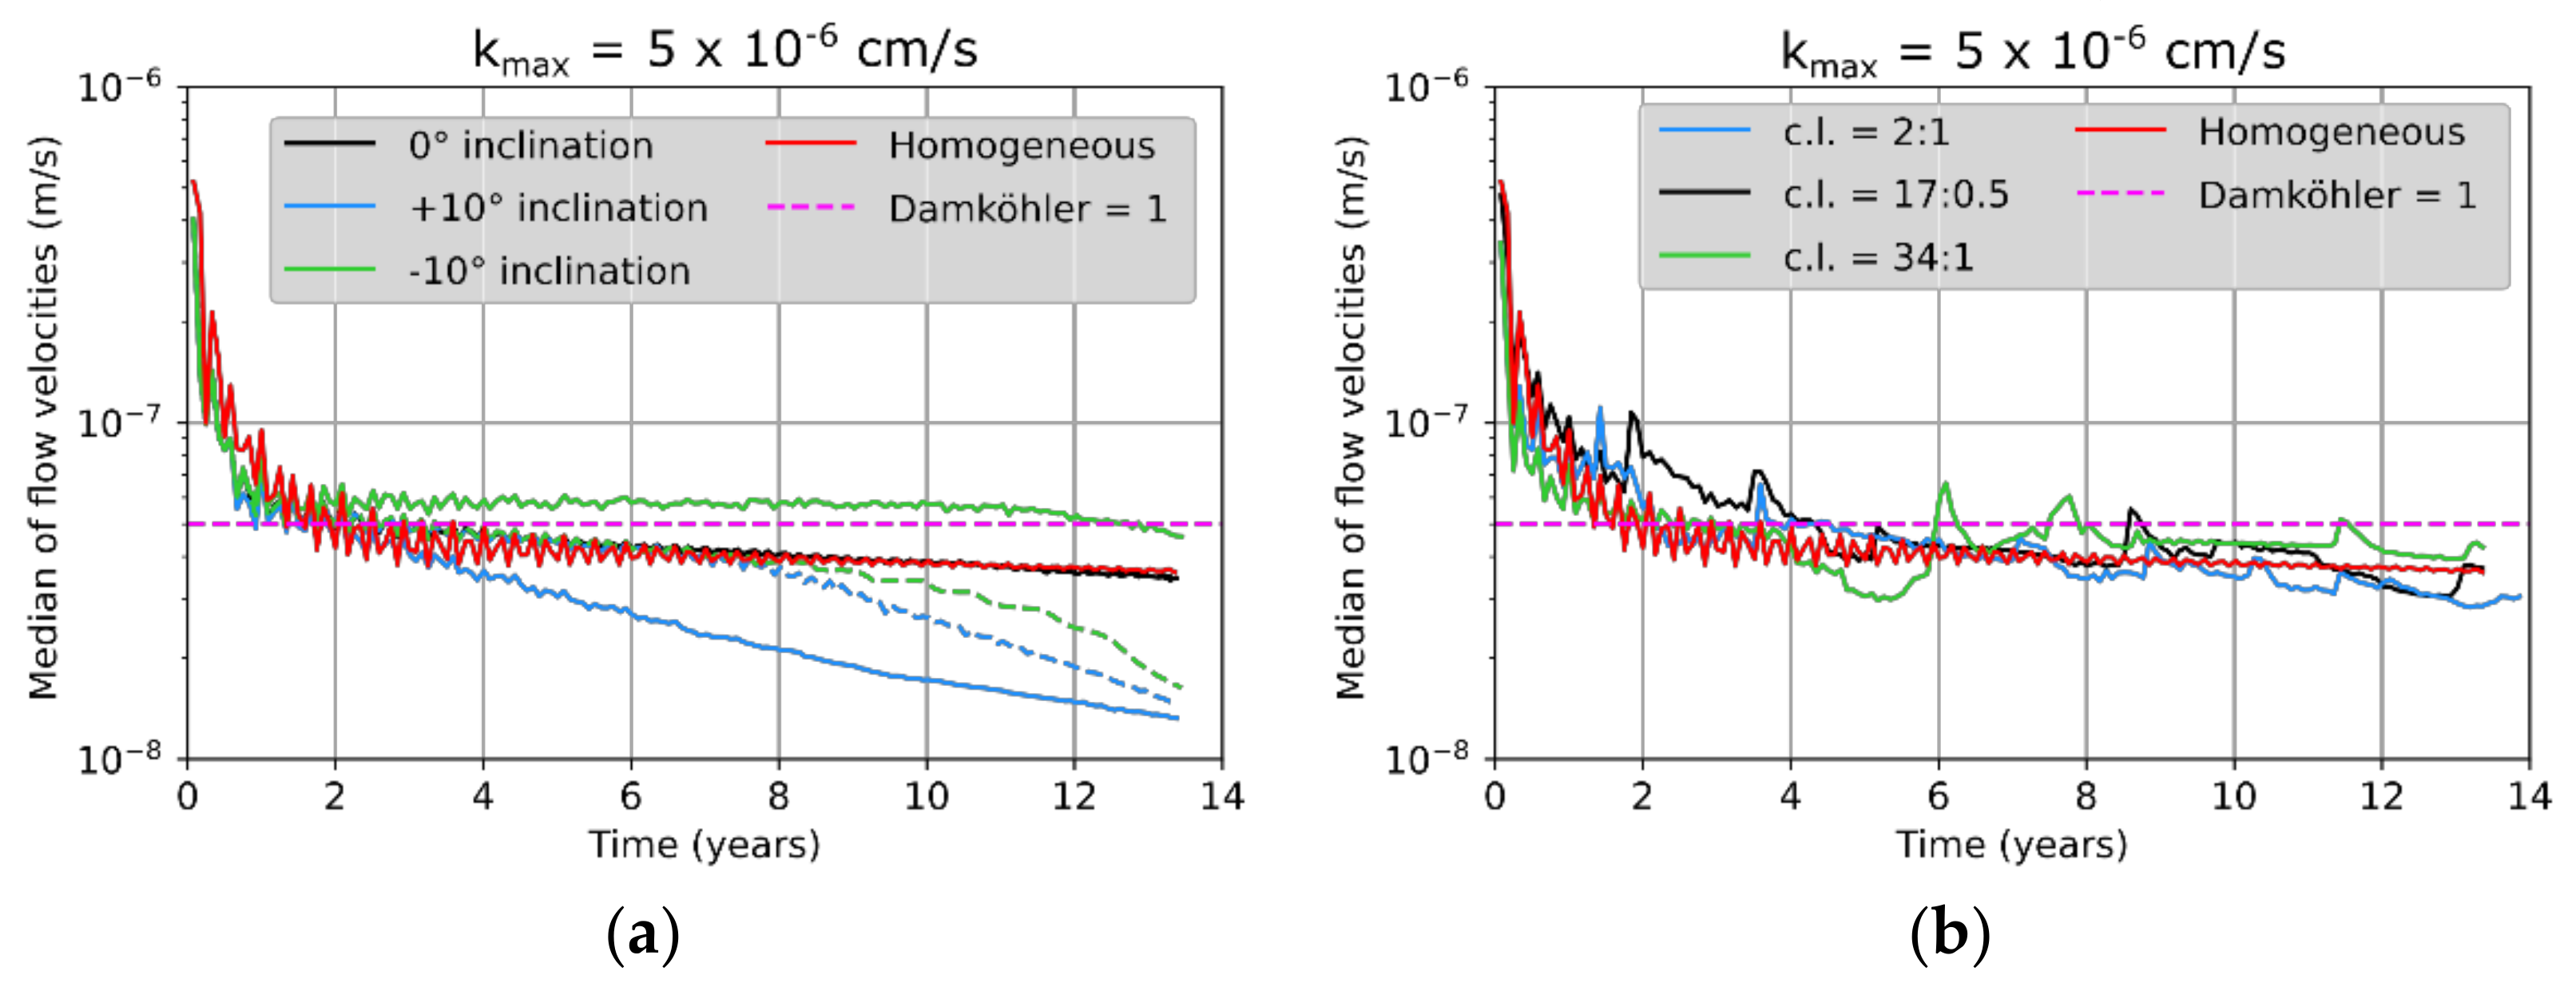
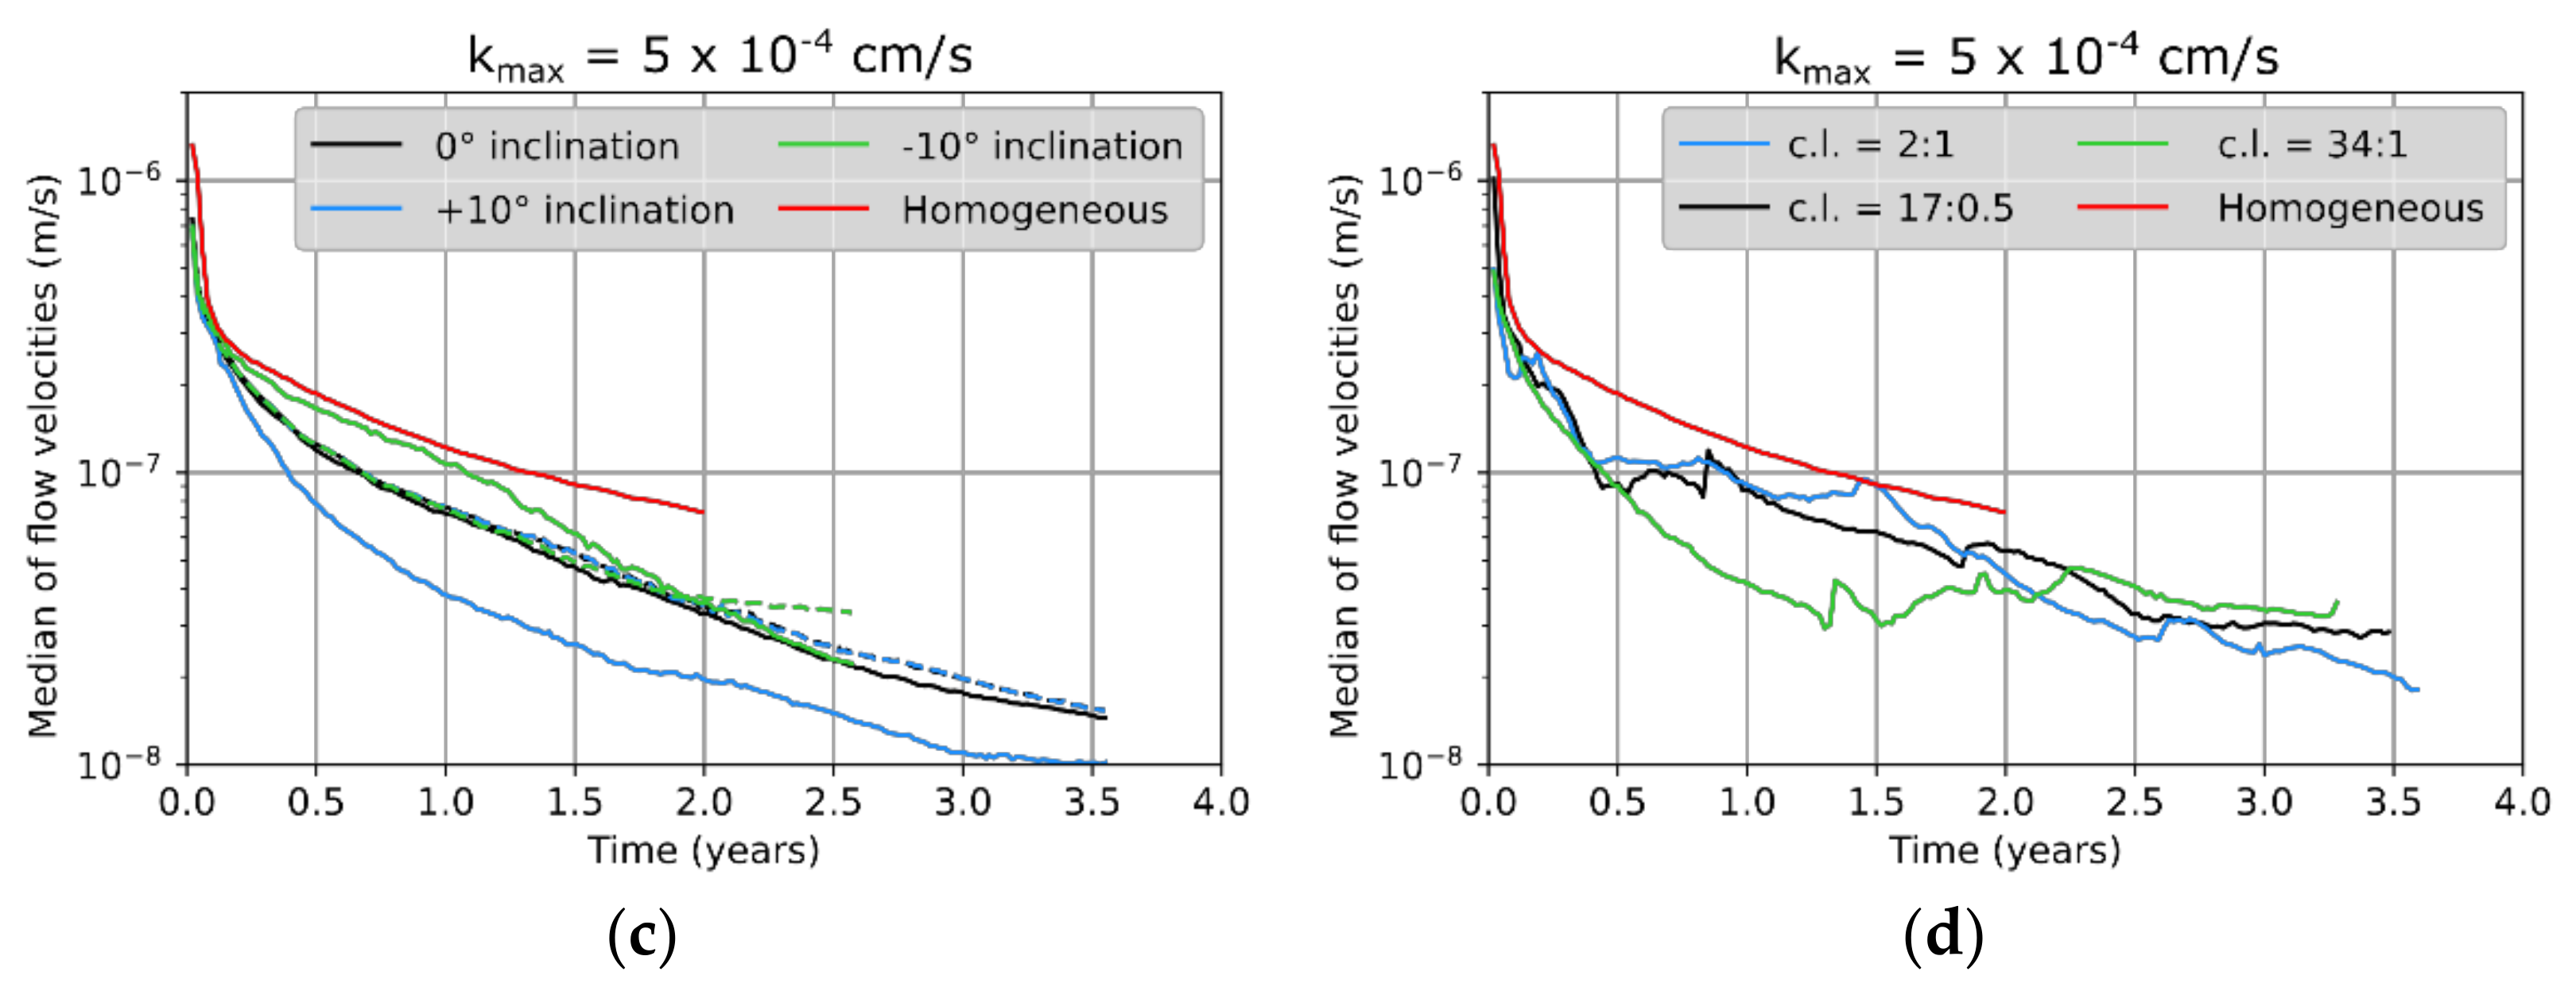
6]. It was found that transport- and advection-dominated systems (Da > 1 and Pe > 2) are most common and also most critical in the short term with regard to hazard potentials, whereas reaction- and advection-dominated systems (Da < 1 and Pe > 2) become more critical in the long term. Both cases were investigated in this study to identify possible differences in the effect of heterogeneities.
According to Steding et al. [
6], 25 wt.% carnallite is a sufficiently high ratio to produce Pe > 2 and low enough to ensure that Darcy flow is still maintained. Therefore, a carnallite-bearing potash seam composition of 25 wt.% carnallite (KMgCl
3∙6H
2O), 72 wt.% halite (NaCl) and 3 wt.% sylvite (KCl) was applied in all scenarios, corresponding to the volume fractions shown in
Figure 5. Mineral densities and dissolution properties are provided in
Table 1. The dissolution rate
kmax strongly depends on the hydrodynamic boundary conditions: it increases with flow velocity [
21] and reaches values under turbulent flow conditions that are at least one order of magnitude higher than that for laminar flow [
16,
19]. This is due to most salt minerals showing transport-controlled dissolution behavior, i.e.,
kmax is controlled by the thickness of the diffusive boundary layer at the mineral surface [
19,
22,
23]. The boundary layer thickness, and consequently
kmax, depend on the flow velocity, diffusion coefficients and surface roughness [
24,
25,
26,
27]. Based on the values of Röhr [
17], an average
kmax of 5 × 10
−4 cm/s was applied to all three minerals in
Table 1. However, this is an upper value because it refers to convection in open cavities. It can be expected that convection within a porous leaching zone results in smaller flow velocities, and therefore in smaller dissolution rates. Accordingly, a second
kmax of 5 × 10
−6 cm/s was taken into account to ensure that both transport- (Da > 1) and reaction-dominated (Da < 1) systems are investigated [
6].
The 2D model height was 2 m, representing the typical thickness of potash seams in Germany, whereas the model width was 5 m with a discretization of 101 × 41 cells (
Figure 5). At the start of the simulation, the entire model consisted of dry potash salt with a porosity of 0.1%. Natural caverns and leaching zones are commonly formed in the vicinity of tectonic fault systems which enable fluid migration [
28]. Due to the fact that the ascending solution has to cross several rock salt layers before it reaches the potash seam, it is usually NaCl-saturated. To represent such a fault zone, a Dirichlet boundary was used (
Figure 5). It maintains a constant solution composition and porosity at the left model boundary, assuming a high fluid and mineral exchange rate within the fault zone. The other boundaries were considered as impermeable without any pre-defined pressure gradient applied. The 2D model made use of the horizontally symmetric expansion of leaching zones to be expected if a potash seam has the same composition in both horizontal directions. Seen from the fault zone, the starting point of the leaching process, only one direction was simulated by taking advantage of the symmetry to reduce the required computational time.
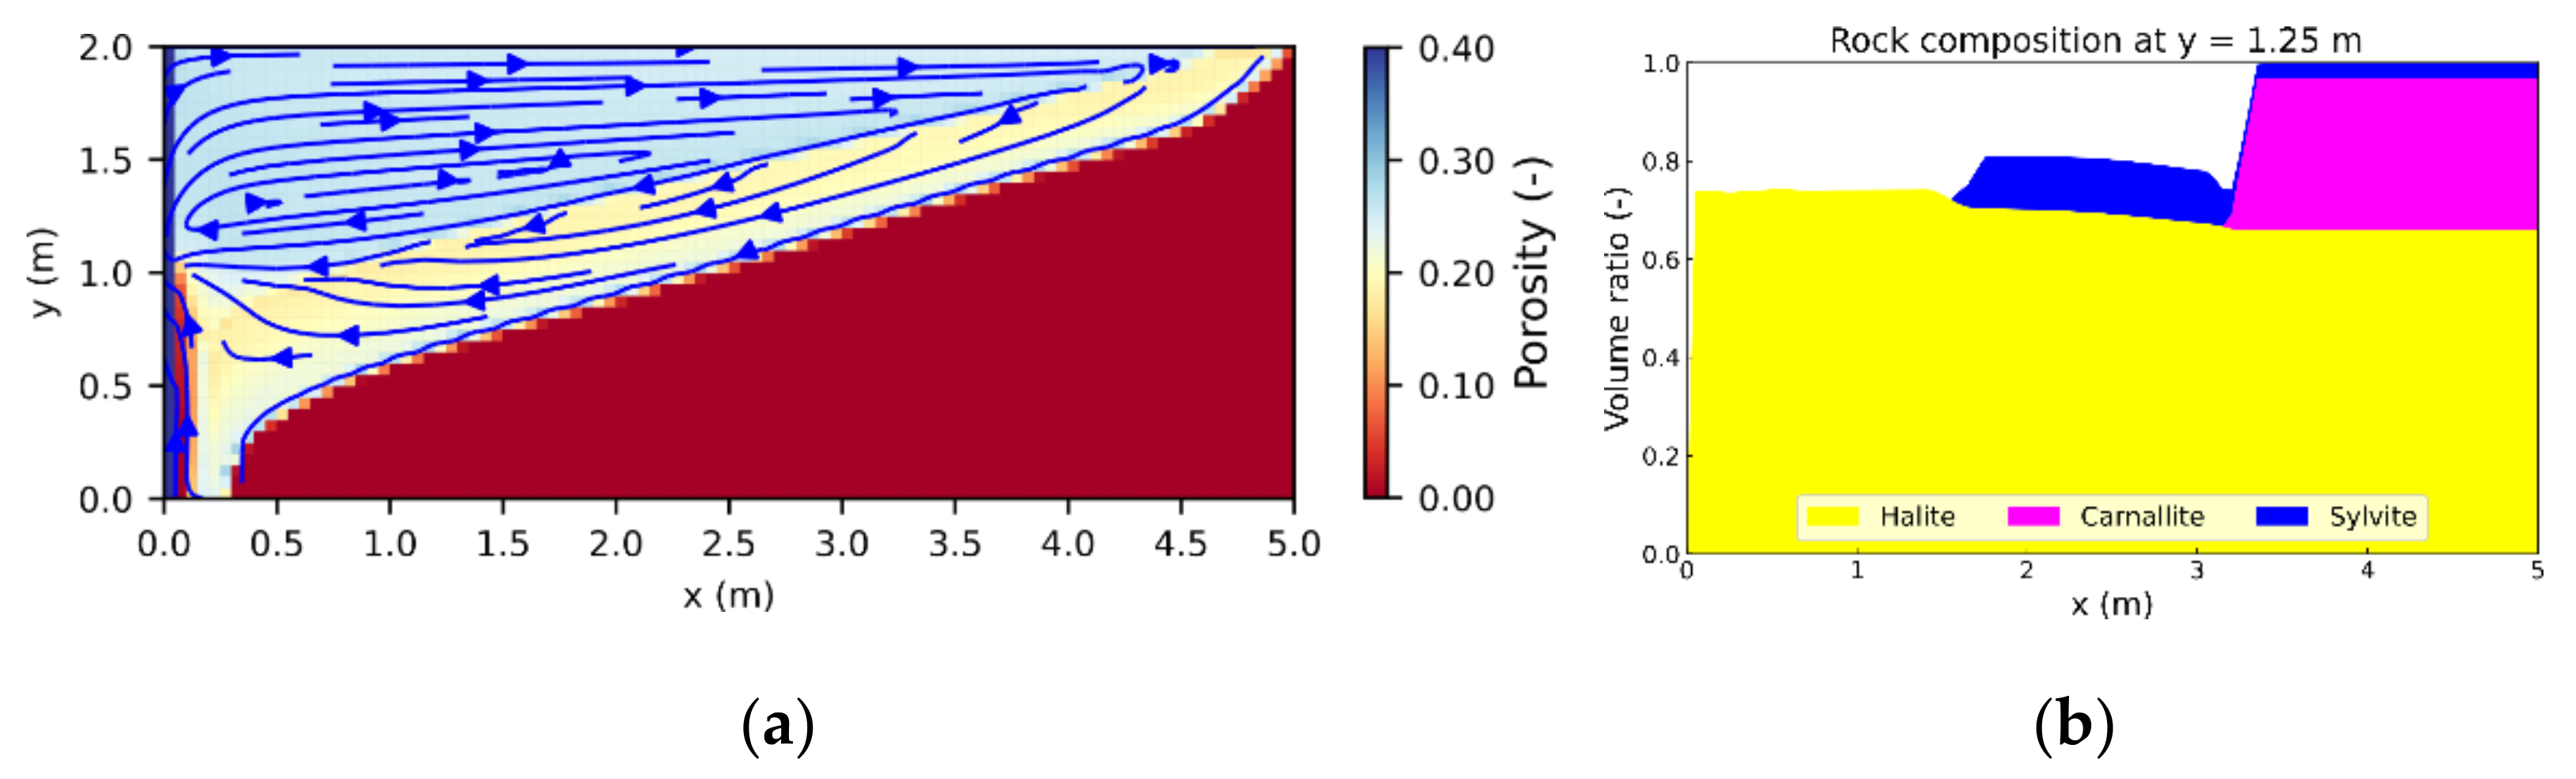
If carnallite-bearing potash seams come into contact with NaCl-saturated brine, carnallite is always dissolved first, triggering the precipitation of sylvite and halite [
29]. Equation (6) gives the overall reaction:
In contrast, halite is not dissolved from the potash seam [
6,
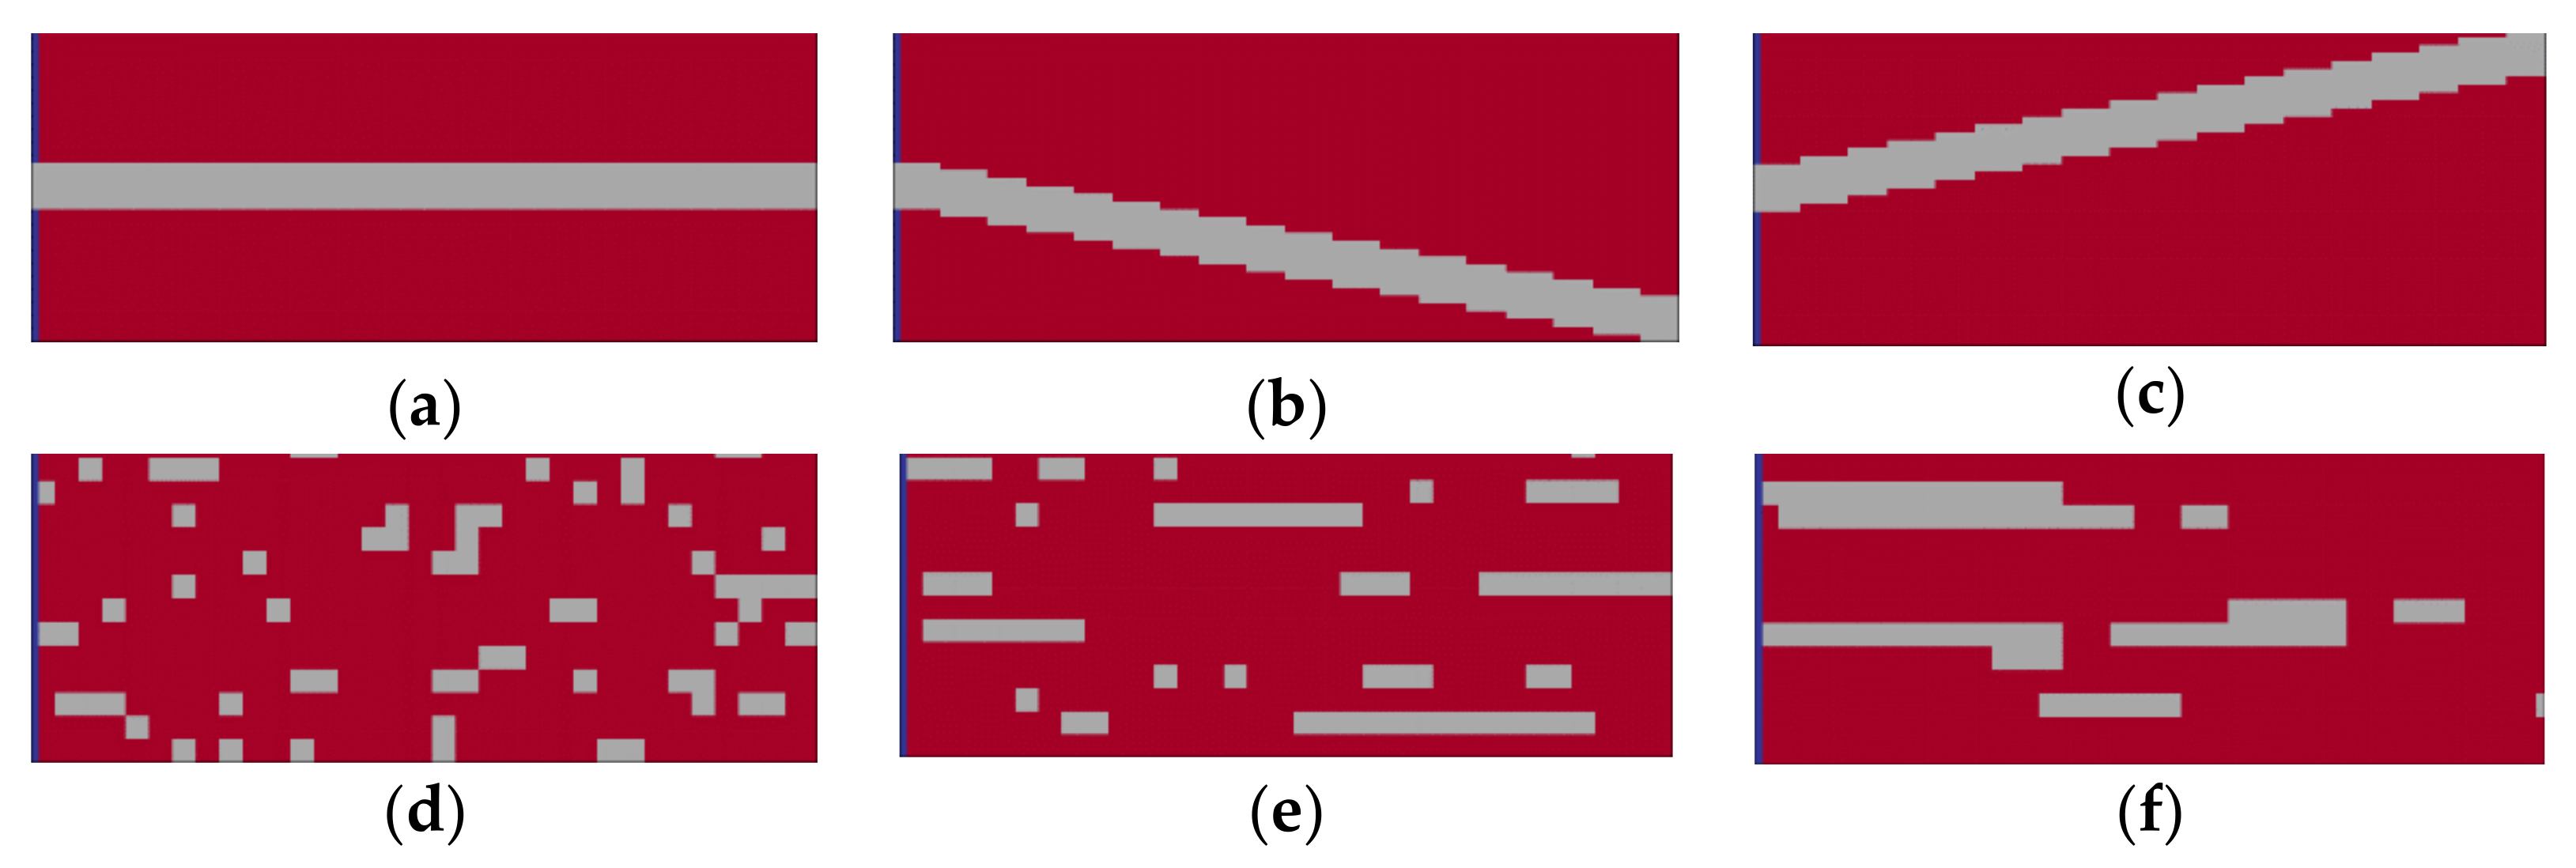
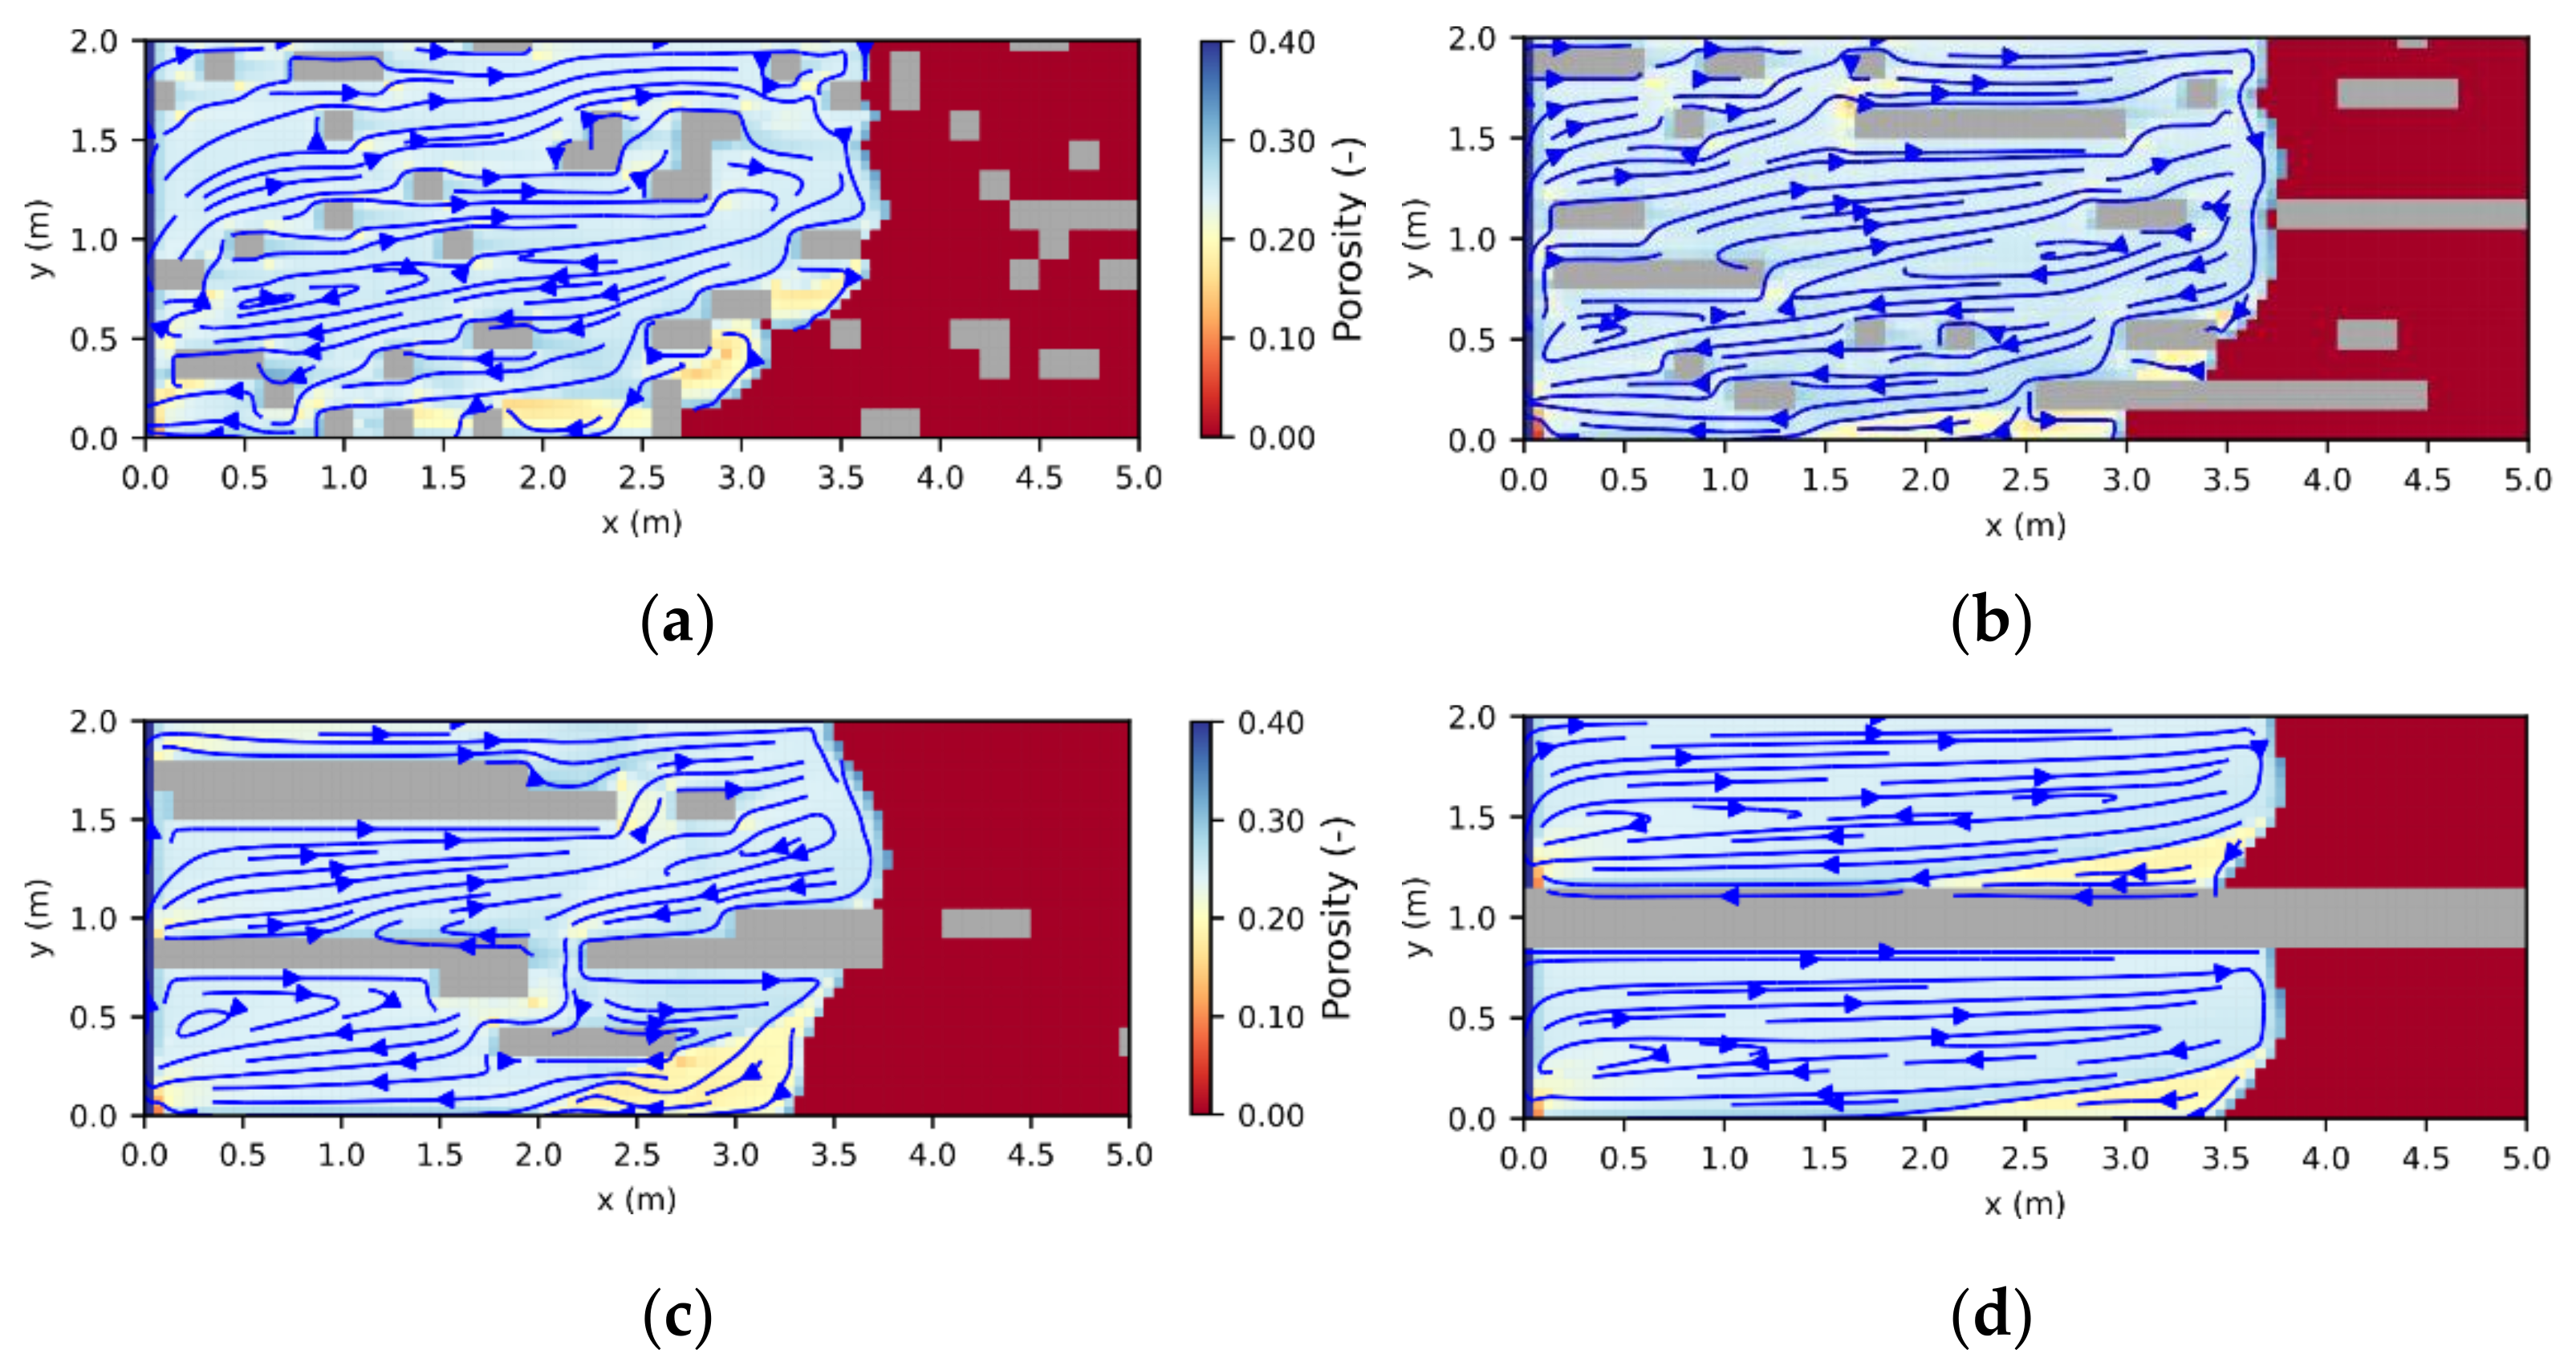
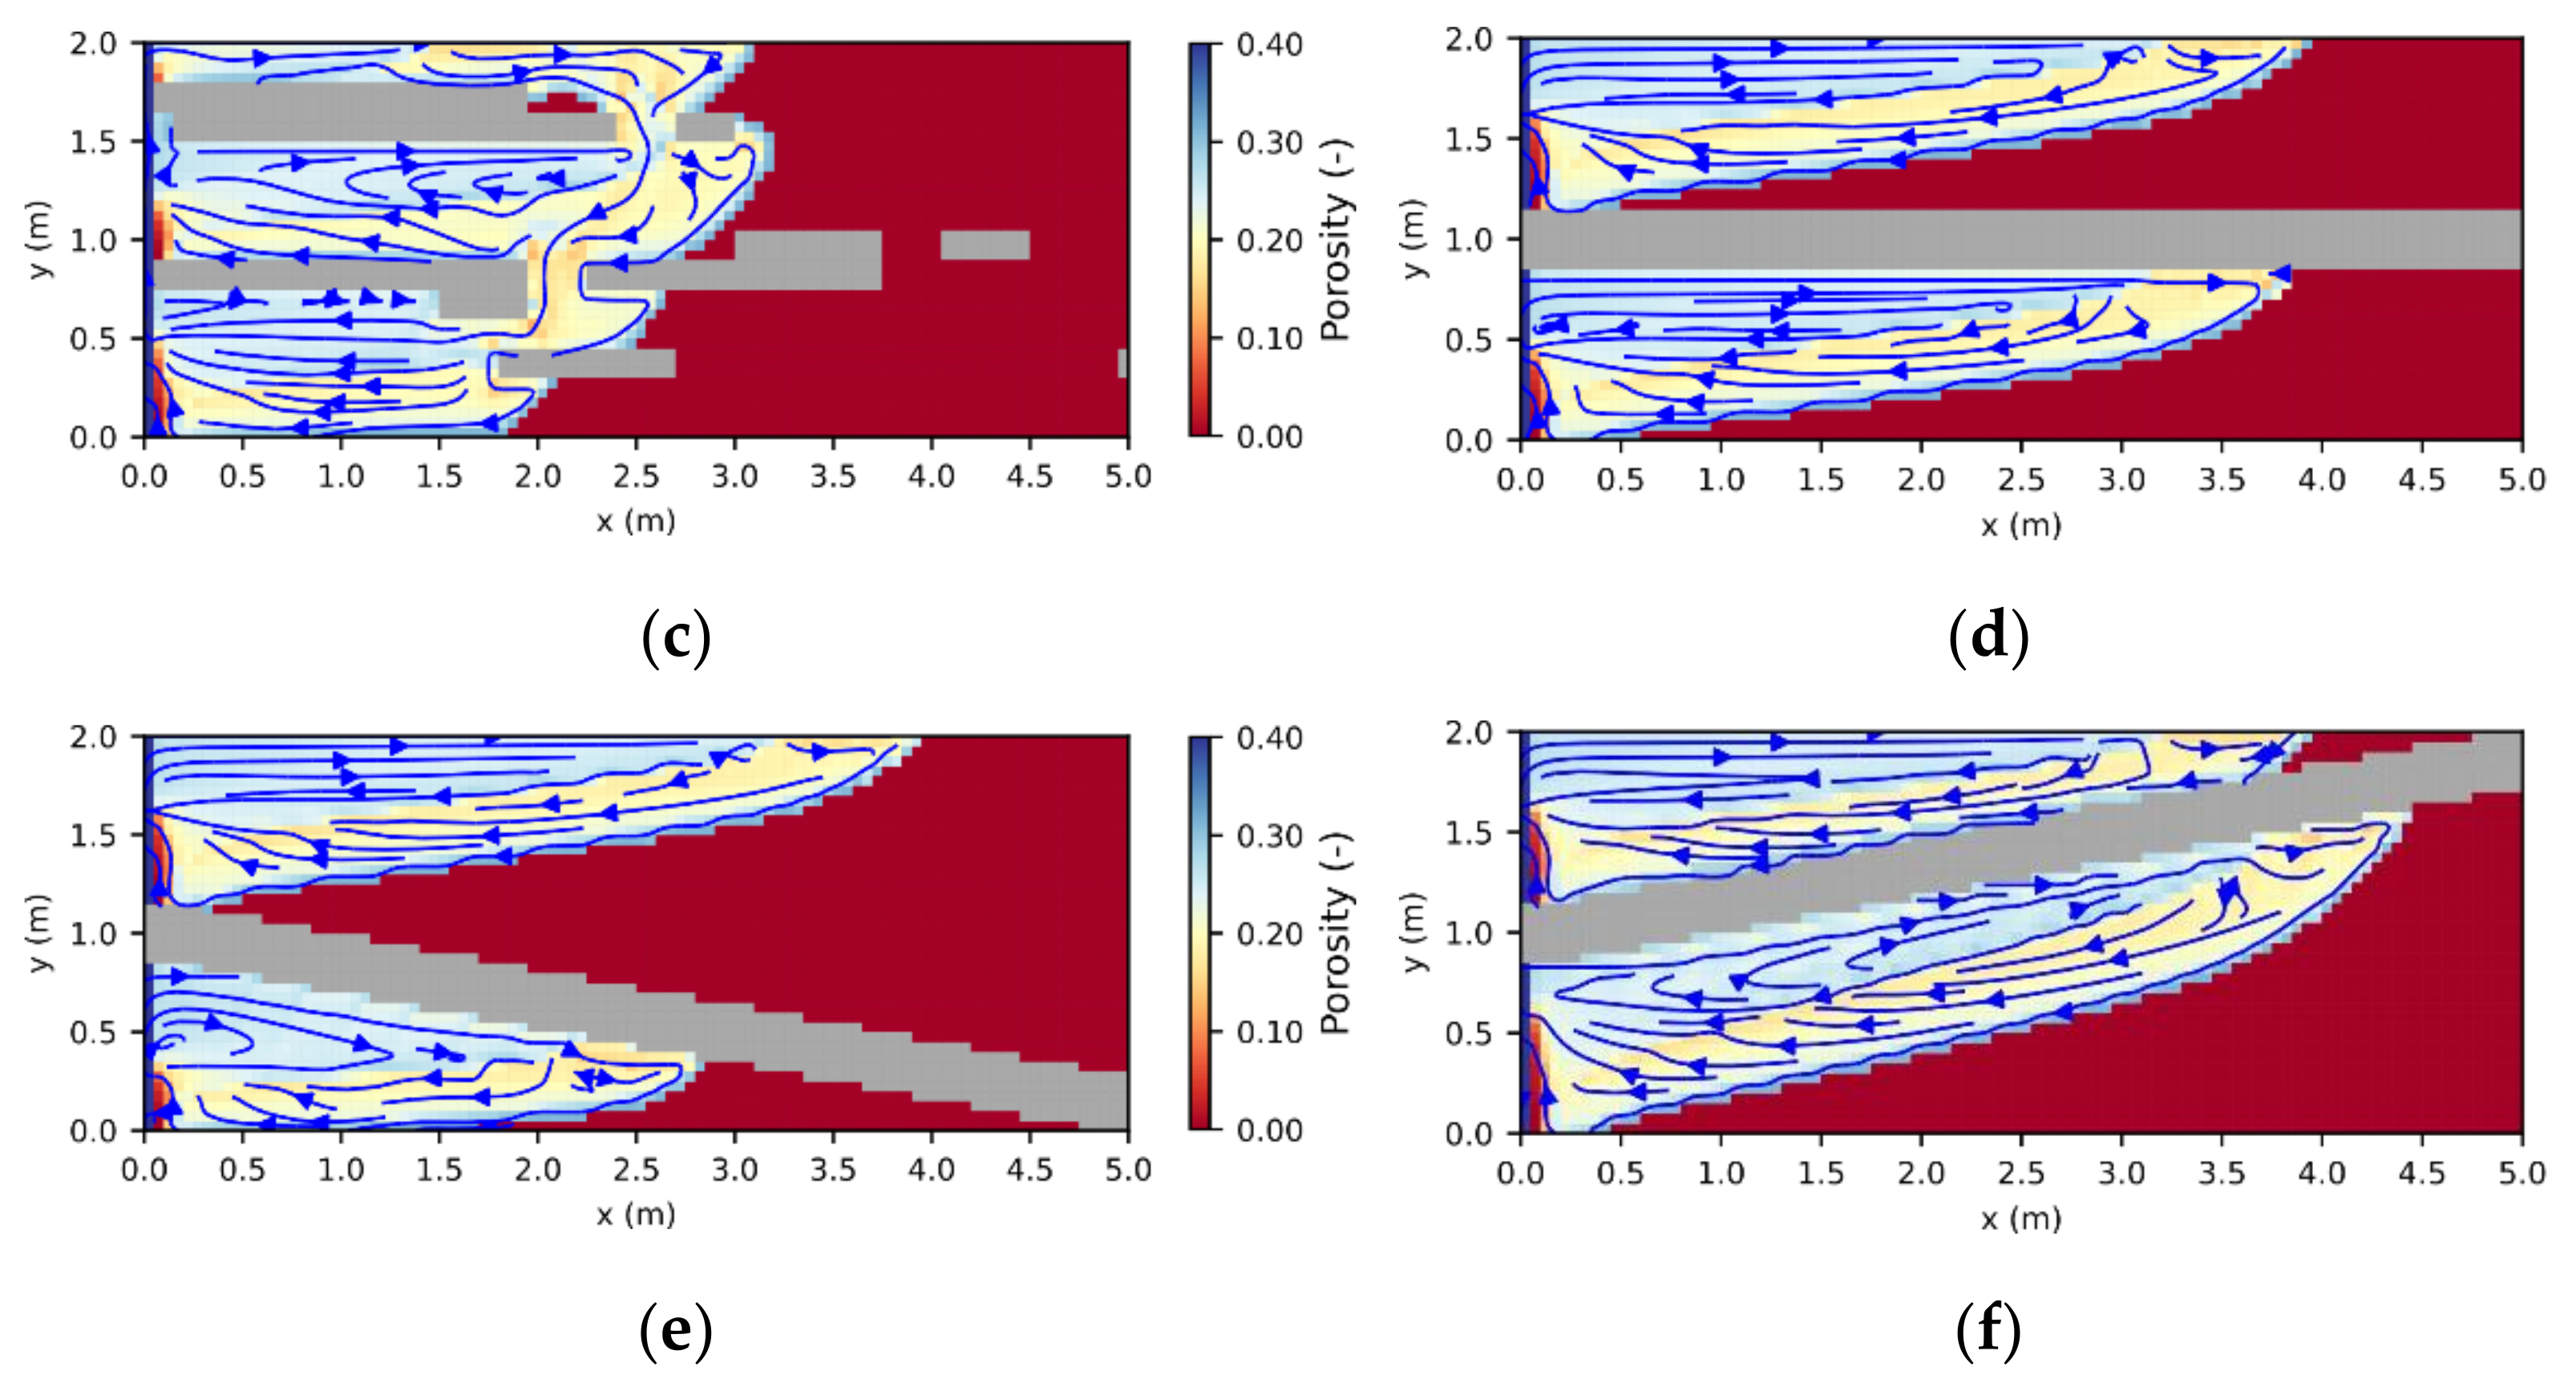
29], resulting in areas of pure halite (further referred to as halitic areas), acting as barriers to fluid flow. To investigate their influence on leaching zone evolution and hazard potentials, six generic rock distributions were considered. As shown in
Figure 6, the first three represented a potash seam (red) with intersecting layers of halite (grey). These layers were 30 cm thick and showed inclinations of 0° or ±10°, respectively (
Figure 6a–c). To ensure that boundary conditions are comparable, the layers always started at the same height at the center of the fault zone. In the other three cases, the potash seam contained halite inclusions ranging from 10 cm × 10 cm (
Figure 6d) to nearly continuous, horizontal layers (
Figure 6f). Their distribution was created with GSTools [
30], using correlation lengths of 2:1, 17:0.5 and 34:1 in the horizontal direction. In all six cases, the halitic area made up between 13% and 15% of the potash seam and the surrounding potash salt was homogeneous with the composition shown in
Figure 5. For comparison, an additional case without any halitic areas was considered.
For flow and transport calculations, the porosity–permeability relationship presented by Xie et al. [
31] was applied. Carnallite is dissolved first and makes up >30% of the rock volume; therefore, a relatively large contact area between the solution and remaining minerals, sylvite and halite, can be assumed. Both minerals show the same maximum dissolution rate
kmax as carnallite, facilitating a quick equilibration in the case of undersaturations. Therefore, non-equilibrated minerals were neglected in this study. Instead, sylvite and halite were immediately added to the equilibrated part
Mineq as soon as the carnallite in their surroundings was dissolved. The diffusion coefficients of all four transported species Na
+, Cl
−, K
+ and Mg
2+ were assumed to be equal and constant: an average value of
Df = 1.5 × 10
−9 m
2/s was chosen based on the study by Yuan-Hui and Gregory [
32]. The fluid compressibility was set to
cf = 4.6 × 10
−10 1/Pa. Temperature differences are negligible for a model height of 2 m; therefore, all simulations were undertaken at isothermal conditions at a temperature of 25 °C. Accordingly, the density-driven convective flow exclusively occurred due to dissolution and precipitation processes. The formation of leaching zones was simulated until the right model boundary was reached by the reaction front.


