Article

Identification of Promising Vacant Technologies for the Development of Truck on Freight Train Transportation Systems

1
Department of Industrial and Management Engineering, Korea University, 145 Anam-ro, Seongbuk, Seoul 02841, Korea
2
Logistics System Research Team, Korea Railroad Research Institute, 176 Cheoldobangmulgwan-ro, Uiwang-si 16105, Gyeonggi, Korea
3
Department of Packaging, Yonsei University, 1, Yeonsedae-gil, Heungeop-myeon, Wonju-si 26493, Gangwon-do, Korea
4
School of Industrial and Management Engineering, Korea University, 145 Anam-ro, Seongbuk, Seoul 02841, Korea
*
Authors to whom correspondence should be addressed.
Appl. Sci. 2021, 11(2), 499; https://doi.org/10.3390/app11020499
Submission received: 27 November 2020 / Revised: 27 December 2020 / Accepted: 5 January 2021 / Published: 6 January 2021
(This article belongs to the Special Issue Advanced Digital Technology in Logistics Engineering)

Abstract

:
In this study, we identify promising, currently vacant technologies for a Truck on Flatcar or Truck on Freight Train (TFTFT) system by analyzing the relevant patent information. We then apply network analysis from macro- and microperspectives to establish technology development strategies. We first researched the patent database from the United States Patent and Trademark Office (USPTO) by extracting relevant keywords for the TFTFT system. We then preprocessed the patent data to develop a patent-International Patent Classification (IPC) matrix and a patent-keyword matrix. Next, we developed a generative topographic mapping (GTM)-based patent map using the patent-IPC matrix and detected any patent vacuums. Then, in order to confirm the promising patent vacuums, we technically examined criticality and trend analyses. Finally, we designed an IPC-based network and a keyword network with promising patent vacuums to derive a technology development strategy from a macro- and microperspective for the TFTFT system. As a result, we confirmed two promising patent vacuums. The patent vacuums found were defined as the technical field of rail vehicles suitable for TFTFT systems and the technical field of equipment and systems for freight transfer to rail vehicles. The proposed procedure and analysis method provide useful insights for developing a research and development (R&D) strategy and technology development strategy for a TFTFT system.

1. Introduction

As freight volume increases due to globalization, real concerns about the environmental impact of freight transportation have arisen. Freight is transported via various modes, such as truck, rail, ship, or aviation. [1]. Each mode has different characteristics in terms of cost, transport time, and accessibility but all have in common that they emit greenhouse gases and pollute the environment. Freight transport is responsible for 14% of global greenhouse gas emissions [2,3]. Looking at the forecast of greenhouse gas emissions based on the demand trend of cargo handling volume, they are expected to increase even more than the surveyed figures. As environmental issues related to greenhouse gas emissions have attracted attention, many countries and companies have attempted to find alternative transportation solutions to minimize those emissions [4,5].
One such alternative solution is intermodal freight transportation systems, which are defined as a method of transportation of loads from origin to destination employing at least two transport modes, such as truck, rail, ship, or aviation, without processing the freight at the time of the mode change [6]. This method not only improves cargo handling and delivery speed but it also reduces cargo damage [7]. In studies on the use of ecofriendly road–rail intermodal freight transport, researchers have reported various positive effects, such as reducing greenhouse gas emissions by 77.4% and increasing fuel efficiency by 43.48%, compared to traditional truck transportation [8,9]. Various studies on complex freight transportation systems in the fields of transportation and logistics have been conducted, several of which have improved operational efficiency and transport network performance through collaboration between transport modes [10,11,12]. Research and technological development for real-time transportation monitoring are also underway [13,14]. In the abovementioned ways, intermodal freight transportation systems are being developed in terms of hardware/technical and software/systems.
Recognizing the importance of intermodal freight transportation systems, countries and companies are developing technologies to dominate the intermodal freight transportation industry in advance. However, decision-making faces difficulties in that it is not possible to accurately predict the technologies that will dominate this industry in the future. In addition, technology has become more complex as it advances. Therefore, many experts use patent documents to extract strategies for technology development or to identify relationships between technologies [15]. Patent documents have thus come to be regarded as a representative data source for forecasting technologies due to patent characteristics (i.e., originality, creativity, and novelty) [16]. Patent documents must be assigned one or more international patent classification (IPC) codes developed by the World Intellectual Property Organization (WIPO) [17,18]; therefore, based on IPC classifications, various analyses such as identifying cooperative relationships between technical fields, analyzing technology trends, and exploring vacant technologies are possible [19,20,21]. Consequently, it is possible to derive practical strategies for technology development.
Designing a practical R&D strategy requires that researchers make decisions that reflect technology trends. However, industries with advanced technologies are characterized by complexity, variability, and radicalness [22], making it necessary to discover technologies with high potential for future development before competitors do [23]. As an aspect of forecasting future technologies, this study aims to extract managerial insight and future strategies in the field of intermodal freight transportation systems by analyzing the related patent data.

2. Theoretical Background

Patent data have been regarded as a sufficient source of information in that patents satisfy technical and legal requirements [16,24]. Patent applications are also recognized as a very important factor for businesses and can be used to determine their level of technology [25]. Hence, patent analyses have been employed to extract managerial insight for designing technology development strategies. Patent analysis can be broadly divided into two methods. One is patent maps for detecting vacant technical fields. A vacant technical field is one that has not yet been developed. The other method is to explore technology collaboration and knowledge flow status through a patent network.

2.1. Patent Map

Patent maps describe relationships with patents through visual elements such as charts, graphs, bars, and tables [26,27]. A patent map is an effective method in that it provides both practical and intuitive information [28]. Although various types of patent maps have been developed, what the patent maps that utilize information such as author and citations have in common is that they are simple and intuitive. However, since such maps do not use a description of the patent document that contains a definition of the technology, an interpretation of a specific technical field is limited [29]. As machine learning-based tools have advanced, the concept of forecasting vacant technical fields has been employed by developing patent maps. In previous studies, principal component analysis (PCA), self-organizing maps (SOMs), and generative topographic mapping (GTM) have been employed as representative techniques. They can represent patent vacuum areas on a map by analyzing the information extracted from patent data [30]. These patent vacuum areas are regarded as vacant technical fields; therefore, patent maps are suitable to identify potential technologies that have not been identified or developed.
PCA is a dimensionality reduction and feature extraction algorithm that is accomplished by converting multiple variables into several linear combinations [31]. PCA can indicate the significant information in a two-dimensional space; therefore, by using it, researchers can simply identify patent vacuum areas. However, a PCA-based patent map has some limits in that the map has difficulty grasping the boundaries of the patent vacuum areas. If the patent vacuum area is defined differently for each researcher, the results can lead to various interpretations and can consequently be evaluated as invalid.
An SOM is an artificial neural network that maps multidimensional data into two-dimensional topology grids [32]. SOM-based patent maps can concentrate patents with similar characteristics on individual nodes, and the similarities and the differences of the nodes can be described by color contrasts [33,34]. However, an SOM-based patent map has limitations in identifying and interpreting patent vacuum areas because there is no specific rule to define the boundaries of the contrasting colors.
A GTM is a mathematical model for density modeling and visualization [35]. GTMs can project multidimensional data to lower dimensions and vice versa based on the inverse mapping. More importantly, a GTM-based patent map can overcome the limitations of PCA and SOMs [36,37]. Researchers can automatically identify patent vacuum areas and interpret vacant technology fields using an inverse mapping algorithm in the GTM-based patent map. Comparing the characteristics of the aforementioned three patent maps, unlike the PCA and SOM-based patent maps that require qualitative decision-making concerning their results, a GTM-based patent map can objectively interpret the results [37]. Yu et al. (2020) conducted a patent analysis study by developing a GTM-based patent map. However, the study has some limitations in that keyword vectors according to text mining were employed to develop the GTM-based patent map; technical domain and expert opinion are required to extract the significant keywords that construct keyword vectors. As mentioned above, analyses depending on experts require subjective decisions. Consequently, the keyword vectors are involved in determining whether the results are valid or not. The scope of the data can also be restricted according to the keyword vectors. The paper also analyzed the results of GTM-based patent maps into individual elements. The study did not take advantage of the GTM based patent map′s results. Therefore, this study aims to identify patent vacuum areas in the field of TFTFT systems by applying a GTM-based patent map based on classification information. In this study, IPC codes and keywords were used together to analyze the patent vacuum to improve the accuracy of the results. We can identify patent vacuum areas at the macro level due to the IPC characteristics [38].

2.2. Patent Network

Network analyses have been employed to simply understand the overall relationships of social actors (i.e., people, groups, and organizations) [39,40,41]. The network can be developed by measuring indicators that include degree, centrality, and density [42,43]. In particular, patent networks can explore technology trends and technical cooperation in specific technical fields [44,45,46]. A patent network analysis can be divided according to available information (i.e., citation, classification, and textual information) [47].
A citation-based network analysis considers patent documents as nodes (i.e., actors) and visualizes the relationships with links between nodes. A citation network can contribute to the interpretation by intuitively showing the macroscopic flow of the technical fields [37,48] but inter-relationships cannot be identified in detail because the network only considers the frequency of citations [44]. IPC-based network analysis has been developed by employing the IPC classification developed by the WIPO to identify technical relationships [49]. Since all patents must be classified under the IPC codes for specific technical fields, the technical content can be analyzed via an IPC-based network.
Patent documents contain unstructured textual information. Previous studies have attempted to extract keywords in patent documents by applying text mining. Because the extracted keywords can explain the characteristics for patents [50], keyword-based network analysis has been employed to understand the most significant technology in the patent database [47]. This network can represent keywords as nodes and can indicate the relationships with links.
In this analysis of TFTFT system technology, IPC-based network analysis and keyword-based network analysis were applied to derive an empirical concept for technology development strategies. This study suggests that it is necessary to provide practical ideas to plan R&D for new technologies. The results may be clearly interpreted from both an overall and a detailed technical perspective on technologies.

3. Identifying Promising Vacant Technologies

3.1. Overall Research Framework

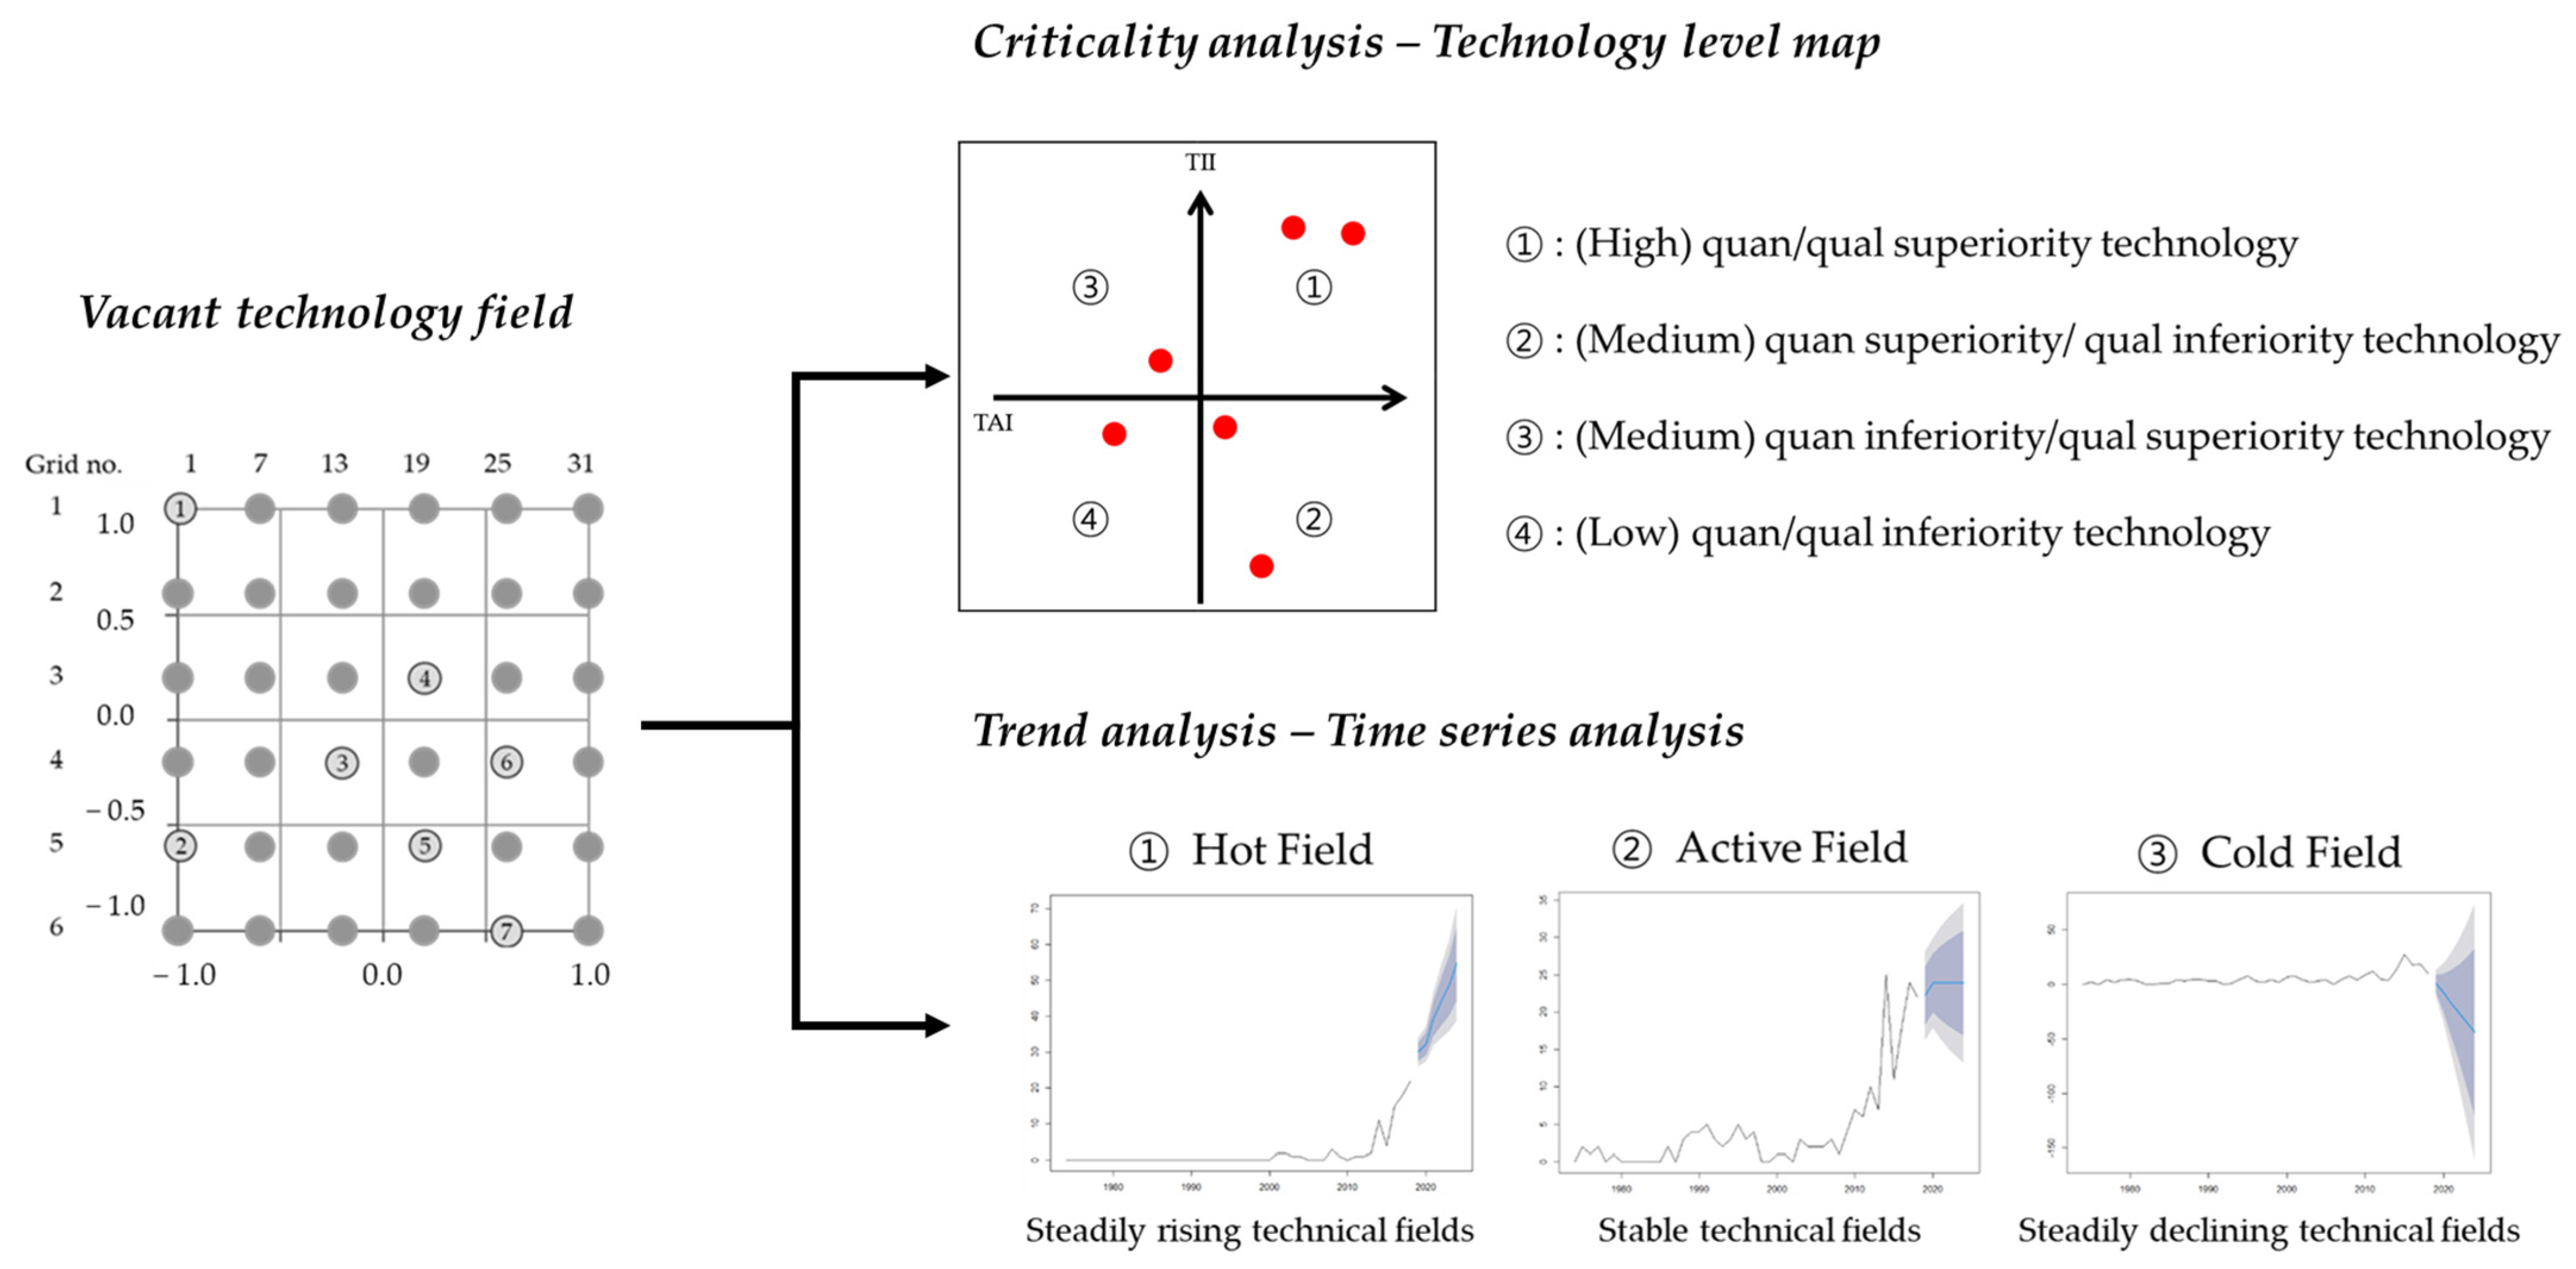
The overall process of our proposed approach consists of the following three steps: the identification of vacant technology fields, technical analysis of vacant technology fields, and investigation into emerging and vacant technology fields. Each step consists of substeps to achieve the goal, as shown in Figure 1.
The first step is an attempt to develop a GTM-based patent map based on the patent documents by analyzing the IPC vector and locating the patents on a two-dimensional map to identify vacant technology fields that contain relatively few patents compared to other areas. For the second step, we explore the potential vacant technology fields by identifying potentiality with a trend analysis. The final step derives a technology development strategy through IPC information and significant keywords. Technical analyses of the vacant technology field include criticality and trend analyses. In the criticality analysis, patents are visualized based on the number of applications, enabling us to identify which technical fields are technically valuable through TAI and TII indicators and trends. Trend analysis can be performed based on patent application trends. Finally, we can identify the relationship between IPC and the significant keywords. A more detailed explanation of the process is provided below.

3.2. Detailed Procedures

3.2.1. Identification of Vacant Technology Fields Using a GTM-Based Patent Map

First, vacant technology fields can be identified through three substeps: collecting and preprocessing patent data, developing a patent map, and identifying vacant technology fields (Figure 2).
Patent documents can be collected from various patent institutions; we collected patent data from the United States Patent and Trademark Office (USPTO) [51]. The patent documents contain various information such as abstract, title, and IPC classification for the specific technical fields.
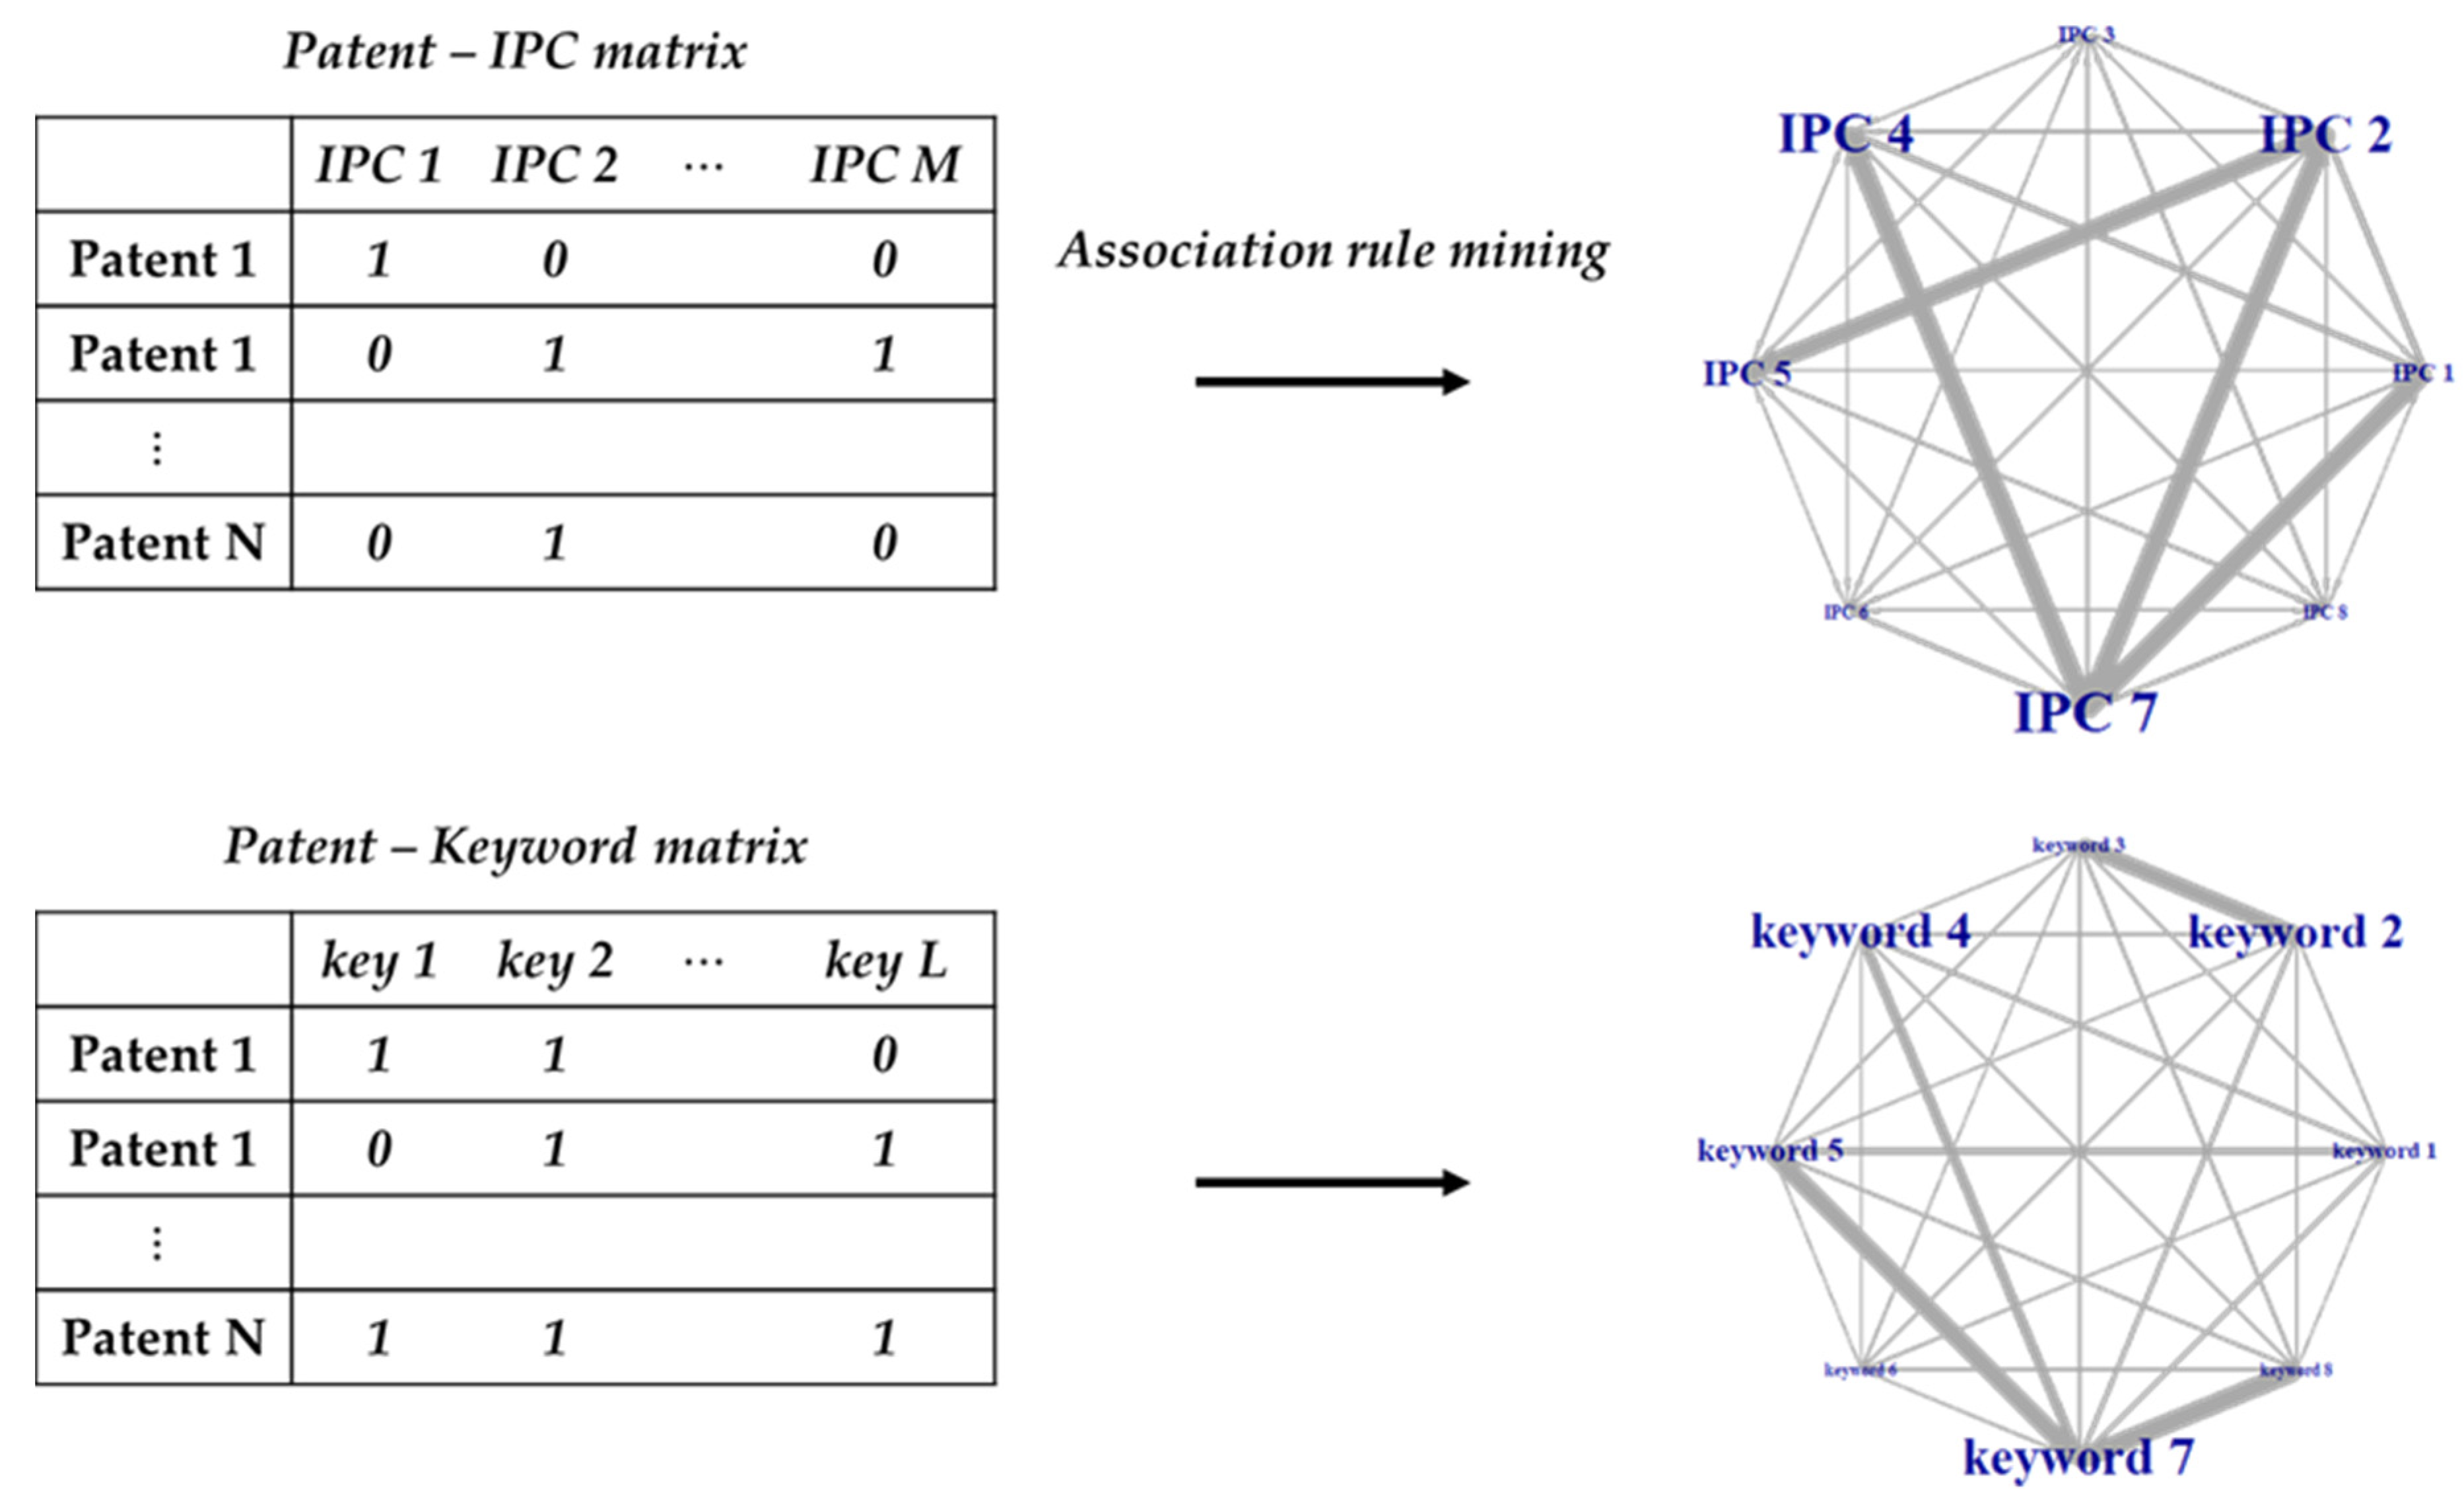
In this study, patent data preprocessing aims to generate a data set comprising a patent-IPC matrix and a patent-keyword matrix. In order to generate the patent-keyword matrix, textual information should be preferentially tokenized and then preprocessed by removing punctuation, abbreviations, and stop words [52,53,54,55]. The refined textual data contains only the words that are essential to describe a patent document through the preprocessing of unstructured data text [56]. The patent-IPC matrix is developed based on the IPC in the patent document. IPC codes can categorize into specific technical fields [57], and patent documents must be assigned to one or more IPC codes [58]. The IPC code has a hierarchical structure including sections, classes, and subclasses. It is used by classifying it into IPC class and subclass for an accurate explanation about technologies. Therefore, in this study, we classified the IPC into subclass levels to clarify the explanation [38]. Patents with a higher than the average frequency of each subclass in the patent documents were employed to generate the patent-IPC matrix. Additionally, we develop the patent-keyword matrix base on the patent document’s title and abstract. For developing the patent-keyword matrix, the TF-IDF method was applied to extract keywords. It is a method of extracting significant keywords by analyzing the frequency and TF-IDF weights of individual documents. The extracted significant keywords are used to make a keyword–patent matrix [36].
Subsequently, we developed the GTM-based patent map using the patent-IPC matrix. GTM-based patent maps can be visualized onto a two-dimensional space, and patent vacuums can be detected in them. In order to develop a GTM-based patent map, the map size related to the number of grids should first be determined. If the map size is too small, the overall grids can be occupied, making it difficult to detect the patent vacuums. On the other hand, if the map size is too large, there will be too many patent vacuums to analyze because the map may be sparse. Prior to developing this map, we need to define the parameter of map size [37]. Therefore, we performed sensitivity experiments to determine the map size: (1) 4   ×   4 , (2) 6   ×   6 , (3) 8   ×   8 , and (4) 10   ×   10 .

3.2.2. Technical Analysis of Vacant Technology Field through Criticality and Trend Analyses

After identification of the vacant technology field, the second step focuses on determining if it holds promise through two substeps: criticality analysis and trend analysis. (Figure 3).
To design practical R&D planning, it is necessary to investigate the prominent characteristics of the vacant technology and identify the related trends. To understand a technology’s potential, it is necessary to evaluate the current level of technology and predict its prospects [59,60,61]. Therefore, we performed a criticality analysis through a technology level map to evaluate the current technology level and a time series analysis to predict prospects.
A criticality analysis aims to assess the current technological level by using a map that evaluates the relative level of technology. This technology level map uses the number of patent applications as a quantitative evaluation criterion and the number of patent claims as a qualitative evaluation criterion [59]. Its X-axis represents the technology activity index (TAI) for the relative quantitative valuation of technology. As more patents are applied for, it shows that a technology is growing rapidly [62]. The Y-axis represents the technology impact index (TII) for the relative qualitative valuation of the technology. The number of claim items is suitable as an evaluation index of the effect of technology because it represents the scope of patent validity [63]. Therefore, we performed a criticality analysis using a technical level map to evaluate the current level of vacant technology fields. The technical fields can be located in the 1, 2, 3, and 4 quadrants of the map. The 1 quadrant is defined as the high level where both the TAI and TII indicators are high, and the 2 and 3 quadrants are defined as the medium level where either the TAI or TII indicator is high. Finally, the 4 quadrant is defined as the low level where both indicators are low.
A trend analysis aims to forecast the future of a technology field. A time series analysis is a method of predicting values using historical data obtained continuously at regular intervals over time. Time series data is composed of viewpoints and frequency; the viewpoint is the independent variable, and the frequency is the dependent variable. The predicting value is then determined using a statistical method. Due to various environmental variables, a time series analysis is more suitable for short- and medium-term perspectives than for long-term perspectives [64]. There are various predictive analysis models for time series analysis. In this study, we apply the ARIMA model, which reflects the autocorrelation of previous values affecting subsequent values, the effects of random variables over time, and trends in historical data to analyze trends analysis in technical fields Based on the trend analysis results, we defined the rising technical field as hot field, the decreasing technical field as cold field, and the stable technical field as active field [65,66].

3.2.3. Investigation into Emerging and Vacant Technology Fields Using an ARM-Based Network Analysis

The final step is designed to deduce the technology development strategy through network analyses: IPC-based network analysis and significant keyword-based network analysis (Figure 4).
A patent network analysis measures the interactions between technologies while visualizing and analyzing those interactions. Patent data has IPC codes, which are classification systems for patents and significant keywords that express core technologies. A network analysis is performed via the association rule mining (ARM) method using the patent-IPC matrix and patent-keyword matrix, which are co-occurrence matrices derived in the process of preprocessing patent data. In this step, we analyze the relationship between technical fields in relation to the IPC and the relationship with the core technology in relation to keywords. We deduce the overall technology area and detailed technology development strategy through two types of network analyses.
An ARM is an algorithm that aims to identify dependencies between items in a data set and to represent the various identified rules [67]. ARM defines indicators such as support, confidence, and lift based on the conditional probability that IPC codes in the analysis data will appear. Therefore, we use ARM′s indicator to explain the rules and select the appropriate ones. Here, A and B are defined as a set of IPC codes. Support is an indication of the IPC codes’ appearance frequency in the database. The support of rule (A → B) can be calculated by the following Equation (1):
Support: (A → B) = P(A ∩ B).
Confidence is an indication of true frequency in if-then rules where B appears when item A appears. The confidence of rule (A → B) can be calculated by the following Equation (2). The confidence is used to analyze the association of B with A. However, confidence is limited in the overall analysis because the confidence value depends on the size of A.
Confidence: (A → B) = P(B│A).
Lift is an indication of the probability of an item set based on the probability of the individual items in the set. The lift of rule (A → B) can be calculated by the following Equation (3). If the lift is greater than 1, then items A and B are dependent on each other. On the other hand, if the lift is 1 or less, items A and B are interpreted as unrelated [68,69,70].
Lift: (A → B) = P(B│A)·P(B).
In the patent analysis, IPC codes and patent keywords can be applied to ARM to determine the association rules. The association rules ( IPC   code 1 IPC   code 2 ) determine that IPC   code 1 influences the development of IPC   code 2 . We build an IPC network through the association rules. The keyword network is expressed based on the co-occurrence matrix. To analyze the relationship between technologies using networks and indicators, we analyze the relationship on a network graph using the significant keywords with various indicators, such as degree centrality, closeness centrality, and betweenness centrality.
The ARM-based IPC network that visualized the IPC code association rules and the keyword network that visualized technical keywords with a network graph analyze the relationship between IPC codes and keywords. The results of the SNA analysis can be used as guidelines for R&D and for determining technological feasibility.

4. Technology Development Strategy of TFTFT Systems

In this study, patents related to TFTFT system technologies were extracted from the USPTO database. Research related to TFTFT system technologies was selected by searching for the keywords needed for patent search formulas. A total of 2219 patents were collected from between 1974 and 2020 using the search formula. The scope of patent data includes Chinese, US, Japanese, Korean, and European patents. Experts in the relevant technical field have confirmed the patents in order to select only those related to TFTFT system technologies. In the process of collecting the patent data, patent search formulas were extracted based on prior research and reports on the technology. In the process, 20 researchers from the Korea Railroad Research Institute, participating companies, and academic personnel who were developing the technology as national R&D and practical tasks validated the extracted patents. As a final result, 1536 valid patents for TFTFT systems were selected.

4.1. Patent Map Development and Identification of Vacant Technology Fields

4.1.1. Development of a Patent-IPC Matrix and Patent-Keywords Matrix

A patent document consists of technical information such as an abstract, title, and IPC code. Through the IPC codes, we can describe the technology in particular technical fields [57]. In addition, the abstract and title provide detailed information on the technology, and we can understand the patent’s technical elements through the text mining method.
The IPC was analyzed at the subclass level to design the patent-IPC matrix. Although 191 subclasses were obtained from the collected patent documents, only 31 subclasses appeared more often than the average subclass frequency in the patent documents, a criterion for use in the analysis. If the Patent-IPC matrix value contains many “0” s, it is difficult to explain clearly, so it is necessary to select the IPC. Therefore, we selected only IPCs that are used more frequently than average and constructed a matrix with 31 subclasses. For those 31 subclasses, vectors corresponding to 1536 patent documents were created. Consequently, the patent-IPC matrix was represented by a 1536 × 31 matrix, and each patent document was set to “1” if it contained a particular IPC code (See Table 1).
The patent-keywords matrix used abstracts and titles. Significant keywords were derived to identify the key elements that make up the technology and to analyze the technology based on them. We applied a data preprocessing process to derive the significant keywords. First, we applied the process of tokenization by stemming and removing unnecessary information and words. After that, we applied the TF-IDF method to remove words that are not related to the TFTFT system and selected significant keywords. Finally, the top 200 significant keywords were derived, and the keyword vectors were generated. At this time, TF-IDF values are extracted from high values to increase the explanation power of keywords. Consequently, the patent-keywords matrix is represented by the 1536 × 200 matrix, and each patent document is set to “1” if it contains that keyword (See Table 2).

4.1.2. Identification of Vacant Technology Fields

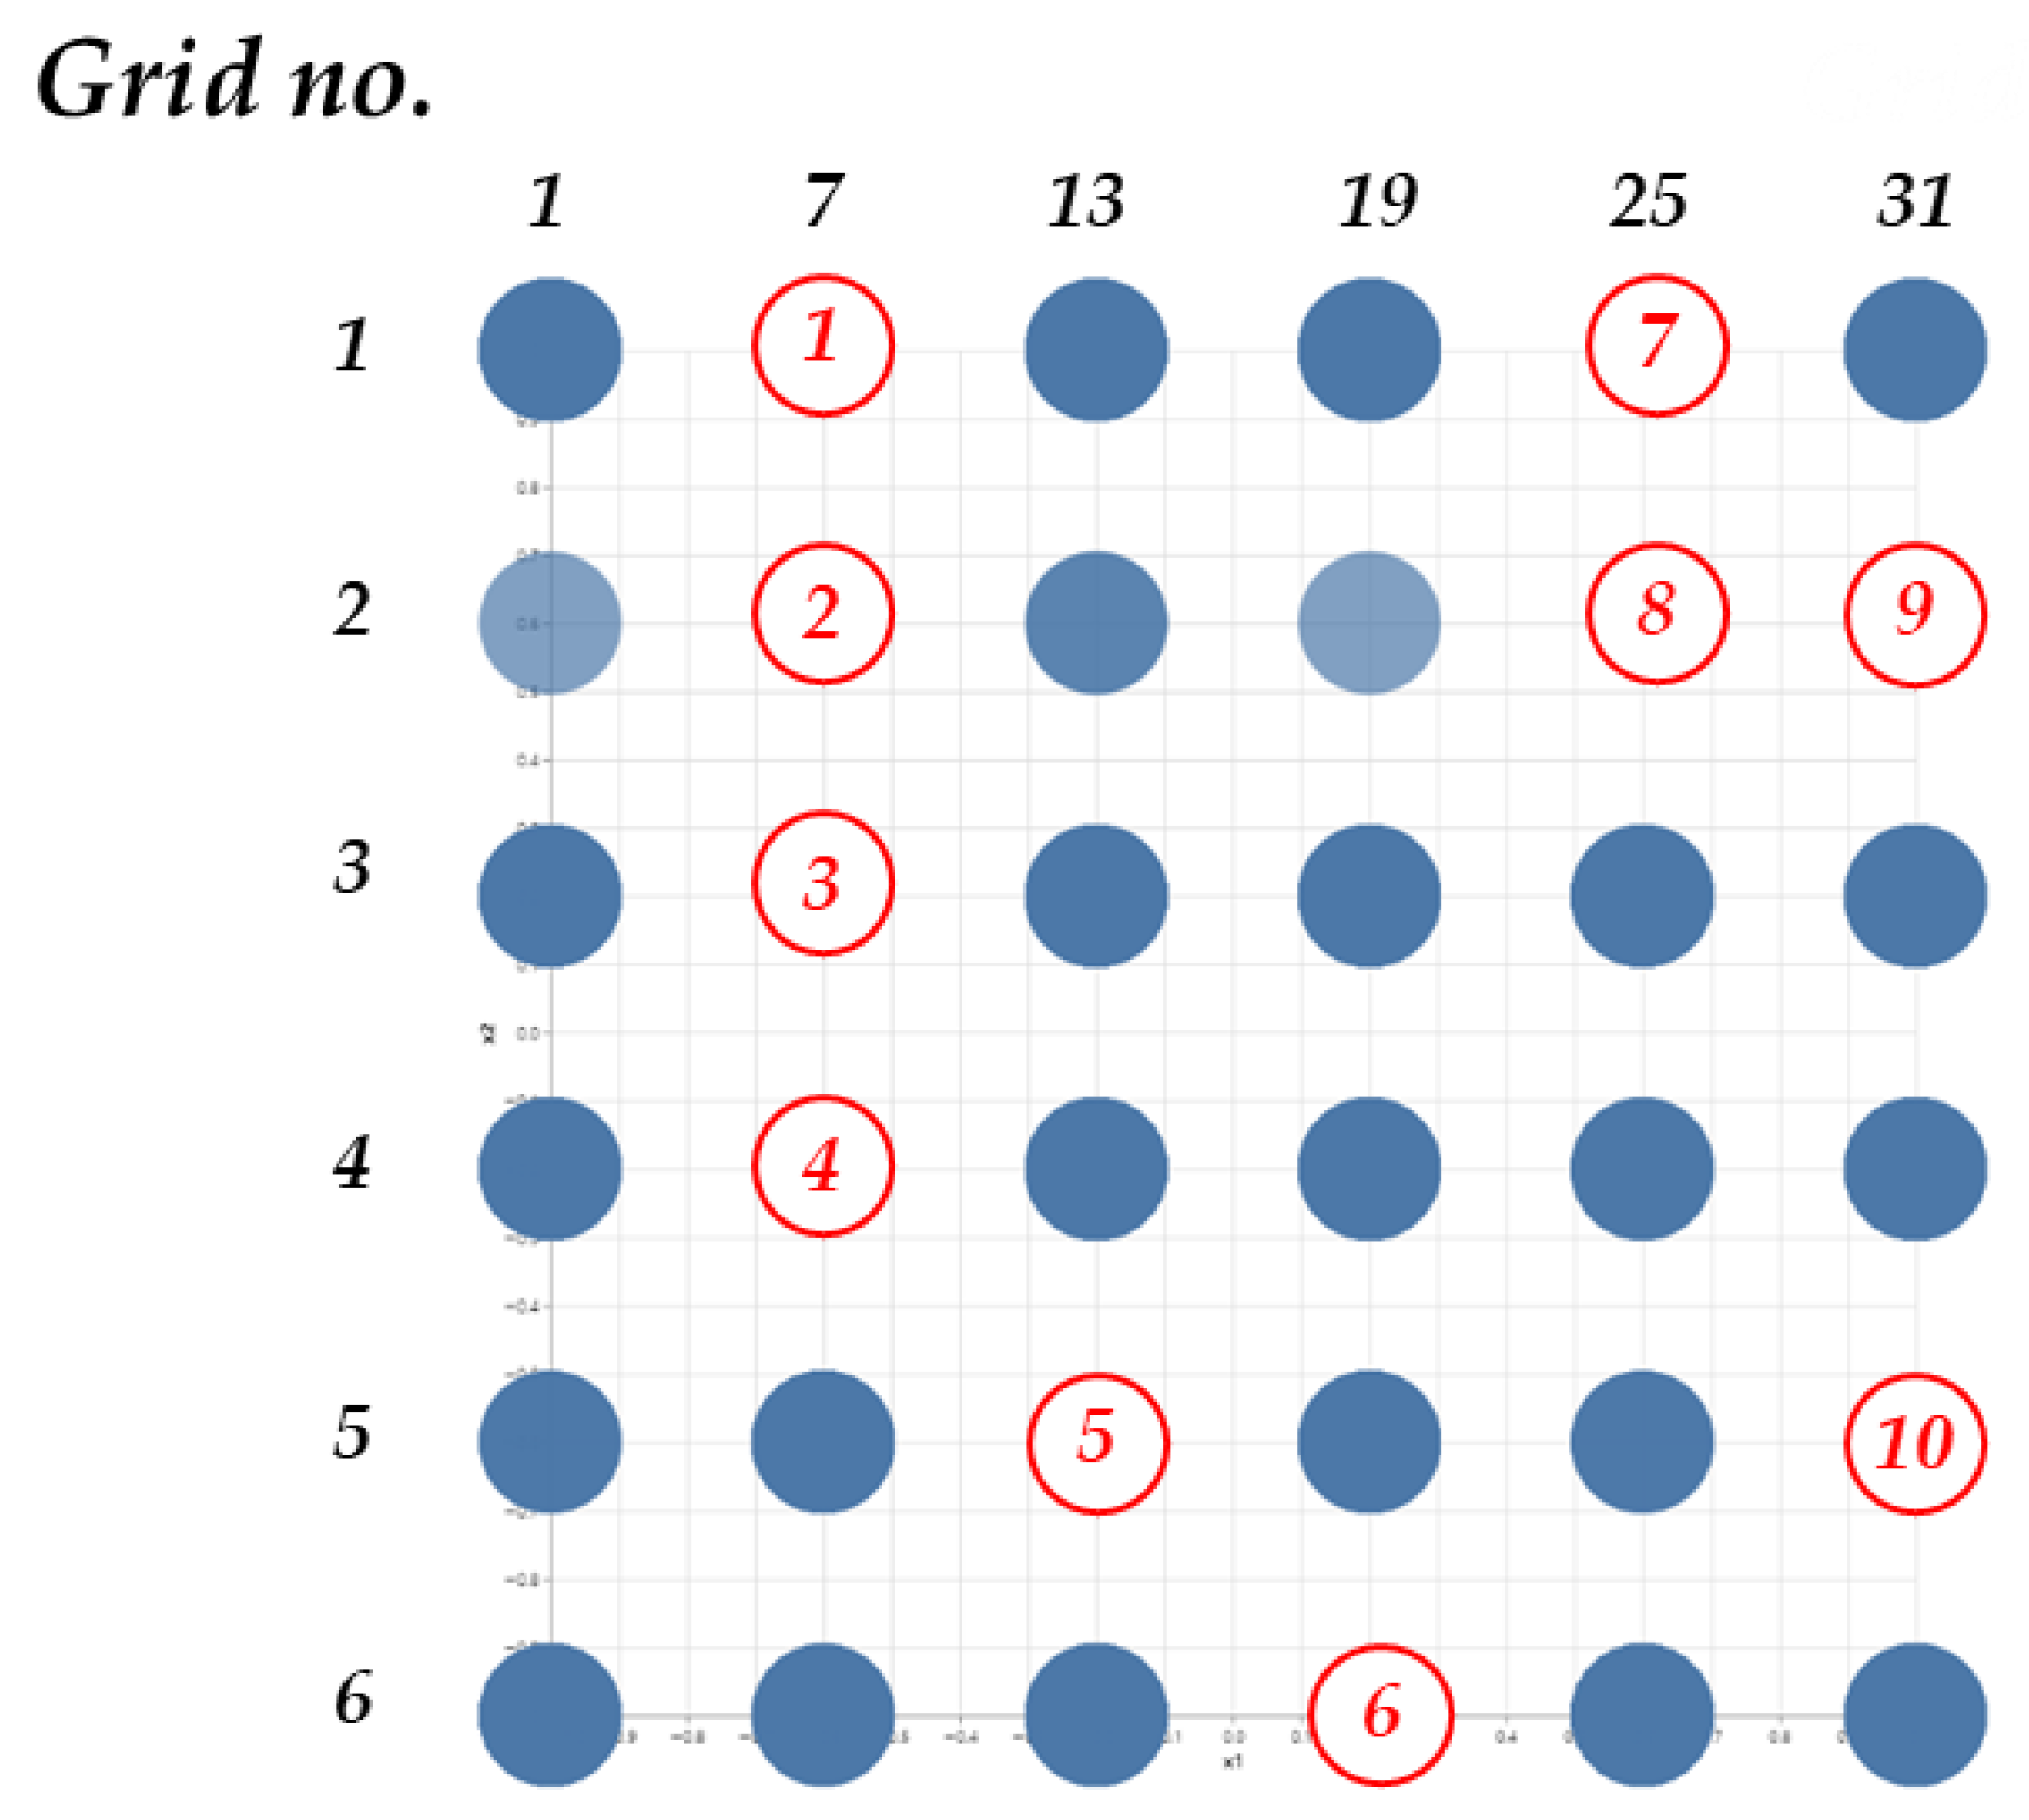
Subsequently, a GTM-based patent map was developed by analyzing patent documents for subclass vectors to detect patent vacuums. Prior to developing this map, we need to define the parameter of map size [37]. Since there are no rules that determine this parameter, we performed sensitivity experiments that changed the map’s size to select it. The sensitivity analysis conducted was based on (1) 4 × 4, (2) 6 × 6, (3) 8 × 8, and (4) 10 × 10 to determine the size of the patent map. As a result, the number of patent vacuums was too small to be identified and defined in (1) 4 × 4 because there were less than five patent vacuums, and more than 63 patent vacuums were analyzed in (3) 8 × 8 and (4) 10 × 10, making it impossible to define the patent vacuums. Thus, a patent map analysis was conducted based on (3) 6 × 6, where 10 patent spaces were derived. Figure 5 shows the developed GTM-based patent map on which all patent documents are mapped, allowing patent vacuums to be clearer and automatically discovered. A total of 10 patent vacuums were detected.
Patent vacuums can be converted to subclass vectors on the patent map using GTM′s inverse mapping algorithm. However, subclass vectors are converted to continuous values, not binary values. In order to analyze the subclass corresponding to the patent vacuum, it is necessary to determine the threshold value, which must be determined in consideration of the research purpose and the distribution of data. In this study, the threshold was set to 0.4. If the vector value of the subclass is 0.4 or more, it is displayed as “1”, and if it is less than 0.4, it is displayed as “0”. Based on this, the subclasses corresponding to the patent vacuums are classified as shown in Table 3. The patent vacuums can be interpreted in the vacant technical field of the TFTFT systems.
As a result of analyzing the patent vacuums, no subclasses were found in the four patent vacuums (patent vacuums 2, 3, 6, and 7). Finally, we identified six patent vacuums and their subclasses in each patent space.

4.2. Technical Analysis of Vacant Technology Field

A patent vacuum can be detected using GTM-based patent maps and can be objectively interpreted as a vacant technology field. However, in order to design a technology development strategy, the potential for vacant technology fields must be confirmed. Therefore, we performed criticality and trend analyses to confirm the potential of the vacant technology fields.

4.2.1. Criticality Analysis

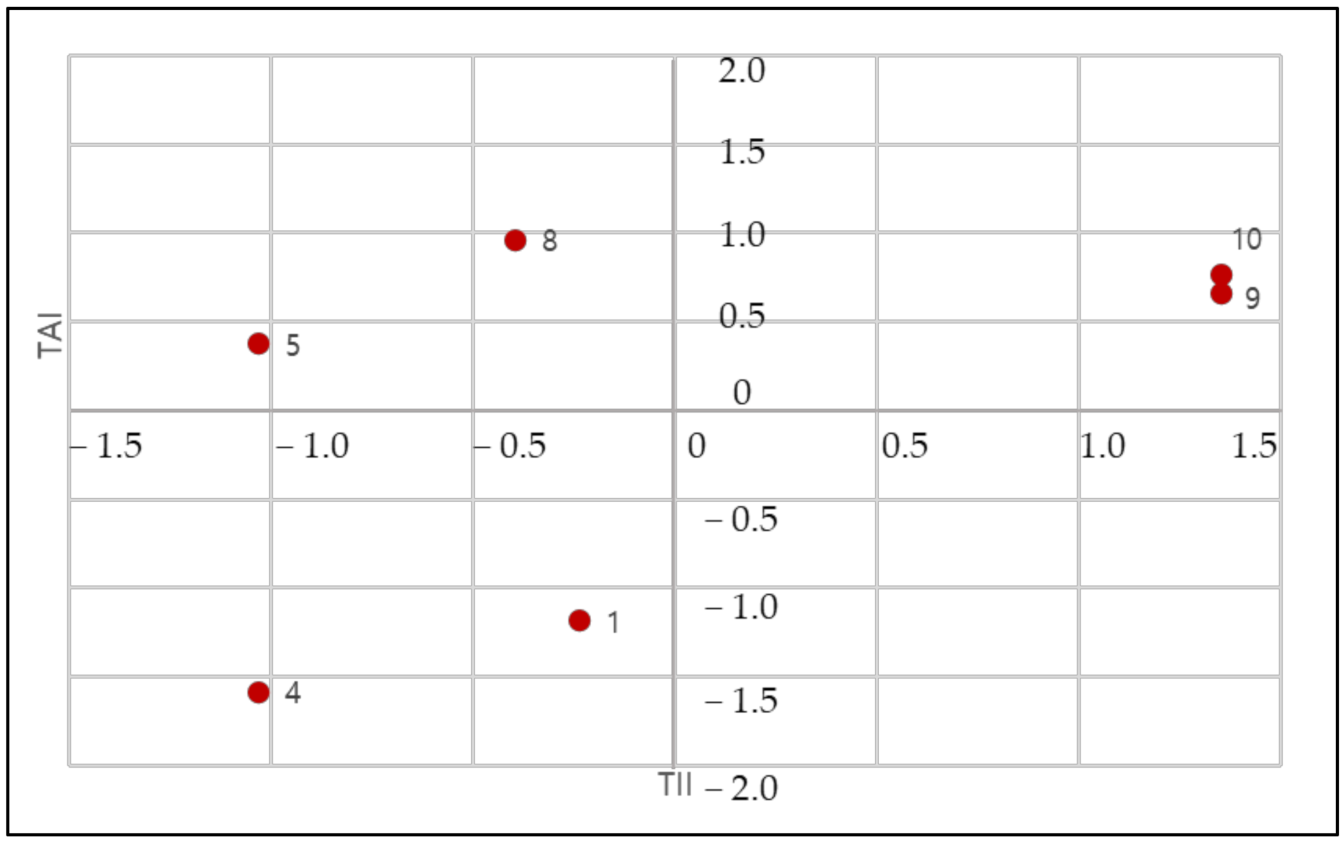
Six vacant technology fields for TFTFT systems were identified at different levels of development. These differences create uncertainty in the development of technology. Therefore, the criticality analysis uses a technology level map that leverages the quantitative index of patent applications and the qualitative index of patent citations to ascertain the current level of technology in a vacant technical field. The technology level map shows the relative level by technology field, as shown in Figure 6.
The technical levels of the patent vacuums were classified into three levels: high, medium, and low. In Figure 6, the 9th and 10th patent vacuums were identified at the high level because all the indicators have positive values, while the 5th and 8th patent vacuums are at the medium level with positive values from the TAI index only. The 1st and 4th patent vacuums were identified at the low level since both indicators were negative.

4.2.2. Trend Analysis

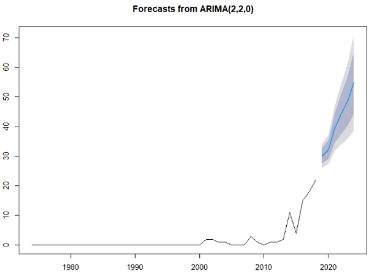
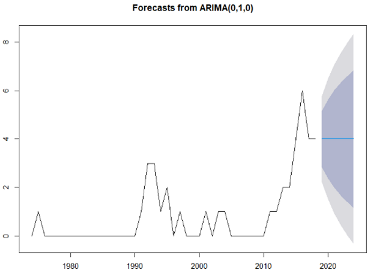
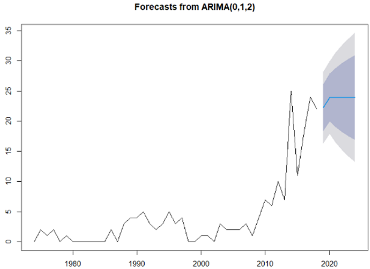
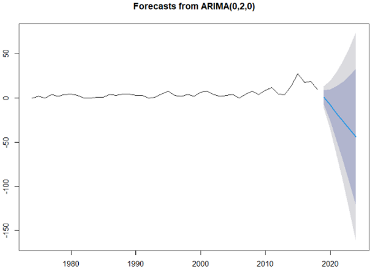
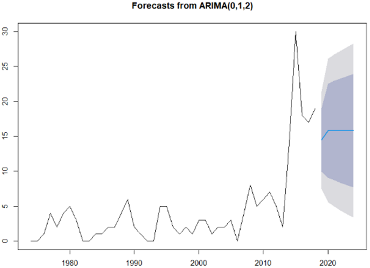
Development of a vacant technology field requires a confirmation of future promise as well as of the current technological level. We conducted a trend analysis through a time series analysis to confirm the potential of future technologies. In this study, we applied the ARIMA method of time series analysis to the six patent vacuums to confirm trends. The ARIMA algorithm requires the definition of the p, d, and q parameters, which are variables related to the order, difference, and moving average of the autoregressive model. For this variable, we applied the “auto.arima” function from the R programming package. In addition, since a patent is published 18 months after its application is accepted, a trend analysis was conducted based on the number of patent applications made before 2018.
The results of the trend analysis were classified into hot, active, and cold fields. Table 4 shows the results of the trend analysis on the six patent vacuums. Fields with a steady increase were identified by hot fields in the 1st and 9th patent vacuums, fields of steady technological development were identified in the 4th, 5th, and 10th patent vacuums, and finally, fields of gradual decline in technological development were identified in the 8th patent vacuum.

4.2.3. Results of Technical Analysis

Table 5 below shows the results of the criticality and trend analyses and the technical analysis of the vacant technology fields.
As shown in Table 5, the results of the criticality analysis and the trend analysis are absolutely inconsistent. This is because the criticality analysis judged the current state of the technology based on the number of patent applications and claims, while the trend analysis analyzed technology trends based on time series data. If both are satisfied, the vacant technology field needs to be developed and deserves the market’s attention. Therefore, the 9th patent vacuum is in meaningful technical fields, and countries and companies can implement technology development strategies to take advantage of this unoccupied space. The 10th patent vacuum is currently a high-level technology and has been continuously developed through the results of technical analysis. Based on these results, the 10th patent vacuum can be judged as a technology that must be continuously developed in the future. From these results, a patent vacuum was derived from the second field of technological development. However, if the criticality analysis is low but the trend is rising, it is currently less important but its importance may increase in the future. Although the current technological state of the 1st patent vacuum is very low, its possibility of future development is high. The 4th, 5th, and 8th patent vacuums need to be monitored for developing the related technology in the future, and it is necessary to intensively analyze the vacant technology fields of the 9th and 10th patent vacuums, which have become high priorities in the development of technology development strategies.

4.3. Investigation into Emerging and Vacant Technology Fields

An investigation of vacant technology fields is needed to design technology development strategies that take advantage of them. We have conducted network analysis on the 9th and 10th patent vacuums, which are defined as promising patent vacuums. We analyzed the relationship of overall technical fields in the relevant technical field using IPC codes and the relationship between detailed technologies using significant keywords.

4.3.1. IPC Network Analysis

The patent-IPC matrix was applied to the ARM method to discover the relationships between IPC codes. The association rules were applied to find the relationship between the IPC codes representing previous technology and the IPC codes representing next technology in the vacant technology field. The rules with a high lift value represent a strong relationship between technology fields. Table 6 and Table 7 summarize the top 5 rules by lift criteria as a result of applying ARM to the 9th and 10th patent vacuums.
The ARM-based network is schematized, as shown in Figure 7. A network with too many rules applied is not intuitive; therefore, it is necessary to create and analyze a network based on the upper rules. The ARM-based network in this study was designed based on the top 10 rules of the lift. ARM-based networks are represented by different circle sizes and chromas: the larger the Support, the larger the size of the circle and the larger the lift, the darker the color. The network analysis of the 9th patent vacuum and the 10th patent vacuum is as follows.
The IPCs that belong to the 9th patent vacuum are B60P and B61D. The technical fields affecting B60P were analyzed as E04H, B65D, and E04B, while the technical fields affecting B61D were analyzed as B62D, B60F, B61F, B61L, and G06Q. Hence, to develop the 9th patent vacuum, these 8 IPCs need to be carefully analyzed. The IPCs that belong to the 10th patent vacuum are B65G and B61D, and the technical fields that have the greatest impact on B65G and B61D are B61B, E01B, and B61L. From a broader perspective, B63B and B66C also need to be analyzed for technological development, making a total of 5 IPCs that need to be analyzed to develop the 10th patent vacuum.

4.3.2. Keywords Network Analysis

In this study, patent documents including IPC are sorted, network analysis is performed via a co-occurrence matrix based on significant keywords, and the relationship between technologies is analyzed. Various indicators, such as degree centrality, closeness centrality, and betweenness centrality for quantitative network analysis, are examined. Because the purpose of the study’s network analysis is to prioritize the technical elements that need to be developed, the analysis is based on the closeness centrality. When visualizing the network, the larger the proximity centrality, the redder it is. Eight and five IPCs need to be analyzed, respectively, to develop the 9th and 10th patent vacuum technologies through the ARM-based IPC network. (Table 8).
For the technological development of the patent vacuum, we selected the patents containing at least one IPC of each patent vacuum′s IPC. Then, based on the patent-keyword matrix, the keyword network was schematized and expressed, as shown in Figure 8. As a result of the network analysis of the 9th patent vacuum, the technical elements with high closeness centrality were “control,” “lock,” “load,” and “assemble.” In addition, as a result of the network analysis of the 10th patent vacuum, “frame,” “vibrat,” and “signal” were determined to be the significant technical elements.

4.4. Results

The technological development of the TFTFT system was confirmed by applying various methods. First, a GTM-based patent map was created to detect patent vacuums. As a result, a total of 10 patent vacuums were found, and 6 patent vacuums were confirmed, excluding empty vacuums. Second, we conducted a technical analysis to confirm the promise of the patent vacuums. A technical analysis consisting of a criticality analysis to confirm technology level using a technical level map considering the quantitative and qualitative perspectives of the technical field and a trend analysis to confirm future promise using a time series analysis were conducted. The criticality analysis classified the technical level into high, medium, and low levels, and the trend analysis was categorized into hot, active, and cold fields. Comprehensively, we have identified patent vacuums in the high level-hot field area. Third, an IPC network was used to analyze the macroscopic aspects, and the keyword network was used to analyze the relationship between the technical elements in order to derive a promising patent vacuum technology development strategy.
In the technical analysis, it was found that the development of the 9th and 10th patent vacuums was the priority among patent vacuums. When planning vacant technology development, patent vacuums must be considered promising technology fields. Vacant technology is a technology that has not yet been developed, making empirical decision-making difficult. In order to design a concrete technology development strategy, we conducted the network analysis using IPC codes and technology keywords. As a result, the 9th patent vacuum contains the IPC codes of B60P and B61, which are technical field of vehicles suitable for freight transportation and the technical field concerning railway vehicles, so it is defined as the technical field of rail vehicles suitable for TFTFT systems. E04B, E04H, B60F, B62D, B61F, B61L, B65D, and G06Q were derived via the IPC network as technical fields that need to be investigated in advance for the purpose of developing the 9th patent vacuum. These IPCs consist of the structural and vehicle design suitable for TFTFT system’s flatcars or trains. As a result of applying the keyword network, “control,” “lock,” “load,” and “assemble” were confirmed as the significant technical elements. Transportation vehicles need to be coupled with various means of transportation, rendering locking essential.
The 10th patent vacuum was confirmed by the core IPCs for B65G and B61D. B65G is the technical field of equipment for container freight transportation and storage, and B61D is the technical field of railroad vehicles. Therefore, the 10th patent vacuum can be defined as the technical field of equipment and systems for container freight transfer to rail vehicles. We confirmed that the technical fields that need to be investigated in advance to develop the 10th patent vacuums are B61B, B61L, B63B, B66C, and E01B via the IPC network. Since these IPCs contain technology for railroad machinery and container freight loading/unloading equipment, they should be investigated and analyzed for technological development concerning efficient container freight transportation. Furthermore, as a result of applying the keyword network, “frame,” “vibrat,” and “signal” were confirmed as the significant technical elements. Container freight includes not only general but also liquid/gaseous special freight, so this must be taken into consideration. Unlike general freight, special freight requires a different container structure, which means it is necessary to pay attention to minute vibrations during transportation. This study found two technical fields for developing a vacant technology for the piggyback flatcar transportation system and derived the IPC fields and significant technologies that need to be investigated in advance for their development. The results of this study can be used as supporting materials in planning a piggyback flatcar transportation system technology development strategy.
The results of the 9th patent vacuum, consisting of B60P and B61D, are interpreted as the technology of flatcars for truck-rail intermodal transport. It can be confirmed through patent documents that the technological development of transportation vehicles is being researched in various fields, such as the development of freight transportation vehicles for trucks, railroads, and locking devices for attaching/detaching container freights. The advancement of transportation vehicles can be a technological opportunity to make intermodal transportation easier. We can interpret through the IPC network analysis that the eight subclasses related to the 9th patent vacuum have the potential to influence and develop into new technologies. E04H, E04B, B65D, B60F, B61F, B61L, and B62D are technical fields related to railcar structures, rolling stock, and rails. They reflect that vehicle/lane structures and rail systems need to be considered in developing vehicle technology for easy freight transportation. Furthermore, in the related subclass G06Q, techniques for processing supervisory and predictive data are included. These types of data enable efficient intermodal transportation using various sensors to process traffic data generated in real time. Through the keyword network vacant technology analysis, we have determined that technologies related to locking, loading, and control are important. Therefore, in order to develop a future market for the TFTFT system, it will be necessary to develop a locking technology that considers the structure of vehicles, railroads, and freight for easy and safe freight transportation. In addition, it can be expected to be advantageous to develop lock-related sensors to build processes that allow for safer intermodal transportation.
The 10th patent vacuum consists of B65G and B61D, which are interpreted as the development of freight and vehicle construction technology for intermodal transportation. The patent documents confirm that structural technologies such as vehicle support structures and height adjustments to support trailers during loading/unloading have been developed. The advances of structural technology in freights, vehicles and other facilities can be a technological opportunity to support safe intermodal transport. Our analysis showed that five subclasses affect the IPC network based on the 10th patent vacuum. B61B and B61L in the 10th patent vacuum are technical elements that should be considered in the design of the container freights, transport vehicles. B63B, B66C, and E01B are technical fields related to ships and cranes; the structural design of container freights and vehicles are considered for freight unloading/loading during intermodal transportation between ships and railways. In addition, structure, vibration, and signal were found as technical elements through keyword network analysis. Cranes are used for loading and unloading freight in intermodal transportation between railroads and ships; therefore, this vacant technology is related to container freight structural design and systems and can be expected to be advantageous for minimizing damaged cargo during the use of cranes.

5. Discussion and Conclusions

This article presents a new approach for developing a GTM-based patent map to identify vacant technology fields and to design technology development strategies for promising vacant technology fields. Compared to other studies, this study has the advantage of objectively analyzing a future promising technology. Furthermore, networks designed on aspects of macro and micro can be utilized for technological development.
The underlying concept is to identify vacant technology fields from a patent map and to then analyze any patent vacuums. The vacant technology fields are defined as undeveloped fields that are expected to be developable in the future. GTM-based patents through GTM′s inverse mapping algorithm to analyze the vacant technology fields through reliable and objective information extraction to automatically generate a patent vacuum′s core IPC. This is an important point on the GTM-based patent map. However, a vacant technology field may not have been developed for a variety of reasons, such as technical barriers or lost technology. Above all, the focus of this research is not limited to the development of patent maps but extends to confirming the potential of vacant technology fields. This study applies technical analysis to discover potential new technology opportunities and to explore those possibilities. Such a process is quantitative and objective because it measures the current technology level as a TAI and TII index, evaluates the current state of technology development, and applies time series analysis to reflect future trends. It can thus be used as the basis for objectively defining promising technical fields, i.e., these methods can be good sources of information for initiating new business creation.
Finally, based on the above findings, we believe that the development of technologies related to freight transportation, transportation between ships and railways, and the maintenance of such technologies and vehicles will continue. Many companies and R&D organizations involved in technology need insights related to technology development and guidelines for those involved to make decisions for practical R&D strategies. This study provides the results of this study to provide guidelines for R&D stakeholders. We apply a network analysis to derive technology development strategies in the vacant technology field. To develop technology, it is necessary to investigate and analyze the technology in various aspects. This research analyzes macro and micro aspects and provides important insights into technological development. On the macroscopic side, from an IPC perspective, we identify the technology field that needs to be investigated/analyzed to design and develop networks. In addition, from the perspective of keywords that are important on the micro side, we design networks and analyze detailed technical relationships. We understand the significant technology keywords and confirm the technology elements that should be included in technology development. From various perspectives, network analysis can identify opportunities for new technologies, quantitatively analyze results, and establish technology development strategies. Therefore, this study provides important insights for researchers and developers in exploring technological opportunities. It can also be used as a sufficient basis for decision or policy makers to plan new content for technology development, and technology fusion can develop new technologies.
Despite the advantages of this research, some limitations are in identifying vacant technologies. As aforementioned, IPC code can be employed to objectively extract significant results. However, an IPC can classify some broad technical fields that correspond to macro level. Based on these limitations, this study needs to be improved in the future. It is possible to analyze at a detailed level than the subclass through the classification system because it can be appropriate to identify more detailed and informative contents.

Author Contributions

S.J. performed data curation, formal analysis, investigation, methodology, validation, and writing of the original manuscript; S.H.H. contributed to conceptualization, funding acquisition, investigation, and project administration; J.H., J.Y. and S.K. all contributed to data curation, methodology and formal analysis; and C.L. contributed to conceptualization, investigation, supervision, and editing of the manuscript. All authors have read and agreed to the published version of the manuscript.

Funding

This research was supported by the “Study on the Core Technique of the Piggyback Flatcar Carrying of Road Transport” of the Ministry of Land, Infrastructure and Transport (20CTAP-C152178-02).

Institutional Review Board Statement

Not applicable.

Informed Consent Statement

Not applicable.

Data Availability Statement

No new data were created or analyzed in this study. Data sharing is not applicable to this article.

Acknowledgments

This research was supported by the “Study on the Core Technique of the Piggyback Flatcar Carrying of Road Transport” of the Ministry of Land, Infrastructure and Transport (20CTAP-C152178-02).

Conflicts of Interest

The authors declare no conflict of interest.

References

  1. Dekker, R.; Bloemhof, J.; Mallidis, I. Operations Research for green logistics—An overview of aspects, issues, contributions and challenges. Eur. J. Oper. Res. 2012, 219, 671–679. [Google Scholar] [CrossRef] [Green Version]
  2. Axsen, J.; Plötz, P.; Wolinetz, M. Crafting strong, integrated policy mixes for deep CO2 mitigation in road transport. Nat. Clim. Chang. 2020, 10, 809–818. [Google Scholar] [CrossRef]
  3. Seo, J.; Park, J.; Oh, Y.; Park, S. Estimation of total transport CO2 emissions generated by medium-and heavy-duty vehicles (MHDVs) in a sector of Korea. Energies 2016, 9, 638. [Google Scholar] [CrossRef] [Green Version]
  4. Hrušovský, M.; Demir, E.; Jammernegg, W.; van Woensel, T. Hybrid simulation and optimization approach for green intermodal transportation problem with travel time uncertainty. Flex. Serv. Manuf. J. 2018, 30, 486–516. [Google Scholar]
  5. Hammond, W.; Axsen, J.; Kjeang, E. How to slash greenhouse gas emissions in the freight sector: Policy insights from a technology-adoption model of Canada. Energy Policy 2020, 137, 111093. [Google Scholar] [CrossRef]
  6. Ng, M.; Talley, W.K. Rail intermodal management at marine container terminals: Loading double stack trains. Transp. Res. Part. C Emerg. Technol. 2020, 112, 252–259. [Google Scholar] [CrossRef]
  7. Crainic, T.G.; Perboli, G.; Rosano, M. Simulation of intermodal freight transportation systems: A taxonomy. Eur. J. Oper. Res. 2018, 270, 401–418. [Google Scholar] [CrossRef]
  8. Heinold, A.; Meisel, F. Emission rates of intermodal rail/road and road-only transportation in Europe: A comprehensive simulation study. Transp. Res. Part. D Transp. Environ. 2018, 65, 421–437. [Google Scholar] [CrossRef]
  9. De Miranda Pinto, J.T.; Mistage, O.; Bilotta, P.; Helmers, E. Road-rail intermodal freight transport as a strategy for climate change mitigation. Environ. Dev. 2018, 25, 100–110. [Google Scholar] [CrossRef]
  10. Chen, H. Combinatorial clock-proxy exchange for carrier collaboration in less than truck load transportation. Transp. Res. Part E Logist. Transp. Rev. 2016, 91, 152–172. [Google Scholar] [CrossRef]
  11. Wang, X.; Kopfer, H. Collaborative transportation planning of less-than-truckload freight. OR Spectr. 2014, 36, 357–380. [Google Scholar] [CrossRef]
  12. Dai, B.; Chen, H.; Yang, G. Price-setting based combinatorial auction approach for carrier collaboration with pickup and delivery requests. Oper. Res. 2014, 14, 361–386. [Google Scholar] [CrossRef]
  13. Rakshit, S.M.; Hempel, M.; Sharif, H.; Punwani, J.; Stewart, M.; Mehrvarzi, S. Challenges in current wireless sensor technology for railcar status monitoring for North America’s freight railroad industry. In Proceedings of the ASME/IEEE Joint Rail Conference, Philadelphia, PA, USA, 17–19 April 2012; pp. 397–450. [Google Scholar]
  14. Balog, M.; Mindas, M. Informatization of rail freight wagon by implementation of the RFID technology. Smart City 360%C2B0 2016, 166, 592–597. [Google Scholar]
  15. Caviggioli, F. Technology fusion: Identification and analysis of the drivers of technology convergence using patent data. Technovation 2016, 55, 22–32. [Google Scholar] [CrossRef]
  16. Park, Y.; Yoon, B.; Lee, S. The idiosyncrasy and dynamism of technological innovation across industries: Patent citation analysis. Technol. Soc. 2005, 27, 471–485. [Google Scholar] [CrossRef]
  17. World Intellectual Property Organization. International Patent Classification (IPC). Available online: https://www.wipo.int/classifications/ipc/en/ (accessed on 20 August 2020).
  18. Leydesdorff, L.; Kushnir, D.; Rafols, I. Interactive overlay maps for US patent (USPTO) data based on International Patent Classification (IPC). Scientometrics 2014, 98, 1583–1599. [Google Scholar] [CrossRef] [Green Version]
  19. Wenfeng, Z.; Xin, F.; Hongmei, Y. Research on Technology Opportunity Identification of Small and Medium-sized Vaccine Enterprises Based on Patent Analysis. Asian J. Soc. Pharm. 2020, 15, 97–107. [Google Scholar]
  20. Evangelista, A.; Ardito, L.; Boccaccio, A.; Fiorentino, M.; Petruzzelli, A.M.; Uva, A.E. Unveiling the technological trends of augmented reality: A patent analysis. Comput. Ind. 2020, 118, 103221. [Google Scholar] [CrossRef]
  21. Chang, S.H. Patent Analysis of the Critical Technology Network of Semiconductor Optical Amplifiers. Appl. Sci. 2020, 10, 1552. [Google Scholar] [CrossRef] [Green Version]
  22. Kim, C.; Lee, H.; Seol, H.; Lee, C. Identifying core technologies based on technological cross-impacts: An association rule mining (ARM) and analytic network process (ANP) approach. Expert Syst. Appl. 2011, 38, 12559–12564. [Google Scholar] [CrossRef]
  23. Yoon, J.; Park, H.; Seo, W.; Lee, J.M.; Coh, B.Y.; Kim, J. Technology opportunity discovery (TOD) from existing technologies and products: A function-based TOD framework. Technol. Forecast. Soc. Chang. 2015, 100, 153–167. [Google Scholar] [CrossRef]
  24. Ernst, H. The use of patent data for technological forecasting: The diffusion of CNC-technology in the machine tool industry. Small Bus. Econ. 1997, 9, 361–381. [Google Scholar] [CrossRef]
  25. Ashton, W.B.; Sen, R.K. Using patent information in technology business planning—II. Res. Technol. Manag. 1989, 32, 36–42. [Google Scholar] [CrossRef]
  26. Chen, R. Design patent map visualization display. Expert Syst. Appl. 2009, 36, 12362–12374. [Google Scholar] [CrossRef]
  27. Liu, S.J. Patent map—A route to a strategic intelligence of industrial competitiveness. In Proceedings of the First Asia-Pacific Conference on Patent Maps, Taipei, Taiwan, 29 October 2003; pp. 2–13. [Google Scholar]
  28. Kostoff, R.N.; Schaller, R.R. Science and technology roadmaps. IEEE Trans. Eng. Manag. 2001, 48, 132–143. [Google Scholar] [CrossRef] [Green Version]
  29. Lee, S.; Yoon, B.; Park, Y. An approach to discovering new technology opportunities: Keyword-based patent map approach. Technovation 2009, 29, 481–497. [Google Scholar] [CrossRef]
  30. Tseng, Y.H.; Lin, C.J.; Lin, Y.I. Text mining techniques for patent analysis. Inf. Process. Manag. 2007, 43, 1216–1247. [Google Scholar] [CrossRef]
  31. Johnson, R.A.; Wichern, D.W. Applied Multivariate Statistical Analysis, 6th ed.; Prentice Hall: Upper Saddle River, NJ, USA, 1988. [Google Scholar]
  32. Deboeck, G.; Kohonen, T. Visual Explorations in Finance: With Self-Organizing Maps; Springer: London, UK, 1998; pp. 246–267. [Google Scholar]
  33. Yoon, B.U.; Yoon, C.B.; Park, Y.T. On the development and application of a self–organizing feature map–based patent map. RD Manag. 2002, 32, 291–300. [Google Scholar] [CrossRef]
  34. Juntunen, P.; Liukkonen, M.; Lehtola, M.; Hiltunen, Y. Cluster analysis by self-organizing maps: An application to the modelling of water quality in a treatment process. Appl. Soft Comput. 2013, 13, 3191–3196. [Google Scholar] [CrossRef]
  35. Bishop, C.M.; Svensén, M.; Williams, C.K. GTM: The generative topographic mapping. Neural Comput. 1998, 10, 215–234. [Google Scholar] [CrossRef]
  36. Yu, J.; Hwang, J.G.; Hwang, J.; Jun, S.C.; Kang, S.; Lee, C.; Kim, H. Identification of Vacant and Emerging Technologies in Smart Mobility through the GTM-Based Patent Map Development. Sustainability 2020, 12, 9310. [Google Scholar] [CrossRef]
  37. Son, C.; Suh, Y.; Jeon, J.; Park, Y. Development of a GTM-based patent map for identifying patent vacuums. Expert Syst. Appl. 2012, 39, 2489–2500. [Google Scholar] [CrossRef]
  38. Kay, L.; Newman, N.; Youtie, J.; Porter, A.L.; Rafols, I. Patent overlay mapping: Visualizing technological distance. J. Assoc. Inf. Sci. Technol. 2014, 65, 2432–2443. [Google Scholar] [CrossRef] [Green Version]
  39. Strogatz, S.H. Exploring complex networks. Nature 2001, 410, 268–276. [Google Scholar] [CrossRef] [PubMed] [Green Version]
  40. Freeman, L.C. Visualizing social networks. J. Soc. Struct. 2000, 1, 4. [Google Scholar]
  41. Scott, J. Social network analysis. Sociology 1988, 22, 109–127. [Google Scholar] [CrossRef]
  42. Hung, S.W.; Wang, A.P. Examining the small world phenomenon in the patent citation network: A case study of the radio frequency identification (RFID) network. Scientometrics 2010, 82, 121–134. [Google Scholar] [CrossRef]
  43. Lee, H.; Kim, C.; Cho, H.; Park, Y. An ANP-based technology network for identification of core technologies: A case of telecommunication technologies. Expert Syst. Appl. 2009, 36, 894–908. [Google Scholar] [CrossRef]
  44. Yoon, B.; Park, Y. A text-mining-based patent network: Analytical tool for high-technology trend. J. High Technol. Manag. Res. 2004, 15, 37–50. [Google Scholar] [CrossRef]
  45. Reymond, D.; Quoniam, L. Patent documents in STEM and PhD education: Open-source tools and some examples to open discussion. In Proceedings of the 2018 IEEE Global Engineering Education Conference (EDUCON), Canary Islands, Spain, 17–20 April 2018; pp. 4–9. [Google Scholar]
  46. Reymond, D.; Quoniam, L. A new patent processing suite for academic and research purposes. World Pat. Inf. 2016, 47, 40–50. [Google Scholar] [CrossRef]
  47. Choi, J.; Hwang, Y.S. Patent keyword network analysis for improving technology development efficiency. Technol. Forecast. Soc. Chang. 2014, 83, 170–182. [Google Scholar] [CrossRef]
  48. Breschi, S.; Lissoni, F. Knowledge networks from patent data. In Handbook of Quantitative Science and Technology Research: The Use of Publication and Patent Statistics in Studies of S&T Systems; Moed, H., Glänzel, W., Schmoch, U., Eds.; Springer: Dordrecht, The Netherlands, 2004; pp. 613–643. [Google Scholar]
  49. Lai, K.K.; Wu, S.J. Using the patent co-citation approach to establish a new patent classification system. Inf. Process. Manag. 2005, 41, 313–330. [Google Scholar] [CrossRef]
  50. Yoon, B.; Park, Y. Development of new technology forecasting algorithm: Hybrid approach for morphology analysis and conjoint analysis of patent information. IEEE Trans. Eng. Manag. 2007, 54, 588–599. [Google Scholar] [CrossRef]
  51. Kim, J.; Lee, S. Patent databases for innovation studies: A comparative analysis of USPTO, EPO, JPO and KIPO. Technol. Forecast. Soc. Chang. 2015, 92, 332–345. [Google Scholar] [CrossRef]
  52. Singh, T.; Kumari, M. Role of text pre-processing in twitter sentiment analysis. Procedia Comput. Sci. 2016, 89, 549–554. [Google Scholar] [CrossRef] [Green Version]
  53. Haddi, E.; Liu, X.; Shi, Y. The role of text pre-processing in sentiment analysis. Procedia Comput. Sci. 2013, 17, 26–32. [Google Scholar] [CrossRef] [Green Version]
  54. Hassler, M.; Fliedl, G. Text preparation through extended tokenization. WIT Trans. Inf. Commun. Technol. 2006, 37, 13–21. [Google Scholar]
  55. Callon, M.; Courtial, J.P.; Laville, F. Co-word analysis as a tool for describing the network of interactions between basic and technological research: The case of polymer chemsitry. Scientometrics 1991, 22, 155–205. [Google Scholar] [CrossRef]
  56. Kim, K.H.; Han, Y.J.; Lee, S.; Cho, S.W.; Lee, C. Text mining for patent analysis to forecast emerging technologies in wireless power transfer. Sustainability 2019, 11, 6240. [Google Scholar] [CrossRef] [Green Version]
  57. Ardito, L.; D’Adda, D.; Petruzzelli, A.M. Mapping innovation dynamics in the Internet of Things domain: Evidence from patent analysis. Technol. Forecast. Soc. Chang. 2018, 136, 317–330. [Google Scholar] [CrossRef]
  58. Fall, C.J.; Törcsvári, A.; Fiévet, P.; Karetka, G. Automated categorization of German-language patent documents. Expert Syst. Appl. 2004, 26, 269–277. [Google Scholar] [CrossRef]
  59. Yoon, B.; Park, I.; Yun, D.; Park, G. Exploring promising vacant technology areas in a technology-oriented company based on bibliometric analysis and visualisation. Technol. Anal. Strat. Manag. 2009, 31, 388–405. [Google Scholar] [CrossRef]
  60. Lee, S.; Lee, S.; Seol, H.; Park, Y. Using patent information for designing new product and technology: Keyword based technology roadmapping. RD Manag. 2008, 38, 169–188. [Google Scholar] [CrossRef]
  61. Yoon, B.; Phaal, R. Structuring technological information for technology roadmapping: Data mining approach. Technol. Anal. Strateg. Manag. 2013, 25, 1119–1137. [Google Scholar] [CrossRef] [Green Version]
  62. Joung, J.; Kim, K. Monitoring emerging technologies for technology planning using technical keyword based analysis from patent data. Technol. Forecast. Soc. Chang. 2017, 114, 281–292. [Google Scholar] [CrossRef]
  63. Kürtössy, J. Innovation indicators derived from patent data. Period. Polytech. Soc. Manag. Sci. 2004, 12, 91–101. [Google Scholar]
  64. Harvey, A.C.; Fernandes, C. Time series models for count or qualitative observations. J. Bus. Econ. Stat. 1989, 7, 407–417. [Google Scholar]
  65. Griffiths, T.L.; Steyvers, M. Finding scientific topics. Proc. Natl. Acad. Sci. USA 2004, 101, 5228–5235. [Google Scholar] [CrossRef] [Green Version]
  66. Daud, A.; Abbas, F.; Amjad, T.; Alshdadi, A.A.; Alowibdi, J.S. Finding rising stars through hot topics detection. Future Gener. Comput. Syst. 2020, 115, 798–813. [Google Scholar] [CrossRef]
  67. Agrawal, R.; Imieliński, T.; Swami, A. Mining association rules between sets of items in large databases. In Proceedings of the 1993 ACM SIGMOD International Conference on Management of Data, Washington, DC, USA, 26–28 May 1993; pp. 207–216. [Google Scholar]
  68. Ampornphan, P.; Tongngam, S. Patent Knowledge Discovery Using Data Analytics. In Proceedings of the 2017 International Conference on Information Technology, Singapore, 27–29 December 2017; pp. 42–46. [Google Scholar]
  69. Cios, K.J.; Pedrycz, W.; Swiniarski, R.W. Data mining and knowledge discovery. Data Min. Methods Knowl. Discov. 1998, 458, 1–26. [Google Scholar]
  70. Tan, M.H.; Lee, W.L. Evaluation and improvement of procurement process with data analytics. Int. J. Adv. Comput. Sci. Appl. 2015, 6, 70. [Google Scholar] [CrossRef] [Green Version]
Figure 1. Overall framework.
Applsci 11 00499 g001
Figure 2. The process of identifying vacant technology fields.
Applsci 11 00499 g002
Figure 3. Technical analysis of a vacant technology field.
Applsci 11 00499 g003
Figure 4. Investigation into emerging and vacant technology fields.
Applsci 11 00499 g004
Figure 5. The generative topographic mapping (GTM)-based patent map.
Applsci 11 00499 g005
Figure 6. Results of the criticality analysis using a technology level map.
Applsci 11 00499 g006
Figure 7. Results of the IPC network analysis: (a) 9th patent vacuum and (b) 10th patent vacuum.
Applsci 11 00499 g007
Figure 8. Results of the keyword network analysis: (a) 9th patent vacuum and (b) 10th patent vacuum.
Applsci 11 00499 g008
Table 1. The format of the international patent classification (IPC) vectors.
B61DB65DB65GB60P G05B
Patent 10100 0
Patent 20010 0
Patent 30010 1
Patent 40010 0
Patent 15361000 0
Table 2. The format of the significant keywords’ vectors.
LoadControlConnectVibrat Gas
Patent 11010 1
Patent 21100 0
Patent 30010 0
Patent 40001 0
Patent 15361100 1
Table 3. Subclass corresponding to the patent vacuum 1.
Patent VacuumIPC
1G06Q, G06F
4B66C, E04H
5B65D, B65G, B66C
8B61D, B60P, B62D
9B61D, B60P
10B61D, B65G
1 The above patent vacuums are the only ones in which patents were found.
Table 4. Results of the trend analysis using a time series analysis.
1st Patent Vacuum4th Patent Vacuum
Applsci 11 00499 i001 Applsci 11 00499 i002
5th Patent Vacuum8th Patent Vacuum
Applsci 11 00499 i003 Applsci 11 00499 i004
9th Patent Vacuum10th Patent Vacuum
Applsci 11 00499 i005 Applsci 11 00499 i006
Table 5. Summary of technical analysis in the vacant technology fields.
Patent VacuumCriticality AnalysisTrend Analysis
1Low levelHot field
4Low levelActive field
5Medium levelActive field
8Medium levelCold field
9High levelHot field
10High levelActive field
Table 6. The association rules for the 9th patent vacuum.
PreviousConsequentSupport (%)Confidence (%)Lift
1B65D,E04BB60P0.10410010.667
2B65D,E04HB60P0.10410010.667
3B65D,E04H,E04BB60P0.10410010.667
4B61F,B61CB61D0.2081006.038
5B60F,B61GB61D0.2081006.038
Table 7. The association rules for the 10th patent vacuum.
PreviousConsequentSupport (%)Confidence (%)Lift
1E01B,B61LB65G0.1041009.600
2B61B,B61LB65G0.1041009.600
3B63B,B61LB65G0.1041009.600
4B66C,B61LB65G0.1041009.600
5B61B,E01BB65G0.1041008.400
Table 8. IPC codes to investigate for patent vacuum development.
Patent VacuumCore IPC CodeAdjacent IPC Code
9th patent vacuumB60P, B61DE04H, B65D, E04B, B62D, B60F, B61F, B61L, G06Q
10th patent vacuumB65G, B61DB61B, E01B, B61L, B63B, B66C
Publisher’s Note: MDPI stays neutral with regard to jurisdictional claims in published maps and institutional affiliations.