Identification of Promising Vacant Technologies for the Development of Truck on Freight Train Transportation Systems


Abstract
:1. Introduction
2. Theoretical Background
2.1. Patent Map
2.2. Patent Network
3. Identifying Promising Vacant Technologies
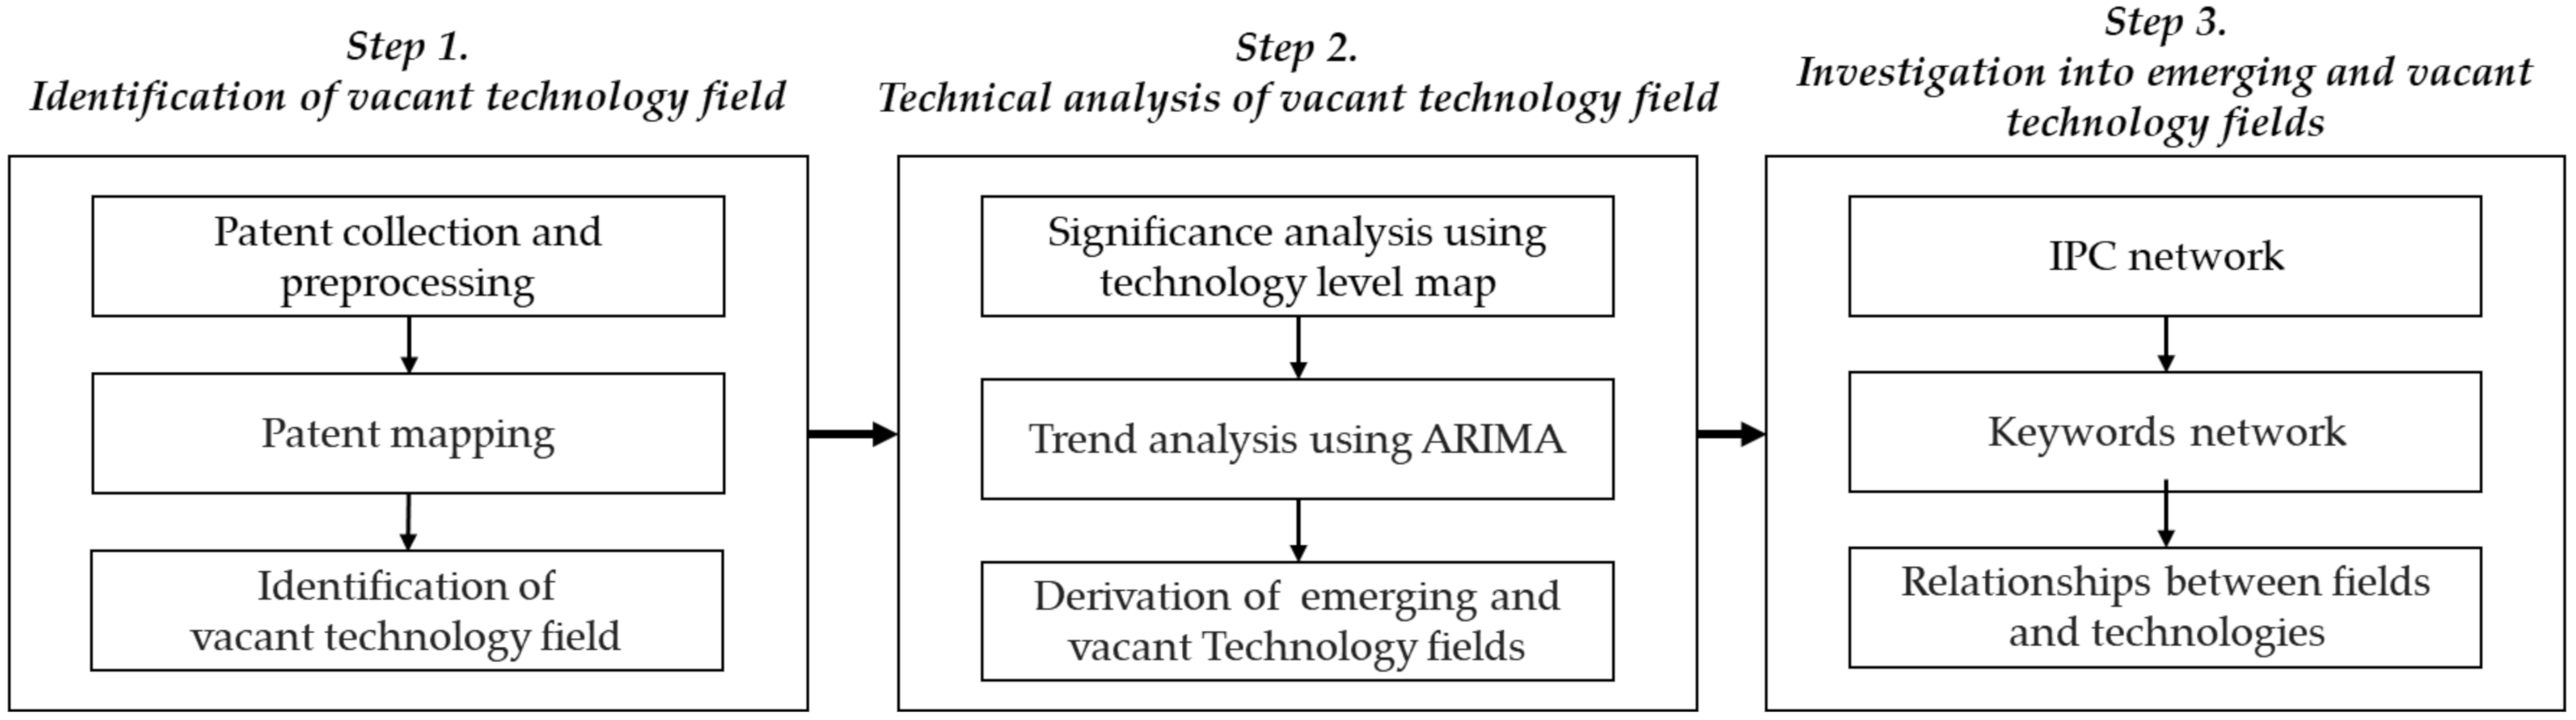
3.1. Overall Research Framework
3.2. Detailed Procedures
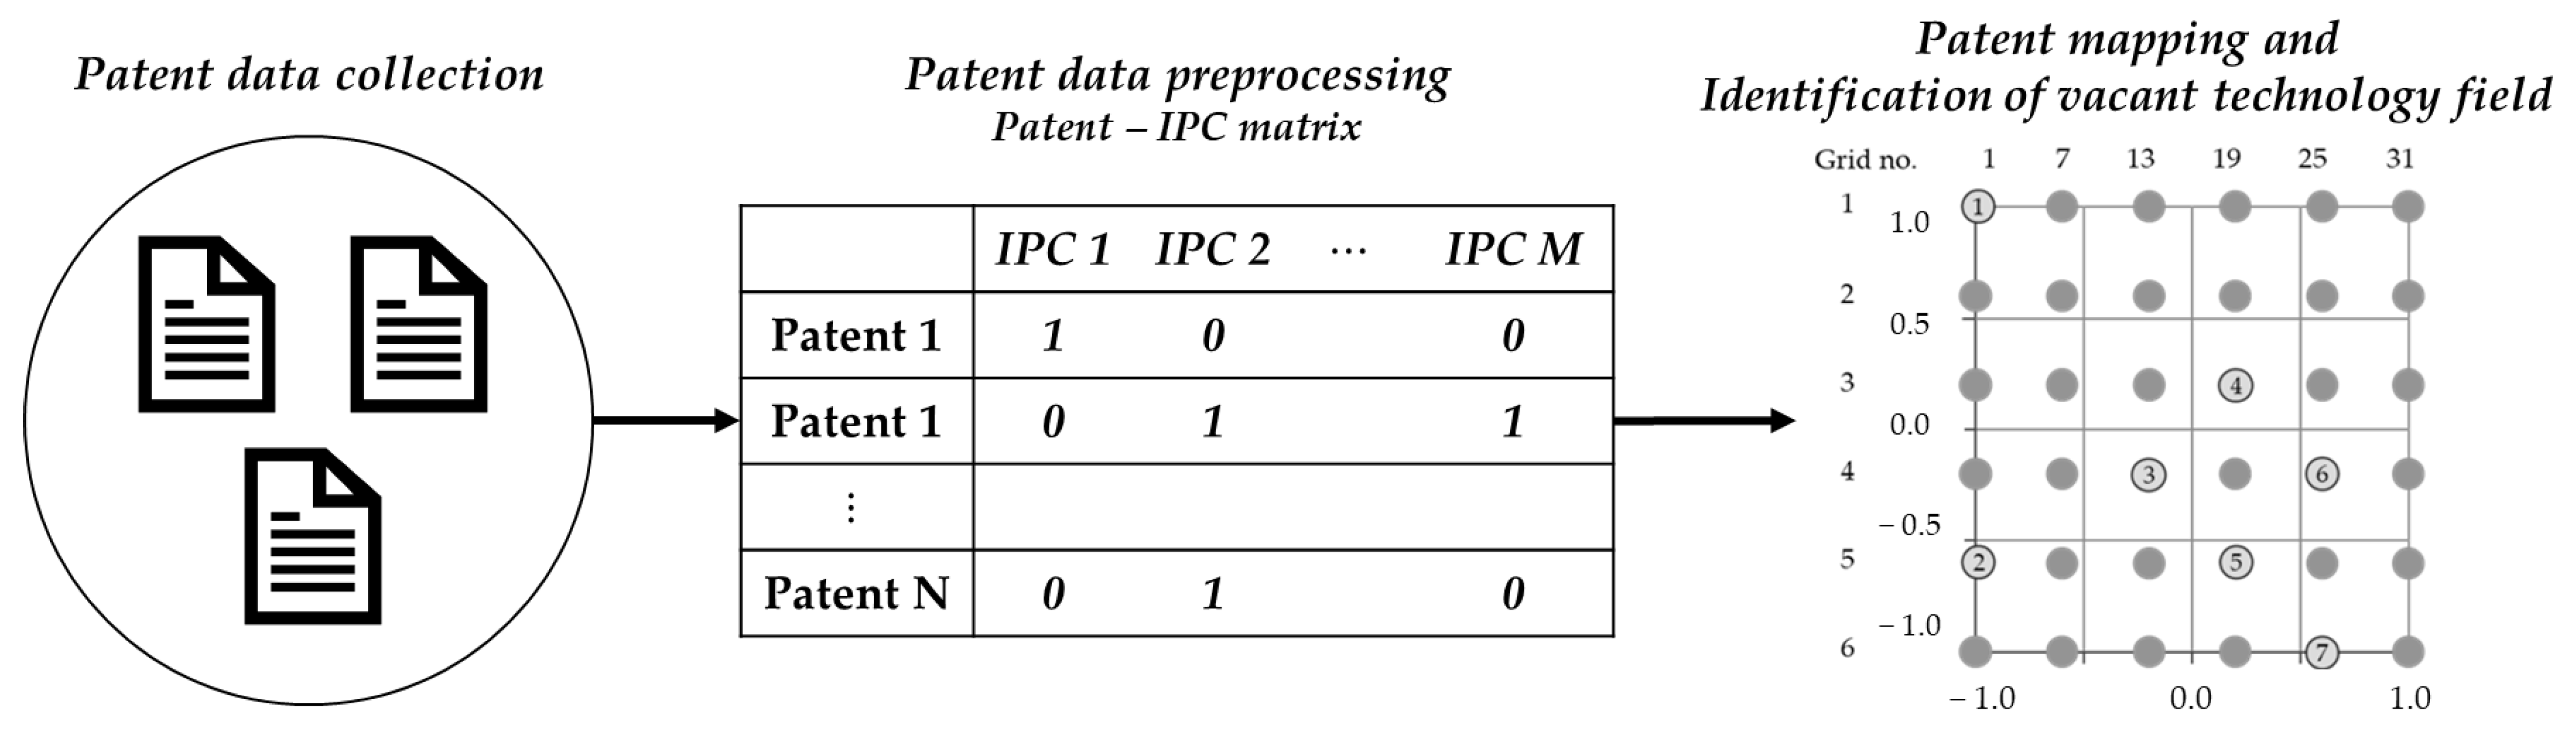
3.2.1. Identification of Vacant Technology Fields Using a GTM-Based Patent Map
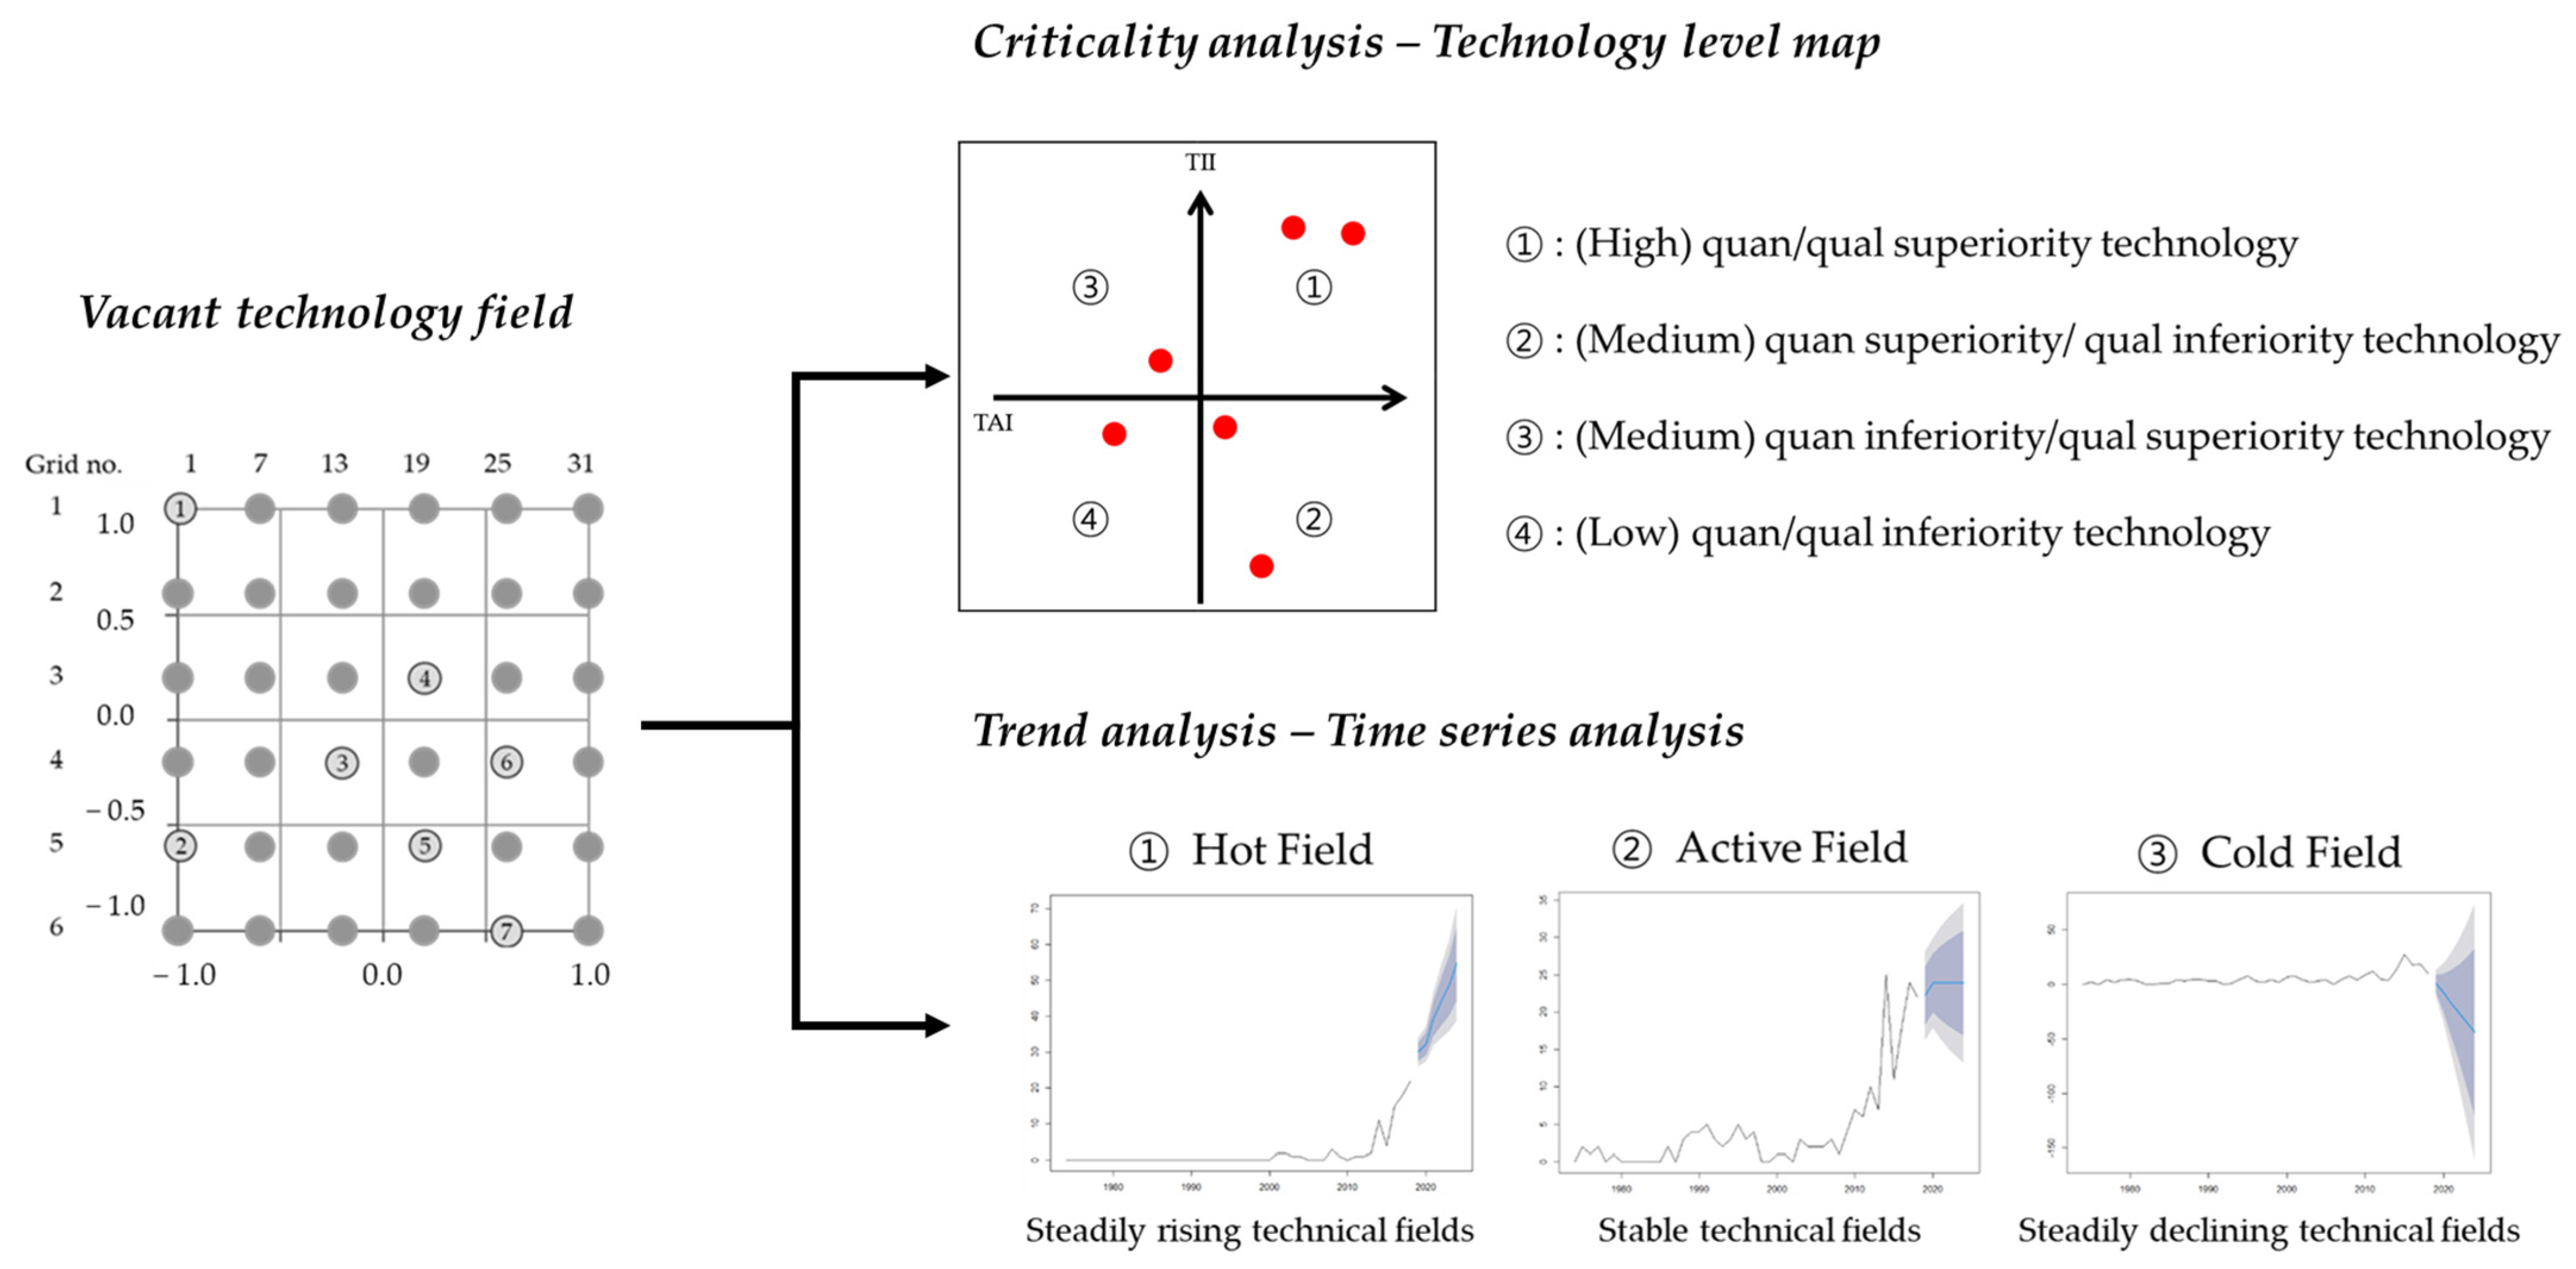
3.2.2. Technical Analysis of Vacant Technology Field through Criticality and Trend Analyses
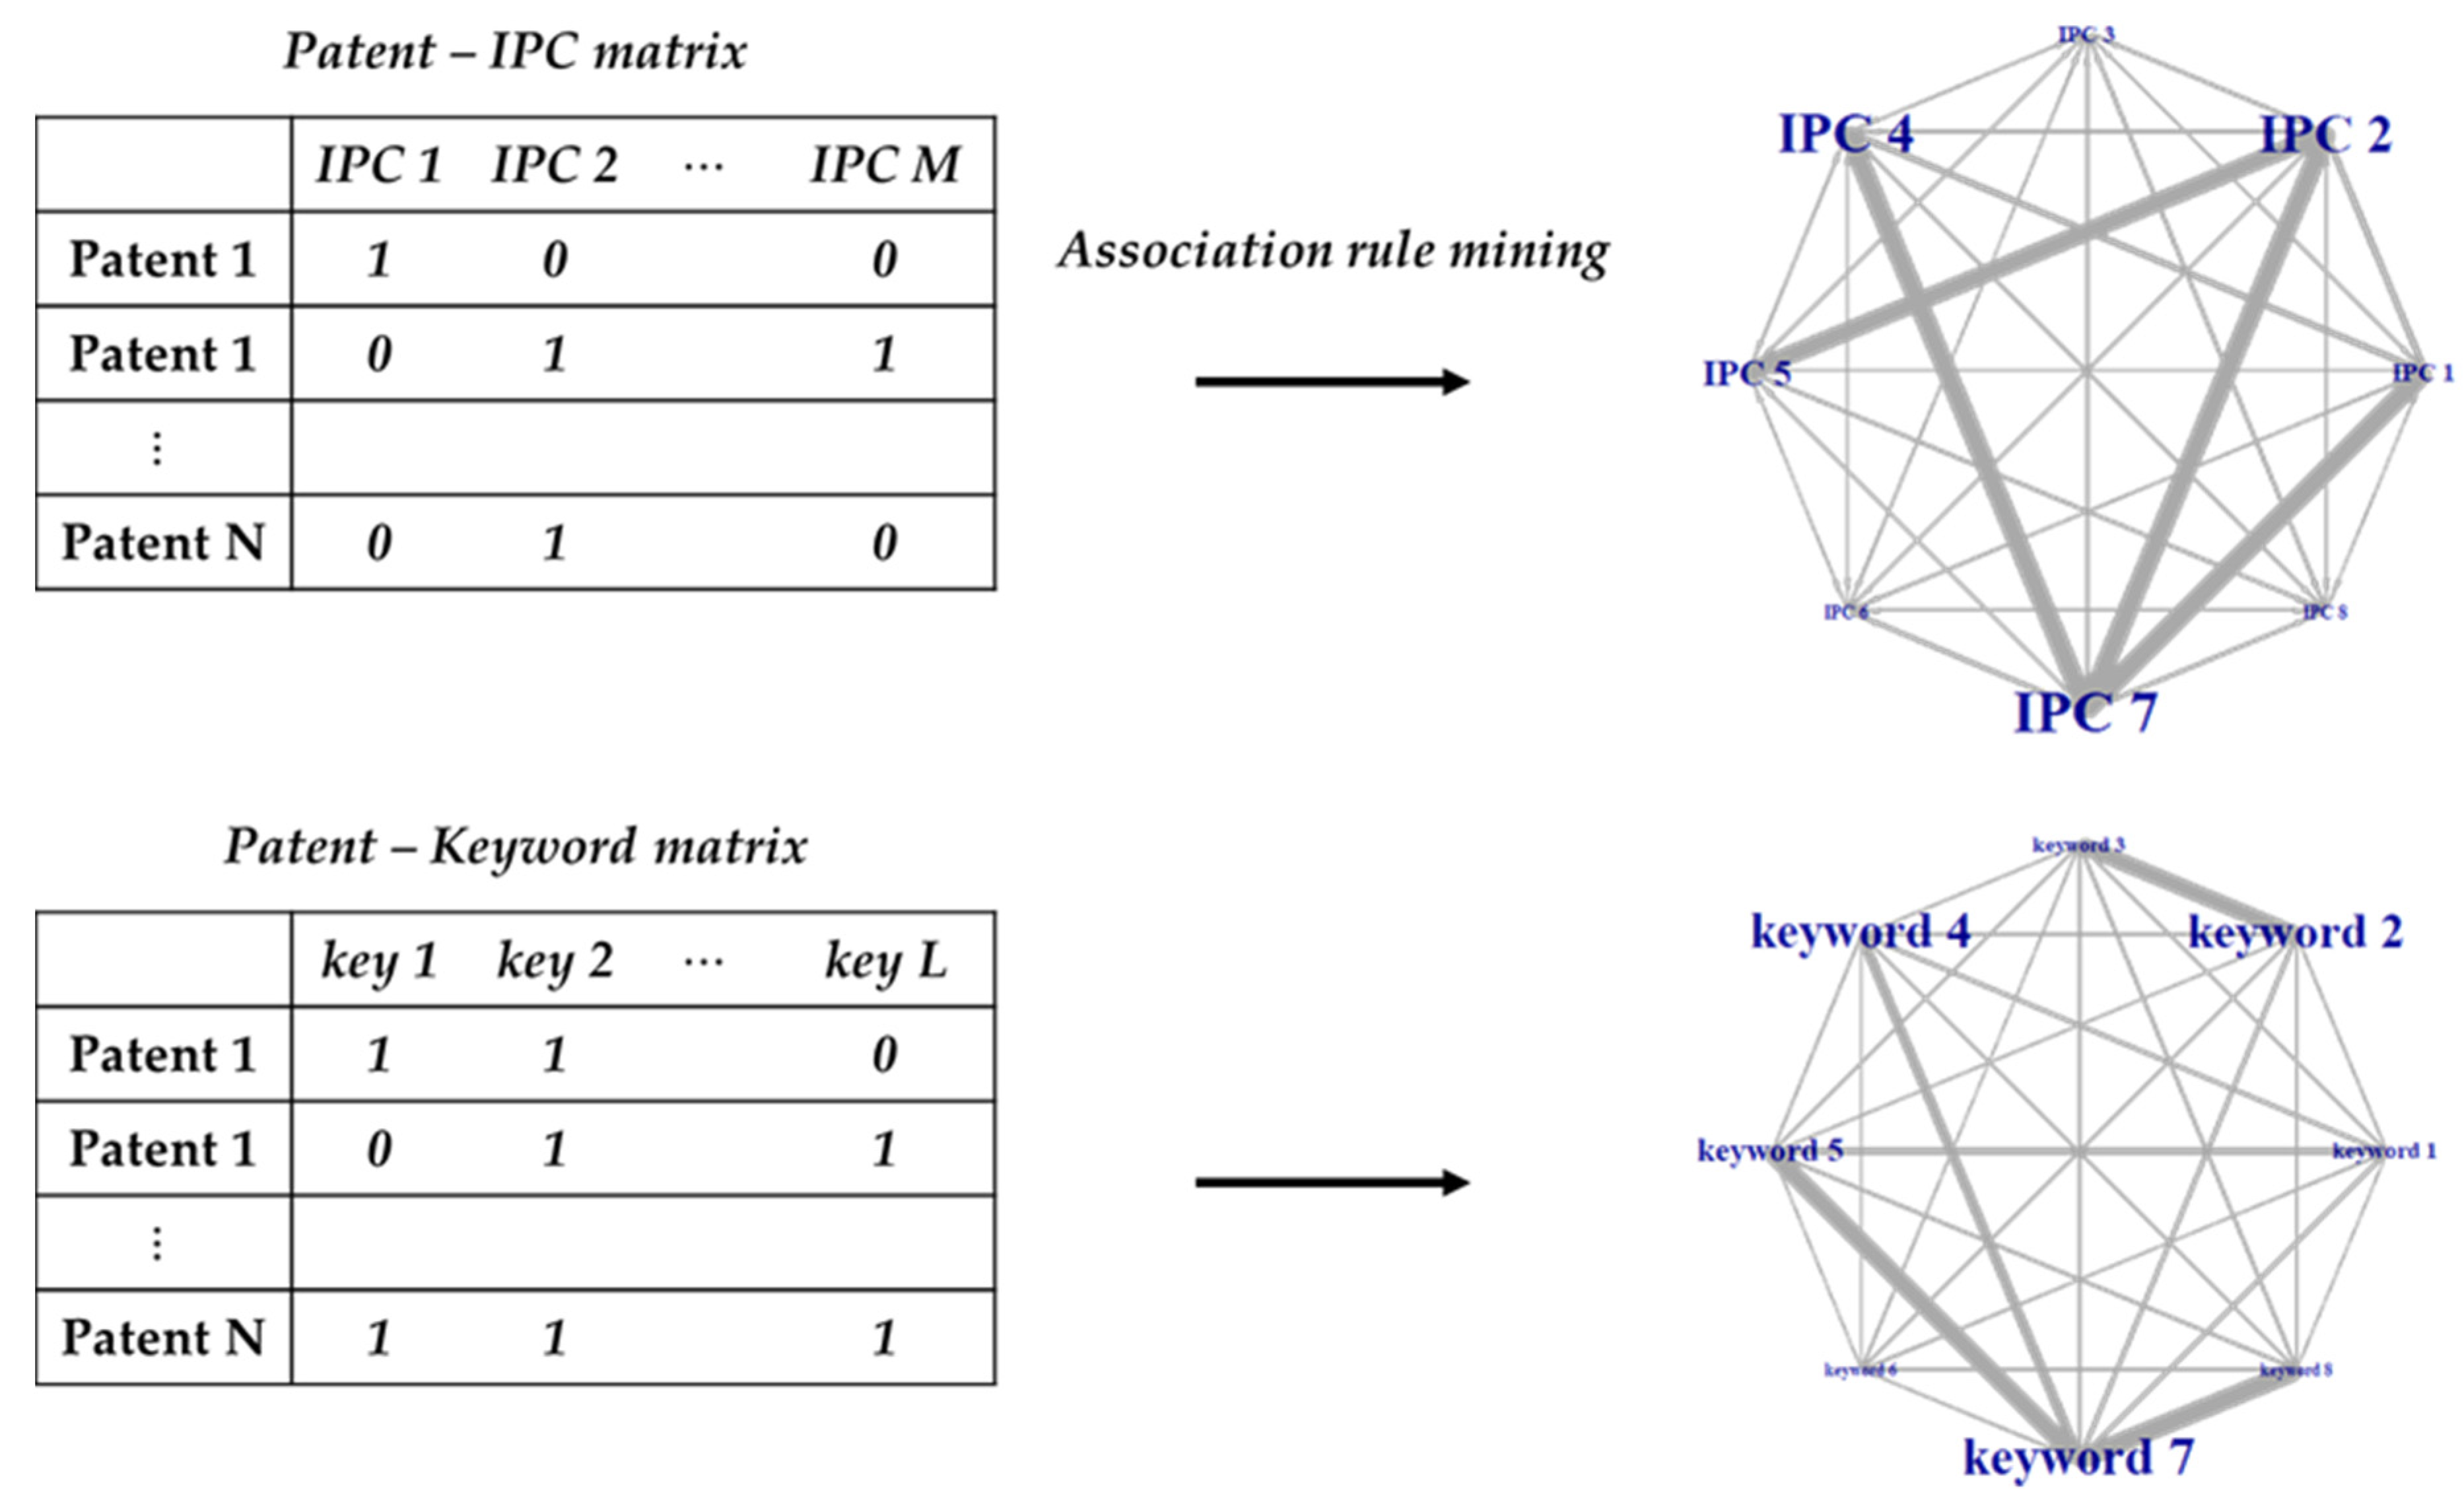
3.2.3. Investigation into Emerging and Vacant Technology Fields Using an ARM-Based Network Analysis
4. Technology Development Strategy of TFTFT Systems
4.1. Patent Map Development and Identification of Vacant Technology Fields
4.1.1. Development of a Patent-IPC Matrix and Patent-Keywords Matrix
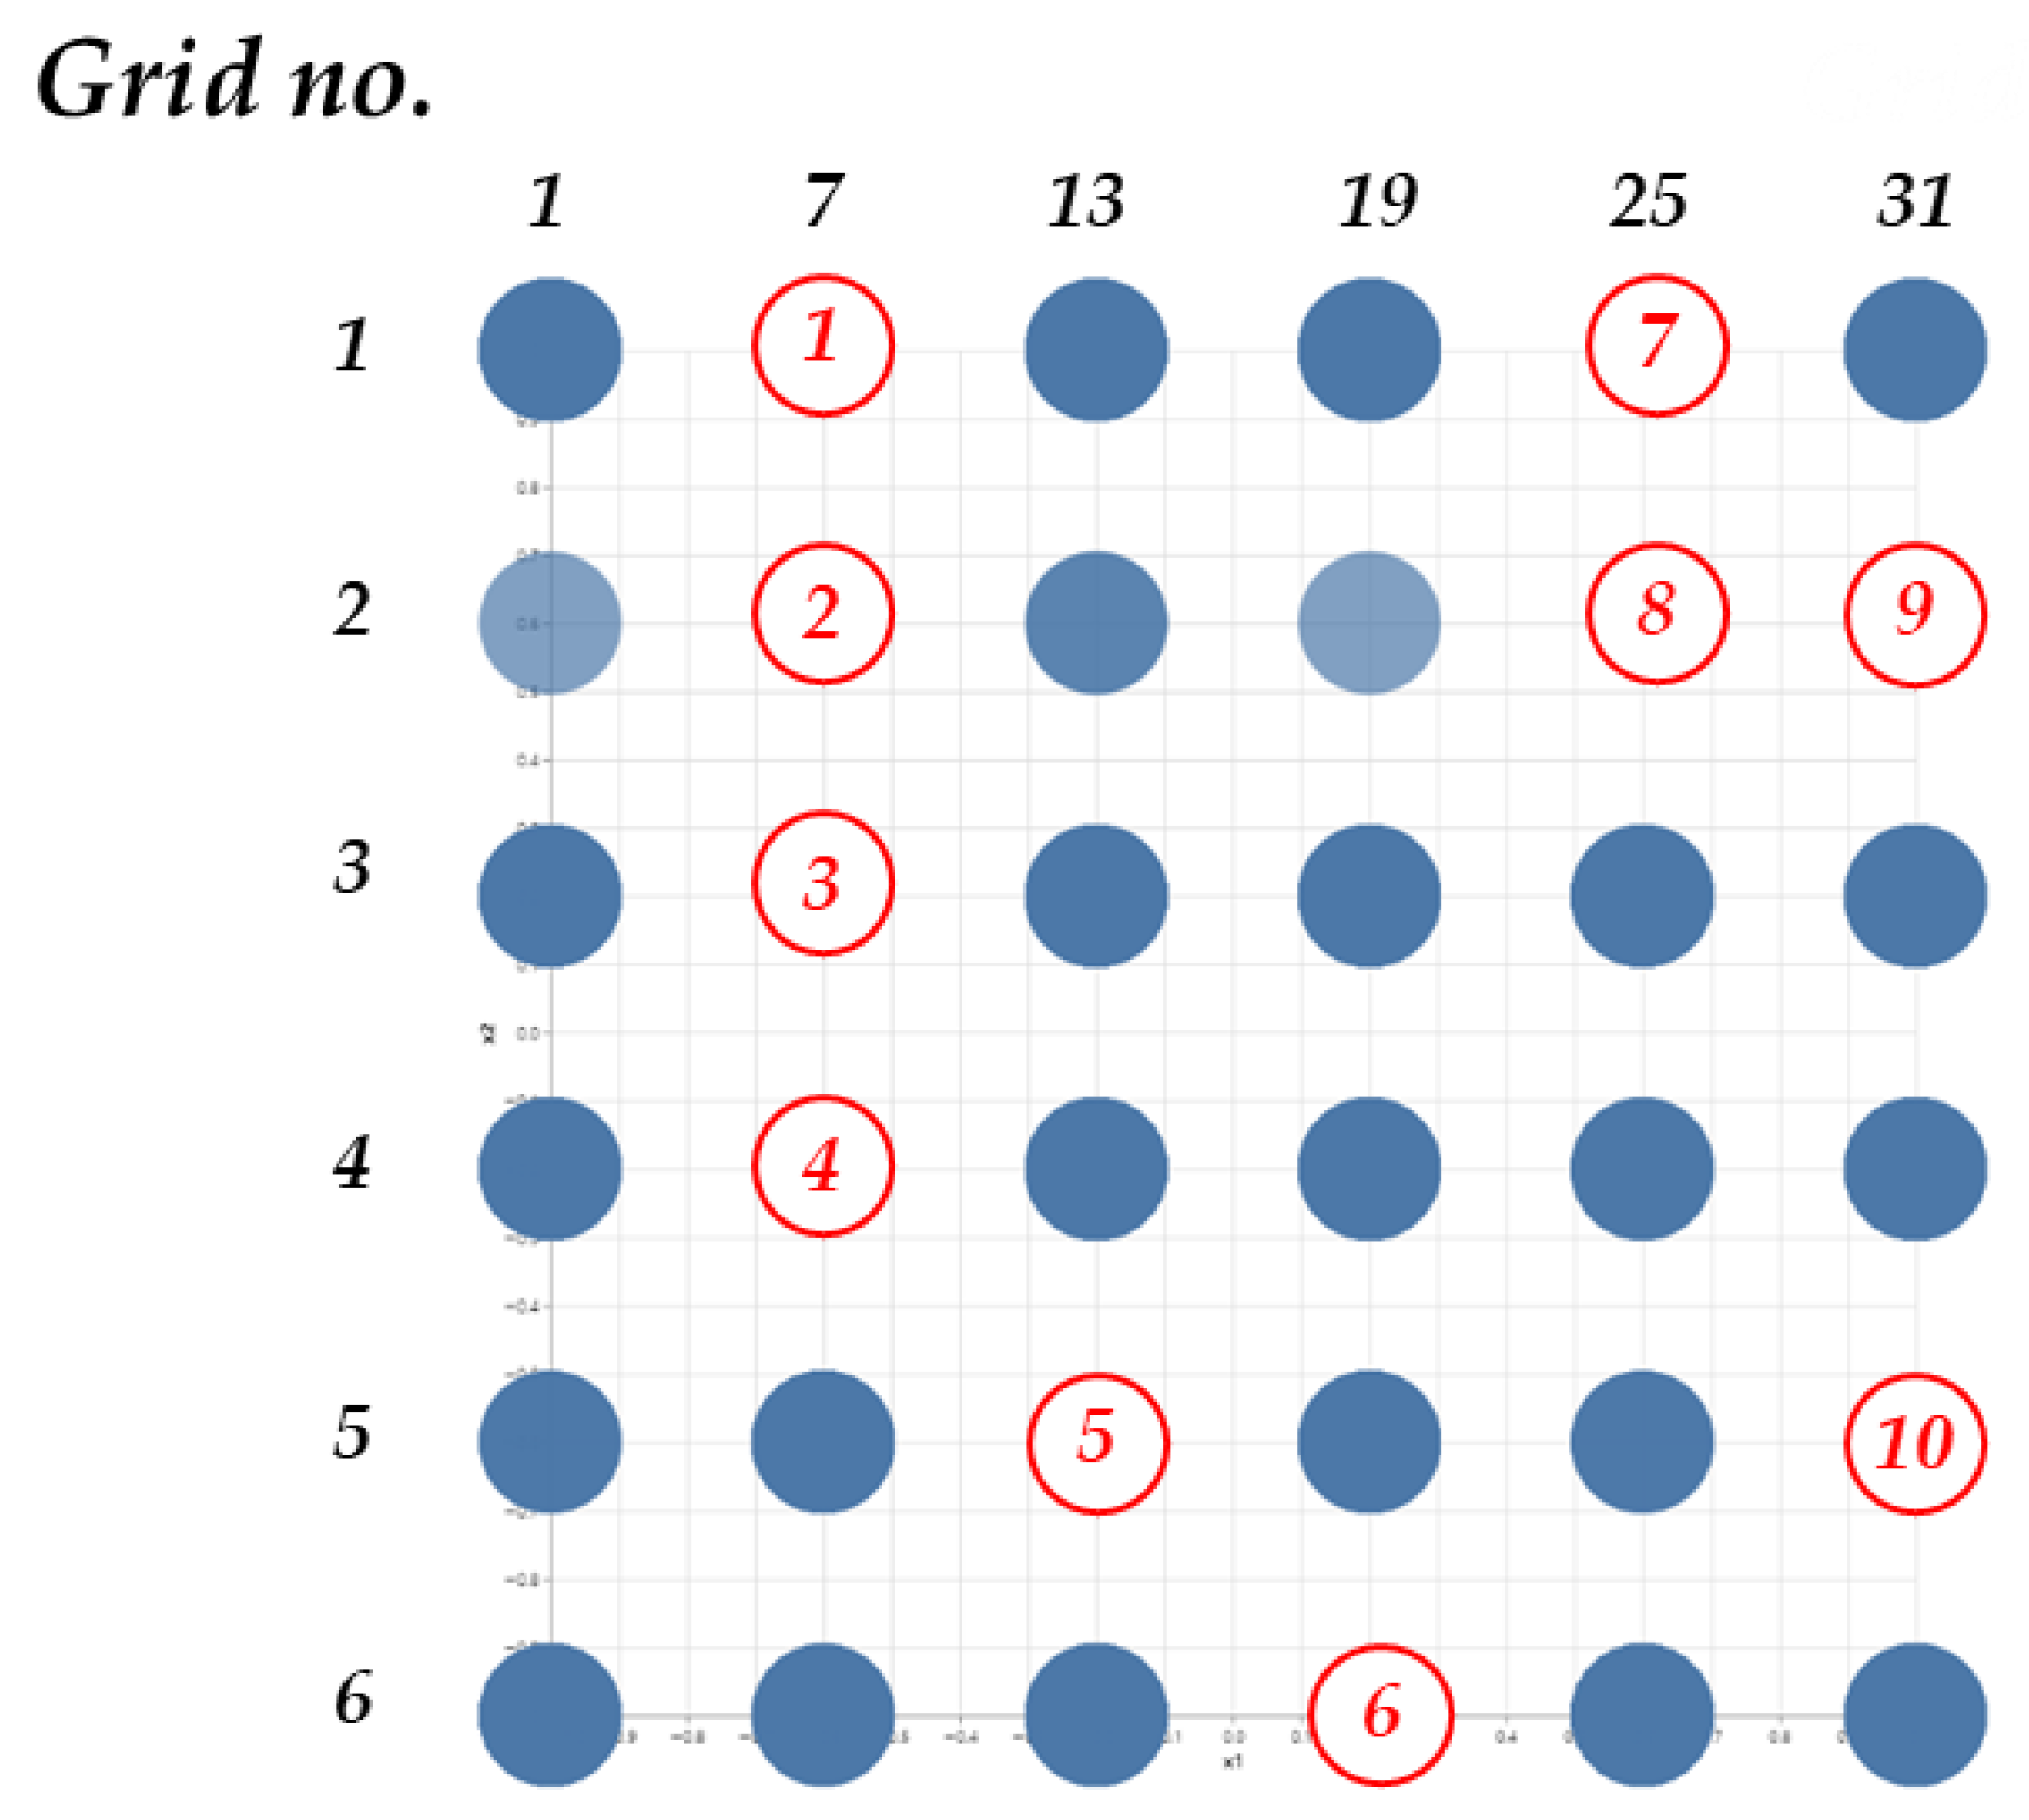
4.1.2. Identification of Vacant Technology Fields
4.2. Technical Analysis of Vacant Technology Field
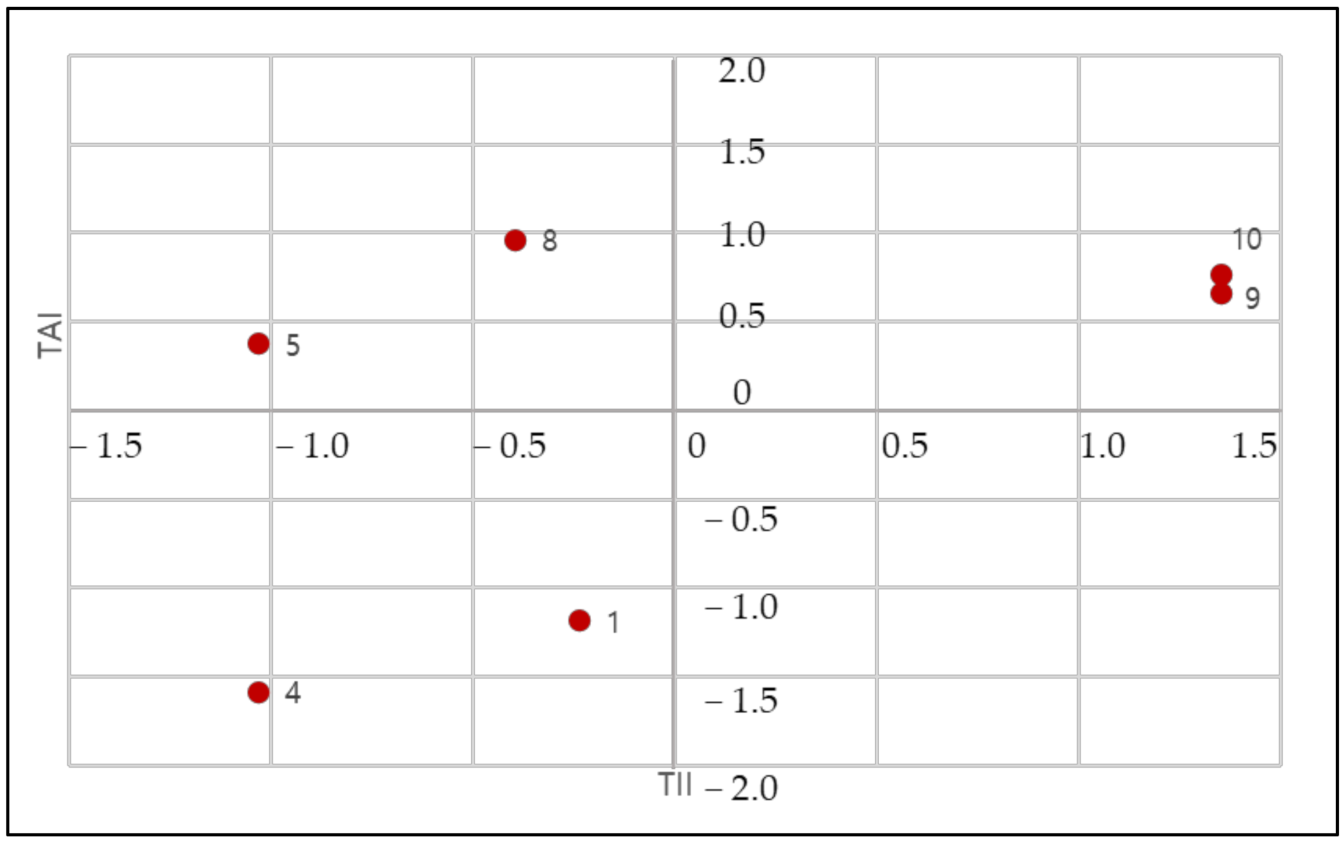
4.2.1. Criticality Analysis
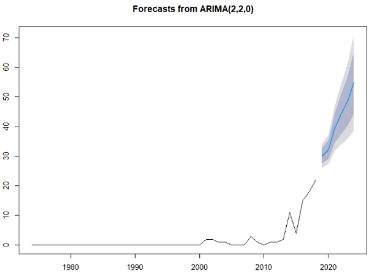
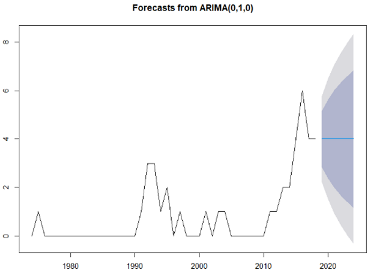
4.2.2. Trend Analysis
4.2.3. Results of Technical Analysis
4.3. Investigation into Emerging and Vacant Technology Fields
4.3.1. IPC Network Analysis
4.3.2. Keywords Network Analysis
4.4. Results
5. Discussion and Conclusions
Author Contributions
Funding
Institutional Review Board Statement
Informed Consent Statement
Data Availability Statement
Acknowledgments
Conflicts of Interest
References
- Dekker, R.; Bloemhof, J.; Mallidis, I. Operations Research for green logistics—An overview of aspects, issues, contributions and challenges. Eur. J. Oper. Res. 2012, 219, 671–679. [Google Scholar] [CrossRef] [Green Version]
- Axsen, J.; Plötz, P.; Wolinetz, M. Crafting strong, integrated policy mixes for deep CO2 mitigation in road transport. Nat. Clim. Chang. 2020, 10, 809–818. [Google Scholar] [CrossRef]
- Seo, J.; Park, J.; Oh, Y.; Park, S. Estimation of total transport CO2 emissions generated by medium-and heavy-duty vehicles (MHDVs) in a sector of Korea. Energies 2016, 9, 638. [Google Scholar] [CrossRef] [Green Version]
- Hrušovský, M.; Demir, E.; Jammernegg, W.; van Woensel, T. Hybrid simulation and optimization approach for green intermodal transportation problem with travel time uncertainty. Flex. Serv. Manuf. J. 2018, 30, 486–516. [Google Scholar]
- Hammond, W.; Axsen, J.; Kjeang, E. How to slash greenhouse gas emissions in the freight sector: Policy insights from a technology-adoption model of Canada. Energy Policy 2020, 137, 111093. [Google Scholar] [CrossRef]
- Ng, M.; Talley, W.K. Rail intermodal management at marine container terminals: Loading double stack trains. Transp. Res. Part. C Emerg. Technol. 2020, 112, 252–259. [Google Scholar] [CrossRef]
- Crainic, T.G.; Perboli, G.; Rosano, M. Simulation of intermodal freight transportation systems: A taxonomy. Eur. J. Oper. Res. 2018, 270, 401–418. [Google Scholar] [CrossRef]
- Heinold, A.; Meisel, F. Emission rates of intermodal rail/road and road-only transportation in Europe: A comprehensive simulation study. Transp. Res. Part. D Transp. Environ. 2018, 65, 421–437. [Google Scholar] [CrossRef]
- De Miranda Pinto, J.T.; Mistage, O.; Bilotta, P.; Helmers, E. Road-rail intermodal freight transport as a strategy for climate change mitigation. Environ. Dev. 2018, 25, 100–110. [Google Scholar] [CrossRef]
- Chen, H. Combinatorial clock-proxy exchange for carrier collaboration in less than truck load transportation. Transp. Res. Part E Logist. Transp. Rev. 2016, 91, 152–172. [Google Scholar] [CrossRef]
- Wang, X.; Kopfer, H. Collaborative transportation planning of less-than-truckload freight. OR Spectr. 2014, 36, 357–380. [Google Scholar] [CrossRef]
- Dai, B.; Chen, H.; Yang, G. Price-setting based combinatorial auction approach for carrier collaboration with pickup and delivery requests. Oper. Res. 2014, 14, 361–386. [Google Scholar] [CrossRef]
- Rakshit, S.M.; Hempel, M.; Sharif, H.; Punwani, J.; Stewart, M.; Mehrvarzi, S. Challenges in current wireless sensor technology for railcar status monitoring for North America’s freight railroad industry. In Proceedings of the ASME/IEEE Joint Rail Conference, Philadelphia, PA, USA, 17–19 April 2012; pp. 397–450. [Google Scholar]
- Balog, M.; Mindas, M. Informatization of rail freight wagon by implementation of the RFID technology. Smart City 360%C2B0 2016, 166, 592–597. [Google Scholar]
- Caviggioli, F. Technology fusion: Identification and analysis of the drivers of technology convergence using patent data. Technovation 2016, 55, 22–32. [Google Scholar] [CrossRef]
- Park, Y.; Yoon, B.; Lee, S. The idiosyncrasy and dynamism of technological innovation across industries: Patent citation analysis. Technol. Soc. 2005, 27, 471–485. [Google Scholar] [CrossRef]
- World Intellectual Property Organization. International Patent Classification (IPC). Available online: https://www.wipo.int/classifications/ipc/en/ (accessed on 20 August 2020).
- Leydesdorff, L.; Kushnir, D.; Rafols, I. Interactive overlay maps for US patent (USPTO) data based on International Patent Classification (IPC). Scientometrics 2014, 98, 1583–1599. [Google Scholar] [CrossRef] [Green Version]
- Wenfeng, Z.; Xin, F.; Hongmei, Y. Research on Technology Opportunity Identification of Small and Medium-sized Vaccine Enterprises Based on Patent Analysis. Asian J. Soc. Pharm. 2020, 15, 97–107. [Google Scholar]
- Evangelista, A.; Ardito, L.; Boccaccio, A.; Fiorentino, M.; Petruzzelli, A.M.; Uva, A.E. Unveiling the technological trends of augmented reality: A patent analysis. Comput. Ind. 2020, 118, 103221. [Google Scholar] [CrossRef]
- Chang, S.H. Patent Analysis of the Critical Technology Network of Semiconductor Optical Amplifiers. Appl. Sci. 2020, 10, 1552. [Google Scholar] [CrossRef] [Green Version]
- Kim, C.; Lee, H.; Seol, H.; Lee, C. Identifying core technologies based on technological cross-impacts: An association rule mining (ARM) and analytic network process (ANP) approach. Expert Syst. Appl. 2011, 38, 12559–12564. [Google Scholar] [CrossRef]
- Yoon, J.; Park, H.; Seo, W.; Lee, J.M.; Coh, B.Y.; Kim, J. Technology opportunity discovery (TOD) from existing technologies and products: A function-based TOD framework. Technol. Forecast. Soc. Chang. 2015, 100, 153–167. [Google Scholar] [CrossRef]
- Ernst, H. The use of patent data for technological forecasting: The diffusion of CNC-technology in the machine tool industry. Small Bus. Econ. 1997, 9, 361–381. [Google Scholar] [CrossRef]
- Ashton, W.B.; Sen, R.K. Using patent information in technology business planning—II. Res. Technol. Manag. 1989, 32, 36–42. [Google Scholar] [CrossRef]
- Chen, R. Design patent map visualization display. Expert Syst. Appl. 2009, 36, 12362–12374. [Google Scholar] [CrossRef]
- Liu, S.J. Patent map—A route to a strategic intelligence of industrial competitiveness. In Proceedings of the First Asia-Pacific Conference on Patent Maps, Taipei, Taiwan, 29 October 2003; pp. 2–13. [Google Scholar]
- Kostoff, R.N.; Schaller, R.R. Science and technology roadmaps. IEEE Trans. Eng. Manag. 2001, 48, 132–143. [Google Scholar] [CrossRef] [Green Version]
- Lee, S.; Yoon, B.; Park, Y. An approach to discovering new technology opportunities: Keyword-based patent map approach. Technovation 2009, 29, 481–497. [Google Scholar] [CrossRef]
- Tseng, Y.H.; Lin, C.J.; Lin, Y.I. Text mining techniques for patent analysis. Inf. Process. Manag. 2007, 43, 1216–1247. [Google Scholar] [CrossRef]
- Johnson, R.A.; Wichern, D.W. Applied Multivariate Statistical Analysis, 6th ed.; Prentice Hall: Upper Saddle River, NJ, USA, 1988. [Google Scholar]
- Deboeck, G.; Kohonen, T. Visual Explorations in Finance: With Self-Organizing Maps; Springer: London, UK, 1998; pp. 246–267. [Google Scholar]
- Yoon, B.U.; Yoon, C.B.; Park, Y.T. On the development and application of a self–organizing feature map–based patent map. RD Manag. 2002, 32, 291–300. [Google Scholar] [CrossRef]
- Juntunen, P.; Liukkonen, M.; Lehtola, M.; Hiltunen, Y. Cluster analysis by self-organizing maps: An application to the modelling of water quality in a treatment process. Appl. Soft Comput. 2013, 13, 3191–3196. [Google Scholar] [CrossRef]
- Bishop, C.M.; Svensén, M.; Williams, C.K. GTM: The generative topographic mapping. Neural Comput. 1998, 10, 215–234. [Google Scholar] [CrossRef]
- Yu, J.; Hwang, J.G.; Hwang, J.; Jun, S.C.; Kang, S.; Lee, C.; Kim, H. Identification of Vacant and Emerging Technologies in Smart Mobility through the GTM-Based Patent Map Development. Sustainability 2020, 12, 9310. [Google Scholar] [CrossRef]
- Son, C.; Suh, Y.; Jeon, J.; Park, Y. Development of a GTM-based patent map for identifying patent vacuums. Expert Syst. Appl. 2012, 39, 2489–2500. [Google Scholar] [CrossRef]
- Kay, L.; Newman, N.; Youtie, J.; Porter, A.L.; Rafols, I. Patent overlay mapping: Visualizing technological distance. J. Assoc. Inf. Sci. Technol. 2014, 65, 2432–2443. [Google Scholar] [CrossRef] [Green Version]
- Strogatz, S.H. Exploring complex networks. Nature 2001, 410, 268–276. [Google Scholar] [CrossRef] [PubMed] [Green Version]
- Freeman, L.C. Visualizing social networks. J. Soc. Struct. 2000, 1, 4. [Google Scholar]
- Scott, J. Social network analysis. Sociology 1988, 22, 109–127. [Google Scholar] [CrossRef]
- Hung, S.W.; Wang, A.P. Examining the small world phenomenon in the patent citation network: A case study of the radio frequency identification (RFID) network. Scientometrics 2010, 82, 121–134. [Google Scholar] [CrossRef]
- Lee, H.; Kim, C.; Cho, H.; Park, Y. An ANP-based technology network for identification of core technologies: A case of telecommunication technologies. Expert Syst. Appl. 2009, 36, 894–908. [Google Scholar] [CrossRef]
- Yoon, B.; Park, Y. A text-mining-based patent network: Analytical tool for high-technology trend. J. High Technol. Manag. Res. 2004, 15, 37–50. [Google Scholar] [CrossRef]
- Reymond, D.; Quoniam, L. Patent documents in STEM and PhD education: Open-source tools and some examples to open discussion. In Proceedings of the 2018 IEEE Global Engineering Education Conference (EDUCON), Canary Islands, Spain, 17–20 April 2018; pp. 4–9. [Google Scholar]
- Reymond, D.; Quoniam, L. A new patent processing suite for academic and research purposes. World Pat. Inf. 2016, 47, 40–50. [Google Scholar] [CrossRef]
- Choi, J.; Hwang, Y.S. Patent keyword network analysis for improving technology development efficiency. Technol. Forecast. Soc. Chang. 2014, 83, 170–182. [Google Scholar] [CrossRef]
- Breschi, S.; Lissoni, F. Knowledge networks from patent data. In Handbook of Quantitative Science and Technology Research: The Use of Publication and Patent Statistics in Studies of S&T Systems; Moed, H., Glänzel, W., Schmoch, U., Eds.; Springer: Dordrecht, The Netherlands, 2004; pp. 613–643. [Google Scholar]
- Lai, K.K.; Wu, S.J. Using the patent co-citation approach to establish a new patent classification system. Inf. Process. Manag. 2005, 41, 313–330. [Google Scholar] [CrossRef]
- Yoon, B.; Park, Y. Development of new technology forecasting algorithm: Hybrid approach for morphology analysis and conjoint analysis of patent information. IEEE Trans. Eng. Manag. 2007, 54, 588–599. [Google Scholar] [CrossRef]
- Kim, J.; Lee, S. Patent databases for innovation studies: A comparative analysis of USPTO, EPO, JPO and KIPO. Technol. Forecast. Soc. Chang. 2015, 92, 332–345. [Google Scholar] [CrossRef]
- Singh, T.; Kumari, M. Role of text pre-processing in twitter sentiment analysis. Procedia Comput. Sci. 2016, 89, 549–554. [Google Scholar] [CrossRef] [Green Version]
- Haddi, E.; Liu, X.; Shi, Y. The role of text pre-processing in sentiment analysis. Procedia Comput. Sci. 2013, 17, 26–32. [Google Scholar] [CrossRef] [Green Version]
- Hassler, M.; Fliedl, G. Text preparation through extended tokenization. WIT Trans. Inf. Commun. Technol. 2006, 37, 13–21. [Google Scholar]
- Callon, M.; Courtial, J.P.; Laville, F. Co-word analysis as a tool for describing the network of interactions between basic and technological research: The case of polymer chemsitry. Scientometrics 1991, 22, 155–205. [Google Scholar] [CrossRef]
- Kim, K.H.; Han, Y.J.; Lee, S.; Cho, S.W.; Lee, C. Text mining for patent analysis to forecast emerging technologies in wireless power transfer. Sustainability 2019, 11, 6240. [Google Scholar] [CrossRef] [Green Version]
- Ardito, L.; D’Adda, D.; Petruzzelli, A.M. Mapping innovation dynamics in the Internet of Things domain: Evidence from patent analysis. Technol. Forecast. Soc. Chang. 2018, 136, 317–330. [Google Scholar] [CrossRef]
- Fall, C.J.; Törcsvári, A.; Fiévet, P.; Karetka, G. Automated categorization of German-language patent documents. Expert Syst. Appl. 2004, 26, 269–277. [Google Scholar] [CrossRef]
- Yoon, B.; Park, I.; Yun, D.; Park, G. Exploring promising vacant technology areas in a technology-oriented company based on bibliometric analysis and visualisation. Technol. Anal. Strat. Manag. 2009, 31, 388–405. [Google Scholar] [CrossRef]
- Lee, S.; Lee, S.; Seol, H.; Park, Y. Using patent information for designing new product and technology: Keyword based technology roadmapping. RD Manag. 2008, 38, 169–188. [Google Scholar] [CrossRef]
- Yoon, B.; Phaal, R. Structuring technological information for technology roadmapping: Data mining approach. Technol. Anal. Strateg. Manag. 2013, 25, 1119–1137. [Google Scholar] [CrossRef] [Green Version]
- Joung, J.; Kim, K. Monitoring emerging technologies for technology planning using technical keyword based analysis from patent data. Technol. Forecast. Soc. Chang. 2017, 114, 281–292. [Google Scholar] [CrossRef]
- Kürtössy, J. Innovation indicators derived from patent data. Period. Polytech. Soc. Manag. Sci. 2004, 12, 91–101. [Google Scholar]
- Harvey, A.C.; Fernandes, C. Time series models for count or qualitative observations. J. Bus. Econ. Stat. 1989, 7, 407–417. [Google Scholar]
- Griffiths, T.L.; Steyvers, M. Finding scientific topics. Proc. Natl. Acad. Sci. USA 2004, 101, 5228–5235. [Google Scholar] [CrossRef] [Green Version]
- Daud, A.; Abbas, F.; Amjad, T.; Alshdadi, A.A.; Alowibdi, J.S. Finding rising stars through hot topics detection. Future Gener. Comput. Syst. 2020, 115, 798–813. [Google Scholar] [CrossRef]
- Agrawal, R.; Imieliński, T.; Swami, A. Mining association rules between sets of items in large databases. In Proceedings of the 1993 ACM SIGMOD International Conference on Management of Data, Washington, DC, USA, 26–28 May 1993; pp. 207–216. [Google Scholar]
- Ampornphan, P.; Tongngam, S. Patent Knowledge Discovery Using Data Analytics. In Proceedings of the 2017 International Conference on Information Technology, Singapore, 27–29 December 2017; pp. 42–46. [Google Scholar]
- Cios, K.J.; Pedrycz, W.; Swiniarski, R.W. Data mining and knowledge discovery. Data Min. Methods Knowl. Discov. 1998, 458, 1–26. [Google Scholar]
- Tan, M.H.; Lee, W.L. Evaluation and improvement of procurement process with data analytics. Int. J. Adv. Comput. Sci. Appl. 2015, 6, 70. [Google Scholar] [CrossRef] [Green Version]


| B61D | B65D | B65G | B60P | G05B | ||
|---|---|---|---|---|---|---|
| Patent 1 | 0 | 1 | 0 | 0 | 0 | |
| Patent 2 | 0 | 0 | 1 | 0 | 0 | |
| Patent 3 | 0 | 0 | 1 | 0 | 1 | |
| Patent 4 | 0 | 0 | 1 | 0 | 0 | |
| Patent 1536 | 1 | 0 | 0 | 0 | 0 |
| Load | Control | Connect | Vibrat | Gas | ||
|---|---|---|---|---|---|---|
| Patent 1 | 1 | 0 | 1 | 0 | 1 | |
| Patent 2 | 1 | 1 | 0 | 0 | 0 | |
| Patent 3 | 0 | 0 | 1 | 0 | 0 | |
| Patent 4 | 0 | 0 | 0 | 1 | 0 | |
| Patent 1536 | 1 | 1 | 0 | 0 | 1 |
| Patent Vacuum | IPC |
|---|---|
| 1 | G06Q, G06F |
| 4 | B66C, E04H |
| 5 | B65D, B65G, B66C |
| 8 | B61D, B60P, B62D |
| 9 | B61D, B60P |
| 10 | B61D, B65G |
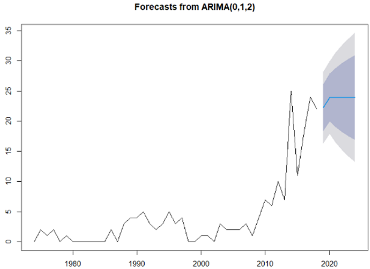
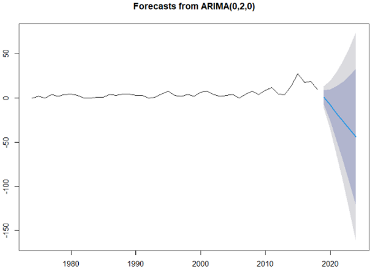
| 1st Patent Vacuum | 4th Patent Vacuum |
 |  |
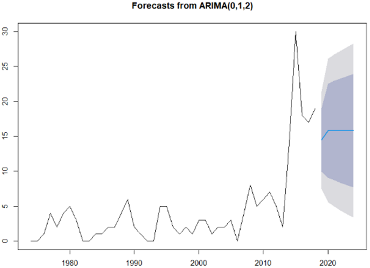
| 5th Patent Vacuum | 8th Patent Vacuum |
 |  |
| 9th Patent Vacuum | 10th Patent Vacuum |
 |  |
| Patent Vacuum | Criticality Analysis | Trend Analysis |
|---|---|---|
| 1 | Low level | Hot field |
| 4 | Low level | Active field |
| 5 | Medium level | Active field |
| 8 | Medium level | Cold field |
| 9 | High level | Hot field |
| 10 | High level | Active field |
| Previous | Consequent | Support (%) | Confidence (%) | Lift | |
|---|---|---|---|---|---|
| 1 | B65D,E04B | B60P | 0.104 | 100 | 10.667 |
| 2 | B65D,E04H | B60P | 0.104 | 100 | 10.667 |
| 3 | B65D,E04H,E04B | B60P | 0.104 | 100 | 10.667 |
| 4 | B61F,B61C | B61D | 0.208 | 100 | 6.038 |
| 5 | B60F,B61G | B61D | 0.208 | 100 | 6.038 |
| Previous | Consequent | Support (%) | Confidence (%) | Lift | |
|---|---|---|---|---|---|
| 1 | E01B,B61L | B65G | 0.104 | 100 | 9.600 |
| 2 | B61B,B61L | B65G | 0.104 | 100 | 9.600 |
| 3 | B63B,B61L | B65G | 0.104 | 100 | 9.600 |
| 4 | B66C,B61L | B65G | 0.104 | 100 | 9.600 |
| 5 | B61B,E01B | B65G | 0.104 | 100 | 8.400 |
| Patent Vacuum | Core IPC Code | Adjacent IPC Code |
|---|---|---|
| 9th patent vacuum | B60P, B61D | E04H, B65D, E04B, B62D, B60F, B61F, B61L, G06Q |
| 10th patent vacuum | B65G, B61D | B61B, E01B, B61L, B63B, B66C |
Publisher’s Note: MDPI stays neutral with regard to jurisdictional claims in published maps and institutional affiliations. |
© 2021 by the authors. Licensee MDPI, Basel, Switzerland. This article is an open access article distributed under the terms and conditions of the Creative Commons Attribution (CC BY) license (http://creativecommons.org/licenses/by/4.0/).
Share and Cite
Jun, S.; Han, S.H.; Yu, J.; Hwang, J.; Kim, S.; Lee, C. Identification of Promising Vacant Technologies for the Development of Truck on Freight Train Transportation Systems. Appl. Sci. 2021, 11, 499. https://doi.org/10.3390/app11020499
Jun S, Han SH, Yu J, Hwang J, Kim S, Lee C. Identification of Promising Vacant Technologies for the Development of Truck on Freight Train Transportation Systems. Applied Sciences. 2021; 11(2):499. https://doi.org/10.3390/app11020499
Chicago/Turabian StyleJun, Sungchan, Seong Ho Han, Jiwon Yu, Jumi Hwang, Sangbaek Kim, and Chulung Lee. 2021. "Identification of Promising Vacant Technologies for the Development of Truck on Freight Train Transportation Systems" Applied Sciences 11, no. 2: 499. https://doi.org/10.3390/app11020499