Article

The Start-Up of Continuous Biohydrogen Production from Cheese Whey: Comparison of Inoculum Pretreatment Methods and Reactors with Moving and Fixed Polyurethane Carriers

1
Laboratory of Resource-Saving Biotechnologies, Lobachevsky State University of Nizhni Novgorod, 603950 Nizhnij Novgorod, Russia
2
Nizhny Novgorod State University of Architecture and Civil Engineering, 603950 Nizhnij Novgorod, Russia
3
Department of Renewable Energy, Federal Scientific Agroengineering Center VIM, 109428 Moscow, Russia
4
Federal Research Centre “Fundamentals of Biotechnology” of the Russian Academy of Sciences, 119071 Moscow, Russia
5
Department of Theoretical and Applied Mechanics, Russian University of Transport, 127994 Moscow, Russia
6
Department of Management and Quantitative Studies, Parthenope University, 80132 Naples, Italy
*
Author to whom correspondence should be addressed.
Appl. Sci. 2021, 11(2), 510; https://doi.org/10.3390/app11020510
Submission received: 12 December 2020 / Revised: 28 December 2020 / Accepted: 4 January 2021 / Published: 6 January 2021
(This article belongs to the Special Issue Applied Optimization in Clean and Renewable Energy: New Trends)

Abstract

:

Featured Application

The results obtained can be used to optimize the production of biohydrogen from highly concentrated liquid waste, such as cheese whey.

Abstract

This article presents the results of the start-up of continuous production of biohydrogen from cheese whey (CW) in an anaerobic filter (AF) and anaerobic fluidized bed (AFB) with a polyurethane carrier. Heat and acid pretreatments were used for the inactivation of hydrogen-scavengers in the inoculum (mesophilic and thermophilic anaerobic sludge). Acid pretreatment was effective for thermophilic anaerobic sludge to suppress methanogenic activity, and heat treatment was effective for mesophilic anaerobic sludge. Maximum specific yields of hydrogen, namely 178 mL/g chemical oxygen demand (COD) and 149 mL/g COD for AFB and AF, respectively, were obtained at the hydraulic retention time (HRT) of 4.5 days and organic load rate (OLR) of 6.61 kg COD/(m3 day). At the same time, the maximum hydrogen production rates of 1.28 and 1.9 NL/(L day) for AF and AFB, respectively, were obtained at the HRT of 2.02 days and OLR of 14.88 kg COD/(m3 day). At the phylum level, the dominant taxa were Firmicutes (65% in AF and 60% in AFB), and at the genus level, Lactobacillus (40% in AF and 43% in AFB) and Bifidobacterium (24% in AF and 30% in AFB).

1. Introduction

Cheese whey CW is a highly concentrated liquid waste generated during the production of curd, kefir and some types of cheese from milk. CW is characterized by a high content of organic substances, ranging from 25 to 80 g COD (chemical oxygen demand)/L. Annual milk production in Russia is more than 30 million tons, while the specific production of CW is estimated at 0.8–0.9 L per L processed milk [1]. Due to its high content of lactose (45–50 g/L), proteins (6–8 g/L), lipids (4–5 g/L), as well as macro-and microelements, water and fat-soluble vitamins, CW can be used as an inexpensive raw material for the production of biofuels, in particular biohydrogen, by its dark fermentation (DF) [1,2]. Theoretically, eight moles of hydrogen can be obtained from one mole of lactose. However, the actual yield depends on many factors and in practice rarely exceeds four mol H2/mol lactose [3]. The choice of inoculum is essential for the efficiency of the DF process because hydrogen producers can form various metabolites that affect the specific yield of hydrogen. The microbial community of the inoculum converts lactose into soluble metabolites (alcohols, acids), CO2 and H2, according to the following general equation:
Lactose → glucose + galactose → soluble metabolites + CO2 + H2
Galactose obtained in Equation (1) is decomposed further in the chain of reactions to form glucose 6-phosphate via the Leloir pathway [4]. Glucose decomposes with the formation of H2, CO2 and other products in the chain of biochemical reactions described in detail in several works [5,6], so if the final product is acetic acid, the biohydrogen yield is at a maximum 4 mol H2/mol glucose. At the same time, when butyric acid is formed, theoretically, only 2 mol H2/mol of glucose can be released.
A decrease in hydrogen production is often due to its consumption by methanogens presented in the anaerobic sludge, therefore, for DF, the stage of preliminary selective enrichment of hydrogen-forming microorganisms and the elimination of hydrogenotrophic methanogens in the inoculum is important. Among the various pretreatment methods, thermal inactivation has become the most widespread due to its relative simplicity [7]. Other methods should also be noted: treatment with acid [8], alkali [9], antimethanogenic compounds or substances addition [10] or a technological method—increasing the organic loading rate (OLR) [11].
Feeding mode and the bioreactor configuration are significant factors affecting the availability of the substrate for hydrogen producers, the rate of biomass dilution, mixing conditions and mass transfer processes. Depending on the means of feeding, the production of biohydrogen can be carried out in a batch, semi-continuous and continuous modes. The batch mode is relatively simple in technological design and the control of the DF process. Investigations of the DF of CW in a batch mode were mainly aimed at comparing temperature conditions [12], initial substrate concentrations [13], and H2 producers [14]. A semi-continuous mode is recommended for the processing of viscous and solid wastes such as food waste and lignocellulosic biomass, where physical contact between the substrate and microorganisms is limited [15]. This mode of reactor operation provides a better hydrolysis rate, prevents pipe clogging, and promotes effective retention of biomass in the reactor. Research in the continuous production of biohydrogen from CW is mainly aimed at optimizing the DF process using various reactor configurations such as membrane bioreactor (MBR) [16], continuous stirred tank reactor (CSTR) [17], up-flow anaerobic sludge bed reactor (UASB) [18], anaerobic packed-bed (APB) [19] and anaerobic fluidized bed reactor (AFBR) [20,21]. Continuous reactors are usually started in batch mode to ensure proper inoculum preparation and pre-treatment. A successful transition to continuous operation largely depends on the reactor start-up strategy [22].
In this work, we investigated the characteristics of starting the process of continuous DF of CW under mesophilic conditions in reactors of two types: with a fixed carrier (anaerobic filter (AF)) and a moving carrier (anaerobic fluidized bed (AFB)) made of polyurethane foam. The start-up strategy included preliminary acid or thermal inactivation of methanogens in two inocula (thermophilic and mesophilic anaerobic sludge) and screening of the most active biohydrogen-producing inoculum.

2. Materials and Methods

2.1. Substrates and Inoculates

As a substrate, we used whey formed during the production of curd (CW). CW had the following parameters: chemical oxygen demand (COD) = 30.0 g/L, pH = 5.81, total solids (TS) = 6.51%, volatile solids (VS) = 6.31% of TS, total carbon (Ctot)/total nitrogen (Ntot) = 31.8.
CW was stored in a refrigerator at 4 °C. Since the pH of the CW was low, before feeding into the reactor, the pH was adjusted to 7.0 with a solution of 1 M NaOH. CW was not sterilized before being fed into the reactor, since it was previously shown that for stable formation of hydrogen, it is sufficient to ensure the storage of whey at 4 °C [23].
Additionally, a solution of mineral elements (1 mL/L) was fed into the wastewater: KH2PO4 (3 g/L), K2HPO4 (7 g/L), MgSO4 (1 g/L), (NH4)2SO4 (1 g/L).
The inocula used were:
(1)
Thermophilic anaerobic sludge from CSTR for co-fermentation of food waste and sewage sludge (TS = 3.57%, VS = 68.03% of TS) (inoculum 1);
(2)
Mesophilic anaerobic sludge from the industrial UASB, which treated brewery wastewater (TS = 10.96%, VS = 88.3% of TS) (inoculum 2).
The inocula were stored at 37 °C for a week and filtered through a 0.2 mm sieve. For further work, a fraction of less than 0.2 mm was used.

2.2. Experiment on Inactivation of Methanogens in Inoculums

Acid inactivation of the inoculum was carried out by incubation at low pH 3.0 (1 M HCl) for 24 h. Then the inoculum was neutralized by adding 1 M NaOH to pH 7.0. Thermal inactivation was carried out for 30 min at 90 °C. Inactivated inoculums were stored in a refrigerator at 4–8 °C.
The efficiency of inactivation of methanogens in the inoculums was assessed by DF of CW for 8 days in a batch mode which was enough to evaluate the efficiency of pretreatments. The experiment was carried out in sealed 200 mL glass vials in two replicates. For the experiment control inoculums without treatment, as well as after acidic and heat pretreatment were taken. 100 mL of inoculum and CW were added to each vial so that the ratio of substrate to inoculum (on VS basis) was 1:2. The vials were purged with argon and sealed with rubber stoppers and aluminium caps and incubated in an ES-20/60 shaker-incubator (Biosan, Riga, Latvia) at 120 rpm under mesophilic conditions (37 ± 1 °C).

2.3. Experiment on DF of CW in Continuous Mode

AF and AFB were made of polypropylene, each having a working volume of 0.72 L (Figure 1). To maintain mesophilic conditions (37 ± 1 °C), the reactors were placed in an FD 53 (Binder, Tuttlingen, Germany) drying oven, equipped with an airlock in the upper part for hoses and cables. The pH of CW was adjusted to 6.5 with a 10% solution of limewater before feeding into the reactor.
The main difference between the reactors was the various upward flow rate of the liquid (11.2 m/h for AFB and 1.5 m/h for AF), which was provided using a recirculation pump. The selected recirculation rate for AFB ensured fluidization of the carrier, and for AF provided sufficient mass transfer and separation of biogas. Feed supply and discharge of effluent were carried out automatically by a set time. The recirculation pumps were running continuously. Grids were installed in the reactors to support the carrier. The AF and AFB operating algorithms were as close as possible to the operation of industrial anaerobic reactors (Figure 1). The required recirculation flow rate and the upward fluid flow rate in AFB were maintained using a Longer Pump BT 300-2J peristaltic pump (Longer Precision Pump Co., Ltd., Hebei, China), in AF—using an Etatron VZ-V PER peristaltic pump (ETATRON D.S. S.p.A, Roma, Italy). The fresh substrate was supplied and the effluent was pumped out using identical Etatron VZ-V1-3 peristaltic pumps (ETATRON D.S. S.p.A, Roma, Italy) in equal portions twenty times a day, and the effluent pump was turned on 30 min after the end of the feeding pump.
The process of starting up the reactors consisted of 6 stages and lasted for an overall duration of 100 days. At each subsequent stage, the hydraulic retention time (HRT was stepwise reduced, while the OLR increased, according to Table 1.
Heat-pretreated mesophilic anaerobic sludge (Inoculum 2) was used as an inoculum. Pieces of polyurethane foam with a size of 0.9 × 0.9 × 0.9 cm2 were used to immobilize the inoculum in AF and AFB. The total volume of the carrier loaded into each of the AF and AFB reactors was 260 mL and the inoculum was 800 mL.

2.4. Analytical Methods

A MilliGascounter gas meter (RITTER, Bochum, Germany) was used to measure the volume of generated biogas in the experiment on the DF of CW in continuous mode. The gas produced during the experiment with vials in batch mode was collected by water displacement method (volumetric method) [24]. The composition of biogas was determined using a GC-2010 Plus gas chromatograph (Shimadzu, Kyoto, Japan) with a thermal conductivity detector (TCD) on a Restek ShinCarbon ST packed column (2 m long, 1.0 mm ID, 1/16” OD, 100/120 mesh). The oven temperature was set at 40 °C for 3 min, then increased to 110 °C at a rate of 10 °C/min; injector and TCD temperatures were set at 30 °C and 200 °C; carrier gas (nitrogen for hydrogen determination and helium for methane and carbon dioxide determination) flow rate was 13 mL/min, splitless. The GC was calibrated using four calibration gas mixtures of hydrogen in nitrogen and three calibration gas mixtures of carbon dioxide and methane in helium. The volume of the injected sample was 1 mL.
The content of total carbon (Ctot) and total nitrogen (Ntot) was determined using a Vario EL cube elemental analyzer (Elementar, Langenselbold, Germany). The amount and composition of VFA in the liquid samples were determined with a GCMS-QP2010 Ultra chromatography/mass spectrometer (Shimadzu). The liquid samples were centrifuged at 4200 rpm for 5 min and filtered through syringe filters with a pore diameter of 0.45 μm. The 0.20-μL sample was introduced into the injector of the GCMS. The analyzed substances were evaporated in the carrier gas (helium 6.0) at a flow of 250 °C. The sample components were separated in a capillary GC column ZB-FFAP for 19 min. The results of chromatography/mass spectrometry were processed with the Shimadzu software (GCMS Solution ver. 4.11). VFAs were identified with the NIST 11 database. The VFA concentrations in liquid-phase samples were determined by the areas of chromatographic peaks in the mode of monitoring selected ions (ions assigned to the most intense lines in the mass spectra of tested substances) with the internal-size standard protocol [25]. TS content was determined after drying the samples to constant weight at 105 °C. The ash residue was calculated after burning a dry sample in a muffle furnace (JSC Laboratory Equipment and Instruments, Saint Petersburg, Russia) at 600 °C. VS content was calculated as the difference between TS and ash residue. COD was determined by the dichromate method, pH was measured using a portable pH meter WTW pH 3110 SET (WTW, Weilheim in Oberbayern, Germany). The measurements were carried out in duplicate.

2.5. Microbial Community Analysis

DNA isolation was carried out according to the previously described method [26]. Libraries of 16SrRNA fragments were prepared by amplification according to the described methodology [27]. The primers UNIV515F—UNIV806R were used as sequences flanking V3 [28]. For PCR, 5 × Taq Red buffer and HS Taq polymerase (Evrogen, Moscow, Russia) were used in accordance with the manufacturer’s recommendations. The final concentration of primers in all cases was 1 μM. The final reaction volume was 30 μL. Each DNA sample was amplified in triplicate. The replicates were then pooled and visualized on a 2% agarose gel at a wavelength of 470 nm. The desired DNA band was excised and purified using the Standard Cleanup Gel Extraction Kit (Evrogen). To measure the DNA concentration, a Qubit® 2.0 fluorimeter with an HSAssayKit reagent kit (Life Technologies, Carlsbad, CA, USA) was used. Before sequencing, the samples were mixed equimolarly and the resulting DNA solution was diluted to 4 nM. Further denaturation of the library pool and preparation for sequencing were performed according to the standard Illumina Sample Preparation Guide protocol on the MiSeq platform using the MiSeqReagentKit v2 (500 cycles) (Illumina, San Diego, CA, USA). Primary data processing, the formation of OTE tables, analysis of taxonomic composition and alpha metrics of diversity were carried out using QIIME (version 1.9.1; [29]) and the SILVA online data analysis service [30].

3. Results

3.1. Experiment on Inactivation of Methanogens in the Inoculum

Pretreatment of anaerobic sludge with hydrochloric acid (pH 3.0, for 24 h) or high temperature (90 °C, 30 min) led to a change in the content of TS and VS in inoculums. After acid pretreatment of inoculum 1, VS increased by 5.3% and by 13.8%—after heat pretreatment. VS content after acid and heat pretreatment remained practically unchanged in inoculum 2. TS content in inoculum 1 increased by 53.2% after heat pretreatment and decreased by 32.2% in inoculum 2. Acid pretreatment increased the TS content by 25.49% in inoculum 1 and by 21.17% in inoculum 2.
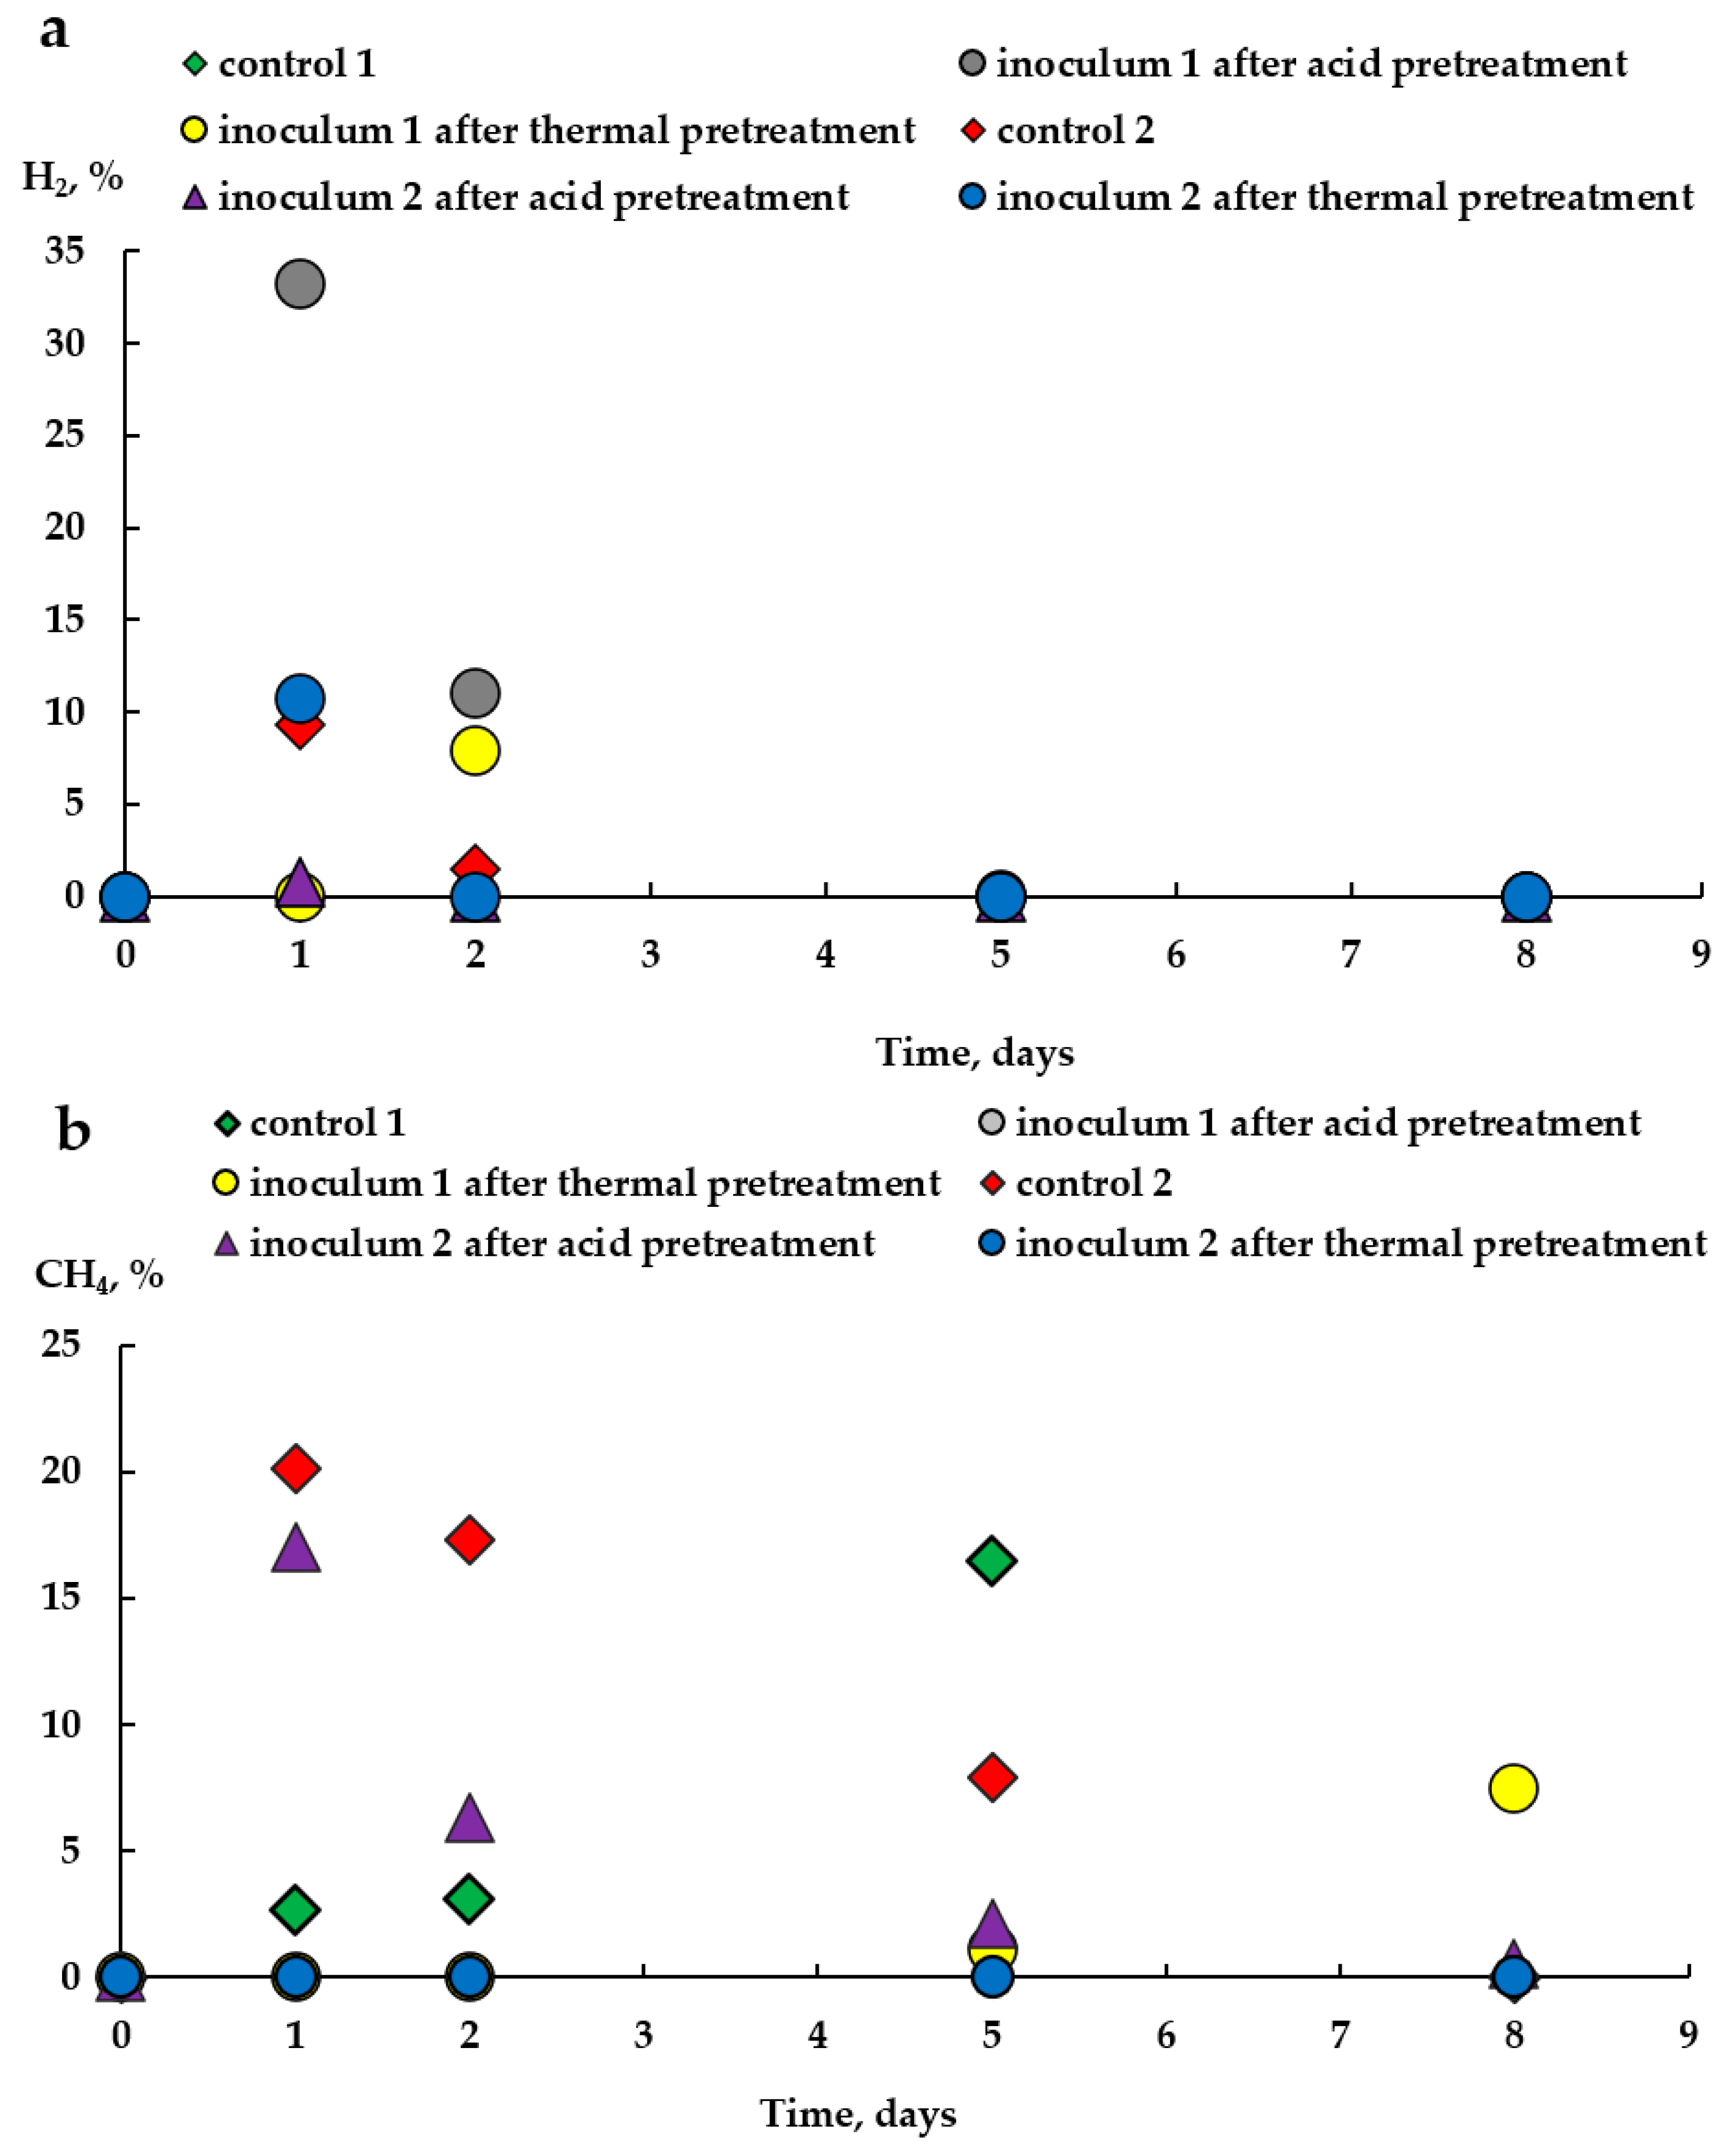
When using acid-pretreated inoculum 1 for DF of CW, on the first day of the batch experiment, the hydrogen content in the biogas was 33.3% and methane was absent (Figure 2). For acid-pretreated inoculum 2, a different picture was observed: the hydrogen content in biogas on the first day of the batch experiment was 0.8%, and methane—17%. Thus, inactivation of methanogens using acid pretreatment in inoculum 2 was not observed, since in control 2 (inoculum 2 without pretreatment) the methane content in biogas was 20.1%. On the second day of incubation, the amount of hydrogen content in inoculum 1 after acid pretreatment decreased to 11.0%.
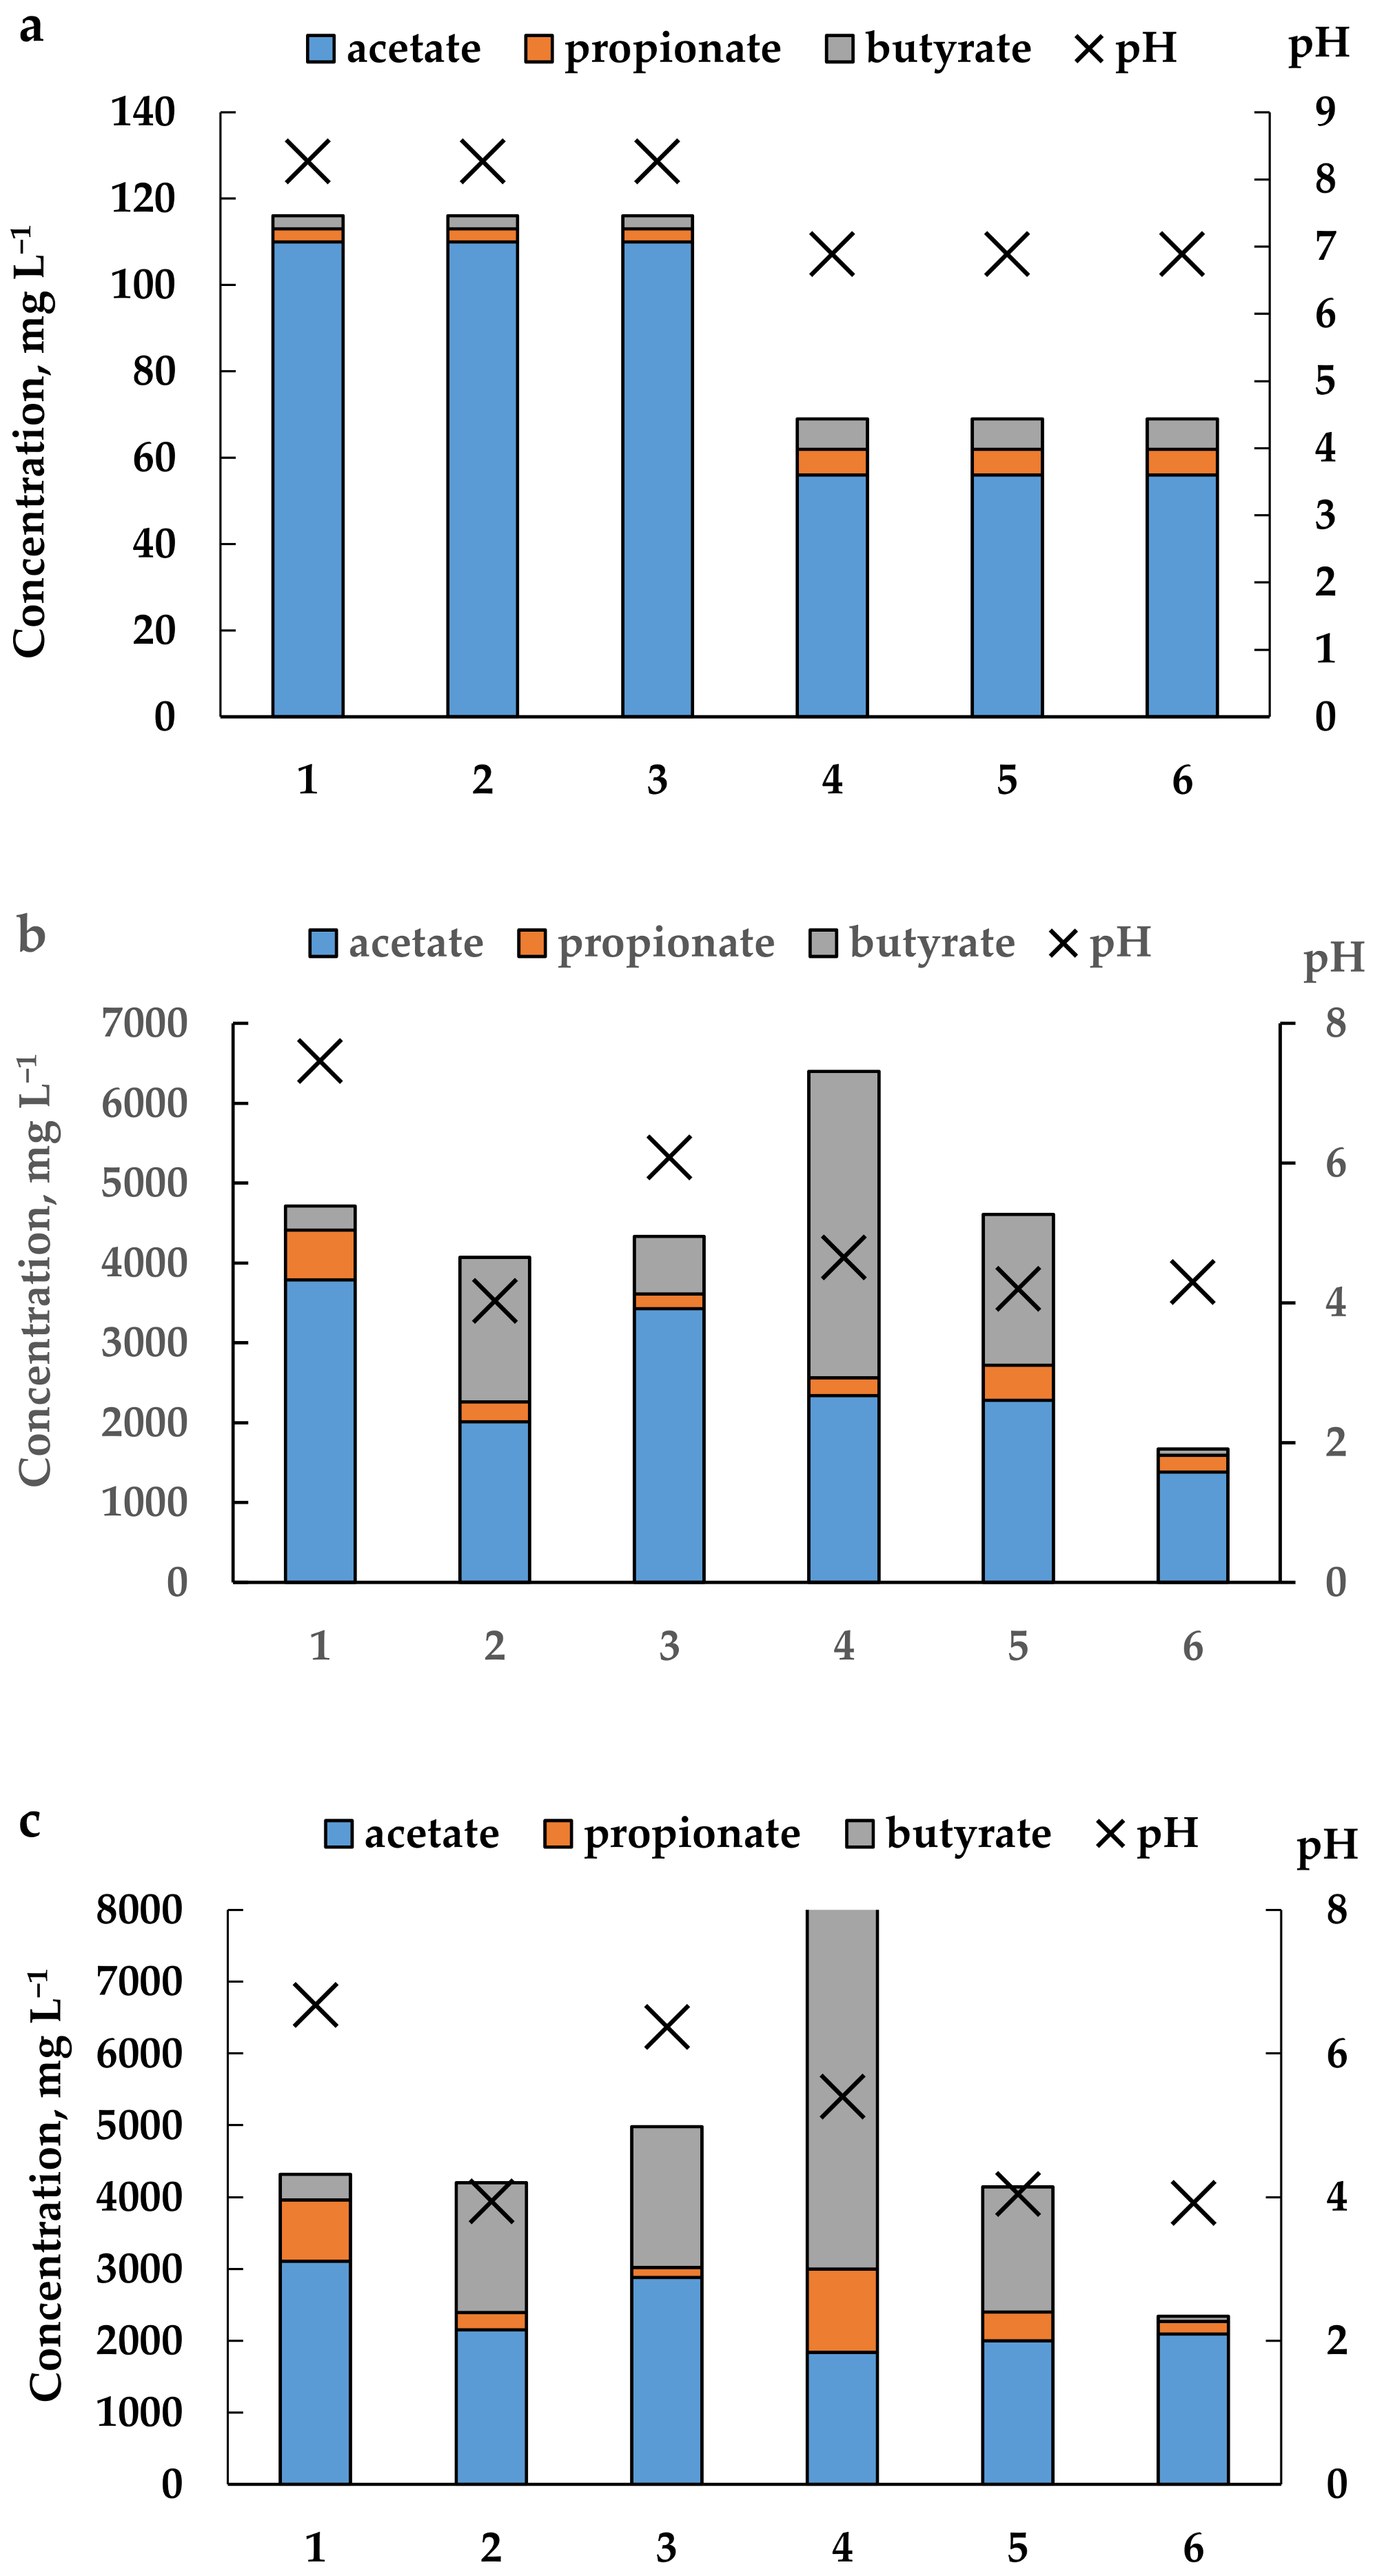
Acetic and butyric acids predominated among the metabolites formed (Figure 3). Particularly strong acidification on the 8th day of the experiment was observed for inoculum 1 and inoculum 2 after acid pretreatment (up to pH = 3.94 and pH = 4.04, respectively), and for inoculum 2 after heat treatment (up to pH = 3.92).
Acetate formation was observed in all vials, but not more than 63 mM (control 1). In vials with inoculum 1, after thermal inactivation, the formation of hydrogen was observed only on the second day of the experiment (7.91%). At the very beginning, the activity of methanogens was suppressed and only on the fifth day of the experiment, the appearance of methane (1.1%) began to be observed in the gas phase. On the second day, acetic acid prevailed in the liquid phase and its concentration was higher than in the samples with inoculum 1 after acid pretreatment. However, a sharp decrease in pH when using heat pretreated inoculum was observed, the pH of the medium on day 8 was 6.37. Inoculum 1 after acid pretreatment on day 8 had a pH of 3.94.
In the reactor with untreated inoculum 1 (control 1), the pH also decreased on the 8th day to a value of 6.67, despite the high content of acetic acid, only methane was observed in the biogas (16.5% on the 5th day), hydrogen in the gas phase was not detected. In control 1, acetic acid predominated, the decrease in COD (71.4%) was the highest compared to the pretreated inoculum 1.
After 8 days of the experiment, the greatest decrease in the COD value was observed in the control samples (71%). In the samples after acid inactivation, COD removal was 64–66%, and in the samples with thermal inactivation—44–46% (Table 2).
In control 2, both hydrogen and methane (9.3% H2 and 20.1% CH4) were recorded in the gas phase on the second day of the experiment. However, strong acidification (pH 4.65) was observed on the second day, after which the content of methane and hydrogen in the gas began to decrease sharply. Analysis of the VFA content in the liquid phase showed the predominance of butyric acid, COD removal was 71%.
Thermal inactivation of inoculum 2 contributed to an insignificant increase in the hydrogen yield compared to control 2. On the second day of incubation, its content in the gas phase was 10.7%, the activity of methanogens was suppressed, and no methane was detected in the gas. Acetic acid prevailed over propionic and butyric acids. After 8 days of incubation, the decrease in COD by heat pretreated inoculum 2 was the lowest (43.8%). In general, it can be noted that the largest decrease in COD was observed in reactors with active methanogenesis (Table 2) because VFAs formed during fermentation were converted into methane along with hydrogen.
Overall, the results showed that acid treatment was effective for thermophilic inoculum to suppress methanogenic activity, and heat treatment was effective for mesophilic inoculum (Table 2).

3.2. Experiment on DF of CW in Continuous Mode in Two Types of Reactors

Heat-pretreated mesophilic anaerobic sludge (Inoculum 2) was used as an inoculum for the experiment in continuous mode for the following reasons:
-
Thermal inactivation was chosen primarily because of its relative simplicity both in laboratory conditions and in the full-scale implementation of the technology [7];
-
Mesophilic sludge was chosen since it contains a microbial community naturally adapted to mesophilic conditions. In turn, the mesophilic mode of operation of AF and AFB was chosen because is considered more stable than thermophilic.
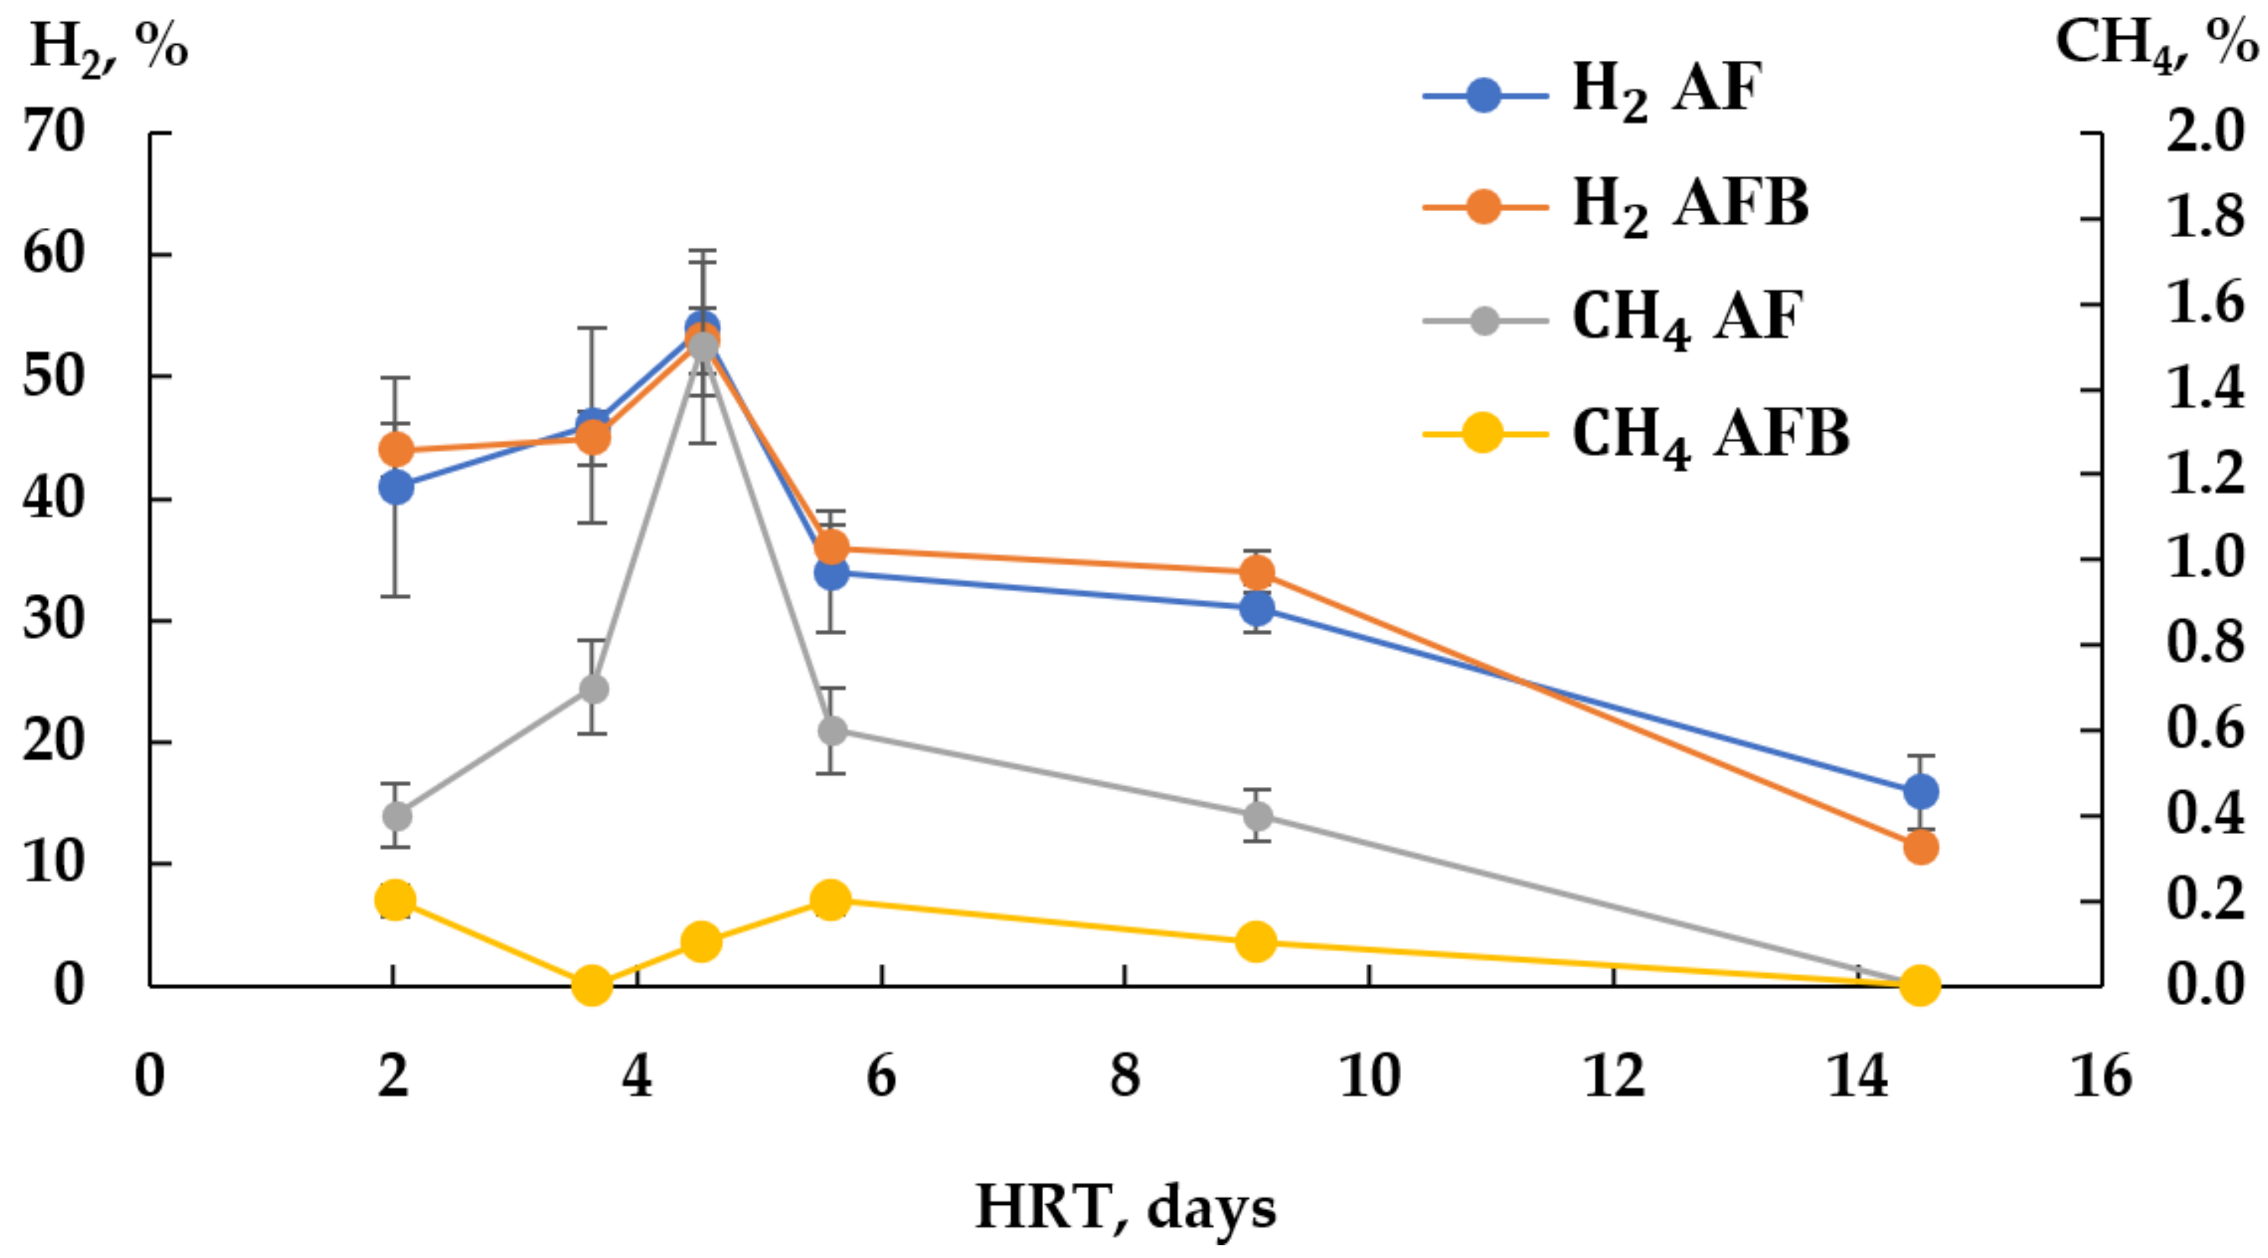
During the experiment in continuous mode, HRT was decreased and OLR was increased in steps. At the initial stage (S-I Table 1) at HRT of 14.5 days, the hydrogen content was 15.9% in AF and 11.4% in AFB, there was no methane in the biogas. As HRT decreased, the hydrogen content in the biogas increased, reaching a maximum value of 54% (AF) and 53% (AFB) at HRT of 4.5 days (S-IV Table 1), besides, a small amount of methane (up to 1.55%) was found in the biogas (Figure 4).
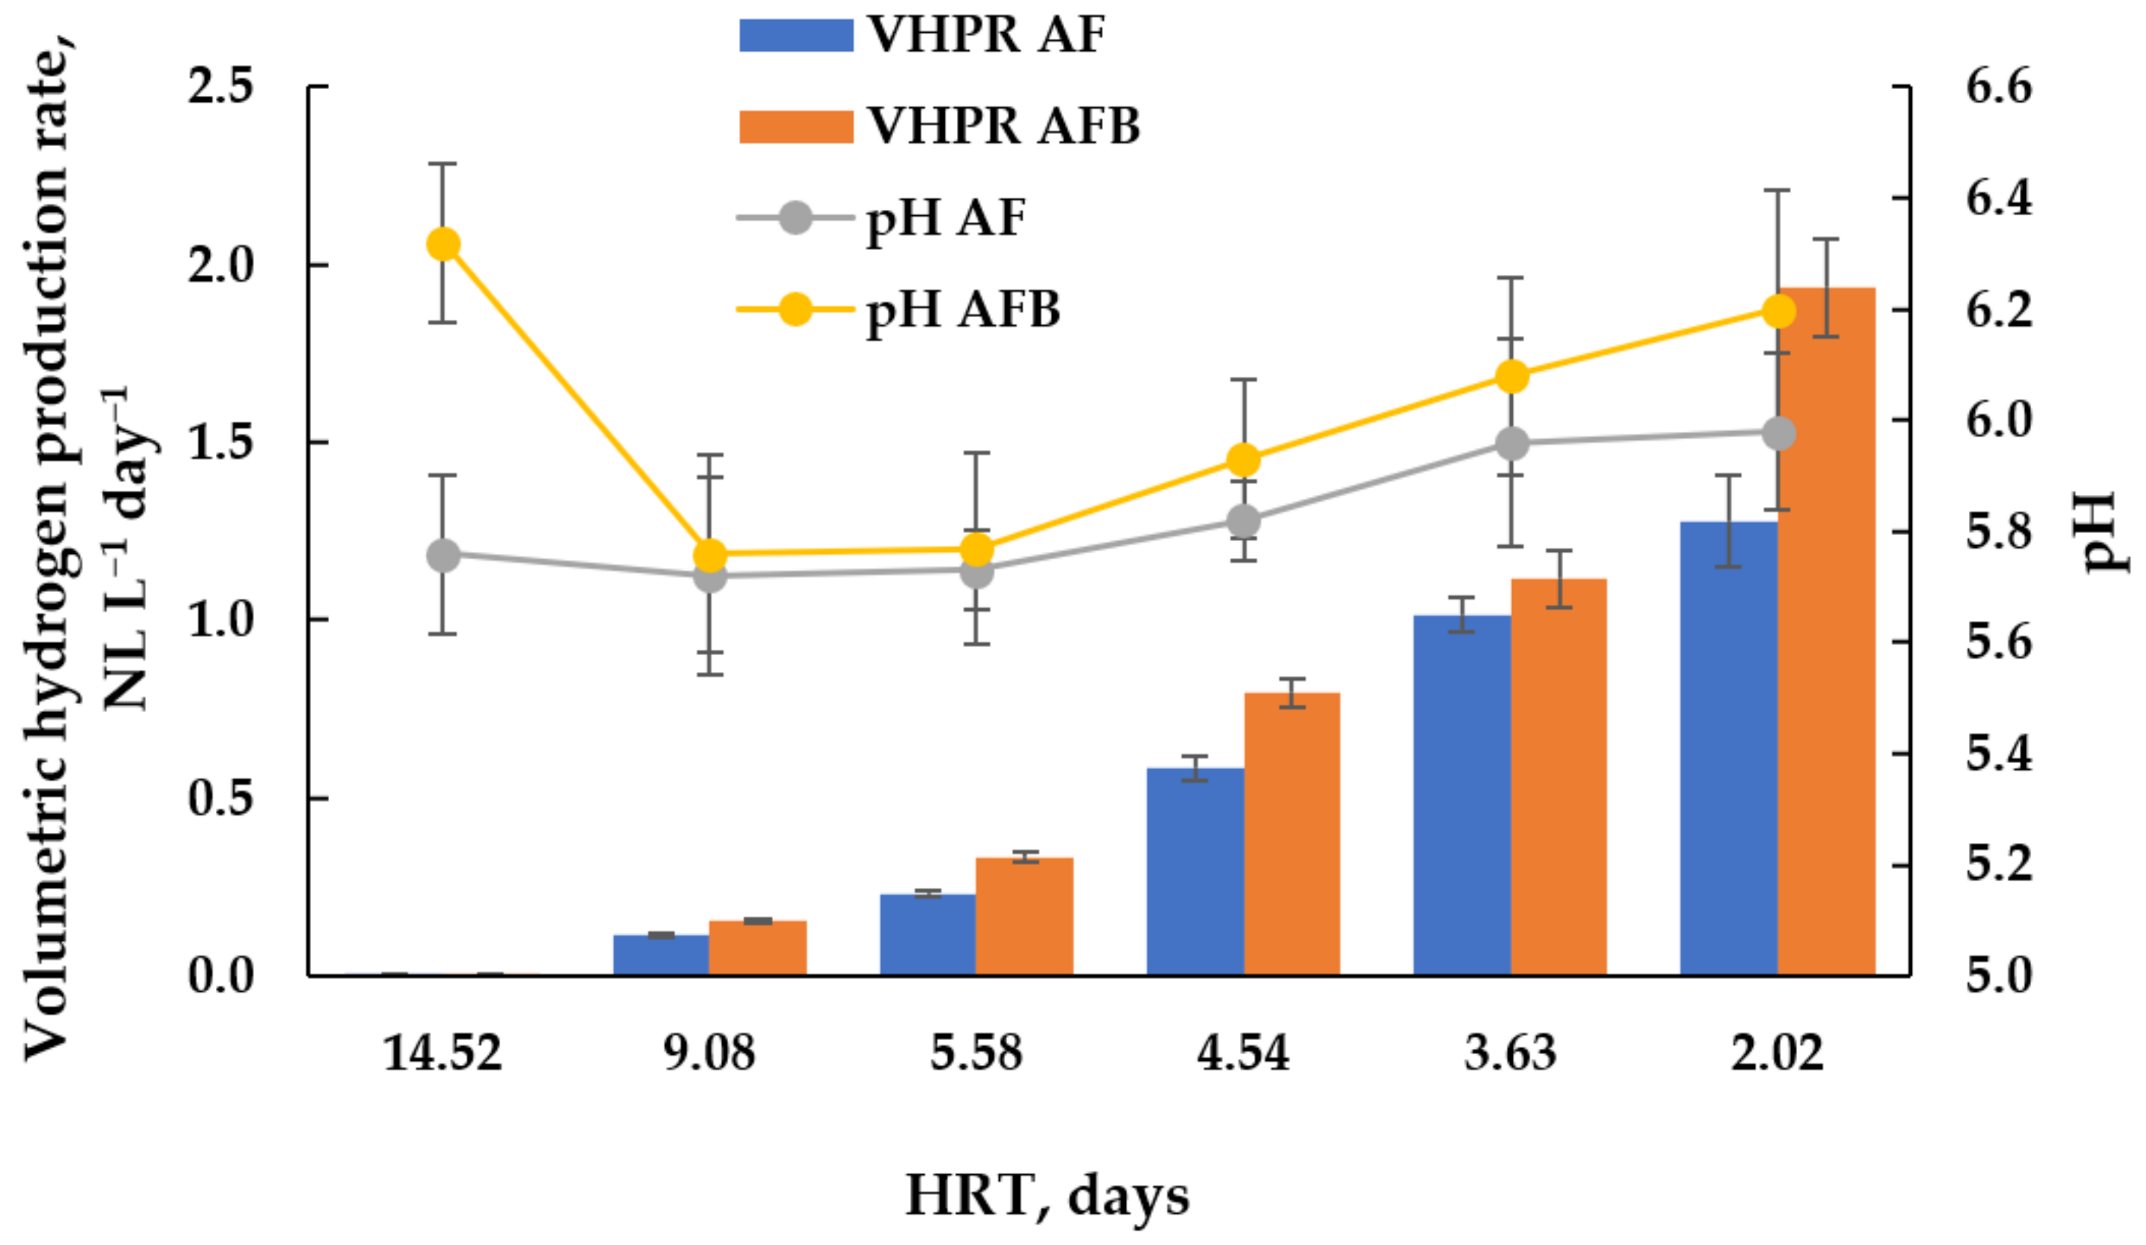
With a further decrease in HRT to 2.02 days and an increase in OLR, the amount of hydrogen in the biogas began to decrease to 41% (AF) and 44% (AFB). It was found that for both reactors, the hydrogen content in the biogas differed by no more than 3%, while the methane content in AFB was lower than in AF throughout the experiment. It should also be noted that the volumetric hydrogen production rate (VHPR) for AFB was higher throughout the experiment than for AF, which was especially noticeable at HRT = 2.02 days, at which time the VHPR was 1.3 and 1.9 NL/(L day), respectively for AF and AFB (Figure 5).
The pH did not drop below 5.29 in both reactors. It was found that with a gradual decrease in HRT and, accordingly, an increase in OLR in both reactors, there was a slight decrease in the pH value, followed by a gradual increase. In AFB the pH value was always higher than in AF. According to experimental data, the highest hydrogen yield of 178 mL/g COD (AFB) and 149 mL/g COD (AF) was obtained at HRT of 4.5 days and OLR of 6.61 kg COD/(m3 day) (Figure 6).

3.3. AF and AFB Microbial Community at the End of the Start-Up

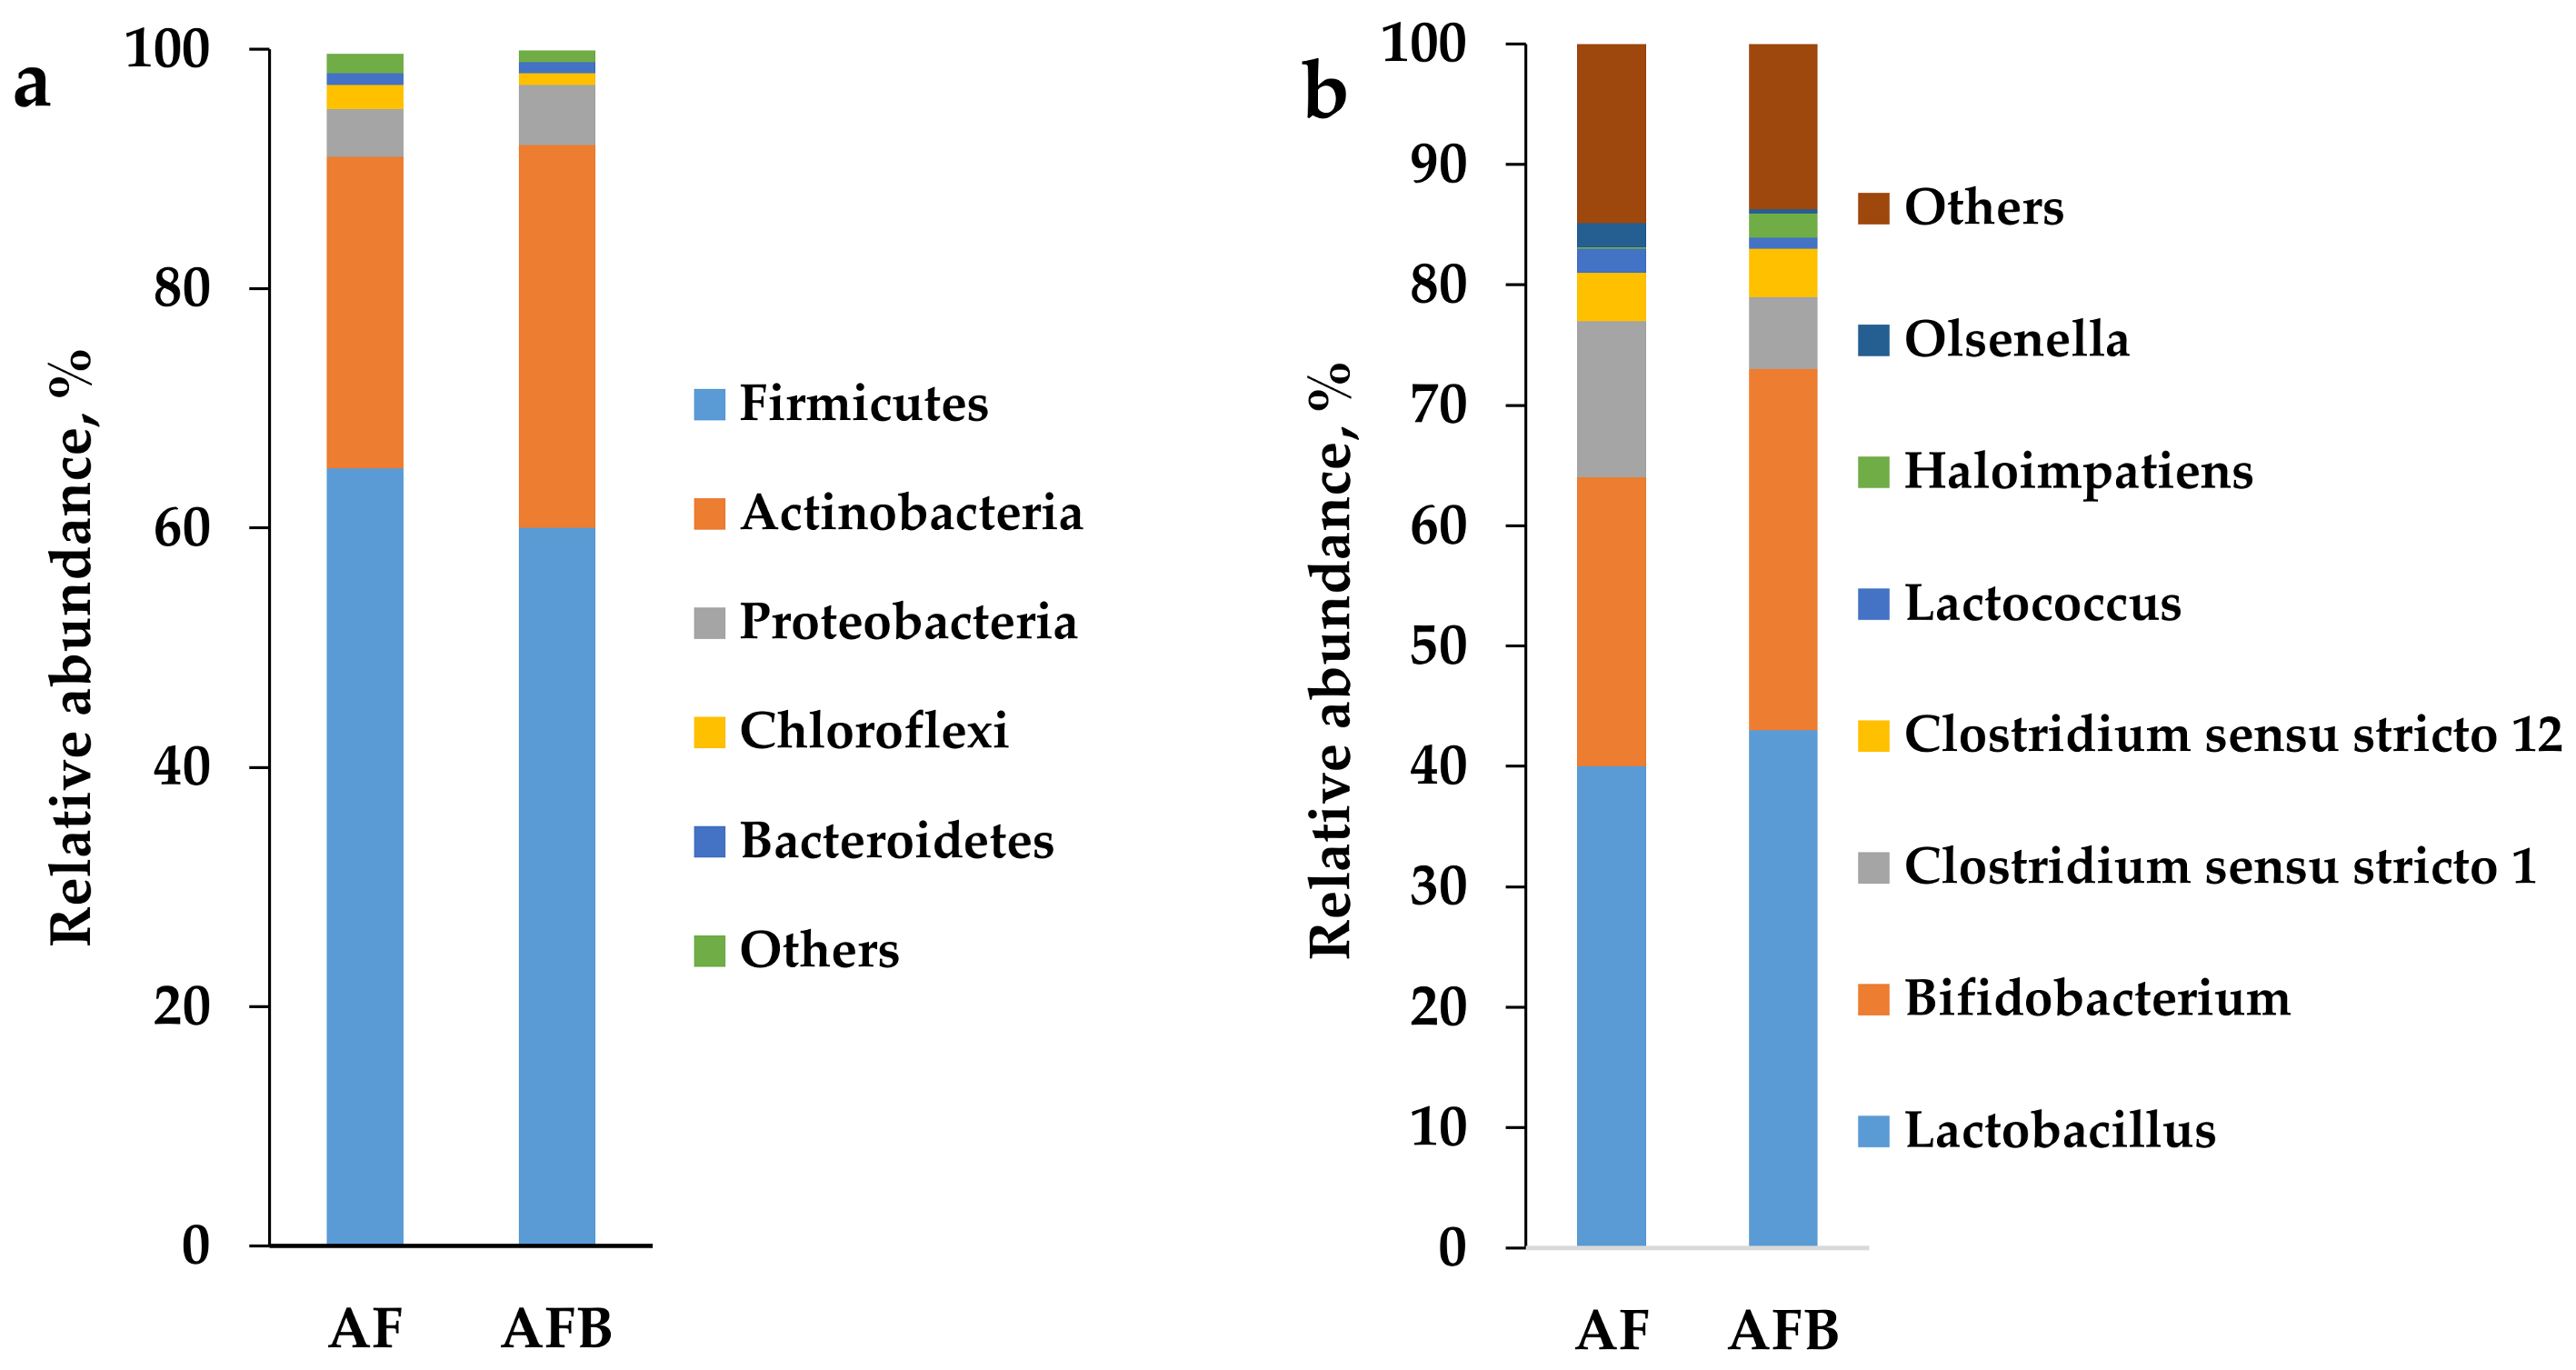
To assess the influence of the carrier type (fixed for AF or moving for AFB) on the composition of the microbial community at the end of the experiment (HRT of 2.02 days), samples of biomass on polyurethane carriers from AF and AFB were taken, in which phylogenetic analyses of the 16S rRNA gene sequences at the phylum and genus levels were carried out. The results of high-throughput sequencing are presented in Figure 7.
In general, it can be noted that the microbial composition in AF and AFB did not significantly differ from each other. Bacteria of two main phyla dominated in the reactors—Firmicutes being the most prolific, and Actinobacteria. Firmicutes relative content was 65 and 60% in AF and AFB reactors, respectively. The second-largest representative, phylum Actinobacteria, accounted for 26 and 32% of the microbial community in AF and AFB, respectively. Representatives of Proteobacteria, Chloroflexi, and Bacteroidetes constituted a minor part (from 0.9 to 5%) of the AF and AFB microbial communities (Figure 7).
Representatives of Lactobacillus, belonging to Firmicutes, made up the largest part of the microbial community at the genus level, 43 and 40% in AF and AFB, respectively.
Representatives of Bifidobacterium of the phylum Actinobacteria accounted for 24 and 30% of the microbial community in AF and AFB, respectively.
Clostridia, namely Clostridium sensustricto 1 and Clostridium sensustricto 12, accounted for 13 and 4% of the microbial community in AF, and 6 and 4% of the microbial community in AFB, respectively.
The remaining bacteria species, including Lactococcus, Haloimpatiens, Olsenella, and others, constituted a minor (each less than 2%) part of the microbial community of AF and AFB.
The presence of a minor number of methanogenic archaea in the microbial community of the reactors, which amounted to 0.4% and 0.1% in AF and AFB, respectively, should also be noted. Methanobacterium (50% of archaea) dominated in the AF archaeal community, while Candidatus Methanoplasma (25% of archaea) and Methanothermobacter (13% of archaea) were present to a lesser extent. At the same time, Methanobacterium (75% of archaea) prevailed in the AFB archaean community, while Methanolinea and Methanosaeta were present in minor amounts (10% of each archaea).

4. Discussion

4.1. Inactivation of Methanogens in the Inoculum

Ren et al. [31] and Wang et al. [32] demonstrated that the pretreatment method affects the metabolic pathway and distribution pattern of microbial communities. The authors observed the formation of hydrogen and butyric acid after thermal inactivation and treatment with alkali. In the presented work, the formation of hydrogen was also observed after thermal inactivation of the inoculums, but the content of butyric acid in the medium was less than in the control. It was described that the highest hydrogen production was observed at pH 7.0 [33]. It was also found that acetate is an inhibitor of the hydrogen production process even at neutral pH values. In the aforementioned surveys, the primary inhibition of the biohydrogen production process occurred at an acetate concentration of 50 mM, whereas at an acetate concentration of 200 mM, the formation of hydrogen (36 mL/gVSadded) decreased six times. At an acetate concentration of 5–25 mM, the hydrogen yield was 250 mL/gVSadded.
The composition of the VFAs formed during DF of CW indicated the predominant process of butyric acid fermentation. This type of metabolism is being performed mainly by Clostridium representatives, such as C. Pasteurianum, C. Buryricum, C. Acetobutylicum, C. Pectinovorum [34], as well as the inhabitants of the rumen of the ruminant protists Butyrivibrio and bacteria of the human intestinal microflora Eubacterium and Fusobacterium [35]. Acetate and butyrate are considered one of the main products of acidogenesis during glucose fermentation [5]. As a result of the decomposition of glucose by the glycolytic pathway, carbon dioxide, hydrogen and acetic acid are formed. This path is the more energy-efficient since four mol of ATP per mol of glucose are produced (two mol in glycolysis reactions, two more—during the formation of acetic acid). However, this pathway has two significant drawbacks: firstly, glucose metabolism along this pathway leads to very sharp acidification of the medium, which was observed in reactors with inoculum 1 and inoculum 2 after acid treatment, as a result of which bacterial growth can be inhibited. Secondly, this pathway does not allow oxidation of reduced electron carriers NADH formed during glycolysis. In the second way, the final product is butyric acid. The formation of butyric acid makes it possible to lessen the decrease in pH, which was observed in control 2. If, as a result of the release of organic acids in the process of butyric acid fermentation, the pH drops below 4.4, a metabolic pathway is activated in bacteria, the end products of which are ethanol, acetone and butanol (in this study were not analyzed).
Thus, it is impossible to unequivocally answer which of the inactivation methods was the best. However, the work performed allowed us to assume that heat treatment is of low efficiency for a thermophilic inoculum, even though thermophilic methanogens are more sensitive to temperature fluctuations [36]. The mesophilic anaerobic inoculum was sensitive to both acidic and thermal inactivation of methanogens. Xiao et al. [37] also compared methods for inactivation of methanogens using a glucose solution as a substrate and found that heat shock treatment promoted the maximum rate of hydrogen production. Consumers of hydrogen in the anaerobic inoculum (lactic acid bacteria, homoacetogens, methanogens and sulfur-reducing bacteria) not only act as competitors for hydrogen producers but also synthesize by-products that can influence the growth of hydrogen-producing bacteria. For example, the release of a protein toxin (bacteriocin) by lactate-producing bacteria acts as a suppressor for hydrogen production and microbial growth [38].
Thus, when a mixed culture of microorganisms is used as an inoculum, the pretreatment step plays an important role in ensuring the efficiency of hydrogen production from using mixed consortia.

4.2. DF of CW in Continuous Mode in Two Types of Reactors

Summarizing the results obtained, it can be noted that the most optimal mode for obtaining the maximum specific yield of hydrogen, amounting to 178 mL/g COD and 149 mL/g COD for AFB and AF, respectively, was obtained at HRT of 4.5 days and OLR of 6.61 kg COD/(m3 day). At the same time, for the maximum hydrogen production rate of 1.28 and 1.9 NL/(L day) for AF and AFB, respectively, it was necessary to maintain the minimum HRT of 2.02 days (Figure 5), at which OLR was maximal (Figure 6). In the only work, similar polyurethane foam was used as a carrier for obtaining biohydrogen from CW [35]. A packed bed reactor was used, which is identical in principle to the AF (Figure 1b), since the recirculation rate in the reactor was relatively low, not allowing the carrier to be kept in fluidized form. Under semi-continuous operation the maximum hydrogen yield (HY) achieved was 48.4 mL H2/g COD when using synthetic whey as substrate at an HRT of 2 days, which was 3 times lower than the HY observed in our work, probably due to less complete transformation of lactose. At the same time, when using real CW, the hydrogen yield was significantly lower (up to 25 mL H2/g COD). The maximum hydrogen concentration in biogas was 26.3% at OLR of 12.5 kg COD/(m3 d) and HRT of 2 days. The authors of the work note that an increase in OLR up to 20 kg COD/(m3 d) led to a significant decrease of hydrogen in biogas [39]. When using polyurethane foam, which is 90% air, as a carrier, we recorded a maximum hydrogen concentration in biogas of 54% (AF) and 53% (AFB) at HRT = 4.54 d and OLR = 6.61 kg COD/(m3 d).
Three different organic loading rates of 22, 33 and 37 kg COD/(m3 d), which were much higher than in our work, were used at a fixed HRT of 24 h [19]. The increase of the OLR from the initial value of 22 kg COD/(m3 d) to a value of 37 kg COD/(m3 d) and the adjustment of the pH to values greater than pH 5 had a positive effect on the hydrogen production and values of up to 1 NL H2/(L d) were achieved, which is lower than the maximum values that were obtained in our work. VHPR data similar to our data was obtained in [40], which, when fermenting CW in the anaerobic structured-bed reactor (ASTBR) at 25 °C, OLR of 24 kg COD/(m3 d) and HRT of 24 h, reached VHPR of 1.6 ± 0.7 NL H2/(L d). At the same time, in a number of studies, extremely high VHPRs were observed. For example, when using cheese whey powder (CWP) as a substrate in a batch experiment, a maximum VHPR of 4.35 NLH2/(L d) (or 8.1 mmol H2/(L h)) was attained at pH 7.5 and 25 g CWP/L [41].
It should be noted that in our work AFB performed better than AF. We attribute this to the fact that the AFB configuration provides better mass transfer and the absence of stagnant zones within the reactor, which may have contributed to the improved results in terms of biohydrogen production compared to conventional packed bed reactors. Fernandes et al. [42] and Lee et al. [43] observed that reactors with a higher porosity layer (more than 90%) promote the periodic removal of suspended biomass while allowing immobilized biomass to grow, resulting in increased biohydrogen production.
If methane is generated during continuous operation of the DF process, HRT control is recommended to suppress methanogenic activity and increase biohydrogen yield. Yun et al. showed that with a decrease in HRT from 24 h to 12 h for 13–22 days in a CSTR reactor fermenting molasses wastewater, the hydrogen content can be increased from 5.9% to 12.1% [44]. Our results indicated an increase in the amount of methane generated in the reactor with a decrease in HRT from 9.08 days to 5.58 days for AFB and to 4.54 days for AF within 5–9 days and an increase in OLR load from 3.31 to 6.61 kg COD/(m3 d) (Figure 4). With a subsequent decrease in HRT, a decrease in the methane content in the biogas was observed. However, the pH value in the reactors gradually increased, despite the increase in OLR to 14.88 kg COD/(m3 d). Perhaps one of the reasons for the decrease in methane production was an increase in the content of lactic acid (no data available) supplied with new portions of the substrate (CW) [45] and lactic acid bacteria [46] as the substrate was not sterilized before feeding. Since lactic acid bacteria consume hydrogen, this also explains the decrease in the biohydrogen content in biogas with an increase in OLR. Thus, it can be concluded that the thermal pretreatment (30 min at 90 °C) of inoculum 2 did not lead to the complete elimination of methanogens when it was used for continuous DF of CW in both reactors.

4.3. AF and AFB Microbial Community at the End of the Start-Up

Firmicutes dominate in the overwhelming majority of microbial communities in DF systems of various wastes, including those processing CW [21], with Clostridia being the largest producer, and Thermoanaerobacterium being an important representative of thermophilic communities [17,47].
Interestingly, Actinobacteria are not so common in DF systems, while relatively recently it was shown that their representative Streptomyces rubiginosus can produce hydrogen from sugarcane molasses [48].
During the course of DF of CW, Lactobacillus accounted for 50% of the microbial community [49]. Even though the hydrogen yield when using Lactobacillus acidophilus as biohydrogen producer was rather low (2 mol/mol lactose), the DF of CW was accompanied by the accumulation of valuable metabolites in the form of organic acids, including pyruvate, propionate, acetate, lactate, formate, and butyrate [24].
During the start-up of the reactor for the combined DF of vegetable and fruit waste and CW, Lactobacillus constituted the overwhelming part (72%) of the microbial community with a minor content of Bifidobacterium (6%). However, after adaptation to a high concentration of lactose, Bifidobacterium (85.4%) began to dominate in the microbial community, almost eliminating Lactobacillus (0.97%) [50].
The dominance of Bifidobacterium and Clostridium was observed during DF of starch, where Bifidobacterium represented 40–60% of the total microbial population, while Clostridium accounted for about 40% [51]. The authors hypothesized the existence of a symbiotic relationship, in which Bifidobacterium members first break down starch into monomers, which are then used by Clostridium species to produce biohydrogen [51].
We have also noted that at the end of the start-up period, the relative number of methanogenic archaea in AFB (0.1%) was lower than in AF (0.4%). This data correlated well with a higher specific hydrogen yield (30% more in AFB) (Figure 6) and VHPR (32% more in AFB) (Figure 5) at the end of the start-up period. At the same time, the hydrogen content in biogas in AFB was 31% lower than in AF. Thus, better mixing in the reactor increased the efficiency of biohydrogen production from CW, which was explained by better mass transfer and less formation of stagnant zones where hydrogen-scavengers such as methanogens could develop. At the same time, the hydrogen content in biogas decreased with a higher recirculation rate.

5. Conclusions

This work provides preliminary insights into the nature of the acid and heat pretreatments used for the inactivation of methanogenic archeae in anaerobic sludge in order to achieve the higher production of biohydrogen during batch and continuous DF of CW under mesophilic condition. According to the results, acid treatment was effective for thermophilic inoculum to suppress methanogenic activity, and heat treatment was effective for mesophilic inoculum. The composition of the VFA formed during DF of CW using pretreated inoculums suggested that the predominant metabolite during the process was the butyric acid.
The characteristics of continuous DF process of CW biodegradation under mesophilic conditions in AF and AFB using a polyurethane carrier for immobilization of heat-pretreated mesophilic anaerobic sludge (inoculum) were obtained. With a gradual stepwise decrease in HRT from 14.52 to 2.02 days and a corresponding increase in OLR from 2.07 to 14.88 kg COD/(m3 day), the optimal mode for obtaining the maximum specific yields of hydrogen, namely 178 mL/g COD and 149 mL/g COD for AFB and AF, respectively, were obtained at HRT of 4.5 days and OLR of 6.61 kg COD/(m3 day). At the same time, the maximum biohydrogen production rates of 1.28 and 1.9 NL/(L day) for AF and AFB, respectively, were obtained with a minimum HRT of 2.02 days at which the OLR was maximum (14.88 kg COD/(m3 d)).
The microbial composition in AF and AFB did not significantly differ from each other. Firmicutes (65% in AF and 60% in AFB) and Actinobacteria (26% in AF and 32% in AFB) were the two most dominant taxa at the phylum level. Representatives of Lactobacillus and Bifidobacterium made up the largest part of the microbial community at the genus level, 43 and 24% in AF, and 40% and 30% in AFB, respectively. At the end of the start-up period, the relative number of methanogenic archaea in AFB (0.1%) was lower than in AF (0.4%) and such elimination of hydrogen scavengers may explain why a higher specific biohydrogen yield and VHPR were obtained in AFB. Better mixing in the reactor increased the efficiency of biohydrogen production from CW, possibly due to better mass transfer, while recirculation negatively influenced on the hydrogen content in the biogas.
Using cheese whey as a substrate for biohydrogen production, the main technological parameters (HRT, OLR) were determined, which ensure the stable operation of anaerobic reactors (AF and AFB with polyurethane foam as a carrier) at the start-up, which can be used in the practical implementation of this process further on an industrial scale.

Author Contributions

Conceptualization, E.R.M. and I.V.K.; methodology, I.V.K. and A.A.K.; software, V.P. and U.F.; validation, A.N.N.; formal analysis, I.V.K. and A.A.K.; investigation, E.R.M. and I.V.K.; resources, D.A.K.; data curation, Y.V.L.; writing—E.R.M., I.V.K. and Y.V.L.; writing—review and editing, Y.V.L. and A.A.K.; visualization, E.R.M. and I.V.K.; supervision, Y.V.L. and A.A.K.; project administration, E.R.M. and I.V.K.; funding acquisition, D.A.K. All authors have read and agreed to the published version of the manuscript.

Funding

This work was partially supported by the Federal State Budgetary Institution “Russian Foundation for Basic Research” as part of scientific project No. 18-29-25042.

Institutional Review Board Statement

Not applicable.

Informed Consent Statement

Not applicable.

Data Availability Statement

Not applicable.

Conflicts of Interest

The authors declare no conflict of interest.

References

  1. Carvalho, F.; Prazeres, A.R.; Rivas, J. Cheese whey wastewater: Characterization and treatment. Sci. Total Environ. 2013, 445–446, 385–396. [Google Scholar] [CrossRef]
  2. De Gioannis, G.; Friargiu, M.; Massi, E.; Muntoni, A.; Polettini, A.; Pomi, R.; Spiga, D. Biohydrogen production from dark fermentation of cheese whey: Influence of pH. Int. J. Hydrog. Energy 2014, 39, 20930–20941. [Google Scholar] [CrossRef]
  3. Çalli, B. Dark fermentative H2H2 production from xylose and lactose—Effects of on-line pH control. Int. J. Hydrog. Energy 2008, 33, 522–530. [Google Scholar] [CrossRef]
  4. Grossiord, B.; Vaughan, E.E.; Luesink, E.; De Vos, W.M. Genetics of galactose utilisation via the Leloir pathway in lactic acid bacteria. Le Lait 1998, 78, 77–84. [Google Scholar] [CrossRef] [Green Version]
  5. Kovalev, A.; Litti, Y.; Katraeva, I. Biohydrogen production in the two-stage process of anaerobic bioconversion of organic matter of liquid organic waste with recirculation of digister effluent. Int. J. Hydrog. Energy 2020, 45, 26831–26839. [Google Scholar] [CrossRef]
  6. Kothari, R. A critical review on factors influencing fermentative hydrogen production. Front. Biosci. 2017, 22, 1195–1220. [Google Scholar] [CrossRef] [PubMed] [Green Version]
  7. Davila-Vazquez, G.; Alatriste-Mondragón, F.; De Leon-Rodriguez, A.; Razo-Flores, E. Fermentative hydrogen production in batch experiments using lactose, cheese whey and glucose: Influence of initial substrate concentration and pH. Int. J. Hydrog. Energy 2008, 33, 4989–4997. [Google Scholar] [CrossRef]
  8. Akinbomi, J.; Wikandari, R.; Taherzadeh, M.J. Enhanced Fermentative Hydrogen and Methane Production from an Inhibitory Fruit-Flavored Medium with Membrane-Encapsulated Cells. Membranes 2015, 5, 616–631. [Google Scholar] [CrossRef] [Green Version]
  9. Andreani, C.L.; Torres, D.G.B.; Schultz, L.; De Carvalho, K.Q.; Gomes, S.D. Hydrogen production from cassava processing wastewater in an anaerobic fixed bed reactor with bamboo as a support material. Eng. Agríc. 2015, 35, 578–587. [Google Scholar] [CrossRef] [Green Version]
  10. Patra, A.; Park, T.; Kim, M.; Yu, Z. Rumen methanogens and mitigation of methane emission by anti-methanogenic compounds and substances. J. Anim. Sci. Biotechnol. 2017, 8, 1–18. [Google Scholar] [CrossRef] [Green Version]
  11. Kongjan, P.; O-Thong, S.; Angelidaki, I. Biohydrogen production from desugared molasses (DM) using thermophilic mixed cultures immobilized on heat treated anaerobic sludge granules. Int. J. Hydrog. Energy 2011, 36, 14261–14269. [Google Scholar] [CrossRef]
  12. Azbar, N.; Dokgöz, F.T.; Keskin, T.; Eltem, R.; Korkmaz, K.S.; Gezgin, Y.; Akbal, Z.; Öncel, S.; Dalay, M.C.; Gönen, Ç.; et al. Comparative Evaluation of Bio-Hydrogen Production from Cheese Whey Wastewater Under Thermophilic and Mesophilic Anaerobic Conditions. Int. J. Green Energy 2009, 6, 192–200. [Google Scholar] [CrossRef]
  13. Kargi, F.; Eren, N.S.; Ozmihci, S. Hydrogen gas production from cheese whey powder (CWP) solution by thermophilic dark fermentation. Int. J. Hydrog. Energy 2012, 37, 2260–2266. [Google Scholar] [CrossRef]
  14. Dębowski, M.; Korzeniewska, E.; Filipkowska, Z.; Zieliński, M.; Kwiatkowski, R. Possibility of hydrogen production during cheese whey fermentation process by different strains of psychrophilic bacteria. Int. J. Hydrog. Energy 2014, 39, 1972–1978. [Google Scholar] [CrossRef]
  15. Badiei, M.; Jahim, J.M.; Anuar, N.; Abdullah, S.R.S. Effect of hydraulic retention time on biohydrogen production from palm oil mill effluent in anaerobic sequencing batch reactor. Int. J. Hydrog. Energy 2011, 36, 5912–5919. [Google Scholar] [CrossRef]
  16. Oh, S.-E.; Iyer, P.; Bruns, M.A.; Logan, B.E. Biological hydrogen production using a membrane bioreactor. Biotechnol. Bioeng. 2004, 87, 119–127. [Google Scholar] [CrossRef]
  17. Azbar, N.; Dokgöz, F.T.Ç.; Keskin-Gundogdu, T.; Korkmaz, K.S.; Syed, H.M. Continuous fermentative hydrogen production from cheese whey wastewater under thermophilic anaerobic conditions. Int. J. Hydrog. Energy 2009, 34, 7441–7447. [Google Scholar] [CrossRef]
  18. Castelló, E.; Santos, C.G.Y.; Iglesias, T.; Paolino, G.; Wenzel, J.; Borzacconi, L.; Etchebehere, C. Feasibility of biohydrogen production from cheese whey using a UASB reactor: Links between microbial community and reactor performance. Int. J. Hydrog. Energy 2009, 34, 5674–5682. [Google Scholar] [CrossRef]
  19. Perna, V.; Castelló, E.; Wenzel, J.J.; Zampol, C.; Lima, D.F.; Borzacconi, L.; Varesche, M.; Zaiat, M.; Etchebehere, C. Hydrogen production in an upflow anaerobic packed bed reactor used to treat cheese whey. Int. J. Hydrog. Energy 2013, 38, 54–62. [Google Scholar] [CrossRef]
  20. Rosa, P.R.F.; Santos, S.C.; Sakamoto, I.K.; Varesche, M.B.A.; Silva, E.L. Hydrogen production from cheese whey with ethanol-type fermentation: Effect of hydraulic retention time on the microbial community composition. Bioresour. Technol. 2014, 161, 10–19. [Google Scholar] [CrossRef]
  21. Ottaviano, L.M.; Ramos, L.R.; Botta, L.S.; Varesche, M.B.A.; Silva, E.L. Continuous thermophilic hydrogen production from cheese whey powder solution in an anaerobic fluidized bed reactor: Effect of hydraulic retention time and initial substrate concentration. Int. J. Hydrog. Energy 2017, 42, 4848–4860. [Google Scholar] [CrossRef]
  22. Bakonyi, P.; Nemestóthy, N.; Simon, V.; Bélafi-Bakó, K. Review on the start-up experiences of continuous fermentative hydrogen producing bioreactors. Renew. Sustain. Energy Rev. 2014, 40, 806–813. [Google Scholar] [CrossRef] [Green Version]
  23. Lima, D.M.F.; Inoue, R.K.; Rodrigues, J.A.D.; Ratusznei, S.M.; Zaiat, M. Biohydrogen from Cheese whey Treatment in an AnSBBR: Achieving Process Stability. Braz. J. Chem. Eng. 2015, 32, 397–408. [Google Scholar] [CrossRef] [Green Version]
  24. Pandey, A.; Srivastava, S.; Rai, P.; Duke, M. Cheese whey to biohydrogen and useful organic acids: A non-pathogenic microbial treatment by L. acidophilus. Sci. Rep. 2019, 9, 1–9. [Google Scholar] [CrossRef] [PubMed]
  25. Mikheeva, E.R.; Katraeva, I.V.; Vorozhtsov, D.L.; Litti, Y.V.; Nozhevnikova, A.N. Efficiency of Two-Phase Anaerobic Fermentation and the Physicochemical Properties of the Organic Fraction of Municipal Solid Waste Processed in a Vortex-Layer Apparatus. Appl. Biochem. Microbiol. 2020, 56, 736–742. [Google Scholar] [CrossRef]
  26. Lever, M.A.; Etorti, A.; Eeickenbusch, P.; Michaud, A.B.; Antl-Temkiv, T.; Jørgensen, B.B. A modular method for the extraction of DNA and RNA, and the separation of DNA pools from diverse environmental sample types. Front. Microbiol. 2015, 6, 476. [Google Scholar] [CrossRef] [PubMed] [Green Version]
  27. Fadrosh, D.W.; Ma, B.; Gajer, P.; Sengamalay, N.; Ott, S.; Brotman, R.M.; Ravel, J. An improved dual-indexing approach for multiplexed 16S rRNA gene sequencing on the Illumina MiSeq platform. Microbiome 2014, 2, 6. [Google Scholar] [CrossRef] [Green Version]
  28. Caporaso, J.G.; Lauber, C.L.; Walters, W.A.; Berg-Lyons, D.; Huntley, J.; Fierer, N.; Owens, S.M.; Betley, J.; Fraser, L.; Bauer, M.; et al. Ultra-high-throughput microbial community analysis on the Illumina HiSeq and MiSeq platforms. ISME J. 2012, 6, 1621–1624. [Google Scholar] [CrossRef] [Green Version]
  29. Caporaso, J.G.; Kuczynski, J.; Stombaugh, J.; Bittinger, K.; Bushman, F.D.; Costello, E.K.; Fierer, N.; Peña, A.G.; Goodrich, J.K.; Gordon, J.I.; et al. QIIME allows analysis of high-throughput community sequencing data. Nat. Methods 2010, 7, 335–336. [Google Scholar] [CrossRef] [Green Version]
  30. Quast, C.; Pruesse, E.; Yilmaz, P.; Gerken, J.; Schweer, T.; Yarza, P.; Peplies, J.; Glöckner, F.O. The SILVA ribosomal RNA gene database project: Improved data processing and web-based tools. Nucleic Acids Res. 2013, 41, D590–D596. [Google Scholar] [CrossRef]
  31. Ren, N.-Q.; Guo, W.-Q.; Wang, X.-J.; Xiang, W.-S.; Liu, B.-F.; Ding, J.; Chen, Z.-B. Effects of different pretreatment methods on fermentation types and dominant bacteria for hydrogen production. Int. J. Hydrog. Energy 2008, 33, 4318–4324. [Google Scholar] [CrossRef]
  32. Wang, J.; Wan, W. Comparison of different pretreatment methods for enriching hydrogen-producing bacteria from digested sludge. Int. J. Hydrog. Energy 2008, 33, 2934–2941. [Google Scholar] [CrossRef]
  33. Liu, D. Bio-Hydrogen Production by Dark Fermentation from Organic Wastes and Residues. Ph.D. Thesis, Technical University of Denmark, Kongens Lyngby, Denmark, 2008. [Google Scholar]
  34. Ruggeri, B.; Tommasi, T.; Sanfilippo, S. BioH2 & BioCH4 through Anaerobic Digestion, 1st ed.; Springer: London, UK, 2015; p. 218. [Google Scholar]
  35. Bundhoo, M.Z.; Mohee, R. Inhibition of dark fermentative bio-hydrogen production: A review. Int. J. Hydrog. Energy 2016, 41, 6713–6733. [Google Scholar] [CrossRef]
  36. Wang, S.; Ma, F.; Ma, W.; Wang, P.; Zhao, G.; Lu, X. Influence of Temperature on Biogas Production Efficiency and Microbial Community in a Two-Phase Anaerobic Digestion System. Water 2019, 11, 133. [Google Scholar] [CrossRef] [Green Version]
  37. Xiao, L.; Deng, Z.; Fung, K.Y.; Ng, K.M. Biohydrogen generation from anaerobic digestion of food waste. Int. J. Hydrog. Energy 2013, 38, 13907–13913. [Google Scholar] [CrossRef]
  38. Noike, T. Inhibition of hydrogen fermentation of organic wastes by lactic acid bacteria. Int. J. Hydrog. Energy 2002, 27, 1367–1371. [Google Scholar] [CrossRef]
  39. Fernández, C.; Carracedo, B.; Martínez, E.J.; Gómez, X.; Morán, A. Application of a packed bed reactor for the production of hydrogen from cheese whey permeate: Effect of organic loading rate. J. Environ. Sci. Health Part A 2013, 49, 210–217. [Google Scholar] [CrossRef]
  40. Blanco, V.; Oliveira, G.H.D.; Zaiat, M. Dark fermentative biohydrogen production from synthetic cheese whey in an anaerobic structured-bed reactor: Performance evaluation and kinetic modeling. Renew. Energy 2019, 139, 1310–1319. [Google Scholar] [CrossRef]
  41. Davila-Vazquez, G.; Cota-Navarro, C.B.; Rosales-Colunga, L.M.; De Leon-Rodriguez, A.; Razo-Flores, E. Continuous biohydrogen production using cheese whey: Improving the hydrogen production rate. Int. J. Hydrog. Energy 2009, 34, 4296–4304. [Google Scholar] [CrossRef]
  42. Fernandes, B.S.; Saavedra, N.K.; Maintinguer, S.I.; Sette, L.D.; Oliveira, V.M.; Varesche, M.B.A.; Zaiat, M. The Effect of Biomass Immobilization Support Material and Bed Porosity on Hydrogen Production in an Upflow Anaerobic Packed-Bed Bioreactor. Appl. Biochem. Biotechnol. 2013, 170, 1348–1366. [Google Scholar] [CrossRef]
  43. Lee, K.-S.; Lo, Y.-S.; Lo, Y.-C.; Lin, P.-J.; Chang, J.-S. H2 production with anaerobic sludge using activated-carbon supported packed-bed bioreactors. Biotechnol. Lett. 2003, 25, 133–138. [Google Scholar] [CrossRef] [PubMed]
  44. Yun, J.H.; Cho, K.-S. Effect of hydraulic retention time on suppression of methanogens during a continuous biohydrogen production process using molasses wastewater. J. Environ. Sci. Health Part A 2016, 52, 1–8. [Google Scholar] [CrossRef]
  45. Zhang, B.; Cai, W.-M.; He, P.-J. Influence of lactic acid on the two-phase anaerobic digestion of kitchen wastes. J. Environ. Sci. 2007, 19, 244–249. [Google Scholar] [CrossRef]
  46. Doyle, N.; Mbandlwa, P.; Kelly, W.J.; Attwood, G.; Li, Y.; Ross, R.P.; Stanton, C.; Leahy, S.C. Use of Lactic Acid Bacteria to Reduce Methane Production in Ruminants, a Critical Review. Front. Microbiol. 2019, 10, 2207. [Google Scholar] [CrossRef] [PubMed] [Green Version]
  47. Cisneros-Pérez, C.; Carrillo-Reyes, J.; Celis, L.B.; Alatriste-Mondragón, F.; Etchebehere, C.; Razo-Flores, E. Inoculum pretreatment promotes differences in hydrogen production performance in EGSB reactors. Int. J. Hydrog. Energy 2015, 40, 6329–6339. [Google Scholar] [CrossRef]
  48. Sivarajan, A.; Shanmugasundaram, T.; Thirumalairaj, J.; Balagurunathan, R. Production and optimization of biohydrogen from saccharolytic actinobacterium, Streptomyces rubiginosus (SM16), using sugarcane molasses. Biofuels 2016, 8, 717–723. [Google Scholar] [CrossRef]
  49. Yang, P.; Zhang, R.; McGarvey, J.; Benemann, J. Biohydrogen production from cheese processing wastewater by anaerobic fermentation using mixed microbial communities. Int. J. Hydrog. Energy 2007, 32, 4761–4771. [Google Scholar] [CrossRef]
  50. Gomez-Romero, J.; Gonzalez-Garcia, A.; Chairez, I.; Torres, L.G.; García-Peña, E. Selective adaptation of an anaerobic microbial community: Biohydrogen production by co-digestion of cheese whey and vegetables fruit waste. Int. J. Hydrog. Energy 2014, 39, 12541–12550. [Google Scholar] [CrossRef]
  51. Cheng, C.-H.; Hung, C.-H.; Lee, K.-S.; Liau, P.-Y.; Liang, C.-M.; Yang, L.-H.; Lin, P.-J.; Lin, C.-Y. Microbial community structure of a starch-feeding fermentative hydrogen production reactor operated under different incubation conditions. Int. J. Hydrog. Energy 2008, 33, 5242–5249. [Google Scholar] [CrossRef]
Figure 1. Schematic of a laboratory plant. (a)—AFB: 1-1—reactor vessel; 2-1—carrier; 3-1—substrate (CW); 4-1—feeding pump; 5-1—sampler; 6-1—recirculation pump; 7-1—effluent pump; 8-1—biogas counter; 9-1—water seal; 10-1—effluent; 11-1—biogas sampler. (b)—anaerobic biofilter (AF): 1-2—reactor vessel; 2-2—carrier; 3-2—substrate (CW); 4-2—feeding pump; 5-2—sampler; 6-2—recirculation pump; 7-2—effluent pump; 8-2—biogas counter; 9-2—water seal; 10-2—effluent; 11-2—biogas sampler.
Applsci 11 00510 g001
Figure 2. Content of hydrogen (a) and methane (b) in biogas.
Applsci 11 00510 g002
Figure 3. Production of VFA in reactors on days 0 (a), 2 (b) and 8 (c) of incubation. 1—control 1 (inoculum 1 without treatment); 2—inoculum 1 after acid inactivation; 3—inoculum 1 after thermal inactivation; 4—control 2 (inoculum 2 without treatment); 5—inoculum 2 after acid inactivation; 6—inoculum 2 after thermal inactivation.
Applsci 11 00510 g003
Figure 4. The concentration of hydrogen and methane in the biogas depending on hydraulic retention time (HRT).
Applsci 11 00510 g004
Figure 5. Change in the volumetric hydrogen production rate (VHPR) and pH in the anaerobic filter (AF) and anaerobic fluidized bed (AFB) depending on hydraulic retention time (HRT).
Applsci 11 00510 g005
Figure 6. Dependence of the hydrogen yield on the organic loading rate (OLR) for the anaerobic filter (AF) and anaerobic fluidized bed (AFB).
Applsci 11 00510 g006
Figure 7. Compositions of microbial communities of anaerobic filter (AF) and anaerobic fluidized bed (AFB) at the phylum (a) and genus (b) levels.
Applsci 11 00510 g007
Table 1. AF and AFB operating modes.
ParameterUnitsValue
Stage-S-IS-IIS-IIIS-IVS-VS-VI
TimeD1–3031–5051–6667–8081–9091–100
HRTD14.59.15.64.53.62
OLRkg COD/(m3 d)2.073.315.376.618.2614.88
Table 2. Characteristics of batch dark fermentation of cheese whey using acid and heat pretreated inoculums.
InoculumFinal pHH2 in Biogas Max, %CH4 in Biogas Max, %COD Removal, %
Inoculum 1 untreated (Control 1)6.67016.5 (5) *71.4
Inoculum 1 after acid pretreatment3.9433.3 (1) *065.2
Inoculum 1 after thermal pretreatment6.378.0 (2) *7.5 (8) *46.2
Inoculum 2 untreated (Control 2)5.49.3 (1) *20.1(1) *66.7
Inoculum 2 after acid pretreatment4.040.8 (1) *17.0 (1) *63.8
Inoculum 2 after thermal pretreatment3.9210.7 (1) *043.8
* Day of the experiment, COD—chemical oxygen demand.
Publisher’s Note: MDPI stays neutral with regard to jurisdictional claims in published maps and institutional affiliations.