Article

Convolutional Neural Network in the Evaluation of Myocardial Ischemia from CZT SPECT Myocardial Perfusion Imaging: Comparison to Automated Quantification

1
Department of Nuclear Medicine, Chang Gung Memorial Hospital, Kaohsiung Medical Center, Chang Gung University College of Medicine, Kaohsiung 833, Taiwan
2
Institute of Statistics, National Chiao Tung University, Hsinchu 300, Taiwan
*
Authors to whom correspondence should be addressed.
These authors contributed equally to this work.
Appl. Sci. 2021, 11(2), 514; https://doi.org/10.3390/app11020514
Submission received: 28 November 2020 / Revised: 25 December 2020 / Accepted: 28 December 2020 / Published: 7 January 2021
(This article belongs to the Special Issue Advanced Image Analysis and Processing for Biomedical Applications)

Abstract

:

Featured Application

Using convolutional neural network techniques to automatically diagnose coronary heart disease from CZT SPECT images.

Abstract

This study analyzes CZT SPECT myocardial perfusion images that are collected at Chang Gung Memorial Hospital, Kaohsiung Medical Center in Kaohsiung. This study focuses on the classification of myocardial perfusion images for coronary heart diseases by convolutional neural network techniques. In these gray scale images, heart blood flow distribution contains the most important features. Therefore, data-driven preprocessing is developed to extract the area of interest. After removing the surrounding noise, the three-dimensional convolutional neural network model is utilized to classify whether the patient has coronary heart diseases or not. The prediction accuracy, sensitivity, and specificity are 87.64%, 81.58%, and 92.16%. The prototype system will greatly reduce the time required for physician image interpretation and write reports. It can assist clinical experts in diagnosing coronary heart diseases accurately in practice.

1. Introduction

Heart disease is the leading cause of death globally, and coronary artery disease (CAD) is the most common type of heart disease. Over 20,000 people die from cardiovascular diseases annually. Mortality rate due to CAD is higher than other kinds of cardiovascular diseases. CAD occurs when the blood vessels supplying the heart muscle become hardened and narrowed. Reduction in the prevalence, morbidity, and mortality related to CAD is an important issue of public health given the significant burden of diseases and contribution to total costs of health care. Early detection of CAD may improve life expectancy and quality of life by preventing myocardial infarction (MI) and heart failure.
Noninvasive testing methods are used as first-line diagnostic and prognostic tools for patients presenting with chest pain or other symptoms of CAD to improve risk stratification of patients for CAD and to guide subsequent tests and interventions. Noninvasive diagnostics include functional tests such as exercise electrocardiography (ECG) [1], stress echocardiography [2], radionuclide myocardial perfusion imaging (MPI) using single photon emission computed tomography (SPECT), or positron emission tomography (PET) [3,4]. There are also noninvasive anatomic tests, including coronary CT angiography (CCTA) [5], coronary magnetic resonance angiography (MRA) [6], and coronary artery calcium scoring (CACS) [7].
SPECT MPI is a widely used technique for the risk stratification and diagnosis of CAD. There are software packages available for quantification of relative perfusion data using normal databases to define the summed stress score (SSS) and total perfusion deficit (TPD), such as 4DMSPECT (4DM) [8], Emory Cardiac Toolbox (ECTb), and Cedars-Sinai Quantitative Perfusion SPECT (QPS) [9]. Automated quantification has provided similar overall diagnostic accuracy when compared to visual interpretation by expert observers for the detection of obstructive CAD.
Recently developed MPI SPECT using a Cadmium Zinc Telluride (CZT) camera has proven highly efficient by reducing isotope dose and imaging time [10]. It maintains equal image quality and diagnostic accuracy as compared to MPI SPECT using a conventional gamma camera. Convolutional Neural Network (CNN) is a well-known deep learning architecture inspired by the natural visual perception mechanism of the living creatures. Due to the rapid application of deep learning in medicine [11]. Recently, nuclear cardiology has also started to adopt this technique. The deep learning approach includes an appropriate combination of features of abnormalities based on a large number of annotated images, and it differs from statistical approaches in software packages using regional count distribution based on means and deviations. By the literature review, there is only one published study addressing the application of CNN on the prediction of obstructive CAD, based on the classification of Technetium (Tc)-99m MPI images obtained from CZT cameras [12]. The purpose of this study is to propose a CNN-based model based on Thallium (Tl)-201 MPI SPECT images to predict myocardial ischemia and to compare the diagnostic accuracy of this model against automated software package grading. This research has obtained the IRB approval from Chang Gung Medical Foundation, IRB No. 201801122B0C501.

2. Methods

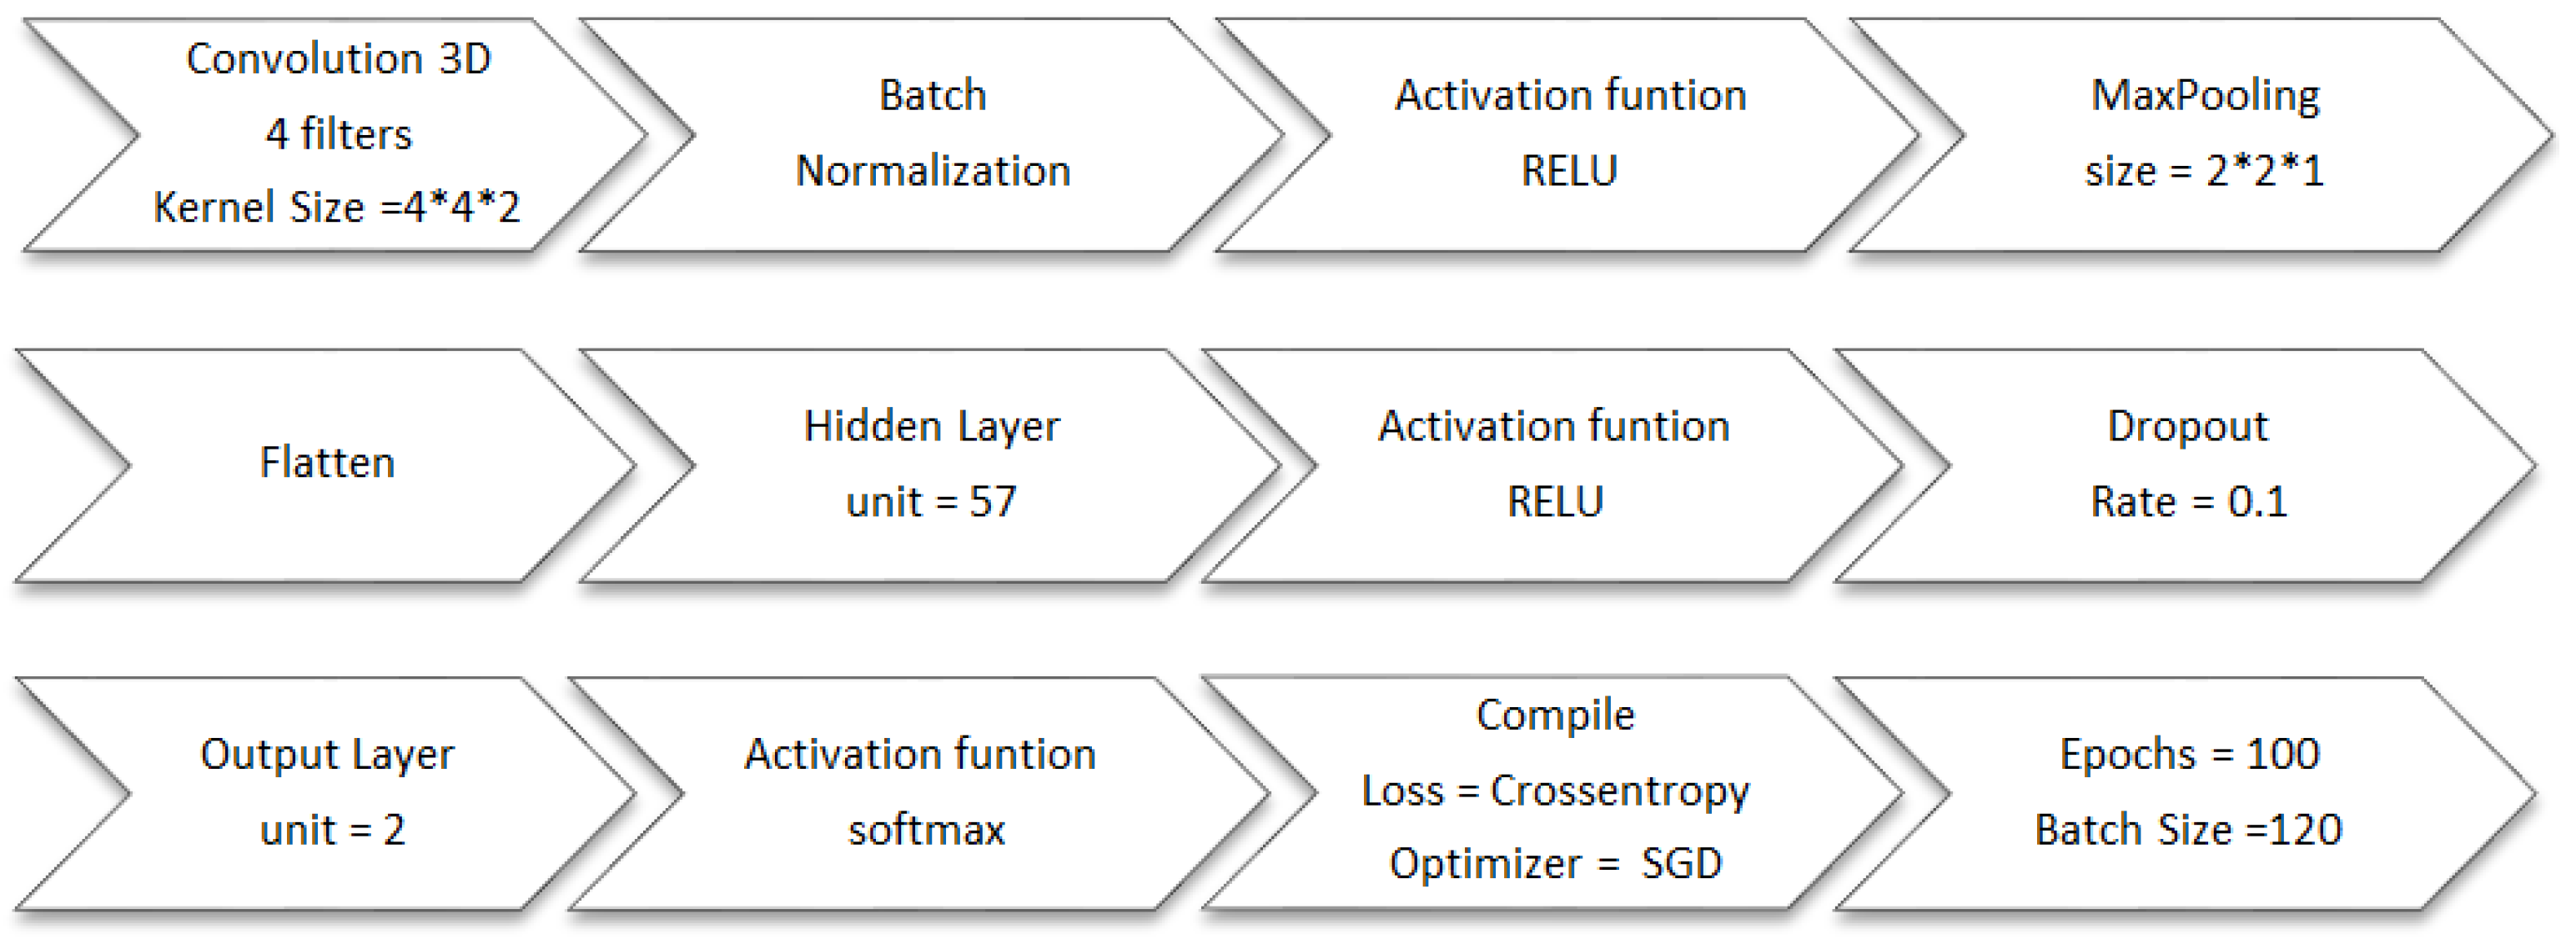
2.1. Image Preprocessing

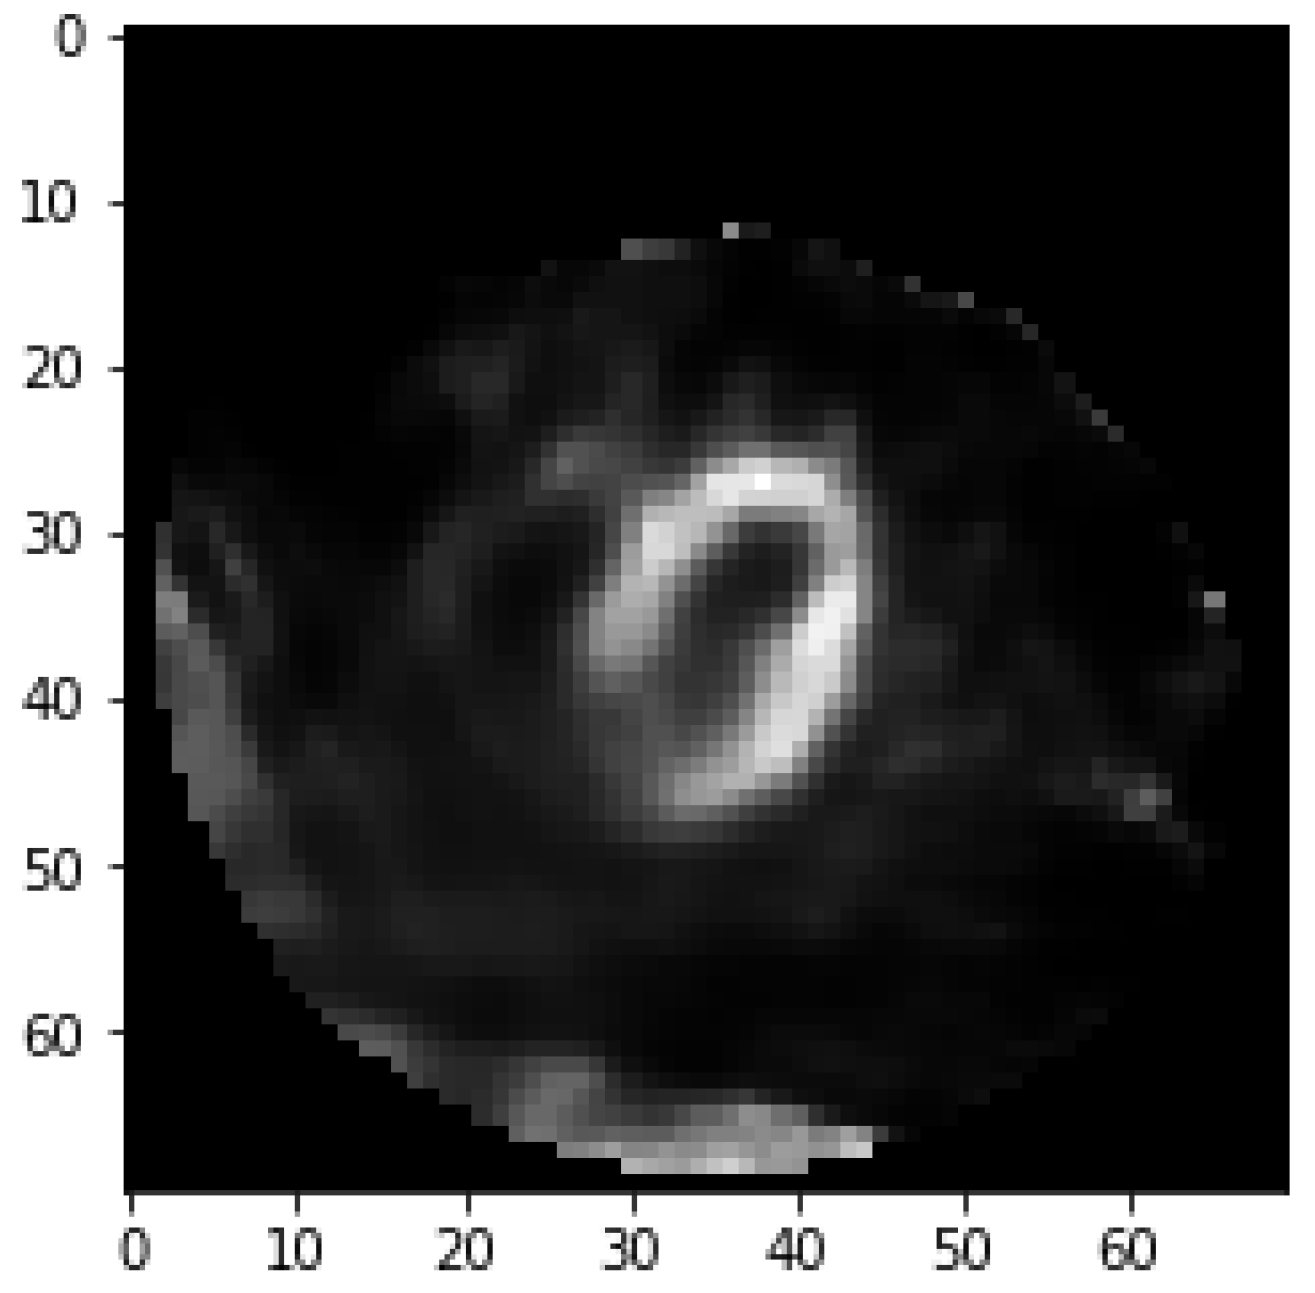
Fifty cross-sectional heart images are for each subject. The pixel for each image is 70 × 70. Myocardium that belongs to coronary artery has the circumference shape opening in lower left. In clinical diagnosis, doctors determine whether the subject has a myocardial defect based on the degree of saturation for the myocardium circumference area in the image. Subject tends to be healthy if the brightness in circumference shape is saturated that is shown in Figure 1.
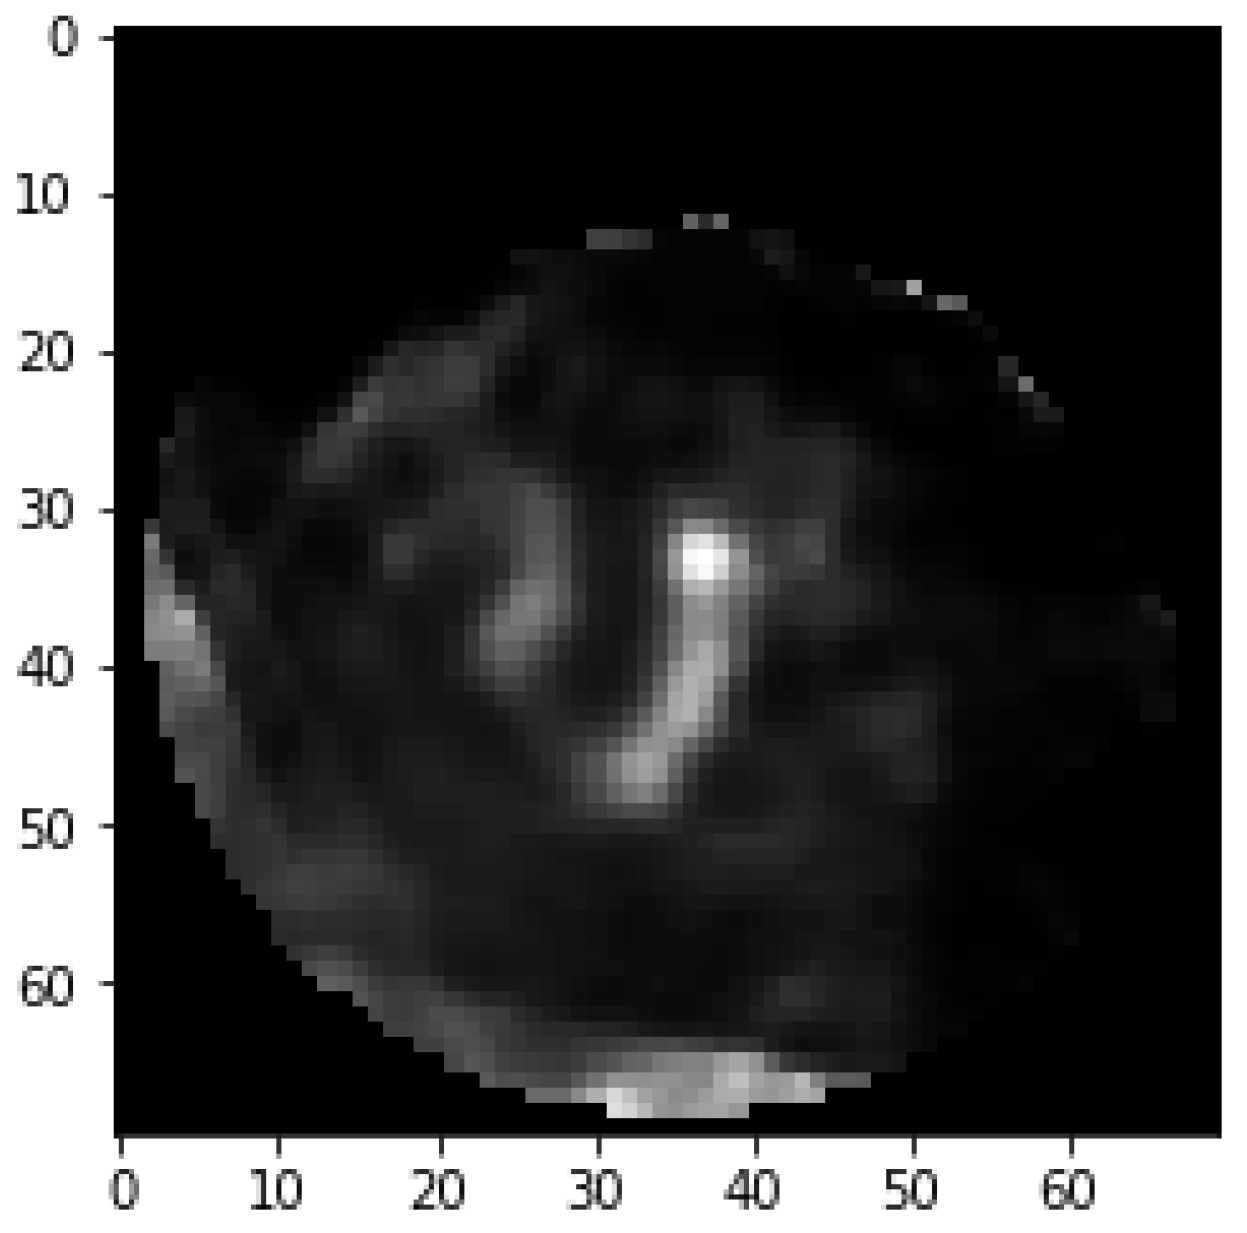
On the other hand, if there is an apparent dark part, it means that the subject suffers from coronary heart disease that is shown in 
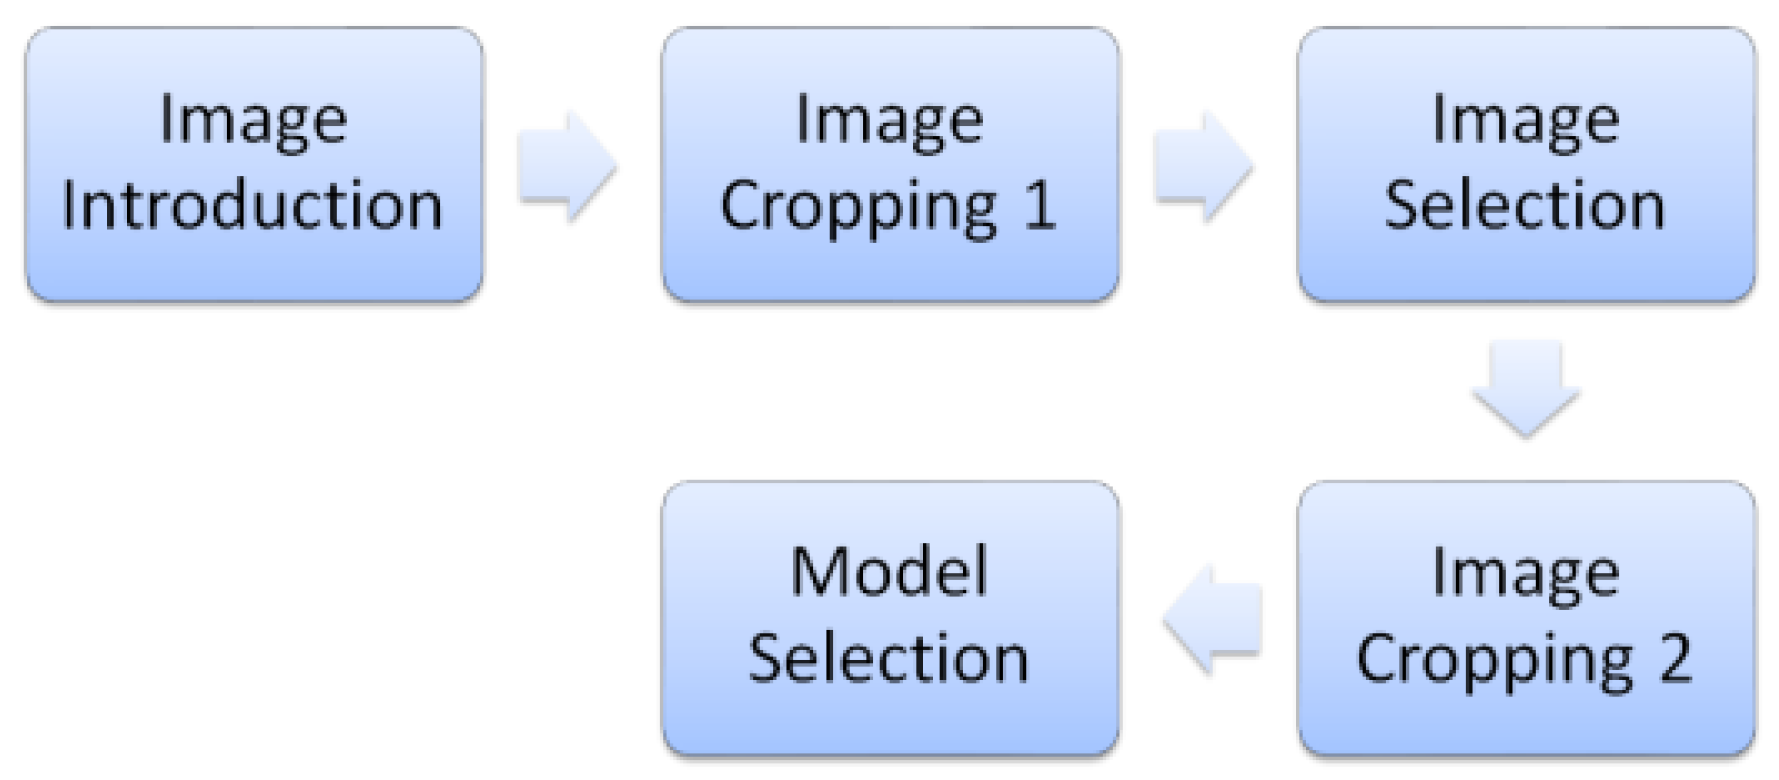
Figure 2. This set of data requires a series of image preprocessing to take out the myocardium circumference area and remove the surrounding noise. First, remove surrounding non-myocardial parts by initial cropping. Second, select the images near the center for cross-sectional images by the image selection method. Finally, align the myocardium in the center by image cropping again. The image process is shown in Figure 3. Organs around the coronary arteries contain non-myocardial parts in these cross-sectional images [
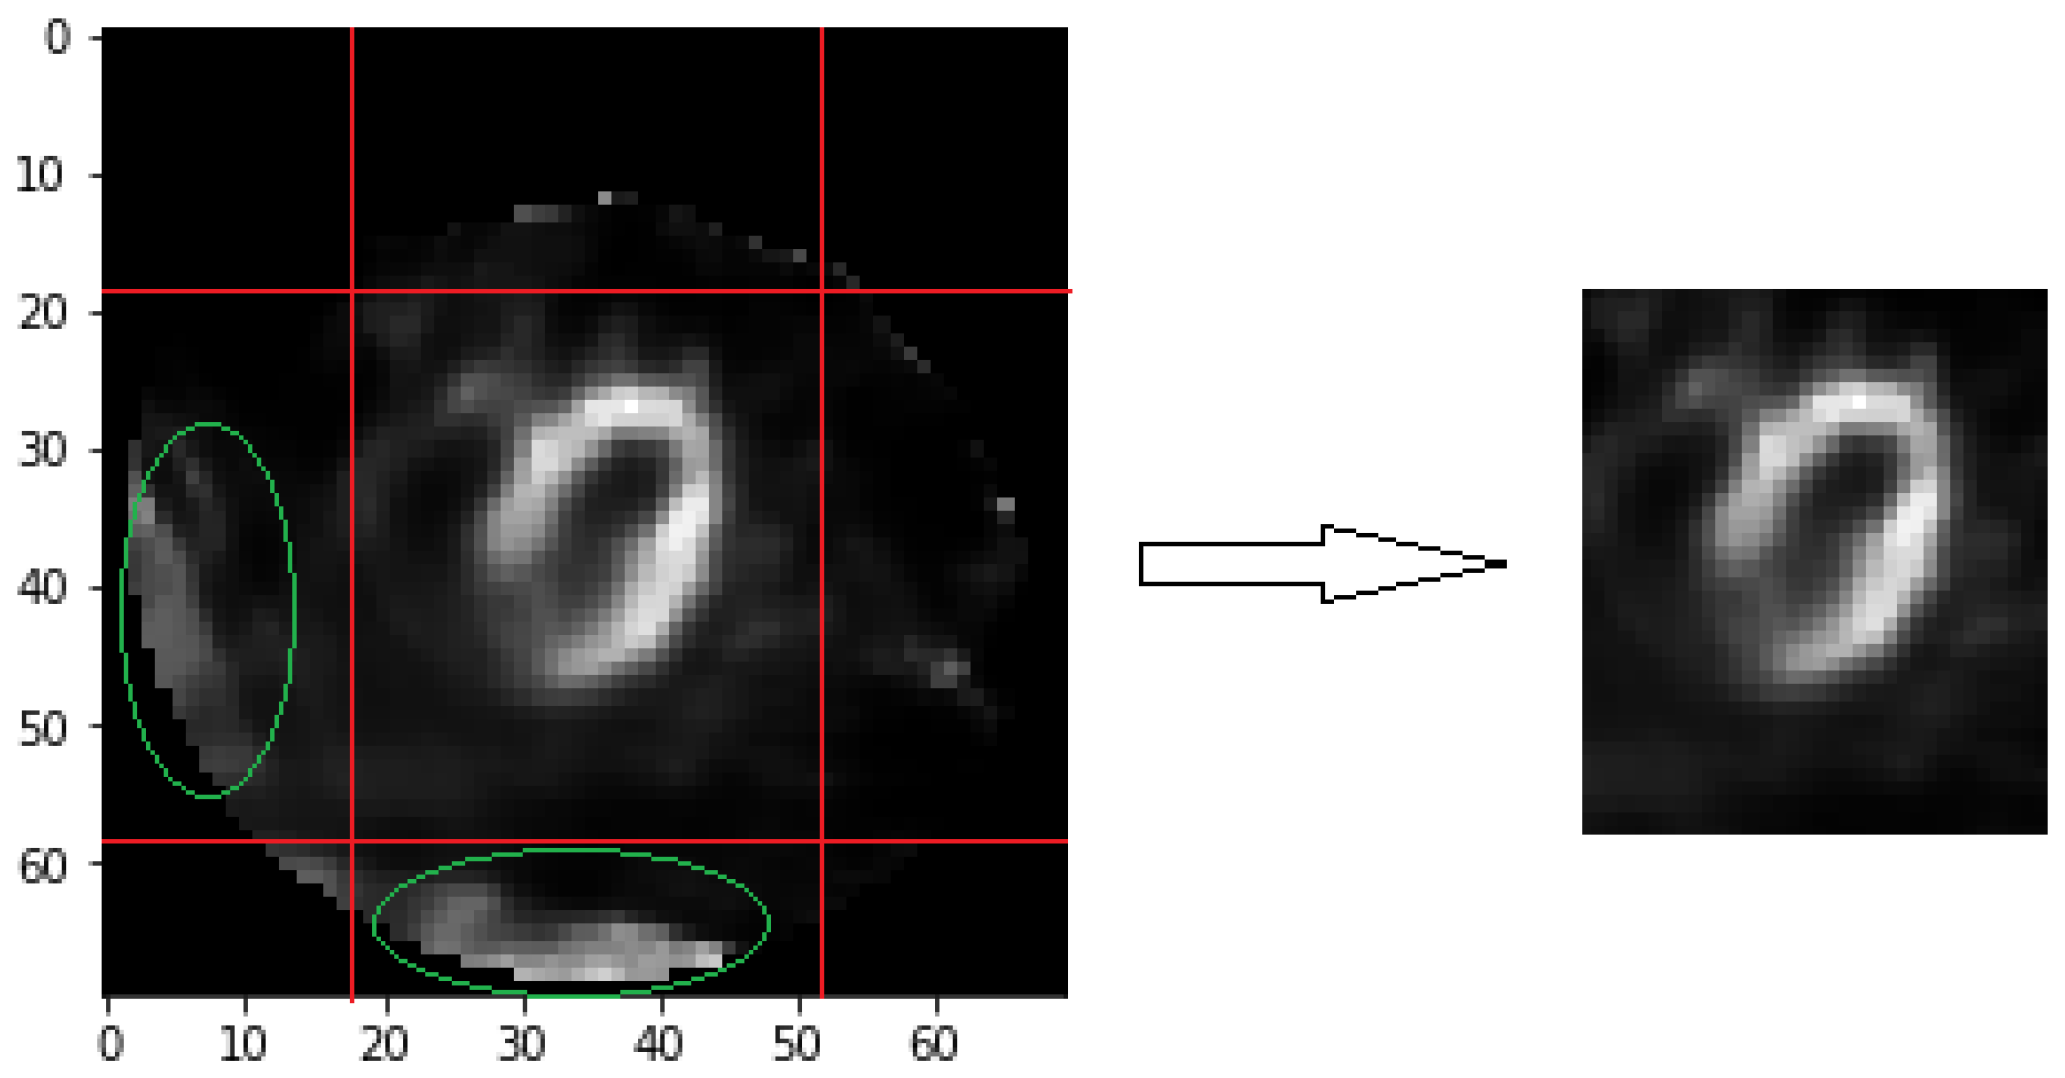
13]. The muscles reflect an image when it has absorbed the tracer. All process methods are related to brightness for image selection and cropping. Therefore, the brightness of these organs leads to interference. We retain specific columns and rows for each image as initial image cropping. Each image has 41 × 36 pixels after cropping, as shown in Figure 4. It removes most non-myocardial muscles, which are unimportant parts.
The myocardium covers more area when closed to the sequence center of the image. Disease symptoms usually are more obvious in the sequencing center of the images. It means the image features between healthy and unhealthy patients are more different. Since the heart position is not aligned, the heart sequence center does not necessarily appear in the middle of the 50 images in the respective sequence. The following two methods are used to find out the sequence center image for each subject. The first method is about brightness sum. The first step is to add up all the pixel values of the two images before and after for each image, corresponding to Equation (1). The ( Image ) i j k means that the pixel value of i-th row and j-th column in k-th image for a subject. This step can avoid the situation where the selected image is very bright and the two images before and after are very dark. This situation is not consistent with the characteristics of the heart sequence center image. In the second step, find the image with the maximum sum of brightness values. This image is regarded as the image sequence center m 1 obtained using the first method, which corresponds to Equation (2).
( Brightness   Sum ) l = k = l 2 l + 2 i j ( Image ) i j k
Center   Image   m 1 = argmax l ( Brightness   Sum )
The second method is about brightness threshold. When the original image cropping procedure cannot completely remove the non-heart organs in the image, these organs appear particularly bright. This brightness relative to the image accounted for a large proportion. Compared with the two image selection methods, the first method more easily selects the wrong image sequence center. These non-heart organs are usually located at the edges of the image. Even if it is very bright, the number of grids occupied is very small. The choice of the second method is related to the number of grids, so it can select the correct heart sequence center image. In contrast to the previous situation, the myocardial area that the tracer is well absorbed for the subject is small. “Brightness sum” method can choose the right heart sequence center image.
In the first step, every pixel is divided by a number that is the average of these images that belong to a subject. In the next step, the pixel that passes the threshold value was taken out to calculate the number of rows and columns that contain these pixels. Suppose there are two matrixes—C and R. C j k is the j-th column stored values and R i k is the i-th row stored value in k-th image are used in Equations (3) and (4). The C j k or R i k will be set as one when there is at least one pixel that pass threshold value in this row or column. The threshold value is set as 3 by tuning in this paper. In the final step, we will multiply the number of rows and columns that pass the threshold to obtains the multiple values that are named “threshold area” for each image. The maximum of these threshold areas will be treated as heart sequence center image m 2 by this method in Equation (5). The two methods take out their respective heart images, which are numbered m 1 and m 2 . The average value of m 1 and m 2 is taken as the final central image of the sequence. From near the central image of the sequence, select 15 images that will be placed in the final model. In the experimental chapter, we will verify that 15 images are the best choice.
C j k = { 0 , max i ( [ Image ] i j k ) < 3 1 , max i ( [ Image ] i j k ) 3
R i k = { 0 , max j ( [ Image ] i j k ) < 3 1 , max j ( [ Image ] i j k ) 3
Center   Image   m 2 =   argmax k j C j k   ×   i R j k
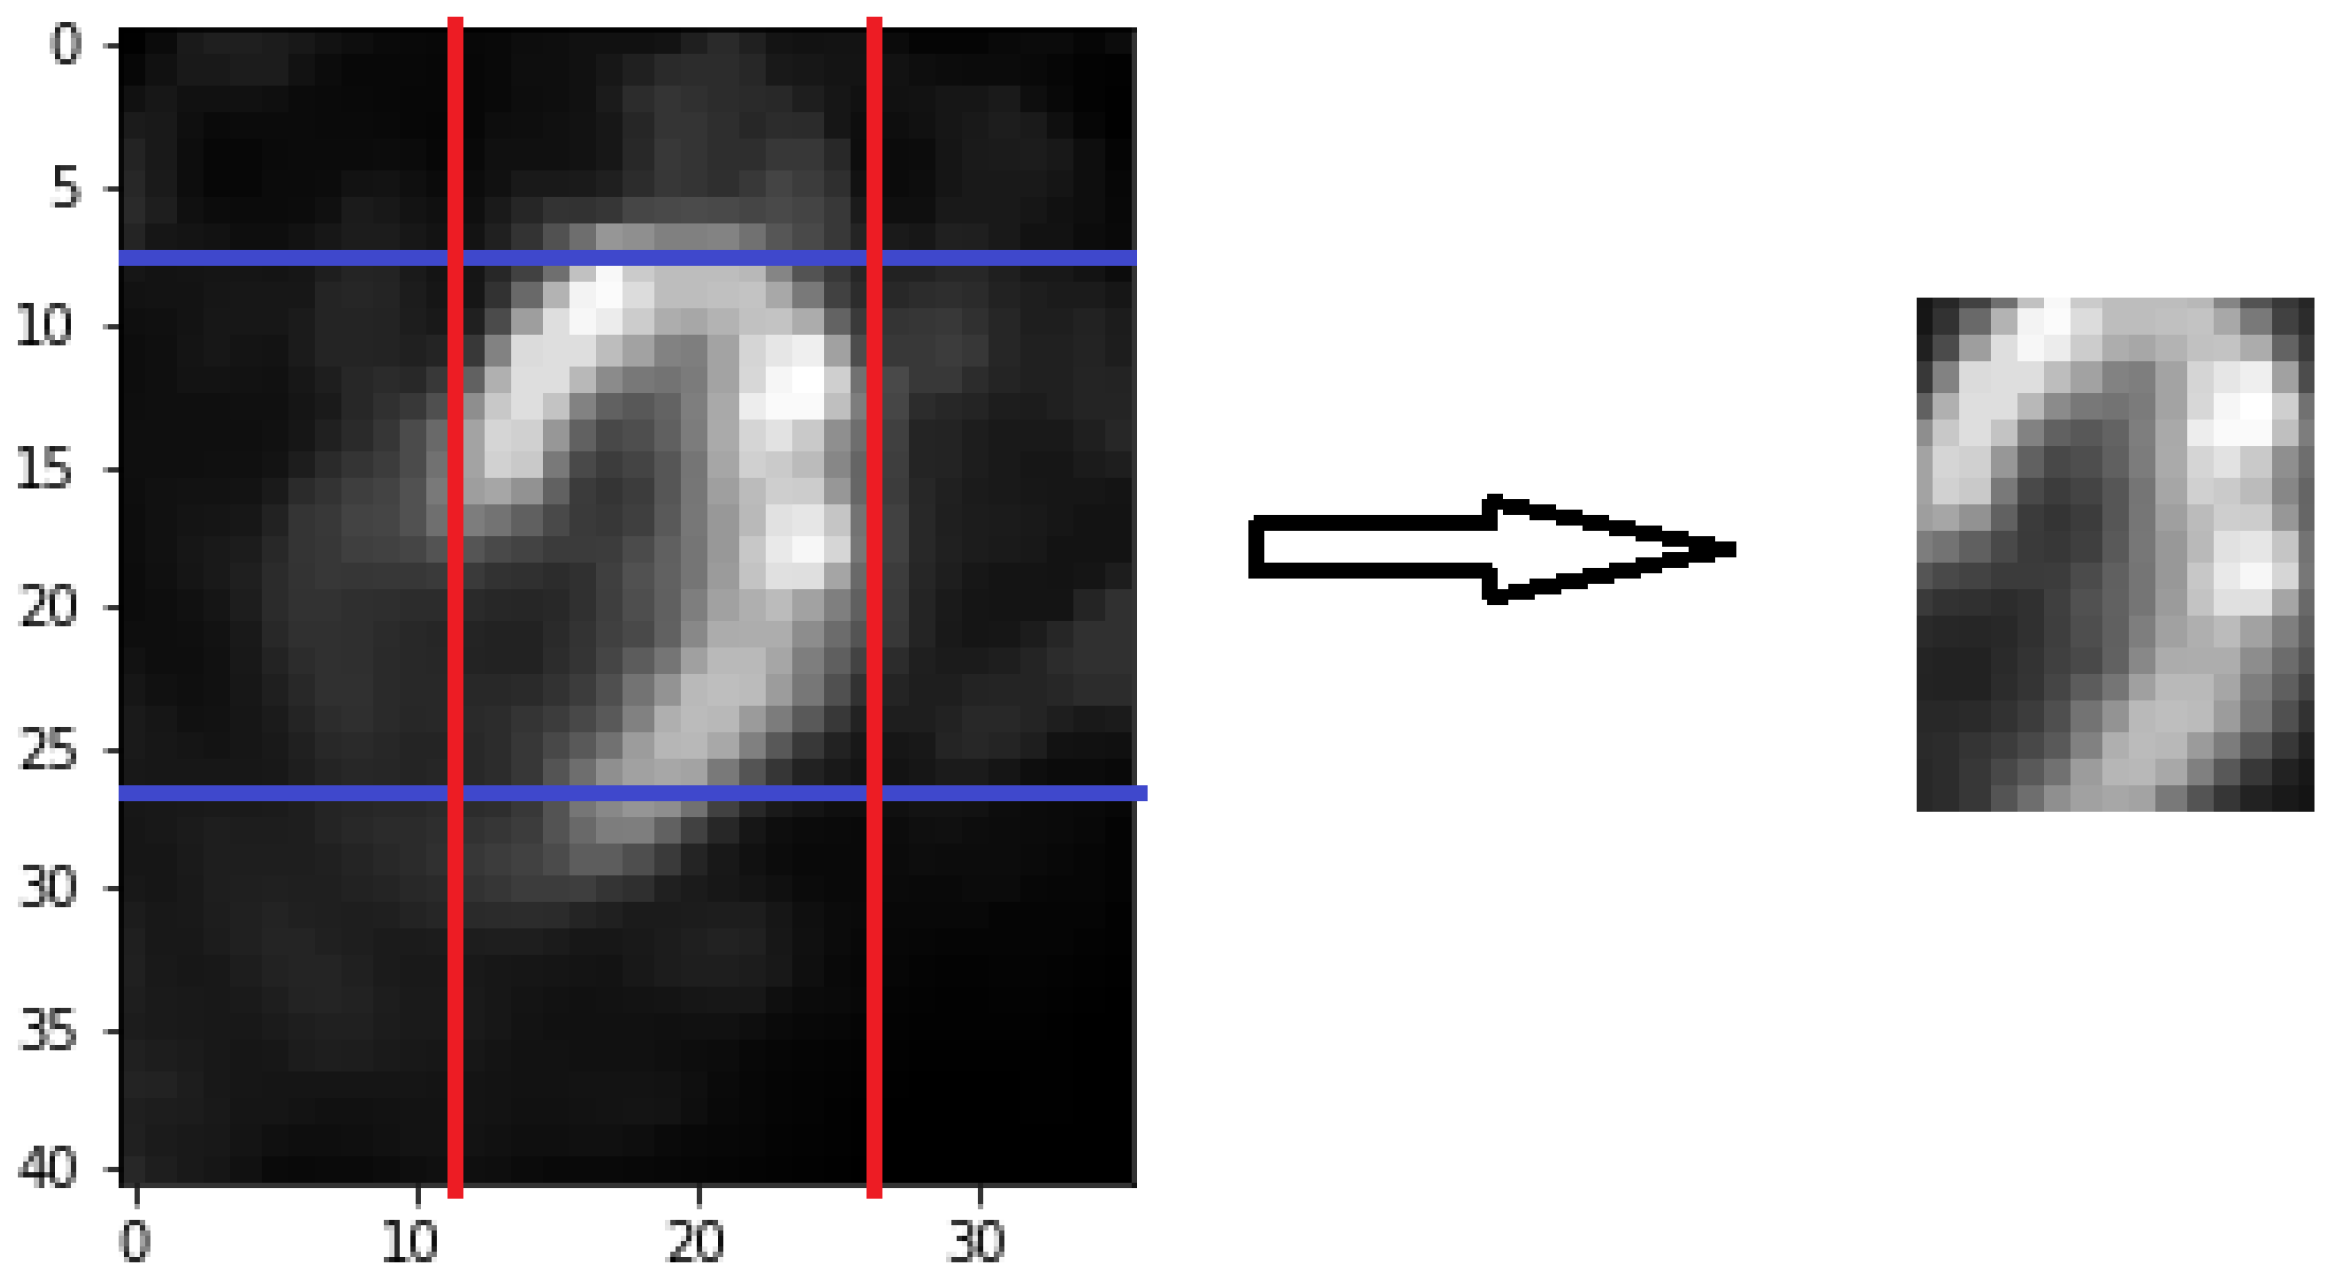
The myocardium is not in the middle in most of the images, even if images are processed by initial image cropping and image selection. Due to the subjects’ heart positions are slightly different. So, these images need to be cropped again to solve this problem. Cropping process needs to be performed separately for rows and columns. Currently every image has 41 × 36 pixels. The first step, suppose there are two vectors A and B in Equations (6) and (7). A p is equal to the sum of bright forward some row pixels as this p-th row’s representative brightness sum value. B q is equal to the sum of bright forward some column pixels as this q-th column’s representative brightness sum value. Add 19 rows or 16 columns by tuning in this paper. The purpose is to find out the initial of cropping. These rows contain the entire myocardium coverage by observing. In Equations (8) and (9), choose the row that has maximum value in A as the first cropping row. Choose the column that has maximum value in B as the first cropping column. The first cropping row and column will be at the top left border of the cropping. The second step, select forward several rows and columns from the first cropping row and column by experiment. In Figure 5, the image which is complete cropping that the myocardium will show in the middle. For every image, we will do pixel normalization, which reduces the stuck during training in neural network model.
A p = i = p p + 18 j [ Image ] i j
B q = j = q q + 15 i [ Image ] i j
First   cropping   row   y =   argmax y ( A )
First   cropping   column   x =   argmax x ( B )

2.2. Model Prediction

There are 979 subjects in this study. Among them, 601 subjects are healthy and 378 subjects are unhealthy. We will separate into two parts. First, from 601 healthy and 378 unhealthy subjects, we will randomly choose 550 and 340 subjects to training and validation set. Secondly from 601 healthy and 378 unhealthy subjects, we will also randomly choose 51 and 38 subjects to testing set. For the experiment stage, use five-fold cross-validation to do hyper parameter adjustment [14]. By average of five accuracy, choose the best parameters that include image preprocessing and hyper parameters that are in 3D convolutional neural network [15]. By selecting the best result, using the model trained through the training set and the validation set to predict the test set. Current deep learning technology that is applied in image classification usually uses convolutional neural network model. These models can fold the similarities in the image. They can use few numbers of parameters for training model, reduce training time, and solve memory shortages. Thus, this study uses convolutional neural network models.

3. Results

The experiments adjust several optimal selection and parameters. Adjust a factor with regulated the other factors for each experiment. Set default values for the factors that have been regulated. The factors that will be adjusted are the selected range of image selection, the range of image cropping 2, filters size, pooling size, activation function [16], optimizer selection, and dropout rate [17]. Use five-fold cross-validation method to implement the following experiments. The optimal results of the previous experiment will be used as the default values for the next experiment.

3.1. Optimal Hyper Parameters for Image Preprocessing and Model

The purpose of this experiment is to find the optimal selected range in image selection. Change the selected number of sheets after finding the center image. The optimal selected range of image selection that is shown in Table 1 is fifteen. This result means that reducing selected images will reduce information on the diseases that leads to predict lower accuracy. Adding selection images will increase noise that will not help the prediction.
The purpose of this experiment is to find the necessity of two image selection methods. The optimal method of image selection that is shown in Table 2 is comprehensive judgment.
The purpose of this experiment is to find the optimal selection size in image cropping 2. The optimal selection size that is shown in Table 3 is 20 × 16.

3.2. Optimal Model Dimension

After finding the optimal parameters of image preprocessing, the purpose of this experiment is to find out whether the 2D model or 3D model is better. When the 2D model was used, the third dimension of filters and pooling size were moved. The performance of the 3D model is better than the 2D model, as shown in Table 4. This result means that the decision of the diseases from images is not observed individually. The diagnosis of diseases needed to be determined by a series of images.

3.3. Optimal Model Hyper Parameters

The purpose in this experiment is to find out the optimal of filters size and pooling size in the model. The optimal pooling size that is shown in Table 5 is 2 × 2 × 1.
The purpose in this experiment is to find out some optimal activation function, optimizer, and dropout rate in the 3D convolutional neural network model. The results are shown in Table 6 and Table 7. The optimal activation function is “Relu” and the optimal optimizer is “SGD”.

3.4. Testing Set Prediction

Build the final model after finding the most optimal hyper-parameters, the weights of the prediction model are decided by running through the training and validation sets. The 3D convolutional neural network model structure is shown in Figure 6. The iteration process curve is shown in Figure 7. Since we use the five-fold cross-validation method to check model robustness, five execution results can be obtained in five iterations. We have plotted the loss curves and accuracy curves for validation sets in five iterations in Figure 7, {val_loss1, val_loss2, val_loss3, val_loss4, val_loss5} and {val_acc1, val_acc2, val_acc3, val_acc4, val_acc5}. The mean curves of five iterations in validation sets and training sets are also plotted in Figure 7, {val_loss_mean, train_loss_mean} and {val_acc_mean, train_acc_mean}. The loss of training and validation declines steadily. The accuracy of training and validation rises steadily. It stops iterating before overfitting. Finally, we evaluate the performance of this determined prediction model for the specified test set. The test set is the same for different runs. The prediction result for comparing image preprocessing steps of testing set is that shown in Table 8. The confusion matrix with combining three steps of image preprocessing is shown in Table 9. There are 4 normal cases that are miss-classified as abnormal. Also, there are 7 abnormal cases that are miss-classified as normal.
The testing set is processed by image cropping 1, image selection, and image cropping 2. The prediction accuracy gradually rises. The result of combining three processing is better than the others that prove the importance of image preprocessing. The mean of accuracy, sensitivity and specificity is 0.8764, 0.8158, and 0.9216. Lower sensitivity means that some unhealthy subjects cannot be detected that need to be solved in future works.
The process of judging myocardial defects through models will be shown by grad-cam heat maps. From the convolutional neural network model architecture, return the filter value in the convolutional layer through the backpropagation operation. A heat map matrix is obtained after adding the filter by weight. Overlay heat map to the original image for visualization. The 15 grad cam maps for each subject are presented separately. For normal images, the model focuses on continuous areas that are shown in Figure 8. For abnormal images, the model focuses on both sides of the myocardial defect that are shown in Figure 9.

4. Discussion and Conclusions

According to the guideline of American Heart Association (AHA), myocardial perfusion imaging (MPI) is an important reference for determining the necessity of performing invasive cardiac catheterization. With the breakthrough of technology and hardware in recent years, artificial intelligence technology has been gradually applied to assist in the interpretation of various medical images. However, there still lacks enough attention on the application of machine learning in the field of nuclear medicine imaging. This research project aims to apply machine learning to construct a nuclear medicine cardiac perfusion imaging AI diagnosis aid system that helps to enhance the efficiency of clinical diagnosis of physicians [18]. The model of automatic MPI diagnosis aids system in this project plan to use the huge amount of MPI data gathered from 2007 to 2016 as an input for the training model. Both supervised learning and non-supervised learning techniques in machine learning would be applied in model building. We use MPI data from 2017 as criteria for evaluating the efficacy of the model. When a new MPI image being input, the model will classify the image into one of three categories—normal, abnormal, or unpredictable. If the MPI data is being classified as unpredictable, the system would warn physicians and physicians would do the diagnosis. Otherwise, the physicians only need to do a double check for those MPI data that have been classified into normal and abnormal categories.
In this study, we collected the dataset accumulated from Kaohsiung Chang Gung Memorial Hospital. All images are original images without artificial modification so that there is no distortion due to human factors. The performance of the proposed classification method has achieved prediction accuracy, sensitivity, and specificity at the level of 87.64%, 81.58%, and 92.16%. These results can be implemented in computer-aided systems for heart diseases in future studies. The system will provide useful reference information for physicians in clinical practice, and physicians will continue to feedback the interpretation information to modify the prediction model to improve the accuracy of the examination report and expand to other image prediction applications in the future. It is expected to be used in other hospitals of the Chang Gung Medical Foundation in the future, and there are plans to cooperate with other hospitals to expand the model sample and strengthen the predictive ability. It is expected to become a leader in nuclear medicine research.

Author Contributions

All authors contribute to this study. All authors have read and agreed to the published version of the manuscript.

Funding

This research was funded in part by the grants CMRPG8K0121 from Chang Gung Memorial Hospital and the grant MOST 107-2118-M-009-006-MY3 (H.H.-S.L.) from Ministry of Science and Technology, Taiwan, ROC. This research was also partly supported in part by the Higher Education Sprout Project (H.H.-S.L.) from the National Chiao Tung University and Ministry of Education (MOE), Taiwan, ROC.

Institutional Review Board Statement

The study was conducted according to the guidelines of the Declaration of Helsinki, and approved by the Institutional Review Board of Chang Gung Medical Foundation (protocol code 201801122B0C501 and 22 August 2019 of approval).

Informed Consent Statement

The images we use are taken from the human body. We have research consent. Informed consent was obtained from all subjects involved in the study.

Data Availability Statement

The data that support the findings of this study are available on request from the authors in Kaohsiung Chang Gung Memorial Hospital, [Jui-Jen Chen, Yen-Hsiang Chang]. The data are not publicly available due to restrictions because their containing information that could compromise the privacy of research participants.

Conflicts of Interest

The funders had no role in the design of the study.

References

  1. Hung, J.; Chaitman, B.R.; Lam, J.; Lesperance, J.; Dupras, G.; Fines, P.; Bourassa, M.G. Noninvasive diagnostic test choices for the evaluation of coronary artery disease in women: A multivariate comparison of cardiac fluoroscopy, exercise electrocardiography and exercise thallium myocardial perfusion scintigraphy. J. Am. Coll. Cardiol. 1984, 4, 8–16. [Google Scholar] [CrossRef] [Green Version]
  2. Bach, D.S. Stress echocardiography for evaluation of hemodynamics: Valvular heart disease, prosthetic valve function, and pulmonary hypertension. Prog. Cardiovasc. Dis. 1997, 39, 543–554. [Google Scholar] [CrossRef]
  3. Verberne, H.J.; Acampa, W.; Anagnostopoulos, C.; Ballinger, J.; Bengel, F.; Bondt, P.D.; Buechel, R.R.; Cuocolo, A.; Flotats, A.; Hacker, M.; et al. EANM procedural guidelines for radionuclide myocardial perfusion imaging with SPECT and SPECT/CT: 2015 revision. Eur. J. Nucl. Med. Mol. Imaging 2015, 42, 1929–1940. [Google Scholar] [CrossRef] [PubMed] [Green Version]
  4. Beanlands, R. Positron emission tomography in cardiovascular disease. Can. J. Cardiol. 1996, 10, 875–883. [Google Scholar]
  5. Hoffmann, U.; Ferencik, M.; Cury, R.C.; Pena, A.J. Coronary CT Angiography. J. Nucl. Med. 2006, 47, 797–806. [Google Scholar] [PubMed]
  6. Kim, W.Y.; Danias, P.G.; Stuber, M.; Flamm, S.D.; Plein, S.; Nagel, E.; Langerak, S.E.; Weber, O.M.; Pedersen, E.M.; Schmidt, M.; et al. Coronary Magnetic Resonance Angiography for the Detection of Coronary Stenoses. N. Engl. J. Med. 2001, 345, 1863–1869. [Google Scholar] [CrossRef] [PubMed] [Green Version]
  7. Blaha, M.J.; Mortensen, M.B.; Kianoush, S.; Rajesh, T.M.; Miguel, C.A. Coronary Artery Calcium Scoring: Is It Time for a Change in Methodology? JACC 2017, 10, 923–937. [Google Scholar] [PubMed]
  8. Chien, C.H.; Chen, Y.W.; Hao, C.L.; Chong, J.T.; Lee, C.I.; Tan, H.T.; Wu, M.S.; Wu, J.C. Comparison of Automated 4D-MSPECT and Visual Analysis for Evaluating Myocardial Perfusion in Coronary Artery Disease. Kaohsiung J. Med. Sci. 2008, 24, 445–452. [Google Scholar]
  9. Garcia, E.V.; Santana, C.A.; Faber, T.L.; Cooke, C.D.; Folks, R.D. Comparison of the diagnostic performance for detection of coronary artery disease (CAD) of their program (QPS) with that of the Emory Cardiac Toolbox (ECTb) for automated quantification of myocardial perfusion. J. Nucl. Cardiol. 2008, 15, 476–478. [Google Scholar] [CrossRef] [PubMed]
  10. Schlesinger, T.E.; Toney, J.E.; Yoon, H.; Lee, Y.; Brunett, B.A.; Franks, L.; James, R.B. Cadmium zinc telluride and its use as a nuclear radiation detector material. Mater. Sci. Eng. 2001, 32, 103–189. [Google Scholar] [CrossRef]
  11. Acharya, U.R.; Fujita, H.; Liha, O.S.; Adam, M.; Tan, J.H.; Chua, C.K. Automated detection of coronary artery disease using different durations of ECG segments with convolutional neural network. Knowl. Based Syst. 2017, 132, 62–71. [Google Scholar] [CrossRef]
  12. Ko, C.L.; Cheng, M.F.; Yen, R.F.; Chen, C.M.; Lee, W.J.; Wang, T.D. Automatic alignment of CZT myocardial perfusion SPECT and external non-contrast CT by deep-learning model and dynamic data generation. J. Nucl. Med. 2019, 60, 570. [Google Scholar]
  13. Moselewskia, F.; Ropers, D.; Pohle, K.; Hoffmann, U.; Ferencik, M.; Chan, R.C.; Cury, R.C.; Abbara, S.; Jang, I.K.; Brady, T.J.; et al. Comparison of measurement of cross-sectional coronary atherosclerotic plaque and vessel areas by 16-slice multidetector computed tomography versus intravascular ultrasound. Am. J. Cardiol. 2004, 94, 1294–1297. [Google Scholar] [CrossRef] [PubMed]
  14. Humayun, A.I.; Ghaffarzadegan, S.; Feng, Z.; Hasan, T. Learning Front-end Filter-bank Parameters using Convolutional Neural Networks for Abnormal Heart Sound Detection. In Proceedings of the 2018 40th Annual International Conference of the IEEE Engineering in Medicine and Biology Society (EMBC), Honolulu, HI, USA, 18–21 July 2018; pp. 1408–1411. [Google Scholar]
  15. Maturana, D.; Scherer, S. VoxNet: A 3D Convolutional Neural Network for real-time object recognition. In Proceedings of the 2015 IEEE/RSJ International Conference on Intelligent Robots and Systems (IROS), Hamburg, Germany, 28 September–2 October 2015; pp. 922–928. [Google Scholar]
  16. Lin, G.; Shen, W. Research on convolutional neural network based on improved Relu piecewise activation function. Procedia Comput. Sci. 2018, 131, 977–984. [Google Scholar] [CrossRef]
  17. Ba, J.; Frey, B. Adaptive dropout for training deep neural networks. Adv. Neural Inf. Process. Syst. 2013, 26, 1–9. [Google Scholar]
  18. Steven, E.D.; Siegel, E.L. Artificial Intelligence in Medicine and Cardiac Imaging: Harnessing Big Data and Advanced Computing to Provide Personalized Medical Diagnosis and Treatment. Curr. Cardiol. Rep. 2014, 16, 441. [Google Scholar]
Figure 1. Healthy Subject Image 70 × 70.
Applsci 11 00514 g001
Figure 2. Unhealthy Subject Image 70 × 70.
Applsci 11 00514 g002
Figure 3. Image Processing Steps.
Applsci 11 00514 g003
Figure 4. Image Cropping 1.
Applsci 11 00514 g004
Figure 5. Image Cropping 2.
Applsci 11 00514 g005
Figure 6. 3D Convolutional Neural Network Model Structure.
Applsci 11 00514 g006
Figure 7. Iteration Process Curve with Combine Three Preprocessing.
Applsci 11 00514 g007
Figure 8. Grad cam map for normal images.
Applsci 11 00514 g008
Figure 9. Grad cam map for abnormal images.
Applsci 11 00514 g009
Table 1. Result of Selected Range after Finding the Center.
Selected Range37111519
Mean0.72920.75500.77080.78650.7730
Table 2. Result of Two Image Selection Methods.
Selected MethodOnly Brightness SumOnly Brightness ThresholdComprehensive Judgment
Mean0.77530.79100.8022
Table 3. Result of the Selection Range in Image Cropping 2.
Selected Range18 × 1420 × 1622 × 1824 × 2026 × 2241 × 36
Mean0.78430.78540.78320.76970.76740.7135
Table 4. Result of Dimension Selection of Model.
Model Dimension2D CNN3D CNN
Mean0.67030.7854
Table 5. Result of Pooling Size Selection.
Pooling Size1 × 1 × 11 × 1 × 21 × 1 × 32 × 2 × 12 × 2 × 22 × 2 × 33 × 3 × 13 × 3 × 23 × 3 × 3
Mean0.75390.76410.76850.78760.77080.75730.77640.76290.7719
Table 6. Result of the Activation Function Selection.
ActivationSigmoidTanhRelu
Mean0.64610.78090.7899
Table 7. Result of Optimizer Selection.
OptimizerSGDRMSpropAdam
Mean0.79660.77420.7876
Table 8. Result of the Preprocessing Method.
PreprocessingNo ProcessingOnly Image
Cropping1
Image Cropping1 and Image SelectionCombine Three
Processing
Subject89898989
Accuracy0.57300.70790.77530.8764
Sensitivity0.00000.65790.60530.8158
Specificity1.00000.74510.90200.9216
Table 9. Confusion Matrix with Combine Three Preprocessing.
Actual NormalActual Abnormal
Predict normal477
Predict abnormal431
Publisher’s Note: MDPI stays neutral with regard to jurisdictional claims in published maps and institutional affiliations.

