Abstract
Several attempts have been made for estimating the vital swelling index parameter conducted by the expensive and time-consuming Oedometer test. However, they have only focused on the neuron network neglecting other advanced methods that could have increased the predictive capability of models. In order to overcome this limitation, the current study aims to elaborate an alternative model for estimating the swelling index from geotechnical physical parameters. The reliability of the approach is tested through several advanced machine learning methods like Extreme Learning Machine, Deep Neural Network, Support Vector Regression, Random Forest, LASSO regression, Partial Least Square Regression, Ridge Regression, Kernel Ridge, Stepwise Regression, Least Square Regression, and genetic Programing. These methods have been applied for modeling samples consisting of 875 Oedometer tests. Firstly, principal component analysis, Gamma test, and forward selection are utilized to reduce the input variable numbers. Afterward, the advanced techniques have been applied for modeling the proposed optimal inputs, and their accuracy models were evaluated through six statistical indicators and using K-fold cross validation approach. The comparative study shows the efficiency of FS-RF model. This elaborated model provided the most appropriate prediction, closest to the experimental values compared with other models and formulae proposed by the previous studies.
1. Introduction
The geotechnical study is the first phase of any structural project. It addresses the morphological, geological, local, and regional site conditions through a set of successive steps, aimed mainly at providing efficiently the necessary and sufficient information on the natural characteristics of a site. Moreover, it allows for determining all information and parameters necessary for the computation of foundations, leading to the stability of the structures under different risks, such as swelling [1,2]. The latter is considered a notoriously problematic phenomenon for any infrastructure foundation because of the considerable volume changes experienced by soils upon drying and wetting [3]. However, the integrated components of the geotechnical process for detecting swelling risk are very diverse. Moreover, these experimental processes are often time-consuming and, in many cases, the computation costs are very high. On the other hand, the Oedometer test suffers from several disadvantages, such as the requirement of sophisticated and expensive equipment, being very time-consuming, and requiring highly qualified laboratory workers [4,5]. A well-known example is the consolidated clay, which could take up to 30 days when the Oedometer test is conducted [6]. However, the mechanical soil properties are sometimes inexistent or insufficient, in circumstances where the engineer must provide a quick and important decision to rapidly handle the critical situation. These disadvantages have been among the major obstacles for research, dissemination, and implementation of soil mechanics in engineering practice [4]. Furthermore, classical constitutive modelling based on the elasticity and plasticity theories has a limited ability to correctly simulate the real behavior of soils. This is attributed to reasons associated with the complexity of soil formation and its heterogeneity [7]. For these reasons, geotechnical researchers have tried to develop new safe economical models using systems influenced by many factors, like the technical, economic, environmental, and geometrical parameters. These systems are called, all together, Artificial Intelligence (AI) or Machine Learning (ML).
Many papers have been published in order to derive a different relationship and advanced models between the compression index (Cc) and the basic soil properties [6,8,9,10,11]. However, only a few widely accepted empirical equations have been proposed in the literature to estimate the swelling index (Cs) from physical soil parameters, such as the natural water content (W), the plasticity index (PI), the liquid limit (WL), the specific gravity, and others. Table 1 summarizes some proposed formulae for estimating Cs. However, major shortcomings have been observed. The large amount of correlations published with respect to the same parameters point to an inherent variability of its usage. Therefore, the application of correlation analysis in other conditions or sites could yield incorrect results [12,13]. In addition, these approaches generally depend on simplified assumptions, such as a linear behavior or production heuristics, which make regression analysis methods less effective when they are used for simulating the complex heterogeneous behavior of soil [14,15,16,17].

Table 1.
Correlations proposed in the literature to estimate the swelling index Cs.
On the other hand, the use of the ANN method in geotechnical engineering has witnessed a major development since the early nineties [21]. Several attempts using neural networks have led to impressive results. Between the important research works dealing with the swelling of soil, Işık has utilized one hidden layer of the ANN model by analyzing a database consisting of 42 test data for fine-grained soil. The selected input parameters included the initial void ratio (e0) and W. The (2-8-1) ANN model (meaning two inputs, eight nodes in the hidden layer and one output) efficiently predicted Cs [20]. Das et al. have predicted the swelling pressure using an ANN model with an input layer containing W, dry density (Yd), WL, PI, and clay fraction [22]. Kumar and Rani have developed an ANN model with one hidden layer to predict Cs and the Cc of clay by learning from 68 samples. They used the FC, WL, PI, maximum dry density, and optimum moisture content as an input layer. The suggested ANN model (5-8-1) provided better predictability in comparison with the multiple regression analysis (MRA) model [23]. Kurnaz et al. have used ANN models to estimate Cs and Cc from input layer including the W, e0, WL, and PI. The proposed ANN model (4-6-2) has proven its efficiency in the prediction of Cc. Nevertheless, the predicted Cs values were not satisfactorily compared to the compression index [24]. Table 2 recapitulates the aforementioned proposed ANN models in the literature to estimate the swelling index Cs.

Table 2.
Proposed ANN models in the literature to estimate the swelling index Cs.
The quality, learning ability, and effectiveness have made the use of the ANN method very useful. According to the author’s knowledge, the previous studies have used only the ANN method for estimating Cs, although recent studies have showed that other techniques could have yielded more effective and accurate results than the ANN method in geotechnical applications [25,26,27]. Furthermore, the aforementioned studies have modeled Cs using a few input parameters and, therefore, ignored the different soil parameters that could increase the learning capacity of the network. Consequently, the complicated mechanism of the swelling phenomena has been oversimplified. Moreover, few samples have been used, meaning that the proposed models have a limited capacity to generalize new data not used in the few training data. Furthermore, they evaluated the predictive capacity of proposed models based on only one split to validate data learning. Therefore, the capacity of their model to overcome the over-fitting and under-fitting problems cannot be confirmed.
In view of the aforementioned shortcoming, this research sheds the light on the capability of the advanced machine learning methods to generate a reliable model, contributing to easily and effectively predict Cs, filling a gap in the literature where there is a lack in the use of the advanced machine learning methods in modeling swelling phenomenal. Consequently, the elaborated model offers plenty of benefits such as its reliability, and lowering the budget used to predict Cs from the easily obtained soil parameters and without the need to operate the odometer test.
2. Materials and Methods
2.1. Overview of the Methodology
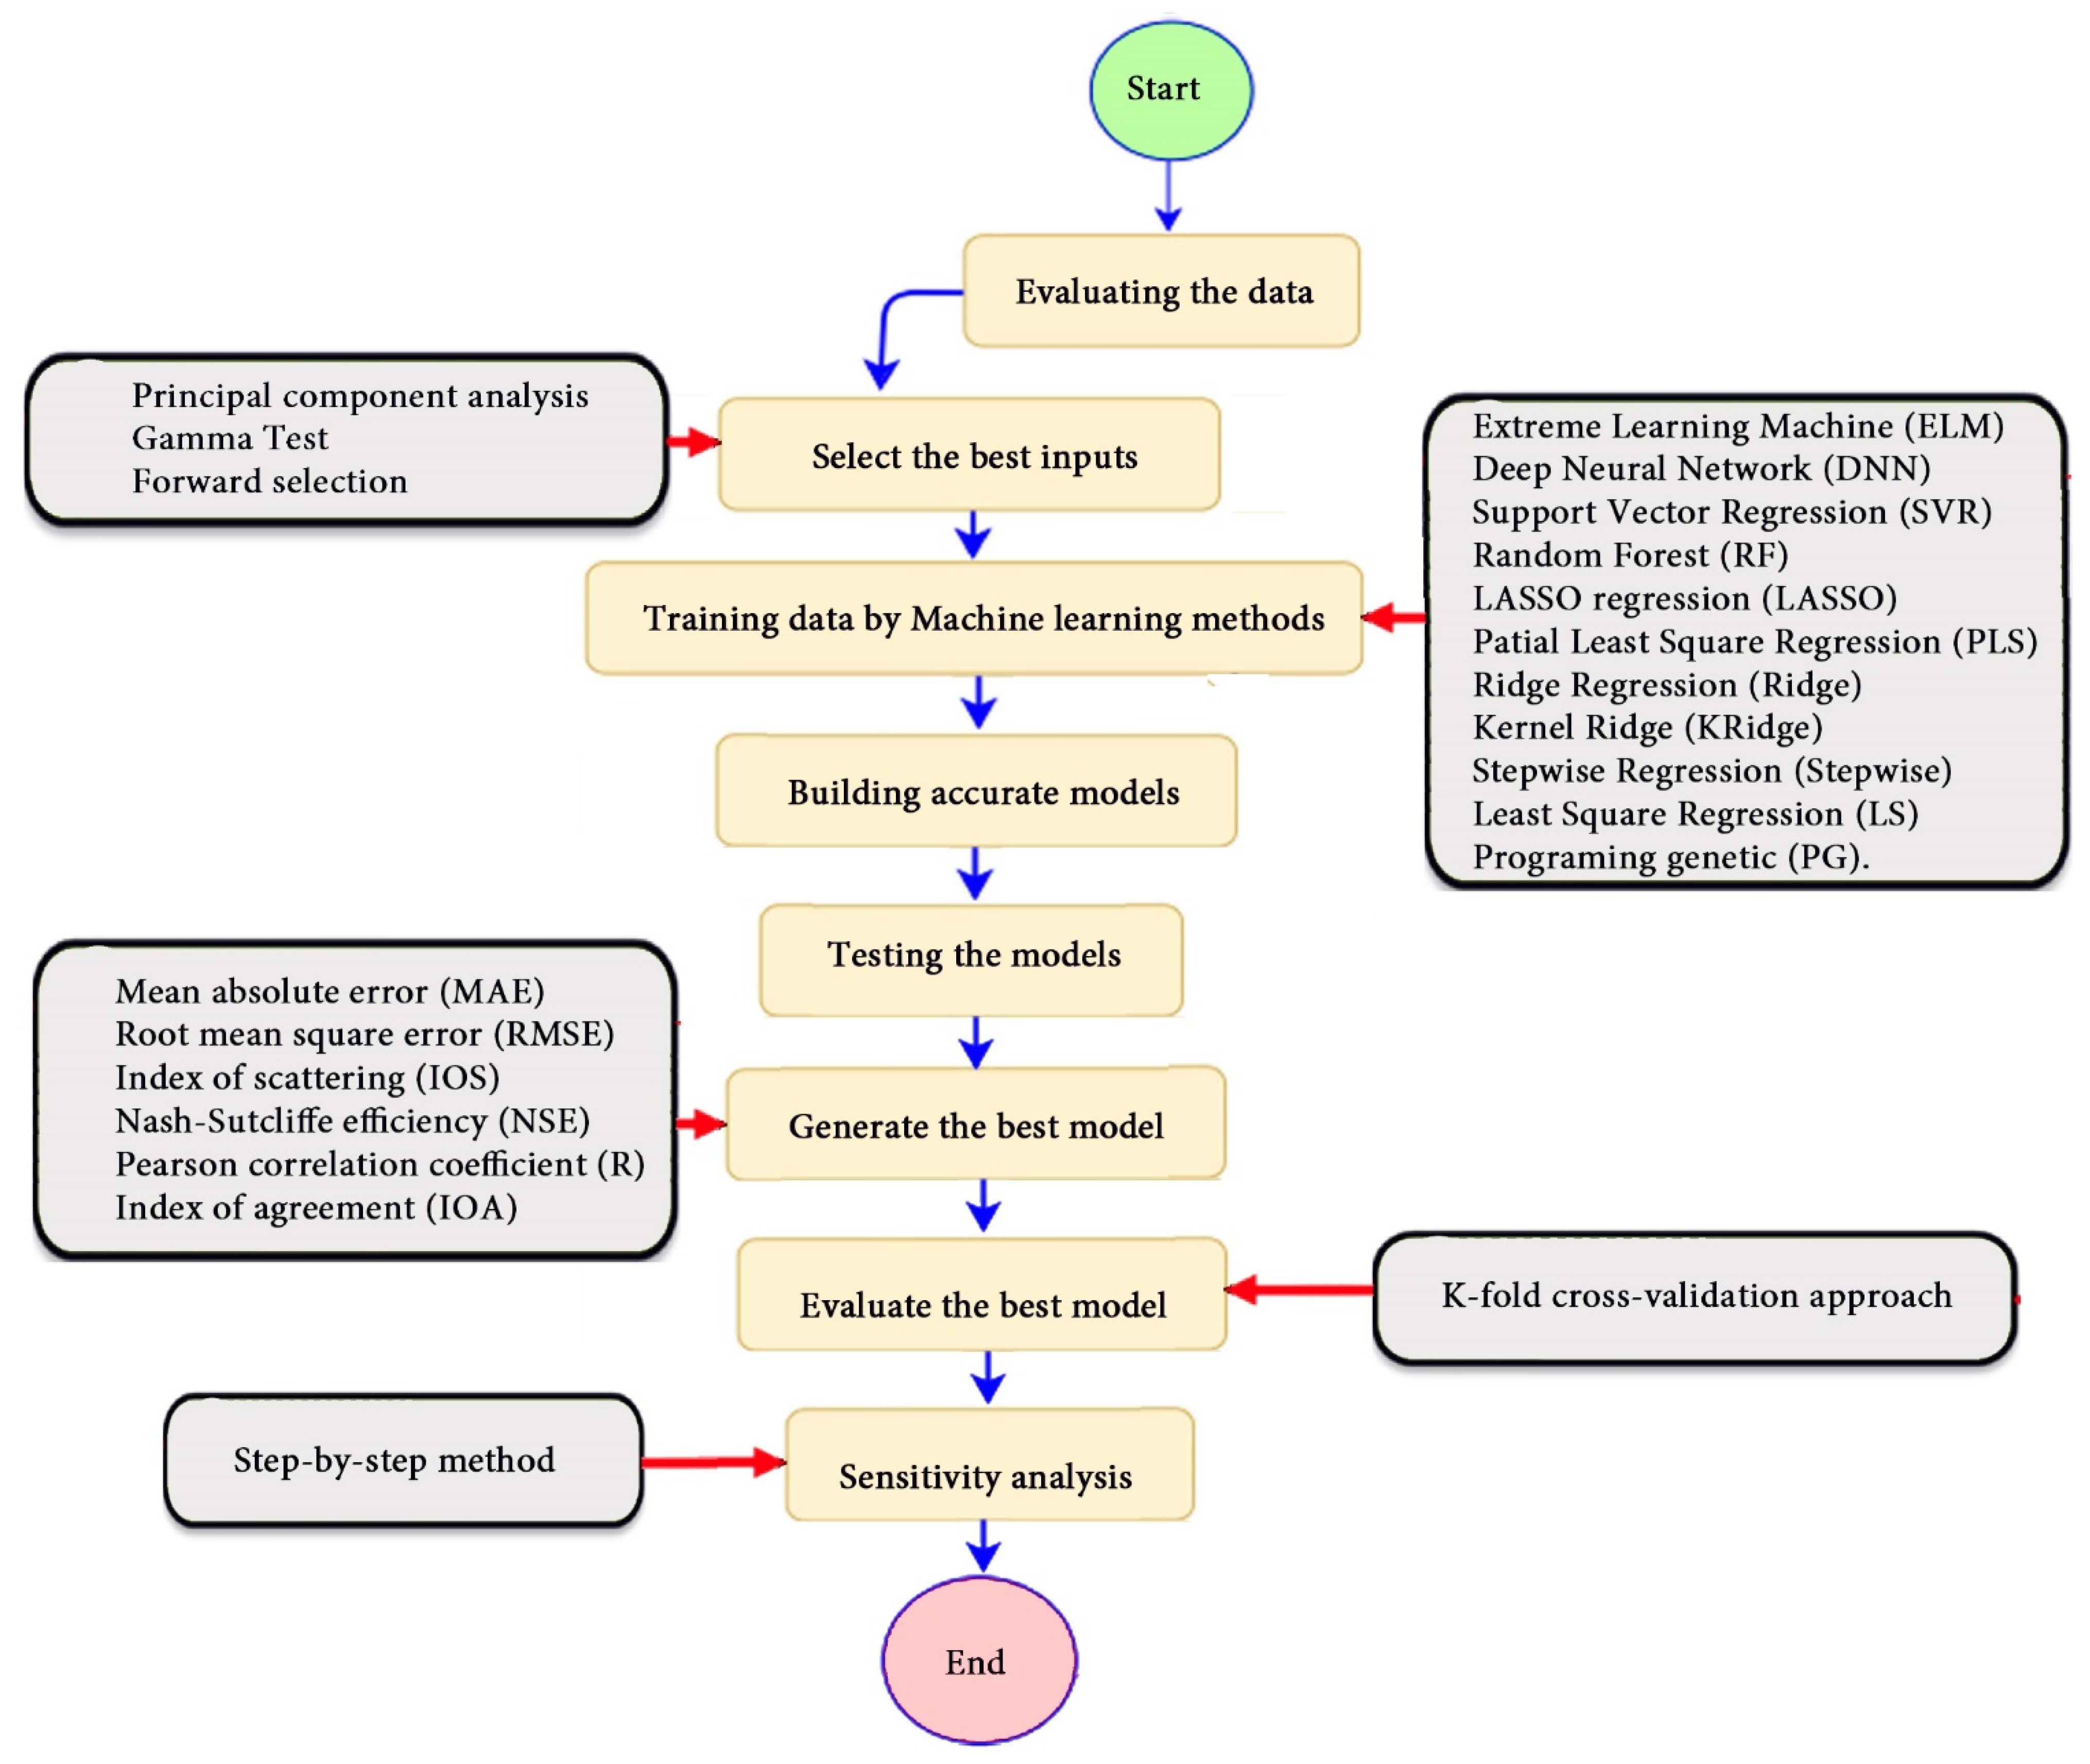
Several-advanced machine learning techniques like Extreme Learning Machine (ELM), Deep Neural Network (DNN), Support Vector Regression (SVR), Random Forest (RF), LASSO regression (LASSO), Partial Least Square Regression (PLS), Ridge Regression (Ridge) Kernel Ridge (KRidge), Stepwise Regression (Stepwise), Least Square Regression (LS), and Genetic Programming (GP) have been applied for modeling 875 samples. Multiple input parameters, including the wet density (Yh), the dry density (Yd), the degree of saturation (Sr), the plasticity index (PI), the water content (w), the void ratio (e0), the liquid limit (WL), sample depth (Z), and the fine contents (FC) have been used. Firstly, from an effective viewpoint, the suitable input variables and nonlinear components are of considerable importance for efficient prediction. Thus, the Principal Component Analysis (PSA), Gamma Test (GT) and Forward selection (FS) methods have been used to select the optimal set of input variables. Afterward, the advanced machine learning techniques have been applied for modeling optimal inputs, and their accuracy models were evaluated through numerous statistical indicators. To assess the predictive capability of the best model, the k-fold cross-validation approach based on 10 splits has been utilized. Finally, to answer the question “Which input variables have the most or less influence on Cs through the proposed model?”, a sensitivity analysis has been carried out using the step-by-step selection method.
2.2. Oedometer Test
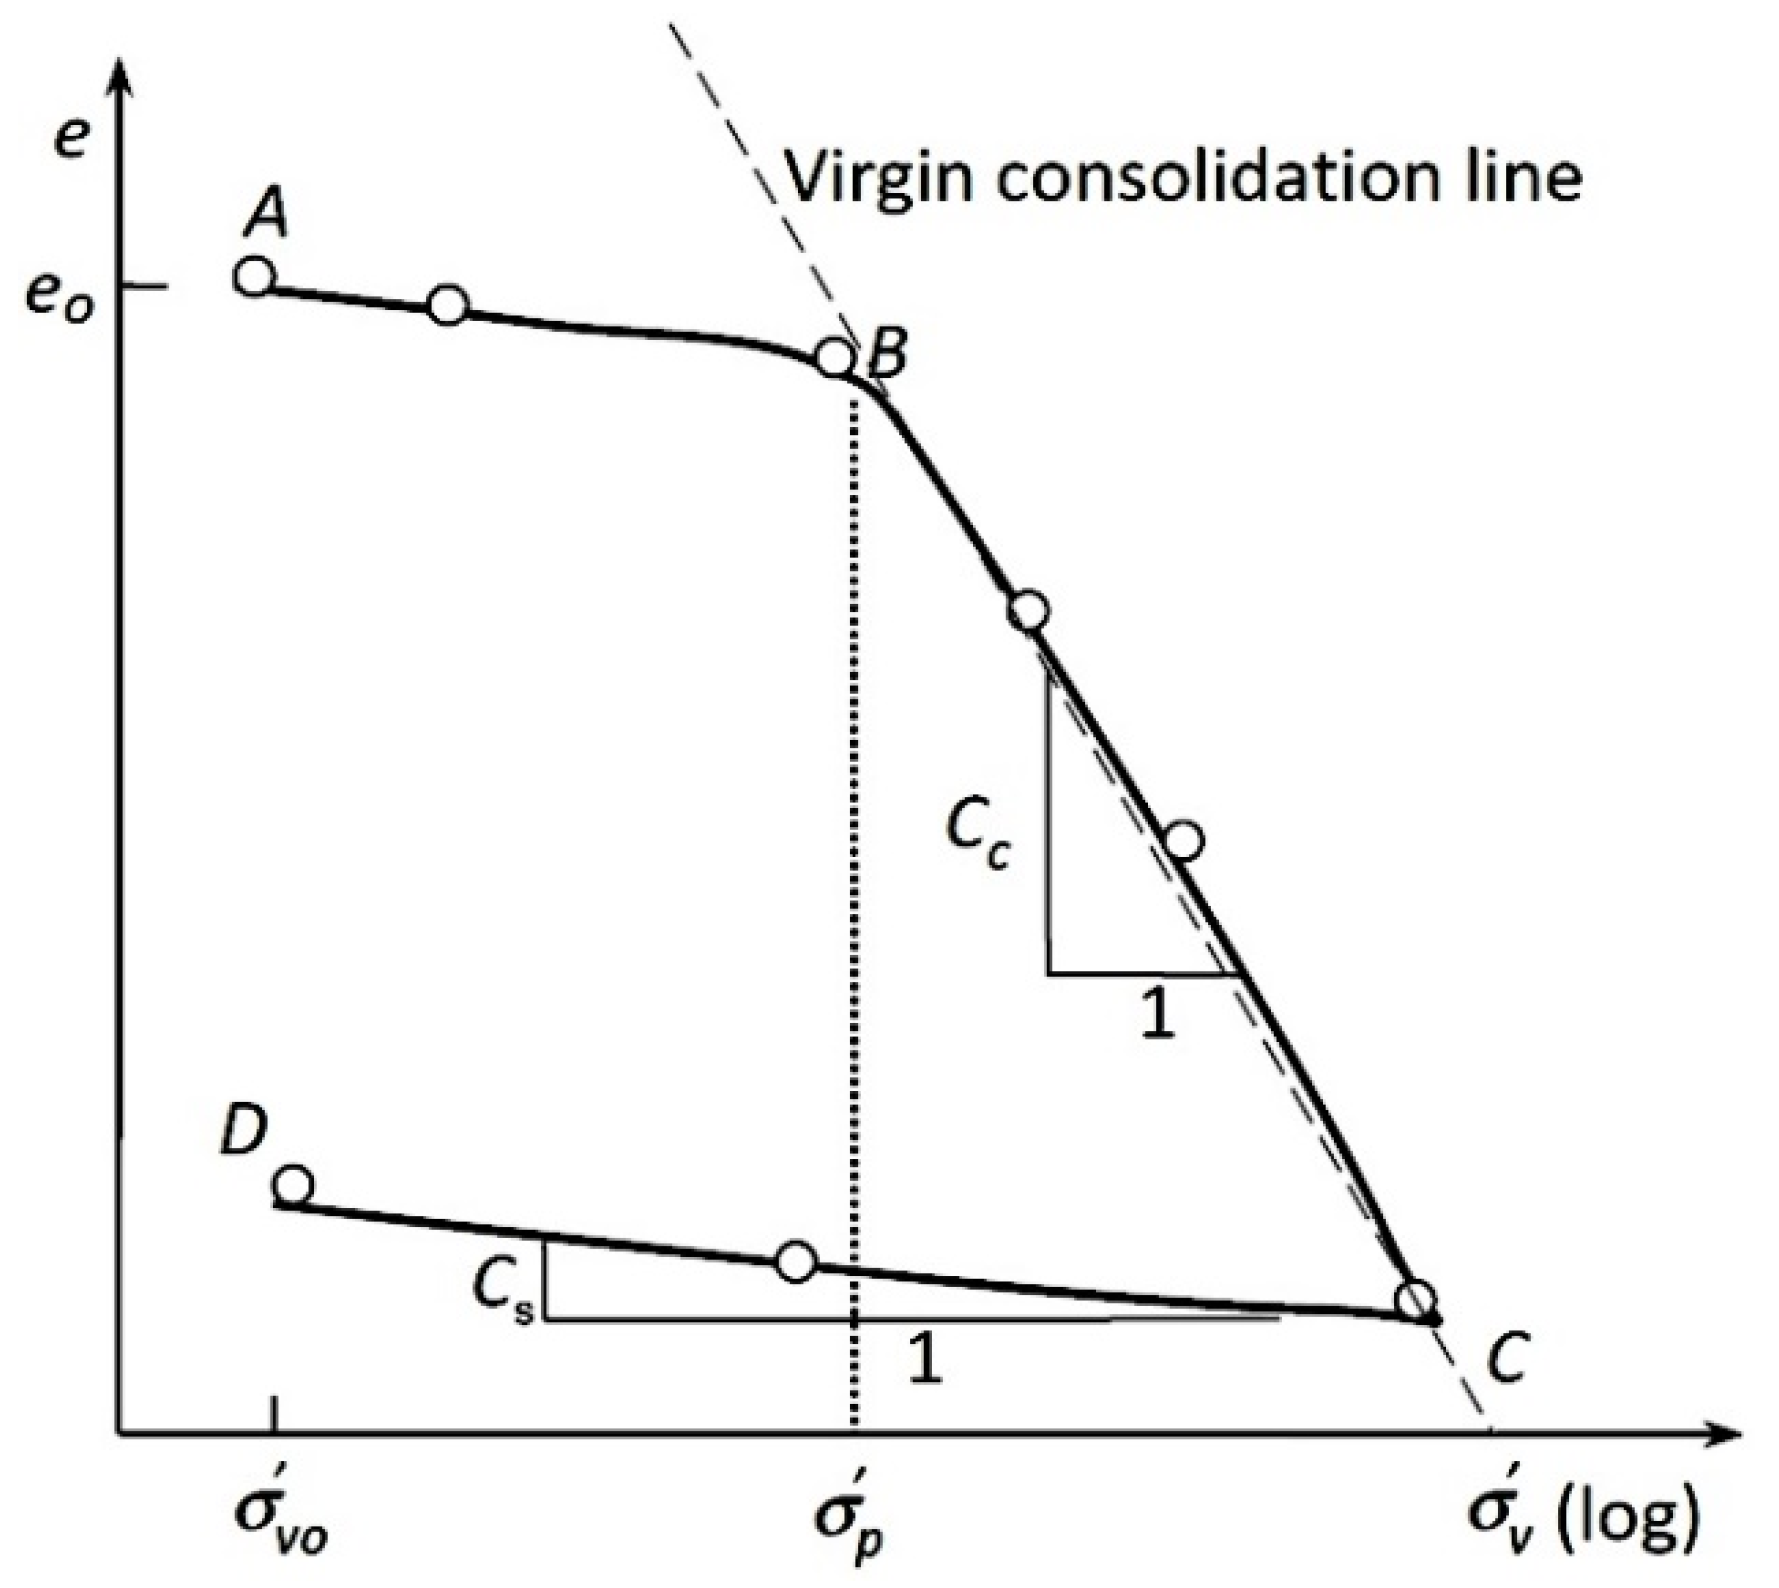
The compressibility of soils is one of the most important phenomena in civil engineering. The Oedometer test is used to determine the compressibility properties of soil, which are usually described using Cc, Cs, and the coefficient of consolidation (Cv) [20,24]. The compressibility properties are used to predict how the settlement and the swelling will be held. A number of parameters influencing the swelling behavior have been reported in the past, such as W, e, WL, PI, the type and amount of clay (FC), and others [8]. Cs is usually determined using the graphical analysis of compression and recompression curves in void ratio effective stress (e = f(log(σ))) plots [20,28] (see Figure 1), and used typically to estimate the consolidation settlement for soil layers using these formulae:
where e0: initial void ratio, Δσv: load increment, σ’c: pre-consolidation pressure, σ’v0: initial vertical effective stress, Cc: compression index, and Cs: swelling index.
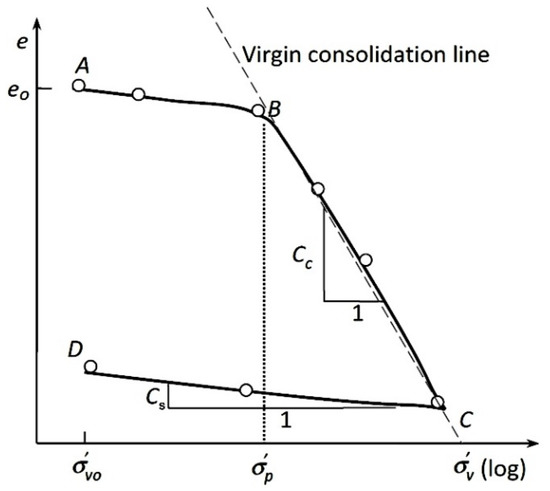
Figure 1.
Determination of the swelling index from compression curves using the CD line.
2.3. Case Study
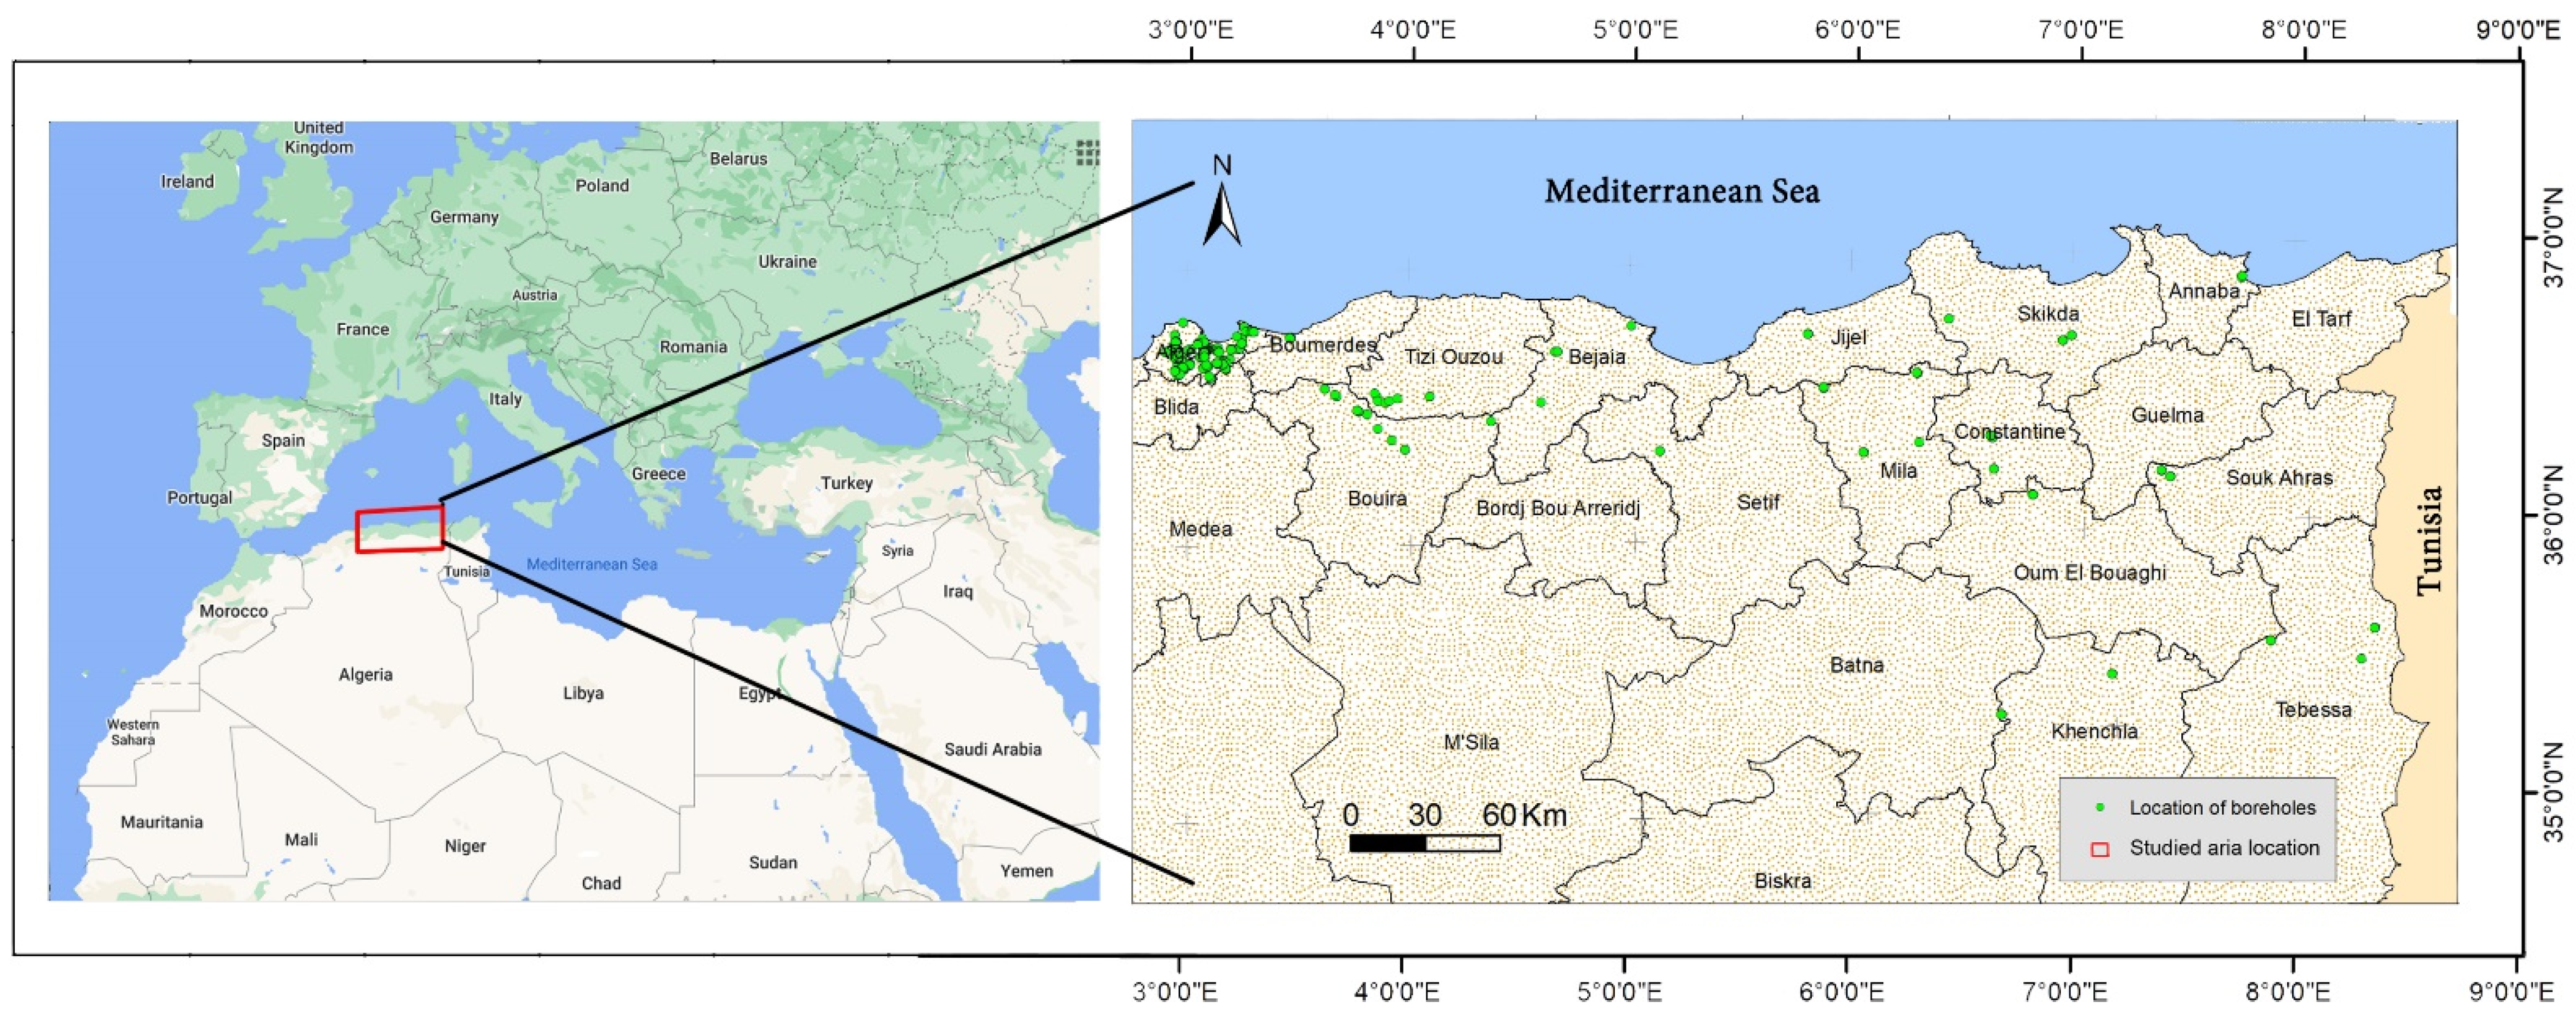
In the current study, a database of 875 Oedometer and other geotechnical tests has been collected from 570 boreholes. The reason for choosing the Northeast Algerian area is attributed to the widespread clay and marl geological formations, which generally suffered from shrinkage-swelling phenomena, resulting into a database including a wide range of data, sufficient for a reliable study. The sample depth (Z) ranges between 0.5 to 45 m with an average of 6.66 m. Figure 2 illustrates the distribution of the collected boreholes in the study area. The soil parameters used in this study were measured in the lab depending on the international or European standards.
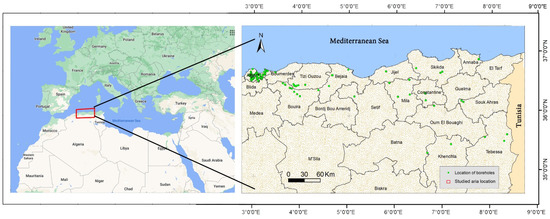
Figure 2.
Map of the study area and collected boreholes sites.
2.4. Optimal Input Selections
2.4.1. Overview of Principal Component Analysis (PCA)
PCA is an exploratory statistics approach [29] considered between the multivariate statistical methods, which is generally utilized to decrease the complexity of the input variables. PCA is used in the practical case when we have a great number of information, and, in many fields, sometimes in conjunction with other methods [30]. Furthermore, this method reduces the input variables into a better interpretation of independent principal components (PCs) [31,32]. Instead of the direct use of input variables, we reduce them into PCs in order to use them as lower-dimensional inputs. Details for mastering the art of applying the PCA are published by other studies [33,34,35,36].
2.4.2. Overview of Gamma Test (GT)
The Gamma Test (GT) is an advanced approach for evaluating the variance of the noise, or the mean square error (MSE), which could be fulfilled without over-fitting. This method is very advantageous for assessing the nonlinear relationship between two random variables (input and target). Koncar (1997) [37] and Agalbjörn et al. (1997) [38] were the first reporting gamma test method and later many investigators have developed and detailed [35,36,39]. Only summarized information about GT is discussed here. Details for mastering the art of GT are presented in the aforementioned articles for the interested readers. By using necessary conditions detailed in the above-mentioned papers, the variance of the noise is specified by the bias of the regression between γ(k) and δ(k), where 1 ≤ k ≤ p. This variance is dubbed Γ. γ(k) and δ(k) are presented in Equations (9) and (10):
is the kth nearest neighbor of xi, and is the corresponding target. In order to calculate Γ, a least squares fit line should be carried out for the p points (δ(k), γ(k)). Afterward, the bias of the regression line will be easily estimated, which represents the gamma statistics parameter Γ. It is worth mentioning that Γ provides useful findings for building an accurate model. The smaller the value of Γ, the more appropriate is the input set. In addition, Vratio presents an important indication to assess the predictability of the selected target depending on utilized inputs, and illustrated as:
where is the output variance. Overall, in the current paper, by using the least value of Γ and Vratio, the best-input combinations were chosen.
2.4.3. Overview of Forward Selection (FS)
The forward selection method is based on regression modelling. Firstly, input variables are considered in ascending order according to their correlation with the target variable (from the best to the weak correlated variable). Then, the best correlated variable with the target is chosen as the first one. The other variables are afterward added one by one as the second input, and we assess the predictive capability of the set according to their correlation development. Generally, the most significant variable increases the determination coefficient (R2) is selected and added to the input set. In other words, if the R2 is increased more than 5%, the new variable is accepted and added to the optimal input set. This step is repeated N − 1 times for assessing the impact of each parameter on modelling the target. Finally, among N tested inputs, the ones with optimum R2 are accepted as the model input subset.
2.5. Machine Learning Methods
In the current study, several machine-learning methods have been used in order to conduct a reliable study and to propose a high performance model. Only the methods actually used are cited, followed by relevant references, which can be examined by the interested readers to better understand each one. The used methods are: Extreme Learning Machine (ELM) [40], Deep Neural Network (DNN) [6,41], Support Vector Regression (SVR) [42], Random Forest (RF) [43], LASSO regression (LASSO) [44], Partial Least Square Regression (PLS) [45], Ridge Regression (Ridge) [46], Kernel Ridge Regression (KRidge) [47], Stepwise Regression (Stepwise) [48], and Genetic Programing (GP) [6]. Matlab software has been used for programming the algorithms corresponding to each method, except GP when the HeuristicLab Interface has been utilized [49]. The controlling parameters of the ELM, DNN, SVR, RF, LASSO, PLS, Ridge, KRidge, Stepwise, and PG algorithms used in this study are listed in Table 3.

Table 3.
Initial parameter settings for the algorithms.
2.6. Statistical Performance Indicators
The prediction accuracy of the proposed models was evaluated through various statistical performance indicators and using graphical presentation. The statistical performance indicators are Mean absolute error (MAE), Root mean square error (RMSE), Index of scattering (IOS), Nash–Sutcliffe efficiency (NSE), Pearson correlation coefficient (R), and Index of agreement (IOA). They are expressed as follows [50]:
- Mean absolute error (MAE):
- Root mean square error (RMSE):
- Index of scattering (IOS):
- Nash–Sutcliffe efficiency (NSE):
- Pearson correlation coefficient (R):
- Index of agreement (IOA):where , , , and present the target, output, mean of target, and mean of output swelling index values for N data samples, respectively. Furthermore, the proposed machine learning model having the lowest value of RMSE, IOS, and MAE and the highest value of IOA, NSE, and R presents the better one and the closest to the experimental data.
Subsequently, after selecting the best model using statistical performance indicators, its predictive capacity is assessed using the K-fold cross-validation approach. This shows more accuracy and robustness for evaluating the capability of performance predictive of the best model by testing the existence of over-fitting and under-fitting problem in data learning [51,52]. The method consists of separating the data set into k equal sizes splits. Hence, for each one, K−1-folds are used for training and the last one for validation. This operation is repeated successively until the use of all split for the validation step [53]. The main advantage of this method is that all collected data are utilized in both the training and validation steps [52]. Breiman and Spector (1992) have demonstrated that K = 10 or K = 5-fold cross validation is the best choice for model evaluation [51]. In this work, we chose K-fold cross-validation with K = 10 for comparing the predictive capacity of each model.
2.7. Methodology
In order to find the most appropriate model to predict Cs of soil using previously mentioned geotechnical parameters as an input, the methodology consisted of the following steps:
- Creation of a geotechnical database of Algerian soil, collected from different laboratories around the geotechnical constructions projects in progress or completed before.
- Selecting the optimal input variables using Principal component analysis (OSA), Gamma Test (GT), and Forward selection (FS) has been used.
- Analyzing selected optimal inputs using several machine learning methods. The ELM, DNN, SVR, RF, LASSO, PLS, Ridge, KRidge, Stepwise, and PG methods have been used in this step for proposing 30 models.
- Determine the most appropriate model for predicting the Cs value between the thirty proposed models using important statistical performance indicators as MAE, RMSE, IOS, NSE, R, and IOA.
- Assessing the predictive capacity of the best model to overcome under-fitting and over-fitting problem by using the K-fold cross validation approach with K = 10.
- Doing a sensitivity analysis by utilizing the step-by-step method to know the most or less influenced input on Cs through the proposed model.
The research methodological for determining the most appropriate model to estimate Cs is systematically described in Figure 3.
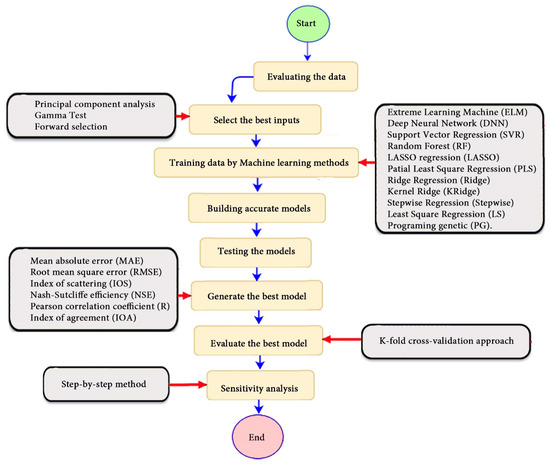
Figure 3.
Flowchart of key steps for the research methodology to estimate Cs.
3. Results
3.1. Database Compilation
In the current study, a database of 875 Oedometer and other geotechnical tests has been collected resulting into a database including a wide range of data, sufficient for a reliable study. Table 4 displays the descriptive statistics of collected samples, determined using SPSS such as the mean, median, mode, standard deviation, variance, skewness, error of skewness, kurtosis, kurtosis error, range, minimum, and maximum. The skewness values indicate that all variables are evenly distributed. Moreover, the results point out that the database includes a wide range of data. Therefore, the collected dataset can be used to enhance novel empirical models and assess the predictive capacity of existing formulae. North East Algerian soil can be characterized as a dense soil with an average wet density of 1.67 according to the European norms [54]. Moreover, the soil appears to be plastic with an average plastic index of 26.09 according to SONGLIRAT’s classification [55]. In the classification based on swelling, according to the European norms, the soils could be classified as a swelling soil, with an average Cs equal to 0.044 [55].

Table 4.
Descriptive statistics of collected samples.
3.2. Correlation between Cs and Geotechnical Parameters
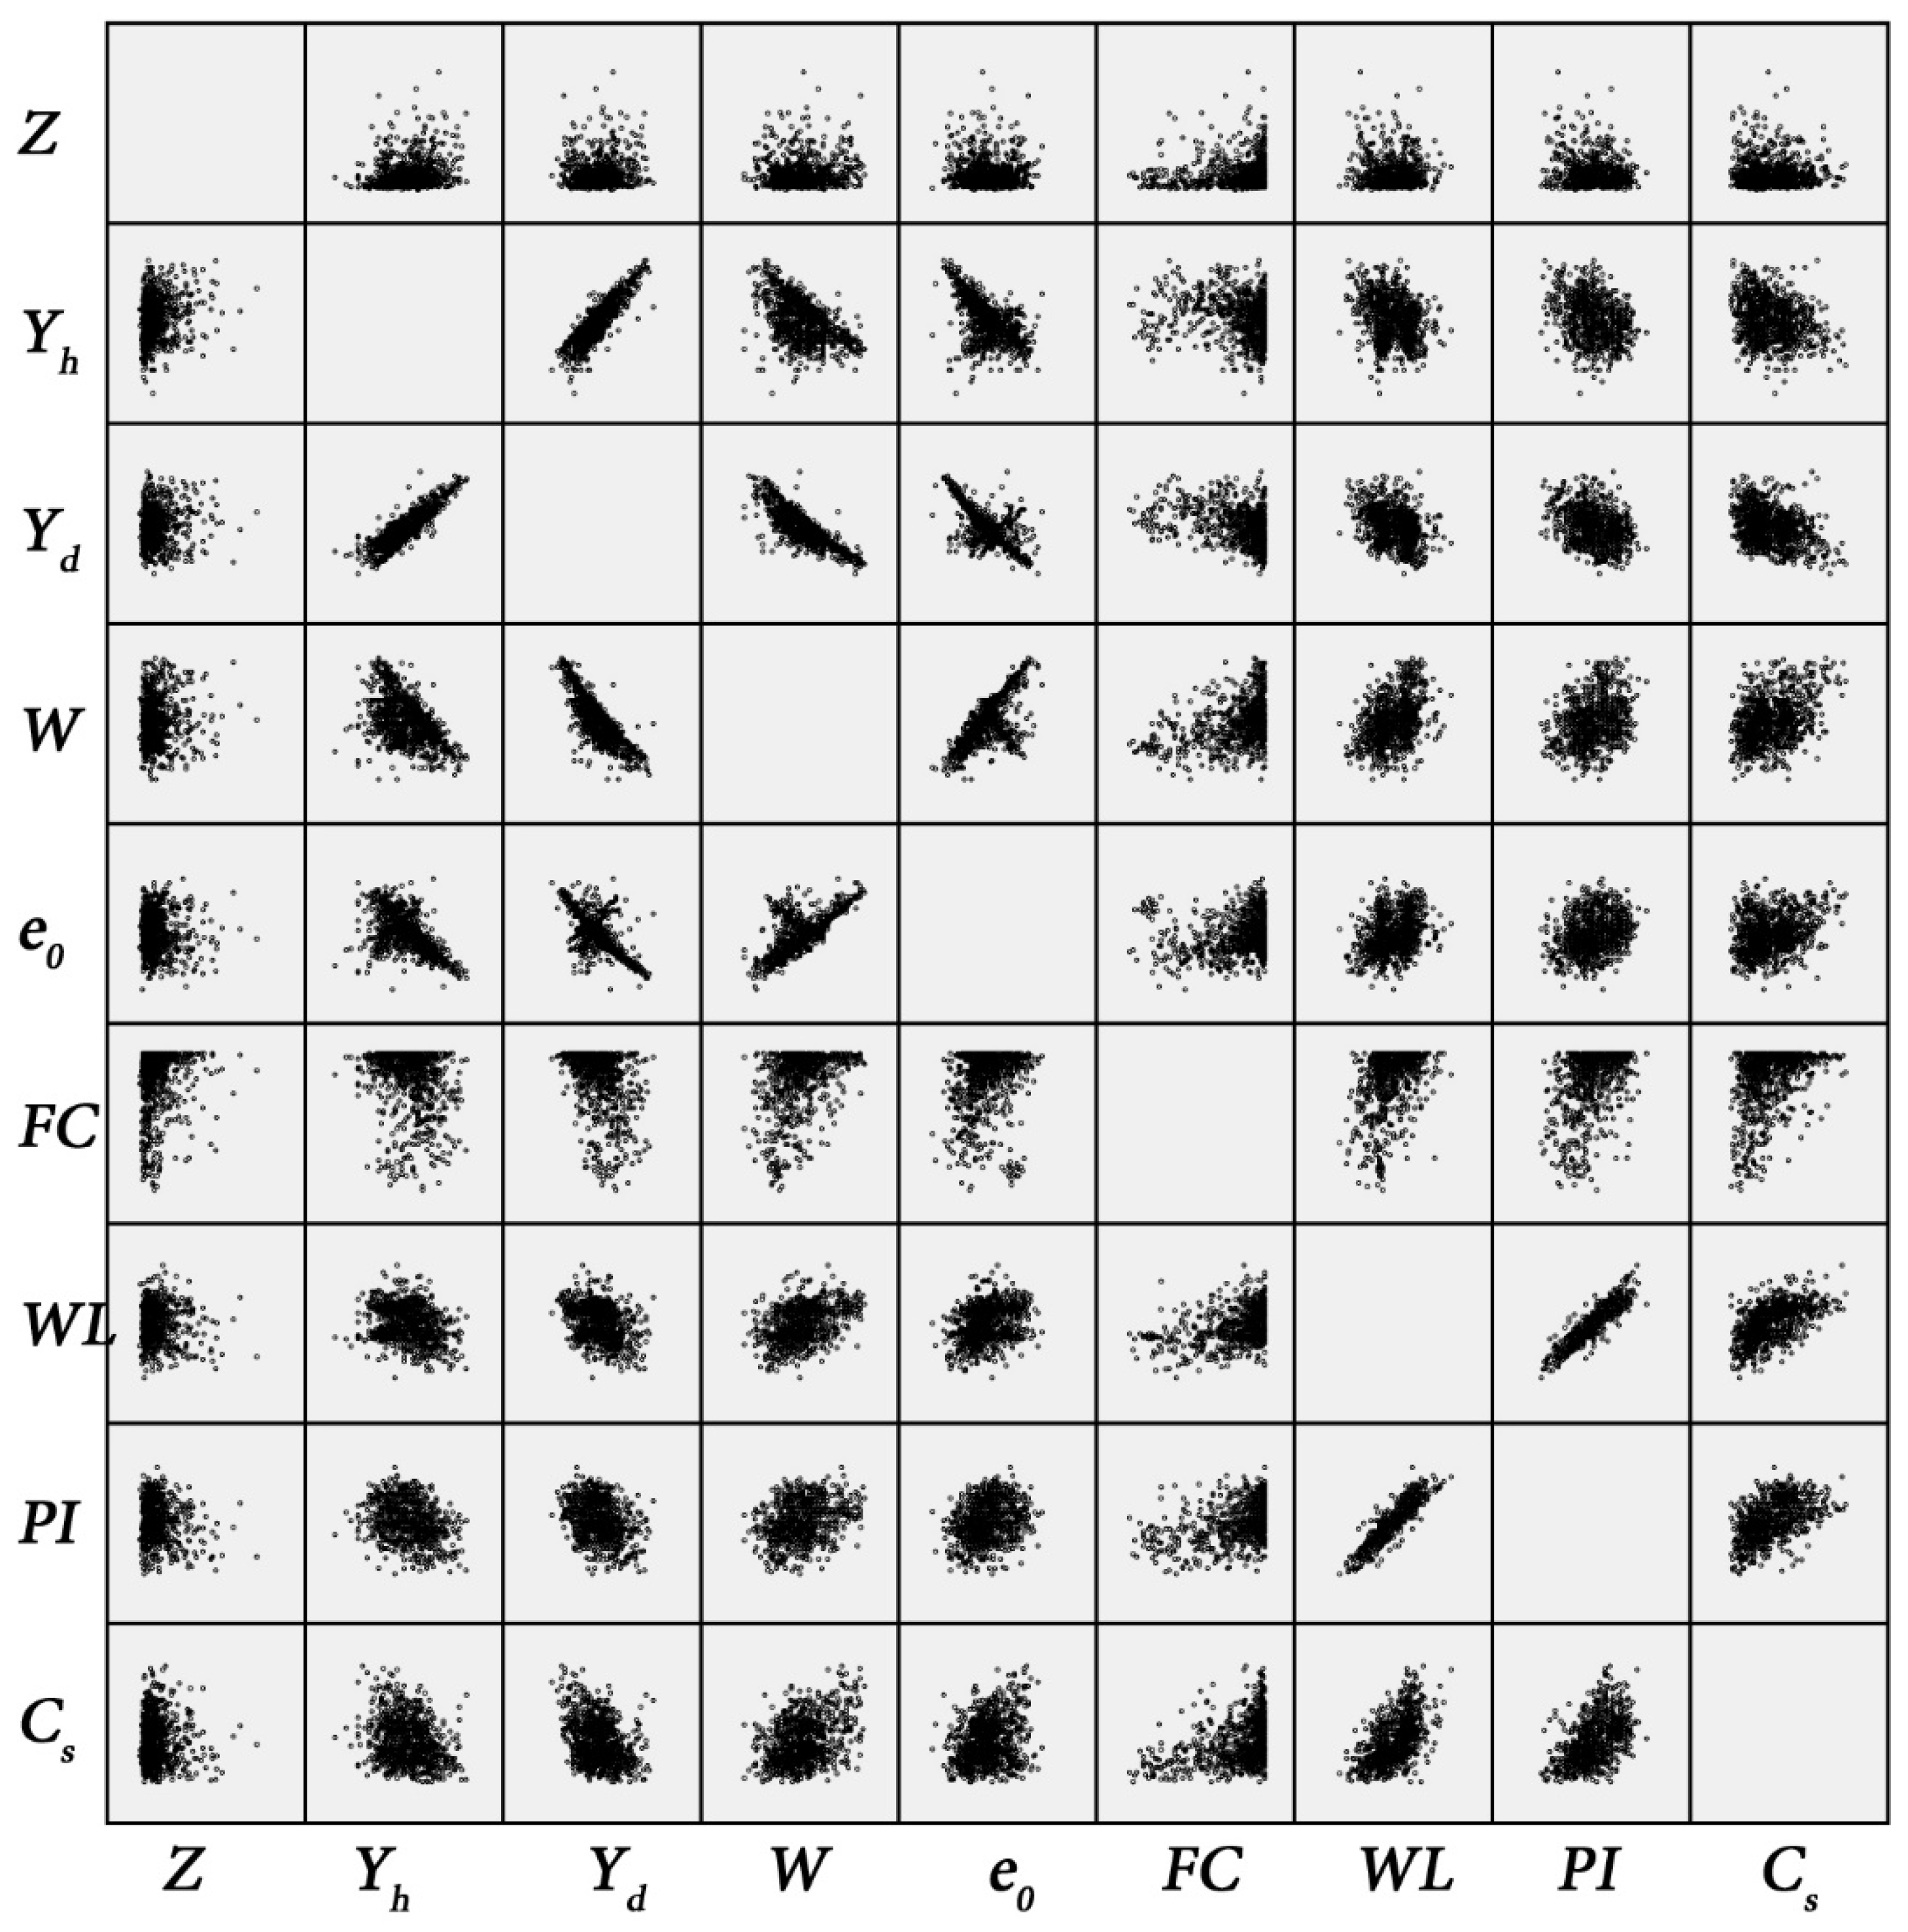
To statistically predict the correlation between Cs and soil properties, the SPSS software has used. The cross-correlation between Cs and soil parameters is presented in Figure 4, which could provide a descriptive overview of the data distribution. The results indicate a positive relationship between Cs and others parameters, except for Yd and Yh, which seem to have a negative relationship (see Figure 4); this indicates that an increase in these parameters tends to proportionally increase Cs. The Spearman correlation coefficient R and its significance between Cs and other geotechnical parameters are presented in Table 5. The results show that the significance is less than 0.05 except Z, meaning that the majority of correlations are statistically significant. On the other hand, according to Smith’ classification (1986), the Cs is moderately correlated to the aforementioned soil parameters, except Sr and Z which are poorly correlated. The results indicate that these parameters could have a complex nonlinear correlation with Cs. Moreover, in order to mathematically simulate the complex swellings phenomena, new advanced machine learning methods should be applied.
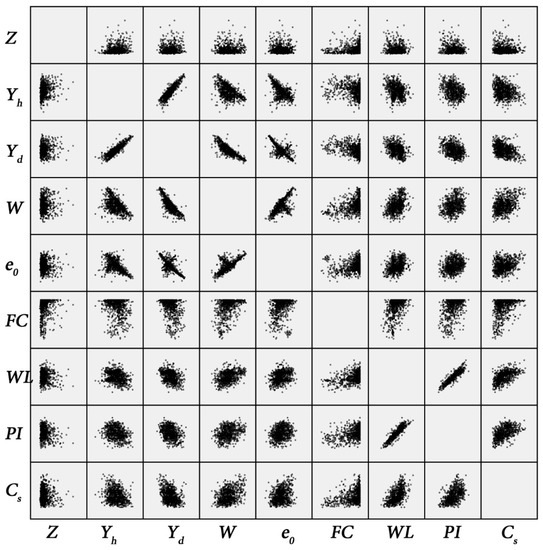
Figure 4.
The cross-correlation between Cs and soil parameters.

Table 5.
Matrix of correlation between the geotechnical parameters (* Correlation significant at α = 0.05; ** Correlation significant at α = 0.01).
3.3. Optimal Input Selection
3.3.1. Optimal Input Selection Using Principal Component Analysis
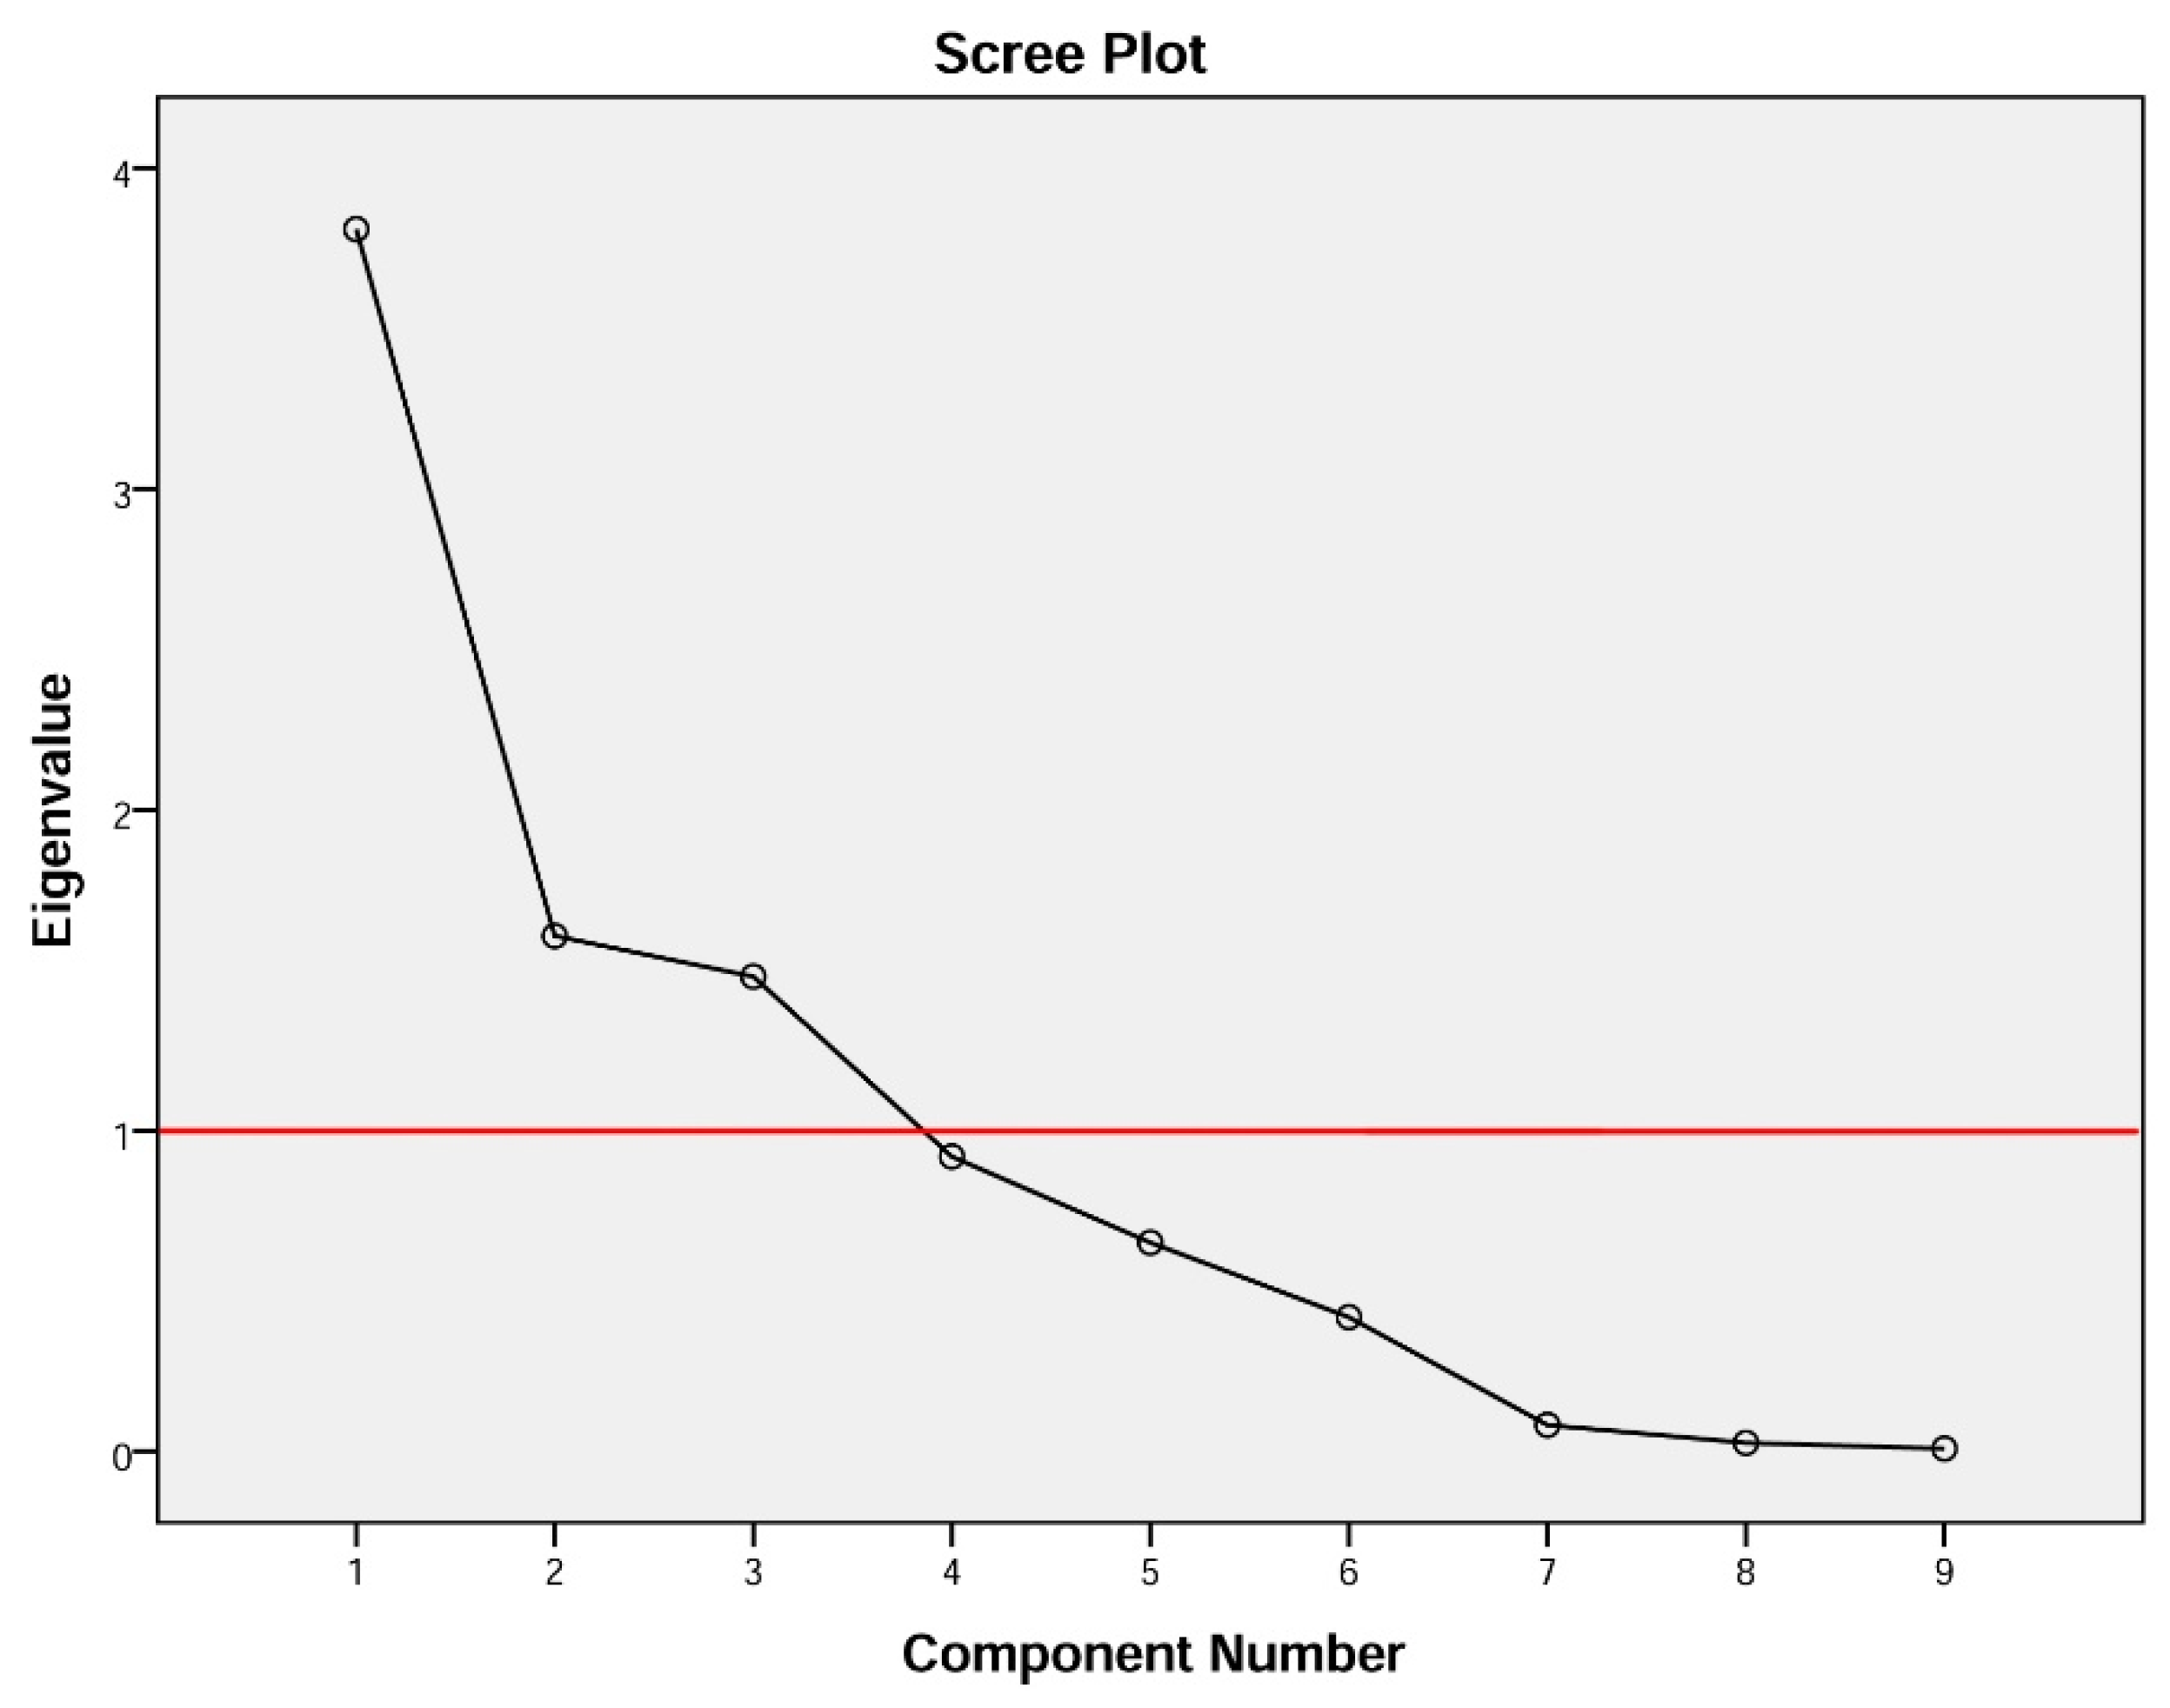
According to our knowledge, several methods were utilized in the literature to characterize the proper factors that affect the modeling precision. Therefore, the current study used the approach of selecting eigenvalues equal to or greater than 1, as illustrated in Table 6. Holland (2008) stated according to [56] that the eigenvalues are applied to condense the variance where the highest eigenvalues (1 and above) are deemed for any analysis by eigenvectors ranking in any correlation matrix. Figure 5 presents eigenvalues of each factor, which show that nine input variables correspond to nine eigenvalues. Likewise, Table 6 displays the Eigenvalue and percentage of data in each factor. It is obvious from the table that the main first three variables explain more than 75% of the factors. Similarly, the results showed that five factors have a significant percentage contribution of more than 94. The findings indicate that the best model includes three PCs as input variables according to principal component analysis.

Table 6.
Eigenvalue and percentage of data explained by each factor.
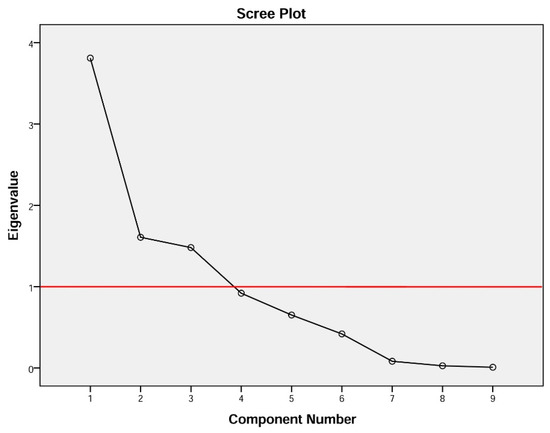
Figure 5.
The eigenvalue versus the number of factors (The black line represents the eigenvalues of each factor and the red one shows the eigenvalues equal to or greater than 1).
3.3.2. Optimal Input Selection Using the Gamma Test
In this part, the influence of the separated inputs was evaluated by building the ten various combinations (Table 7) through diverse input parameters (Sr, Z, Yh, Yd, W, e0, FC, WL and PI). It was noticed from Table 7 that the first combination contains all nine inputs (dubbed an initial set). Similarly, the second one included eight input parameters (All-Sr), which means omitted Sr from the initial set; the fourth combination comprises all inputs except Yh, and so on for rest of the combinations as presented in Table 7. The results of GT analysis shown in Table 7 prove that the parameters W, FC, WL, and PI have an important effect on the target (Cs). The four input parameters are chosen according to the maximum value of gamma statistics (Γ), and Vratio. Based on this finding, four new combinations were tested in Table 8 for the sake of determining the optimal input set. In this case, the best set was designated based on the minimum of Γ and Vratio. The outcomes of GT on four diverse combinations are illustrated in Table 8. The findings indicate that the WL, PI, FC, and W set had the lowest value of gamma statistics (Γ = 1.3524 × 10⁻⁴, Vratio = 0.3714, and Mask = 1111), and used as input variables for modelling Cs according to the Gamma Test method.

Table 7.
Optimal input variable nomination using GT.

Table 8.
GT statistics of different input models.
3.3.3. Optimal Input Selection Using Forward Selection
In this part, the FS technique is utilized as a nonlinear input selection approach in order to choose the optimal input set between nine parameters. The ANN method with one layer is used to implement the nonlinear analysis of each set according to the empirical rule proposed by Kanellopoulos and Wilkinson (1997). The authors have demonstrated that the optimal node number in a simple network is twice the number of input parameters [57]. Firstly, correlation between target and other geotechnical parameters is estimated. Secondly, the parameter having the highest correlation coefficient, (i.e., WL with R = 0.55) is chosen as the first and the most significant parameter. Then, the other inputs are added into the model one by one and launch a new ANN modelling. The one providing the best modeling result (high determination coefficient (R2)) is selected as a new input and gathered into the formerly selected parameters. This work is repeated several times until that appending other parameter to the input set does not improve the modeling performance. Hence, if the determination coefficient increases more than 5%, the novel parameter is selected. Finally, input parameters having the most heavy influence on the target are selected and others ones are rejected. Table 9 shows the results of the forward selection procedure of different input models. The findings indicate that WL, Yd, W, and PI are selected as inputs for modeling Cs according to the forward selection procedure, and the other parameters are eliminated.

Table 9.
Results of forward selection procedure of different input models.
3.4. Swelling Index Prediction through AI Models
The controlling parameters of the ELM, DNN, SVR, RF, LASSO, PLS, Ridge, KRidge, Stepwise, and GP algorithms used in this study are listed in Table 3. The performance of each models for selected optimal inputs (PSO, GT and FS) during training and validation phases is presented in Table 10. Six statistical performance indicators have been used to compare between proposed models in order to select the best one. We mention the Mean Absolute Error (MAE), Root Mean Square Error (RMSE), Index of Scattering (IOS), Nash–Sutcliffe Efficiency (NSE), Pearson correlation coefficient (R), and Index of Agreement (IOA). The data were divided into two parts, i.e., 80% for training and 20% for validation (700 samples for training and 175 for validation). It was indicated from Table 10 that the Cs modeled with several machine learning methods produced MAE (5.6 × 10⁻³ to 12.4 × 10⁻³), RMSE (0.007 to 0.0154), IOS (0.165 to 0.355), NSE (−0.88 to 0.75), R (0.59 to 0.94), and IOA (0.69 to 0.95) in the training phase. Similarly, in the validation phase, we obtain MAE (10.6 × 10⁻³ to 13.6 × 10⁻³), RMSE (0.013 to 0.017), IOS (0.298 to 0.363), NSE (−1.68 to 0.13), R (0.53 to 0.71), and IOA (0.69 to 0.82). Furthermore, the finding clearly indicates that the FS-RF (the optimal inputs of FS method trained by RF method) presents the most appropriate model that gives the highest accuracy in terms of MAE (5.6 × 10⁻³/10.6 × 10−3), RMSE (0.007/0.013), IOS (0.165/0.298), NSE (0.75/0.13), R (0.94/0.71), and IOA (0.95/0.82) during the training/validation phase. In addition, the most appropriate FS-RF model clearly follows the criteria of minimum values of error metrics (MEA, RMSE and IOS) and higher values of NSE, R, and IOA for the phase of training and validation. Furthermore, this model is closely followed by the FS-DNN model, which gives an acceptable accuracy and ranked second. Moreover, the results reveal the poor performance of the PSO-Step model in predicting the swelling index. With respect to the performance of machine learning models, during the training phase, the hierarchy follows the order of FS-RF, GT-RF, PRO-RF, FS-DNN, GT-DNN, PSO-DNN, PSO-SVR, FS-GP, GT-GP, PSO-GP, GT-SVR, GT-Step, FS-SVR, GT-Lasso, GT-PLS, FS-PLS, GT-Kridge, FS-Kridge, PSO-LS, GT-LS, PSO-ELM, FS-ELM, PSO-Lasso, PSO-Kridge, PSO-Ridge, GT-Ridge, FS-Ridge, FS-LS, FS-Step, FS-Lasso, PSO-PLS, GT-ELM, and PSO-Step. Finally, the scatter plots between target and output swelling index values of each model are presented in Appendix A.

Table 10.
Performance indicator values of AI models for predicting the Swelling index.
3.5. Evaluating the Best Fitted Model Using the K-fold Cross Validation Approach
The 10-fold cross validation approach was efficiently used to assess the predictive capacity of the proposed model. We must stress out the fact that previous studies interested in estimating Cs [20,22,23,24] have evaluated the predictive capacity of their proposed models depending on a single split. Subsequently, the capacity of their models in overcoming the over-fitting and under-fitting problems could not be ascertained. Figure 6 shows the performance measures of the best FS-RF models using 10-fold cross validation depending on training and validation data for each split. The findings prove the performance of the proposed model. The fact that R ranges between 0.92 and 0.94 for training data, and between 0.62 and 0.75 for validation data in the 10 splits, indicates the predictive capacity of the most appropriate FS-RF model for learning data, generating new validation data, and overcoming the over-fitting or under-fitting problems.
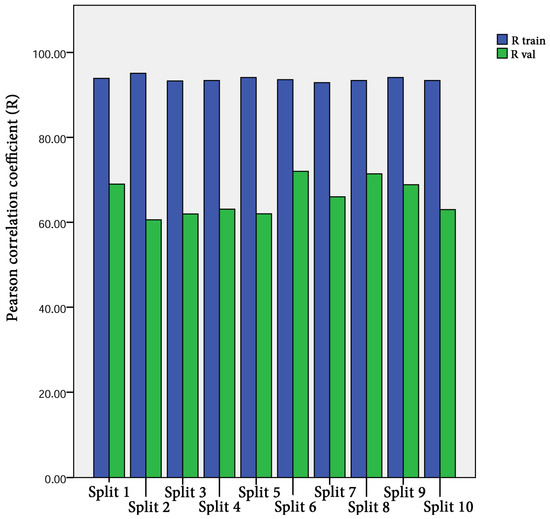
Figure 6.
Performance measures of FS-RF models using K-fold cross validation with K = 10.
3.6. Comparison between the Proposed Models and Empirical Formulae
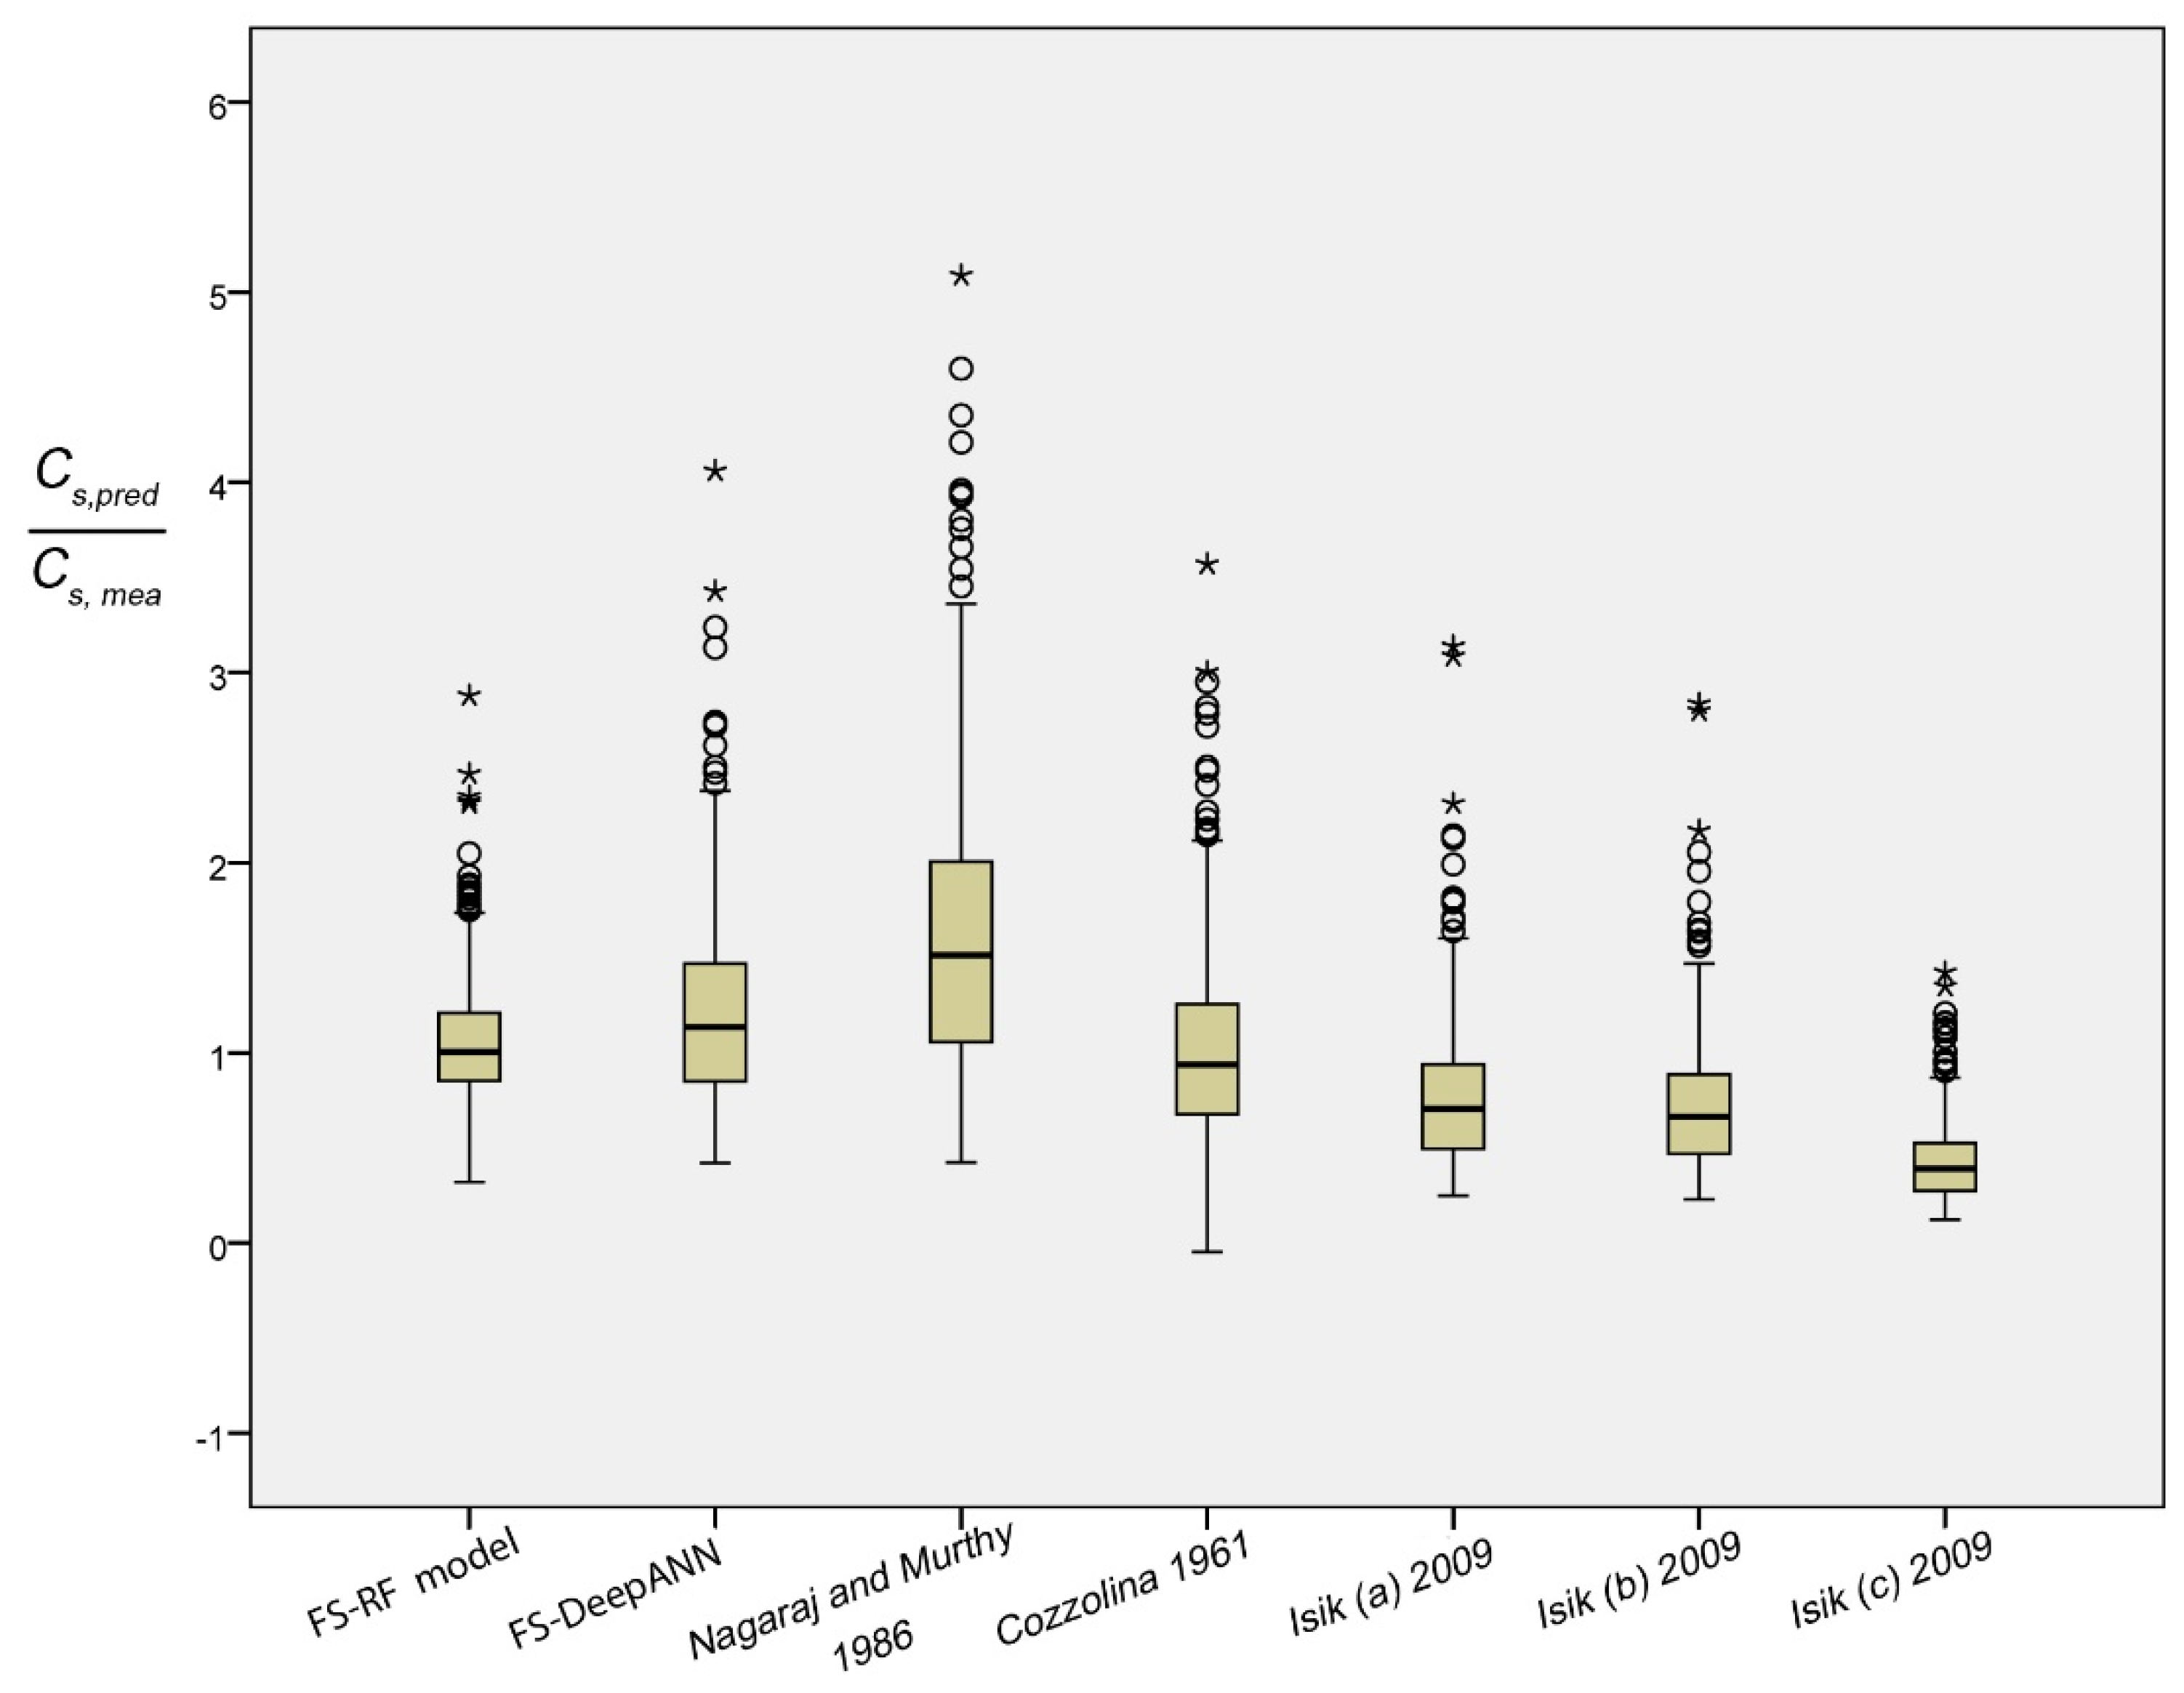
In order to test the effectiveness of the most appropriate FS-RF model, a comparative study was performed with some empirical formulae suggested by the previous studies for predicting Cs. These formulae were presented in Table 1. Table 11 illustrates the statistical results of for aforementioned empirical equations in comparison with the proposed FS-RF and FS-DNN models. The mean and standard deviation of the ratio could be useful evidence for evaluating the predictive capacity. The closer the mean value to one and the standard deviation to zero, the better is the model. The results show that the most appropriate FS-RF model is the one with the minimum standard deviation σFS-RF = 0.25, in addition to being the closer mean value to 1 average(FS-RF) = 1.07. The other equations indicate a poor predictive capacity, yielding a mean value in the range of 0.45–1.7, and standard deviation value between 0.26–0.99. Equally, the box plot of of aforementioned formulae is displayed in Figure 7. This graphical representation provides an overview of the dispersion and skewness of every model. The scattering of the most appropriate FS-RF model appears only to be slightly regular and close to one, and is described by a shorter box than the others. The large box distant from 1, increasing to five in certain models, shows little variation in predicting Cs. Data characterized by circles and stars in the figure denote the extreme and extra-extreme value.

Table 11.
Statistical results of the ratio for some proposed empirical formulae.
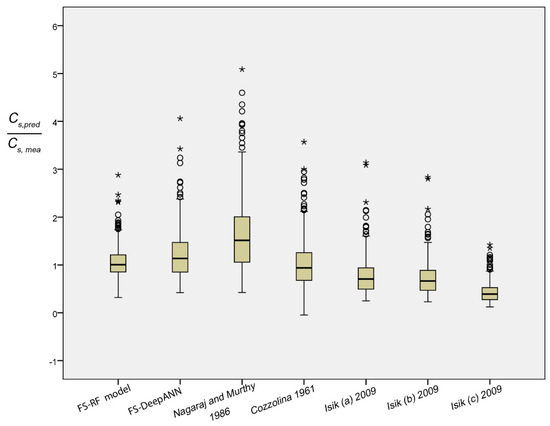
Figure 7.
Box plot of the ratio for some empirical formulas and the most appropriate model (Hollow and asterisks circles indicate respectively the extreme and extra-extreme value).
3.7. Sensitivity Analysis
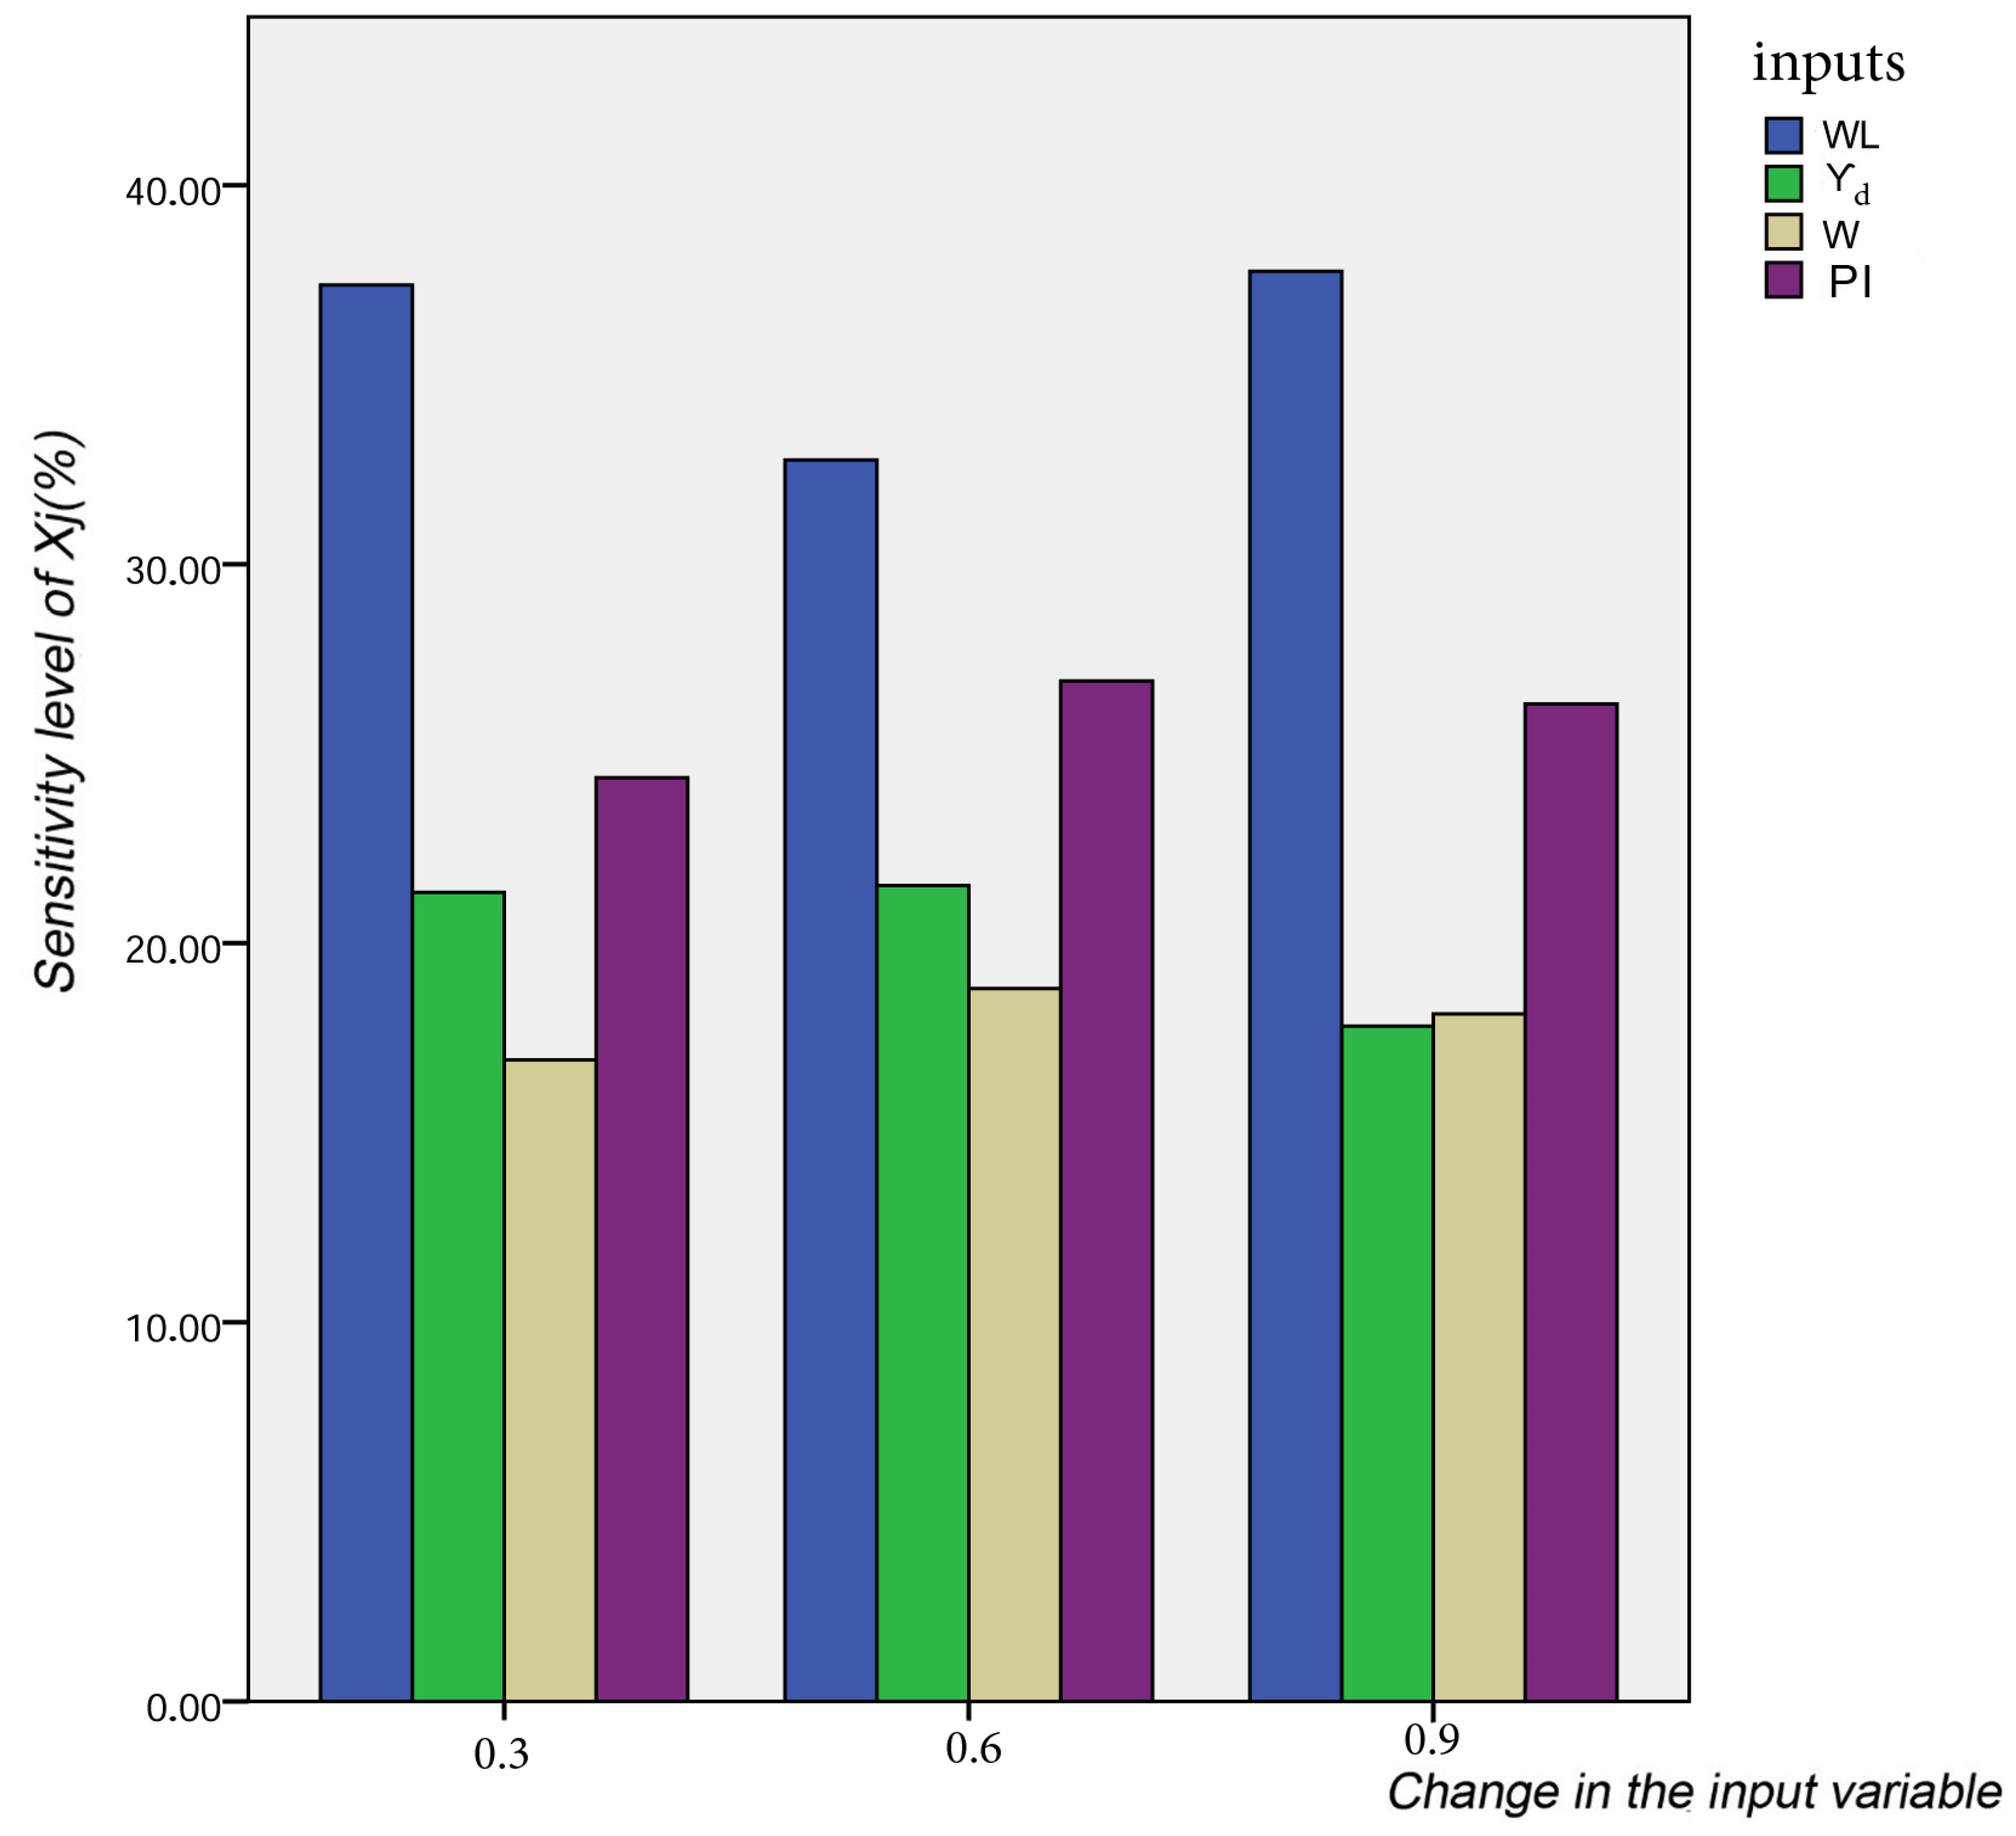
To answer the question “Which input variables have the most or less influence on Cs in the proposed model?”, a sensitivity analysis has been carried out using the step-by-step method [58]. In this approach, the normalized input neurons vary at a constant rate, one at a time, while the other variables are held constant. Different constant rates (0.3, 0.6 and 0.9) are selected in the current study. For every input, the percentage of change in the output, as a result of the change in the input, is recorded. The sensitivity of each input is computed based on Equation (18):
where K is the number of data sets used in the study (K = 875). The results of the sensitivity analysis of proposed FS-RF model are shown in Figure 8. It can be noticed that Cs is significantly influenced by WL, and its sensibility ratio is between 32–38%. This parameter is closely followed by the PI, which gives a moderate sensitivity and is ranked second. In addition, W and Yd have little effect on Cs.
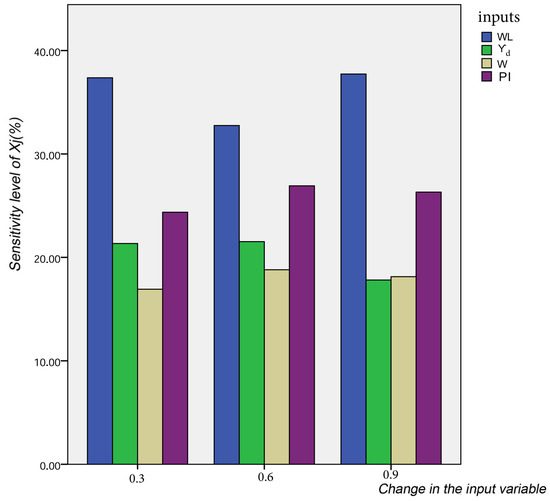
Figure 8.
Results of the sensitivity analysis of the proposed model.
4. Discussion
4.1. Significance of the Findings and Cross-Validation of the Results
The main motivation of this study is to explore the capability of advanced machine learning methods to generate a reliable model aimed at easily predicting Cs. Needless to say, Cs is one of the most indispensable geotechnical parameters required to estimate the settlement and the swelling degree in the every site. Firstly, in order to identify the optimal input parameters, which have the ideal influence on Cs three advanced methods have been used. PSO proposed three lower-dimensional parameters as an optimal input. GT indicated that WL, PI, FC, and W could formalize the optimal input set. However, FS showed that WL, Yd, W, and PI are the best ones. The reason behind the difference between the three approaches lies in the philosophy of each one in handling the data. Based on that, ten advanced machine learning methods (ELM, DNN, SVR, RF, LASSO, PLS, Ridge, KRidge, Stepwise, and GP) have applied for modeling the three selected optimal input set (PSO, GT, and FS). The findings clearly indicate that the optimal input is the one chosen by FS and trained by the RF method (FS-RF). The latter presents the most appropriate model, which gave the minimum values of error metrics (MEA, RMSE, and IOS) and higher values of NSE, R, and IOA compared to other models. Furthermore, the emerging model was evaluated by the K-fold cross validation approach and compared with other proposed formulae. The conclusion is that the FS-RF model could generate new data without over-fitting or under-fitting, and being more effective than the empirical formulae. The other most interesting aspect is the optimal input set related to the best FS-RF model (WL, Yd, W, PI). Interestingly, this also accords with several studies, which have showed that physical parameters indirectly affected the swelling phenomena [59]. It is known that the micro-scale features of swelling soils comprise the mineral composition of clay particles, their reaction with the water chemistry, and the cations attracted to the clay particle by electrical forces. These micro-scale factors influence macro-scale physical factors, such as density, plasticity, and water content to control the engineering comportment of soil [59]. Additionally, the last part consists of the sensitivity analysis, which gives an overview about the more influenced parameters on Cs according to the proposed model. The findings indicate that WL and PI are respectively the most affected factors on Cs, meaning that swelling phenomena are primarily influenced by plasticity parameters. In addition, water content and dry density have little effect on Cs.
4.2. Scientific Importance of the Findings and Novelty of the Research
Our findings represent a crucial contribution to the geotechnical field. The elaborated model building in our study represents a reliable tool for estimating Cs without doing an Oedomter test. The performance of the estimation has been highly developed compared with other models and formulae proposed in the literature, which are based just on simple regression or neural networks. According to these data, we can infer that the Random Forest method, which is applied in this study for the first time for modeling swelling index, could yield more effective and accurate results than the DeepANN and ANN method in modelling geotechnical phenomena. These results provide further support for the hypothesis that macroscale physical factors, such as density, plasticity, and water content, are the parameters that affected the swelling phenomena. Moreover, the sensitivity analysis of the proposed model revealed the most influenced parameters between them for better understanding the complex behavior of the swelling. This investigation enhances our understanding that the plasticity of soil consisting of the WL and PI are the most affected factors on swelling phenomena. In addition to these conceptual advantages, for enhancing the training phase, a large number of samples (875 tests) and multiple input parameters have been used in this study. The sophisticated k-fold cross-validation approach was utilized to test the capability of the best model to overcome under-fitting and over-fitting problems.
4.3. Limitations of the Study and Future Research Directions
Despite the impressive multiple results presented in this study, a number of important limitations need to be considered. The most important limitation lies in the fact that the proposed machine learning models suffered from the hard fitting used in the future study. Generally, to overcome this limitation, researchers have presented elaborated models in the form of programed Interface or simple script by a known programming language like Matlab and Python for generating the proposed model. Another limitation of using this kind of data is due to its inability to generalize new conditions or circumstances that are not used in training data. Investigators generally used big collected data by transferring knowledge between them. This is an important issue for future research to use more data gathered from multiple countries for better learning and more reliable results. A further study using meta-heuristic algorithms on estimating Cs is therefore suggested. We note, for example, Particle Swarm Optimization (PSO) and Gravitational Search Algorithm (GSA), bee colony algorithm (ABC), Bio-geography-Based Optimization (BBO), Whale Optimization Algorithm (WOA), Ant Colony Optimization (ACO), and Grey Wolf Optimizer (GWO). These algorithms have proved high-performance results combined with machine learning techniques leading to improving their learning and rapidly converging to the best solution. The application of these meta-heuristic algorithms combined with machine learning methods have shown very impressive results in the abroad fields [60,61,62].
5. Conclusions
This study set out to optimize the swelling index parameter conducted by the expensive and time-consuming Oedometer test, contributing to elaborating on a new accurate model for predicting the swelling index (Cs) from easily obtained geotechnical physical parameters. To achieve our aim, several advanced machine learning methods were used for a practical analysis aimed at modeling the physical parameters including the wet density (Yh), the dry density (Yd), the degree of saturation (Sr), the plasticity index (PI), the water content (w), the void ratio (e), the liquid limit (WL), sample depth (Z), and the fine contents (FC). Firstly, principal component analysis (PCA), Gamma test (GT), and the forward selection (FS) approach are utilized to reduce the input variable numbers and choose the optimal ones. The results indicate the reduction of nine input variables to four (using FS and GT) and three (using PCA techniques). Afterward, the advanced machine learning techniques have applied for modeling the proposed optimal inputs and their accuracy models were evaluated through six statistical indicators (MAE, RMSE, IOS, NSE, R, and IOA). The comparison of results assessment between different proposed models revealed the superiority of the FS-RF model, which gives the highest accuracy in terms of MAE (5.6 × 10⁻³/10.6 × 10−3), RMSE (0.007/0.013), IOS (0.165/0.298), NSE (0.75/0.13), R (0.94/0.71), and IOA (0.95/0.82) during the training/validation phase. For assessing the predictive capacity of the proposed FS-RF model, the K-fold cross validation approach with K = 10 has been carried out. The results show that this model has a high correlation coefficient, ranging between 0.92 and 0.94 for training data, and 0.62 to 0.75 for validation data in the 10 splits, meaning that any over-fitting or under-fitting have been found. Three criteria were used to compare the performances of the most appropriate FS-RF model with the proposed formulas in the literature: the mean, the standard deviation, and the Box plot of the ratio . The findings indicate that the aforementioned FS-RF model is more effective than the empirical formulae. Finally, a sensitivity analysis was carried out in order to assess the impacts of the soil parameter inputs on the model performance. The results proved that WL has the most important effect on the prediction of Cs. PI has a moderate influence and ranked second. In addition, W and Yd have little effect on Cs.
In the future studies, it is recommended that meta-heuristic algorithms be undertaken, like Particle Swarm Optimization (PSO) and Gravitational Search Algorithm (GSA), Biogeography-Based Optimization (BBO), Whale Optimization Algorithm (WOA), Ant Colony Optimization (ACO), and Grey Wolf Optimizer (GWO). These algorithms have proved high performance results combined with the machine learning techniques leading to improving their learning and rapidly converging to the best solution.
Author Contributions
Conceptualization, M.A.B.; methodology, M.A.B.; software, M.A.B.; validation, M.A.B. and A.-I.P.; formal analysis, M.A.B.; investigation, M.A.B.; resources, M.A.B.; data curation, M.A.B.; writing—original draft preparation, M.A.B. and A.-I.P.; writing—review and editing, M.A.B. and A.-I.P.; visualization, M.A.B. and A.-I.P.; supervision, M.A.B. and A.-I.P.; project administration, M.A.B.; funding acquisition, M.A.B. and A.-I.P. All authors have read and agreed to the published version of the manuscript.
Funding
This research received no external funding.
Institutional Review Board Statement
Not applicable.
Informed Consent Statement
Not applicable.
Data Availability Statement
Restrictions apply to the availability of these data. Data was obtained from the National Earthquake Engineering Research Center (CGS), central public works laboratory (LCTP), Algiers Metro, Algiers Tramway, Cosider Engineering, Cosider Construction, and SAPTA and are available from the providers by request.
Acknowledgments
The authors are much indebted to the National Earthquake Engineering Research Center (CGS), central public works laboratory (LCTP), Algiers Metro, Algiers Tramway, Cosider Engineering, Cosider Construction, and SAPTA for providing the borehole data used in this study. They would also like to express deep gratitude to the Microzonage team of the National Earthquake Engineering Research Center.
Conflicts of Interest
The authors declare no conflict of interest.
Appendix A
The scatter plots between target and output swelling index value by advanced machine learning models:
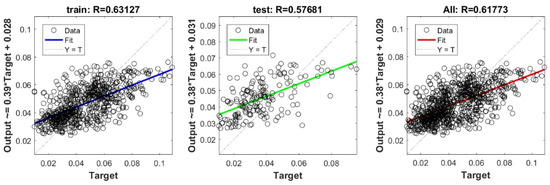
Figure A1.
Scatter plots between target and output value by the FS-SVR model.
Figure A1.
Scatter plots between target and output value by the FS-SVR model.
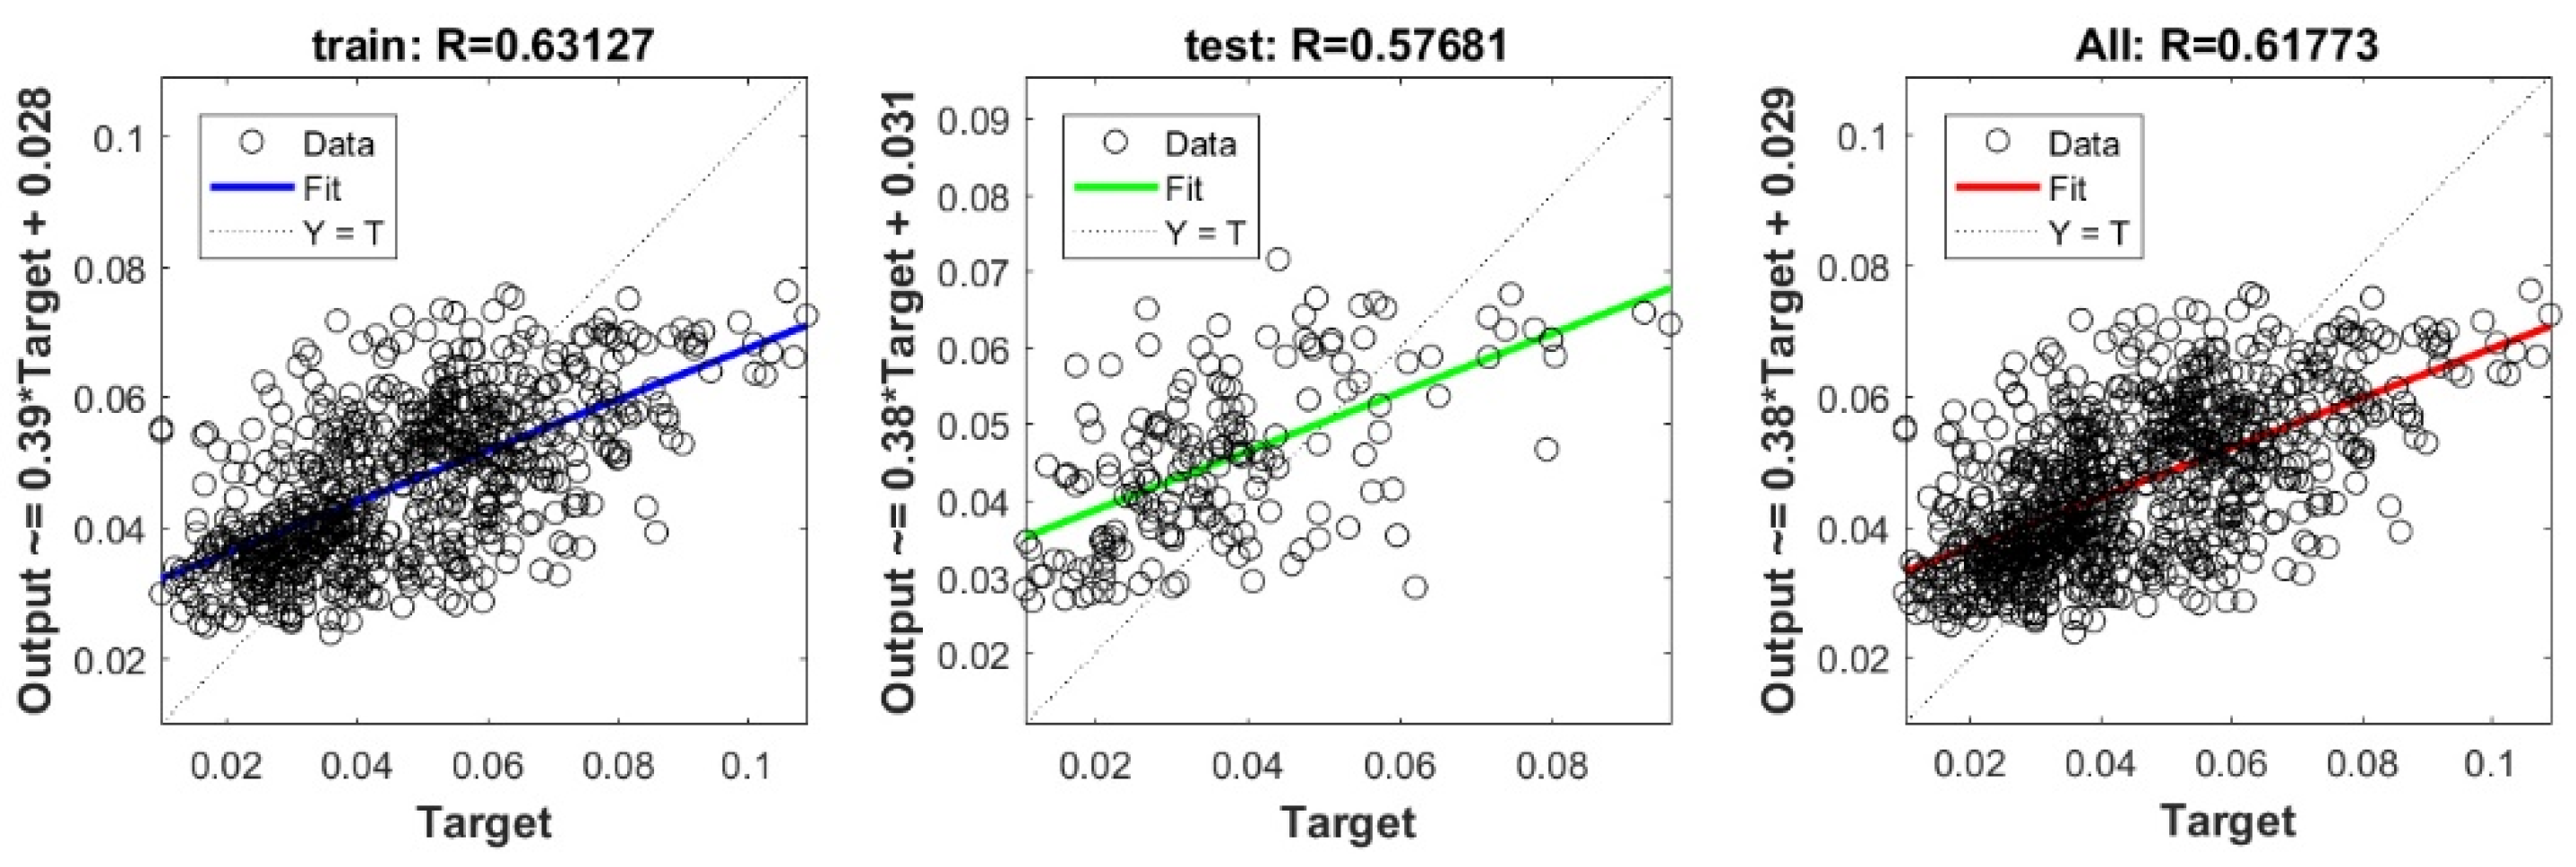
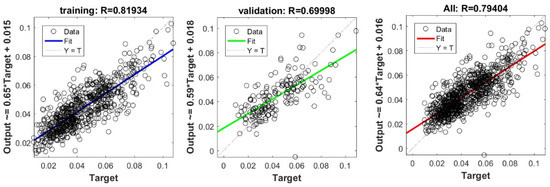
Figure A2.
Scatter plots between target and output value by the FS-DNN model.
Figure A2.
Scatter plots between target and output value by the FS-DNN model.
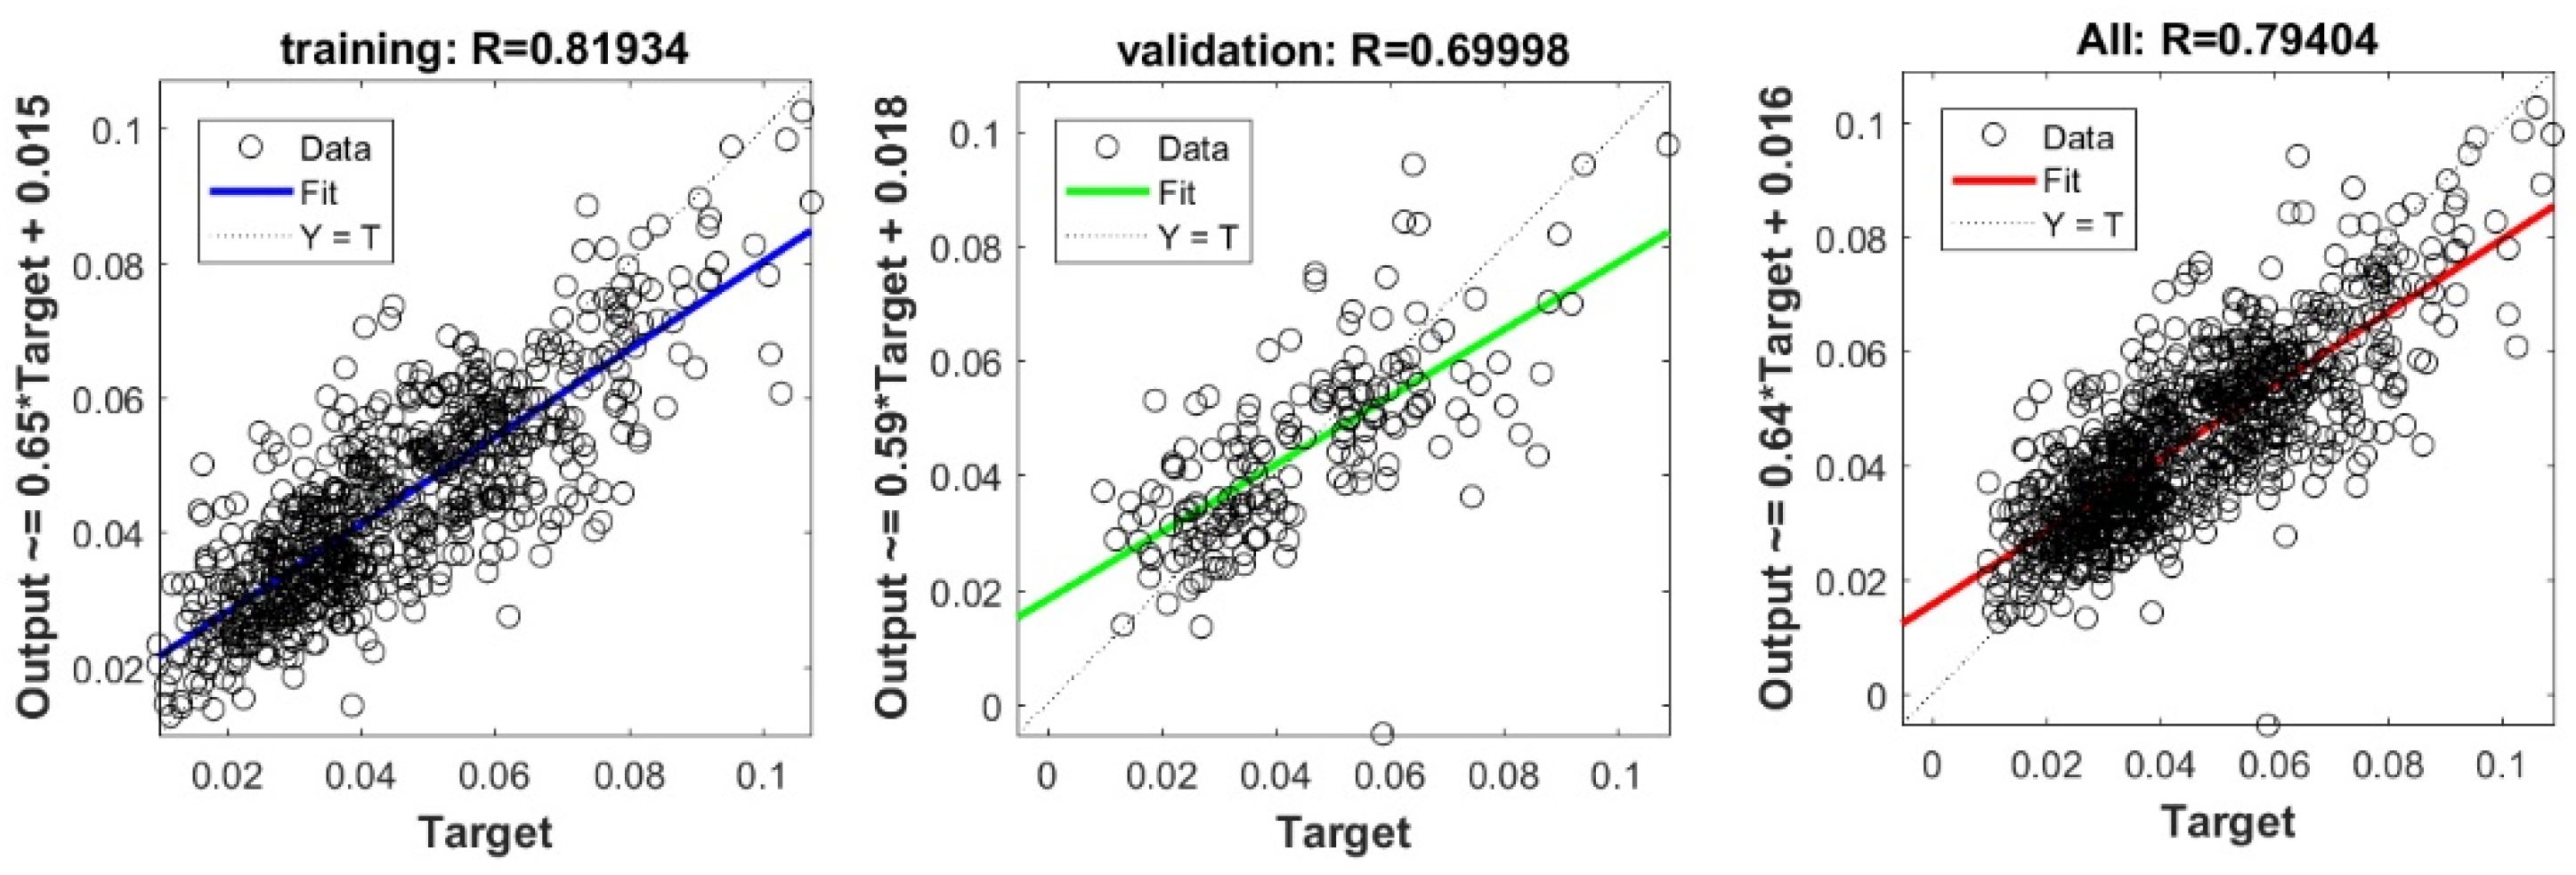

Figure A3.
Scatter plots between target and output value by the FS-ELM model.
Figure A3.
Scatter plots between target and output value by the FS-ELM model.


Figure A4.
Scatter plots between target and output value by the FS-GP model.
Figure A4.
Scatter plots between target and output value by the FS-GP model.


Figure A5.
Scatter plots between target and output value by the FS-KRidge model.
Figure A5.
Scatter plots between target and output value by the FS-KRidge model.


Figure A6.
Scatter plots between target and output value by the FS-lasso model.
Figure A6.
Scatter plots between target and output value by the FS-lasso model.

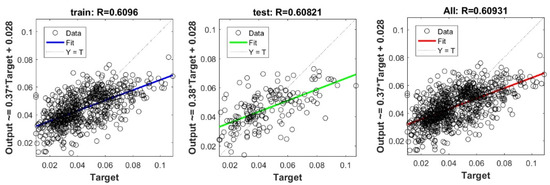
Figure A7.
Scatter plots between target and output value by the FS-PLS model.
Figure A7.
Scatter plots between target and output value by the FS-PLS model.
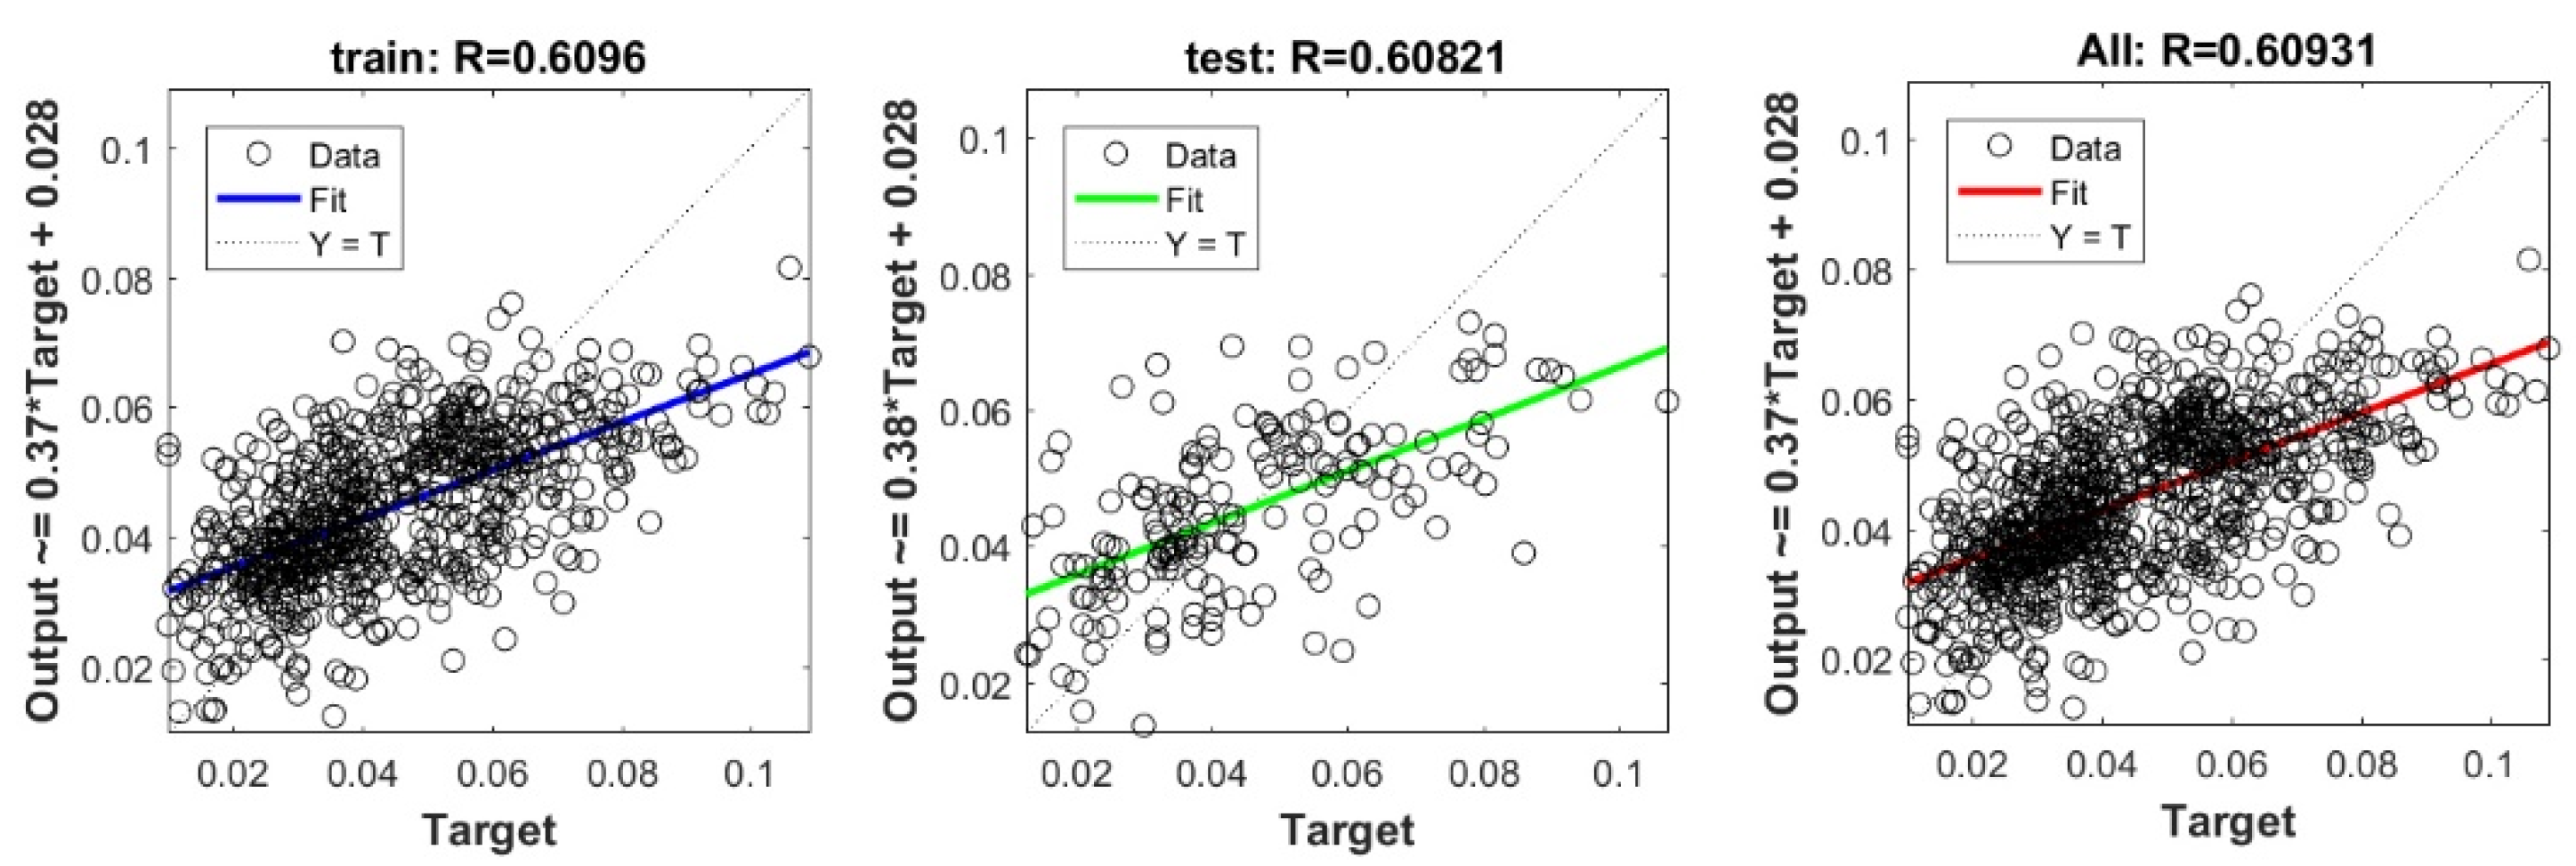

Figure A8.
Scatter plots between target and output value by the FS-RF model.
Figure A8.
Scatter plots between target and output value by the FS-RF model.


Figure A9.
Scatter plots between target and output value by the FS-Ridge model.
Figure A9.
Scatter plots between target and output value by the FS-Ridge model.

Figure A10.
Scatter plots between target and output value by the FS-STEP model.
Figure A10.
Scatter plots between target and output value by the FS-STEP model.
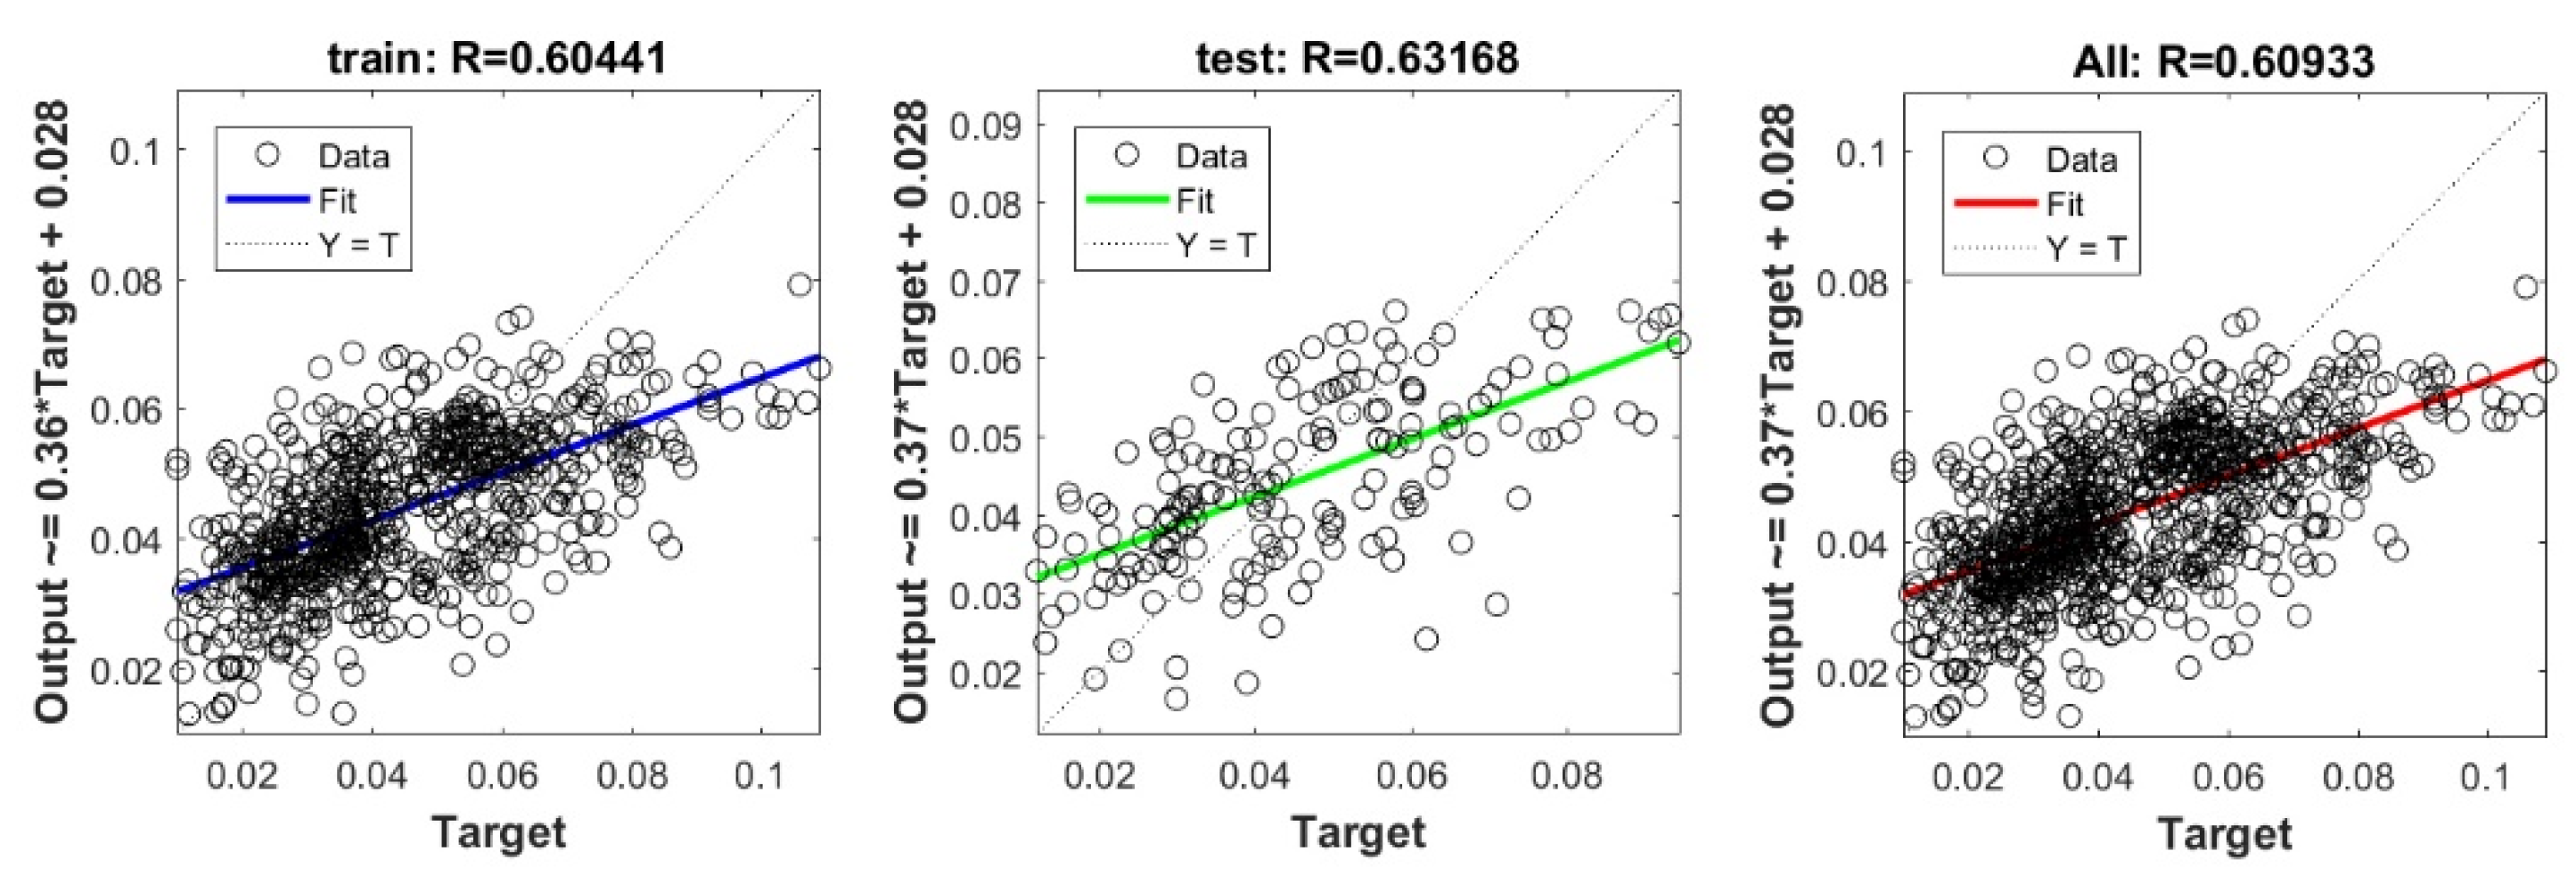

Figure A11.
Scatter plots between target and output value by the GT-DNN model.
Figure A11.
Scatter plots between target and output value by the GT-DNN model.

Figure A12.
Scatter plots between target and output value by the GT-ELM model.
Figure A12.
Scatter plots between target and output value by the GT-ELM model.
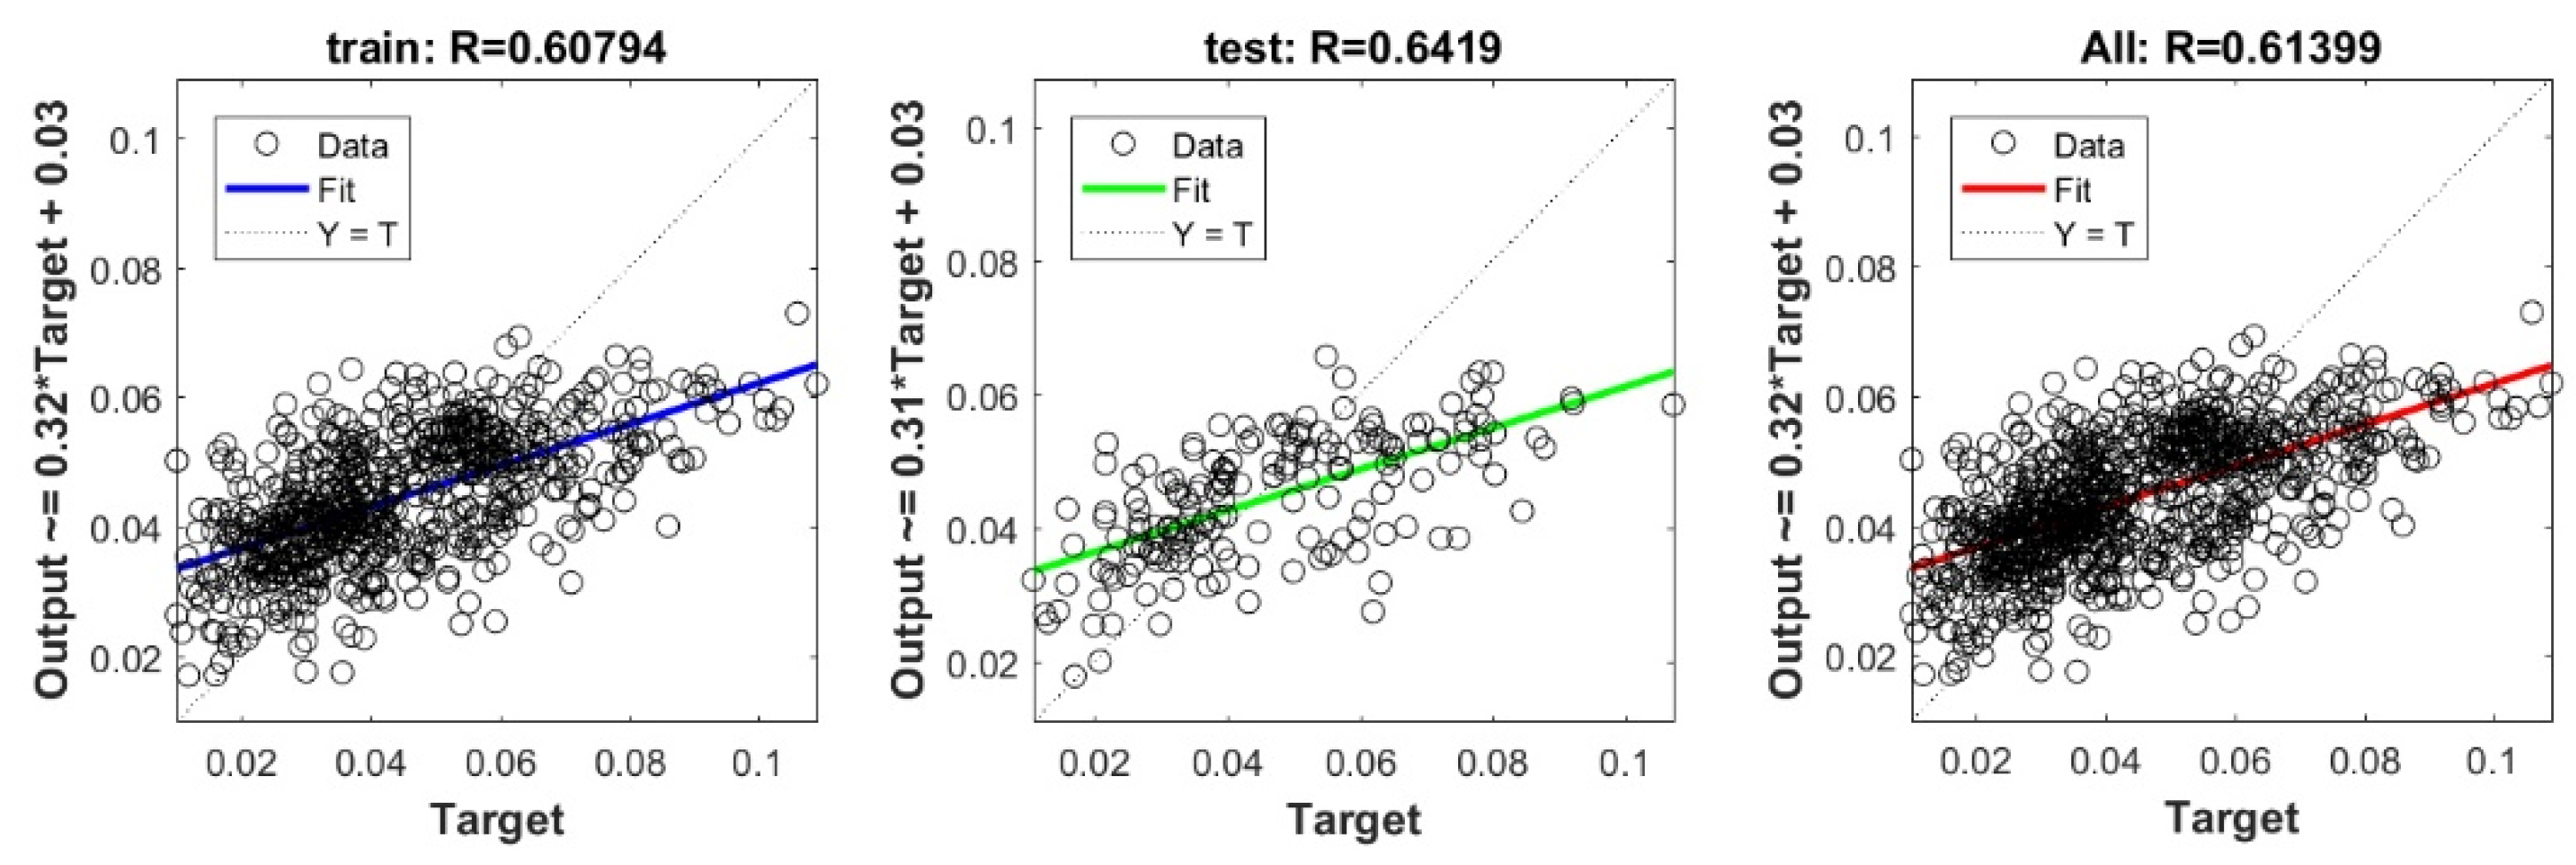

Figure A13.
Scatter plots between target and output value by the GT-GP model.
Figure A13.
Scatter plots between target and output value by the GT-GP model.


Figure A14.
Scatter plots between target and output value by the GT-KRidge model.
Figure A14.
Scatter plots between target and output value by the GT-KRidge model.
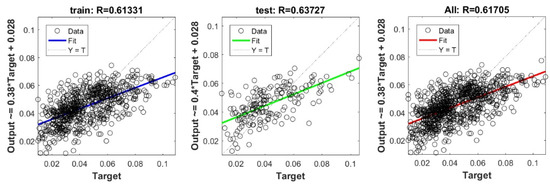
Figure A15.
Scatter plots between target and output value by the GT-Lasso model.
Figure A15.
Scatter plots between target and output value by the GT-Lasso model.
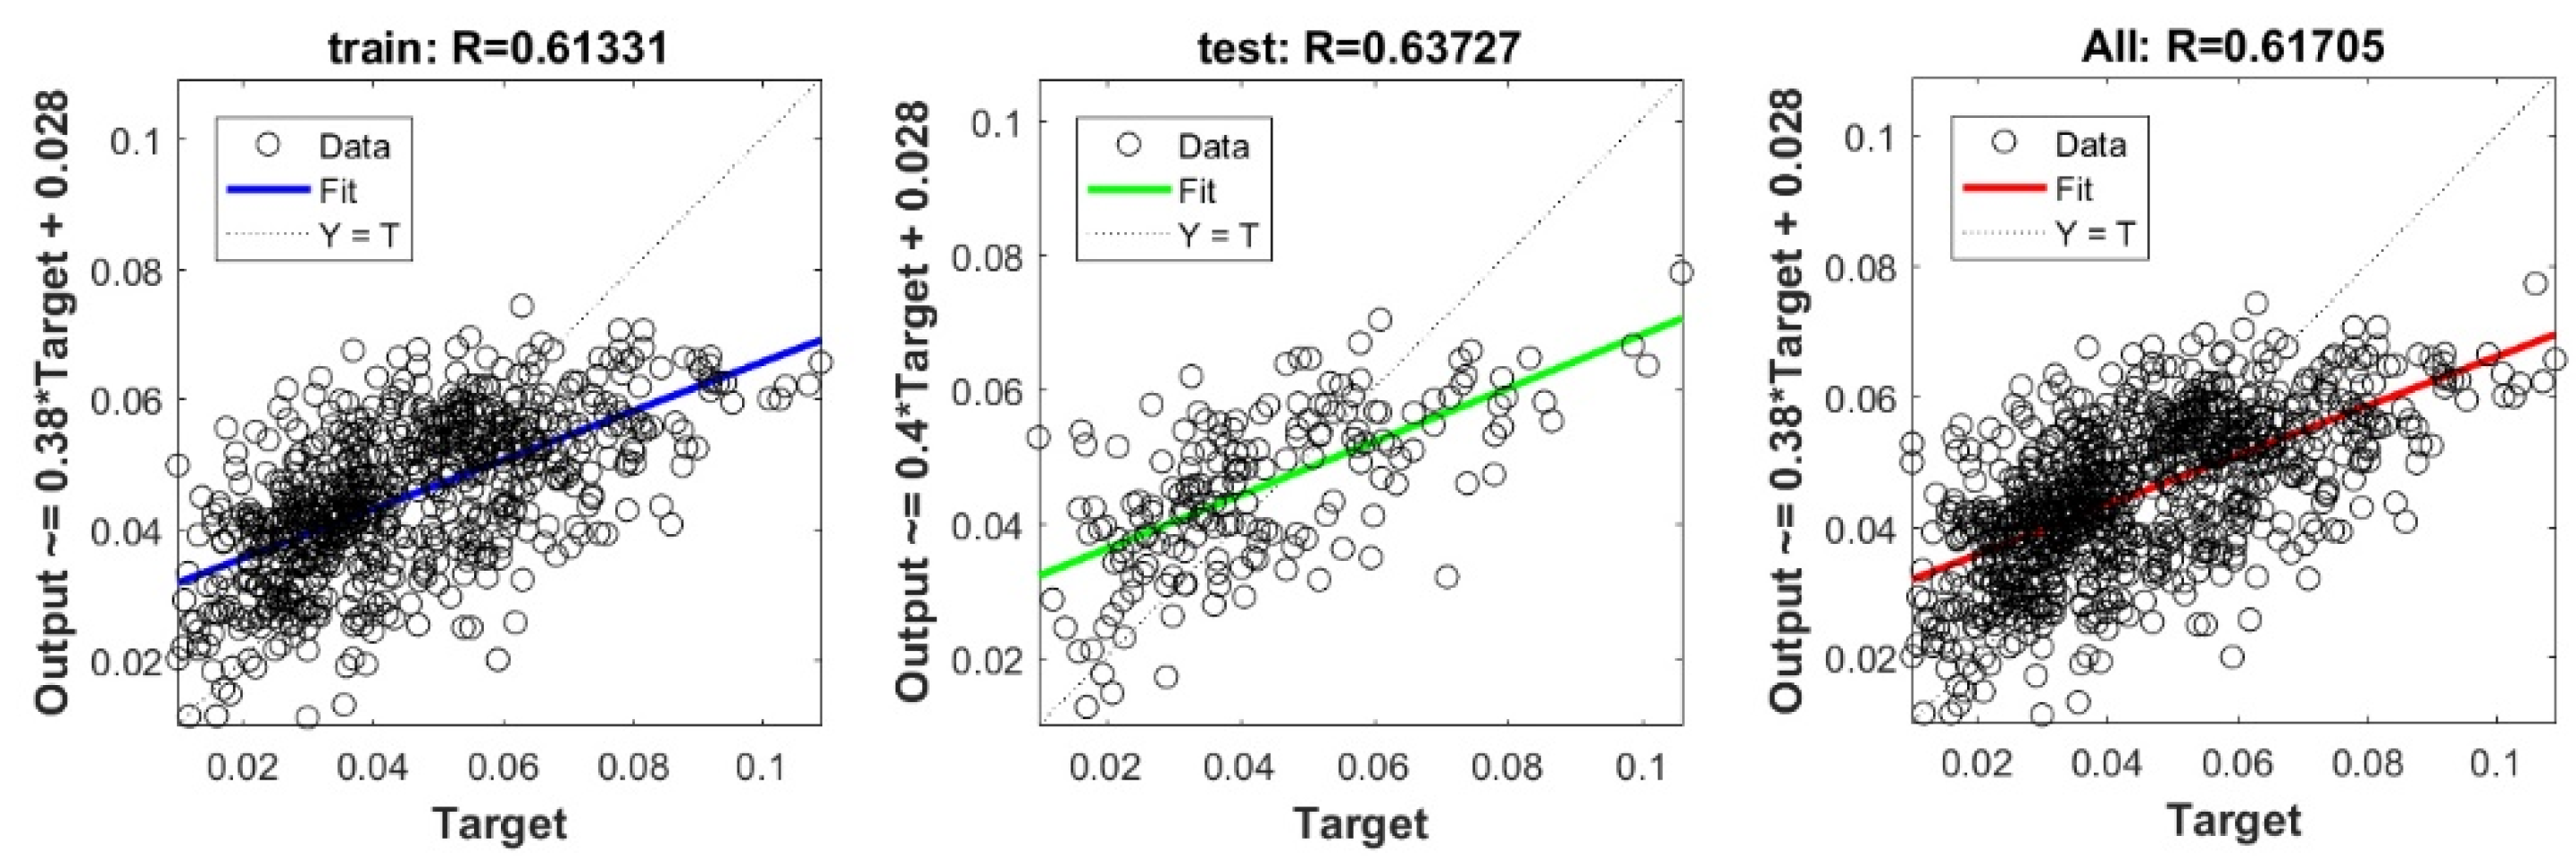
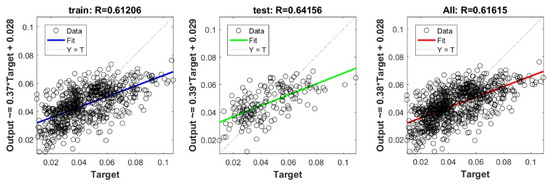
Figure A16.
Scatter plots between target and output value by the GT-PLS model.
Figure A16.
Scatter plots between target and output value by the GT-PLS model.
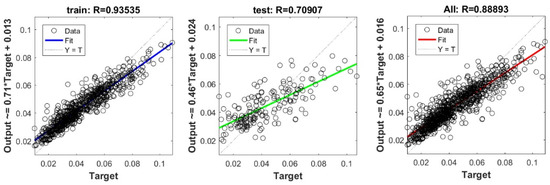
Figure A17.
Scatter plots between target and output value by the GT-RF model.
Figure A17.
Scatter plots between target and output value by the GT-RF model.

Figure A18.
Scatter plots between target and output value by the GT-Ridge model.
Figure A18.
Scatter plots between target and output value by the GT-Ridge model.

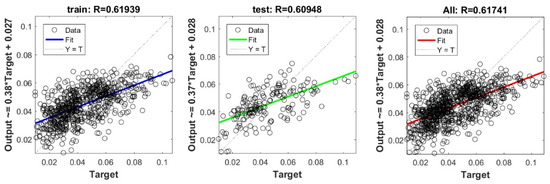
Figure A19.
Scatter plots between target and output value by the GT-Step model.
Figure A19.
Scatter plots between target and output value by the GT-Step model.
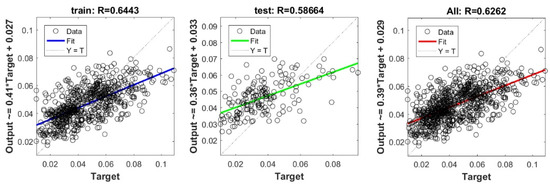
Figure A20.
Scatter plots between target and output value by the GT-SVR model.
Figure A20.
Scatter plots between target and output value by the GT-SVR model.
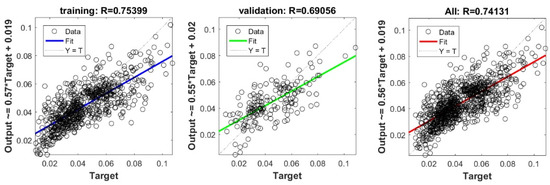
Figure A21.
Scatter plots between target and output value by the PSO-DNN model.
Figure A21.
Scatter plots between target and output value by the PSO-DNN model.
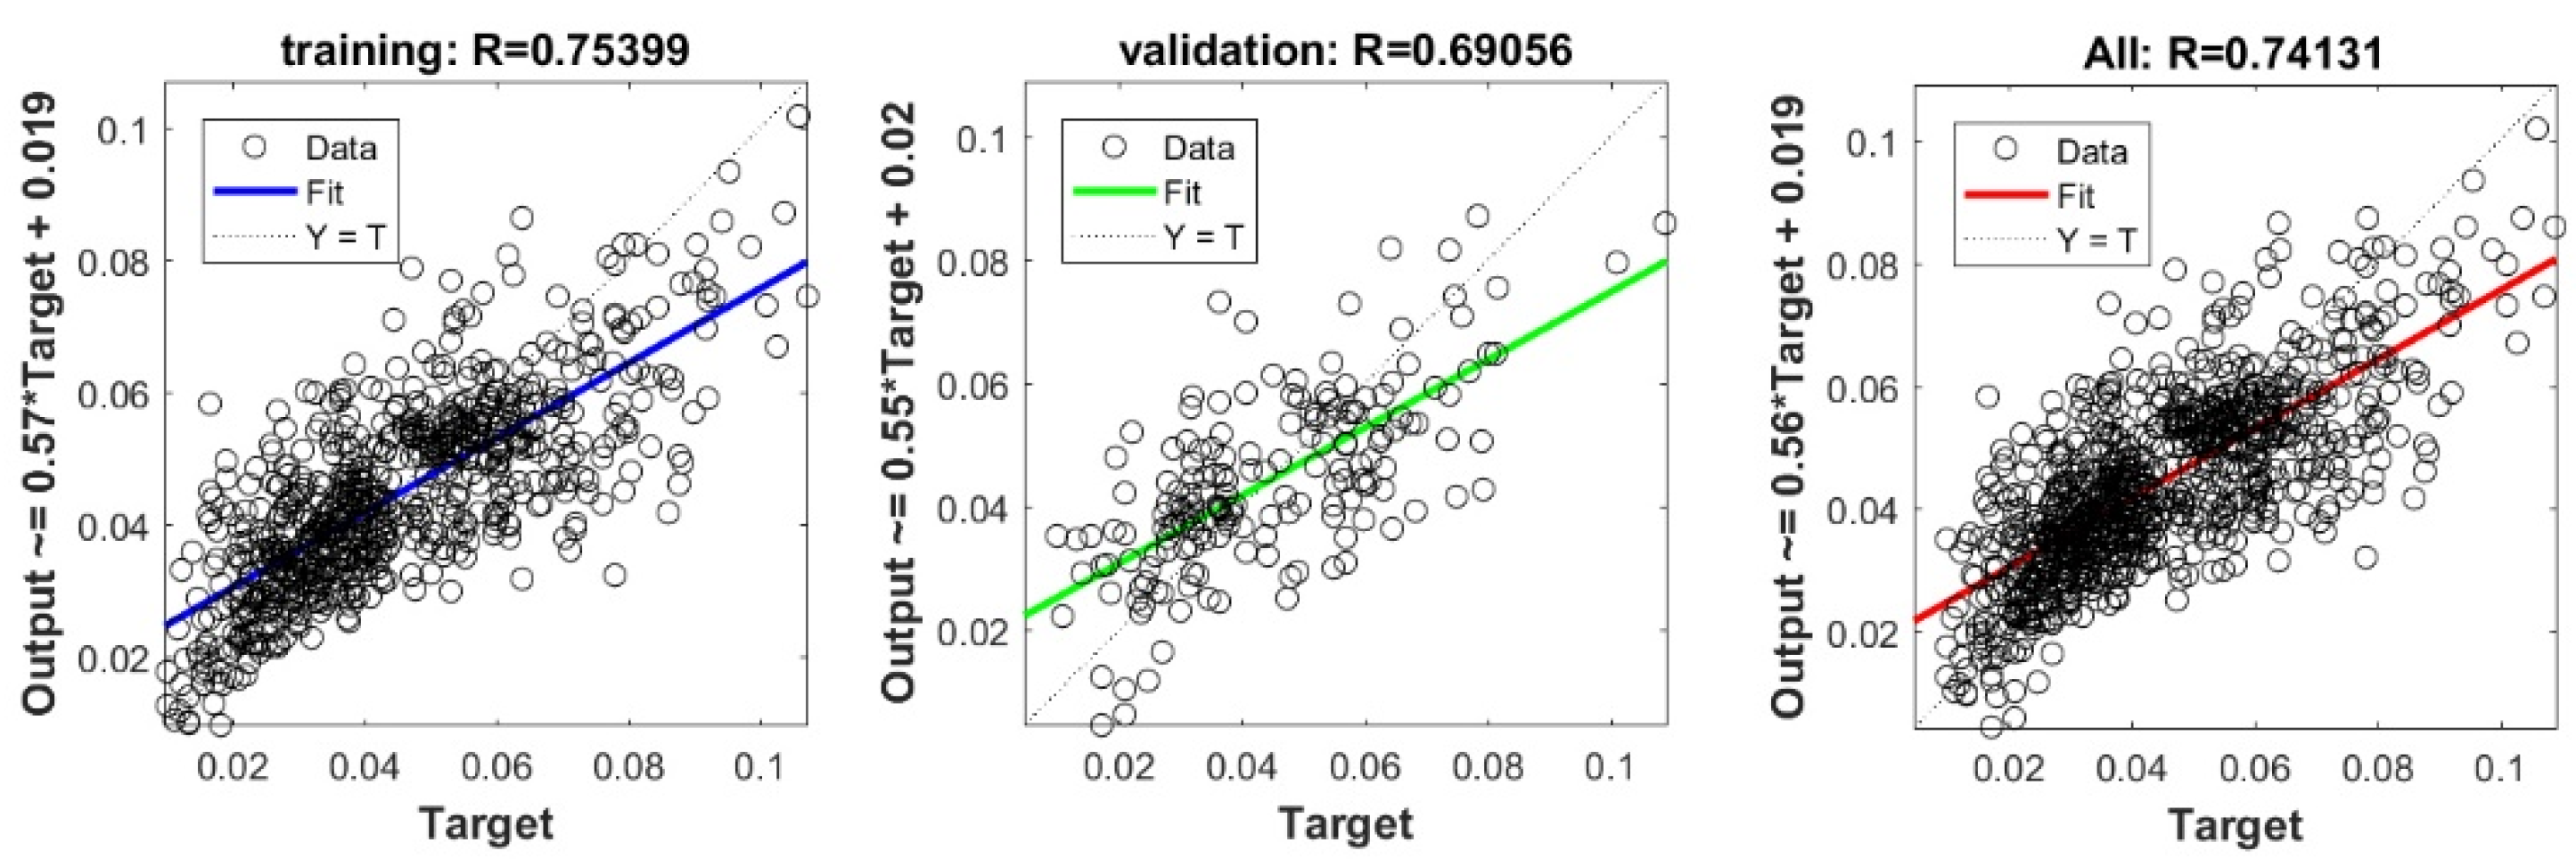

Figure A22.
Scatter plots between target and output value by the PSO-ELM model.
Figure A22.
Scatter plots between target and output value by the PSO-ELM model.


Figure A23.
Scatter plots between target and output value by the PSO-GP model.
Figure A23.
Scatter plots between target and output value by the PSO-GP model.
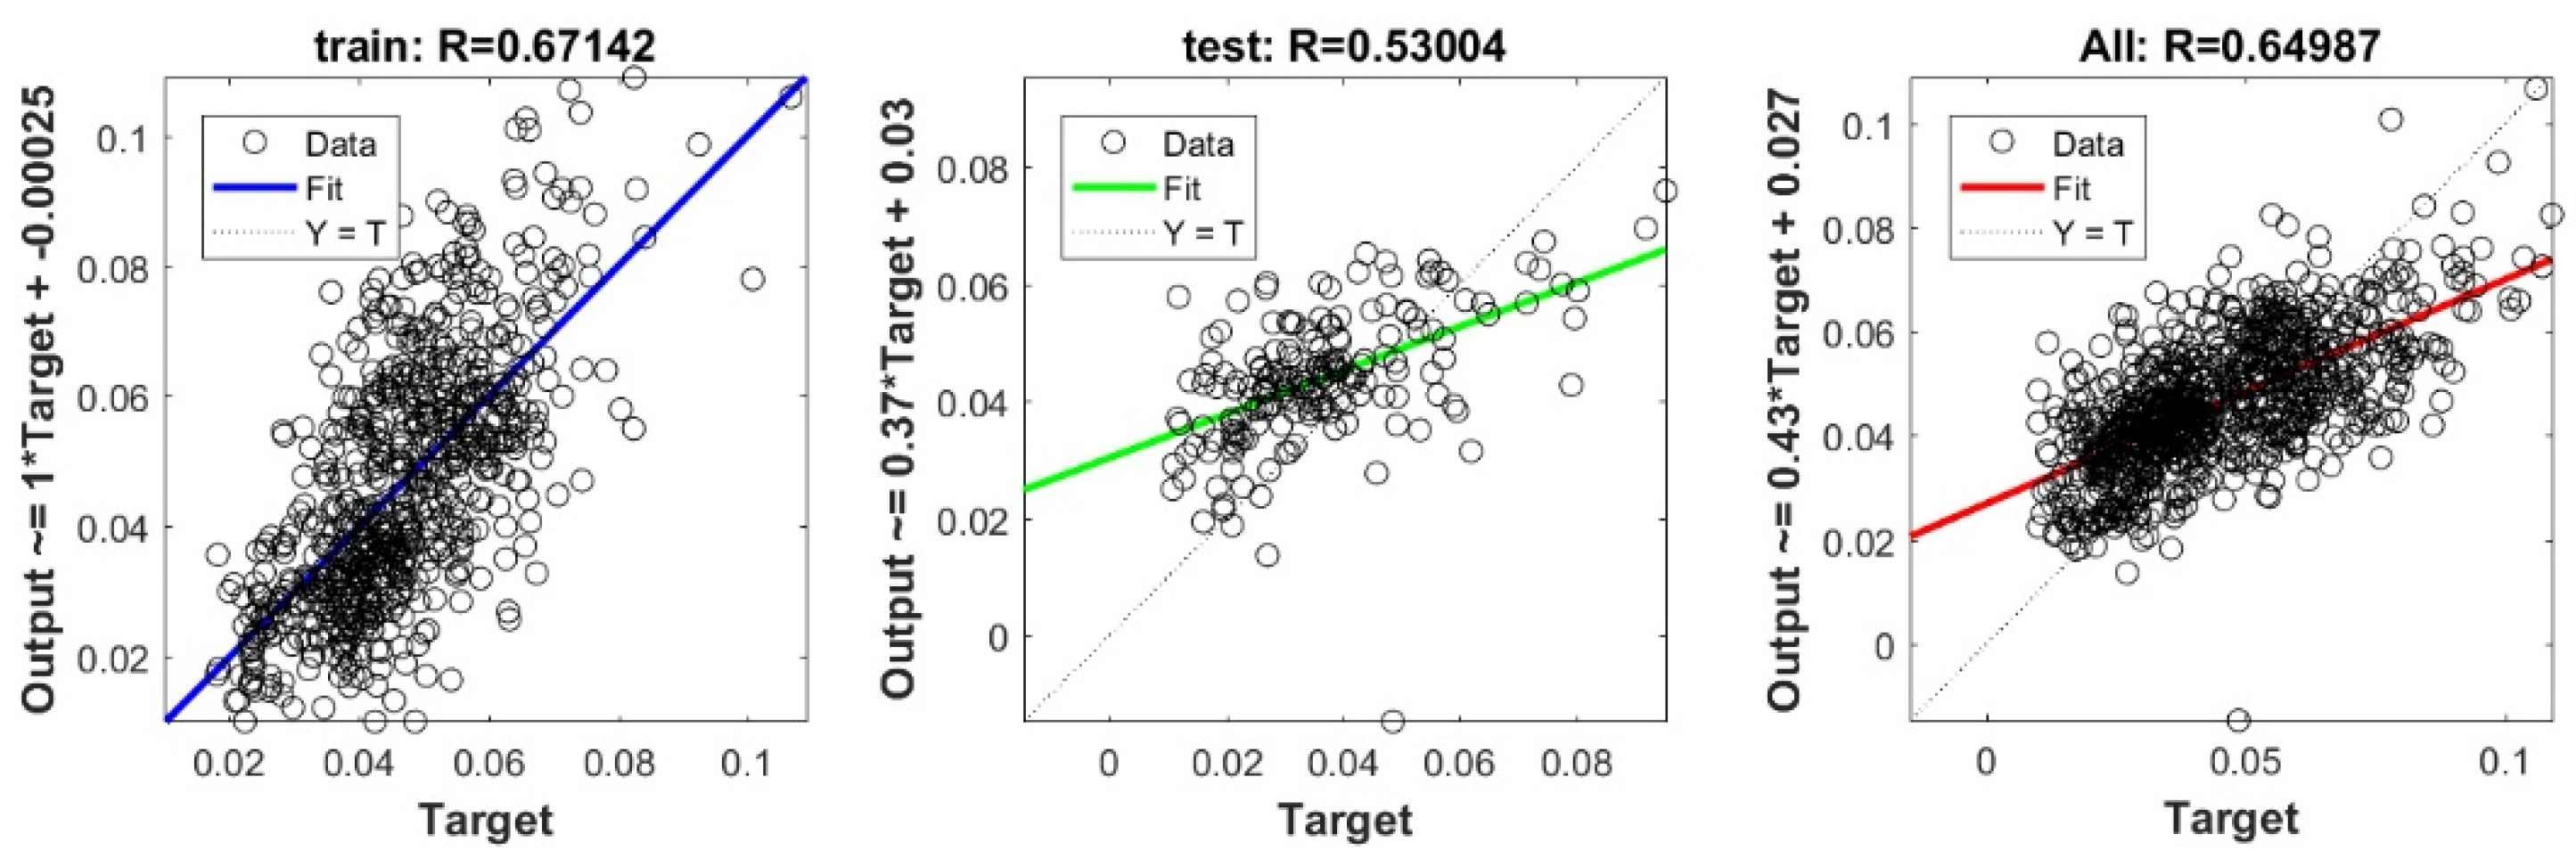

Figure A24.
Scatter plots between target and output value by the PSO-KRidge model.
Figure A24.
Scatter plots between target and output value by the PSO-KRidge model.


Figure A25.
Scatter plots between target and output value by the PSO-Lasso model.
Figure A25.
Scatter plots between target and output value by the PSO-Lasso model.


Figure A26.
Scatter plots between target and output value by the PSO-PLS model.
Figure A26.
Scatter plots between target and output value by the PSO-PLS model.


Figure A27.
Scatter plots between target and output value by the PSO-RF model.
Figure A27.
Scatter plots between target and output value by the PSO-RF model.

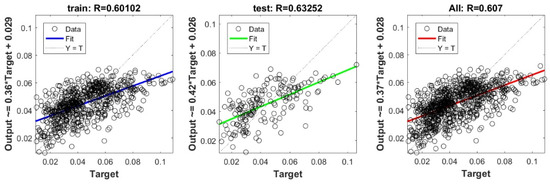
Figure A28.
Scatter plots between target and output value by the PSO-Ridge model.
Figure A28.
Scatter plots between target and output value by the PSO-Ridge model.
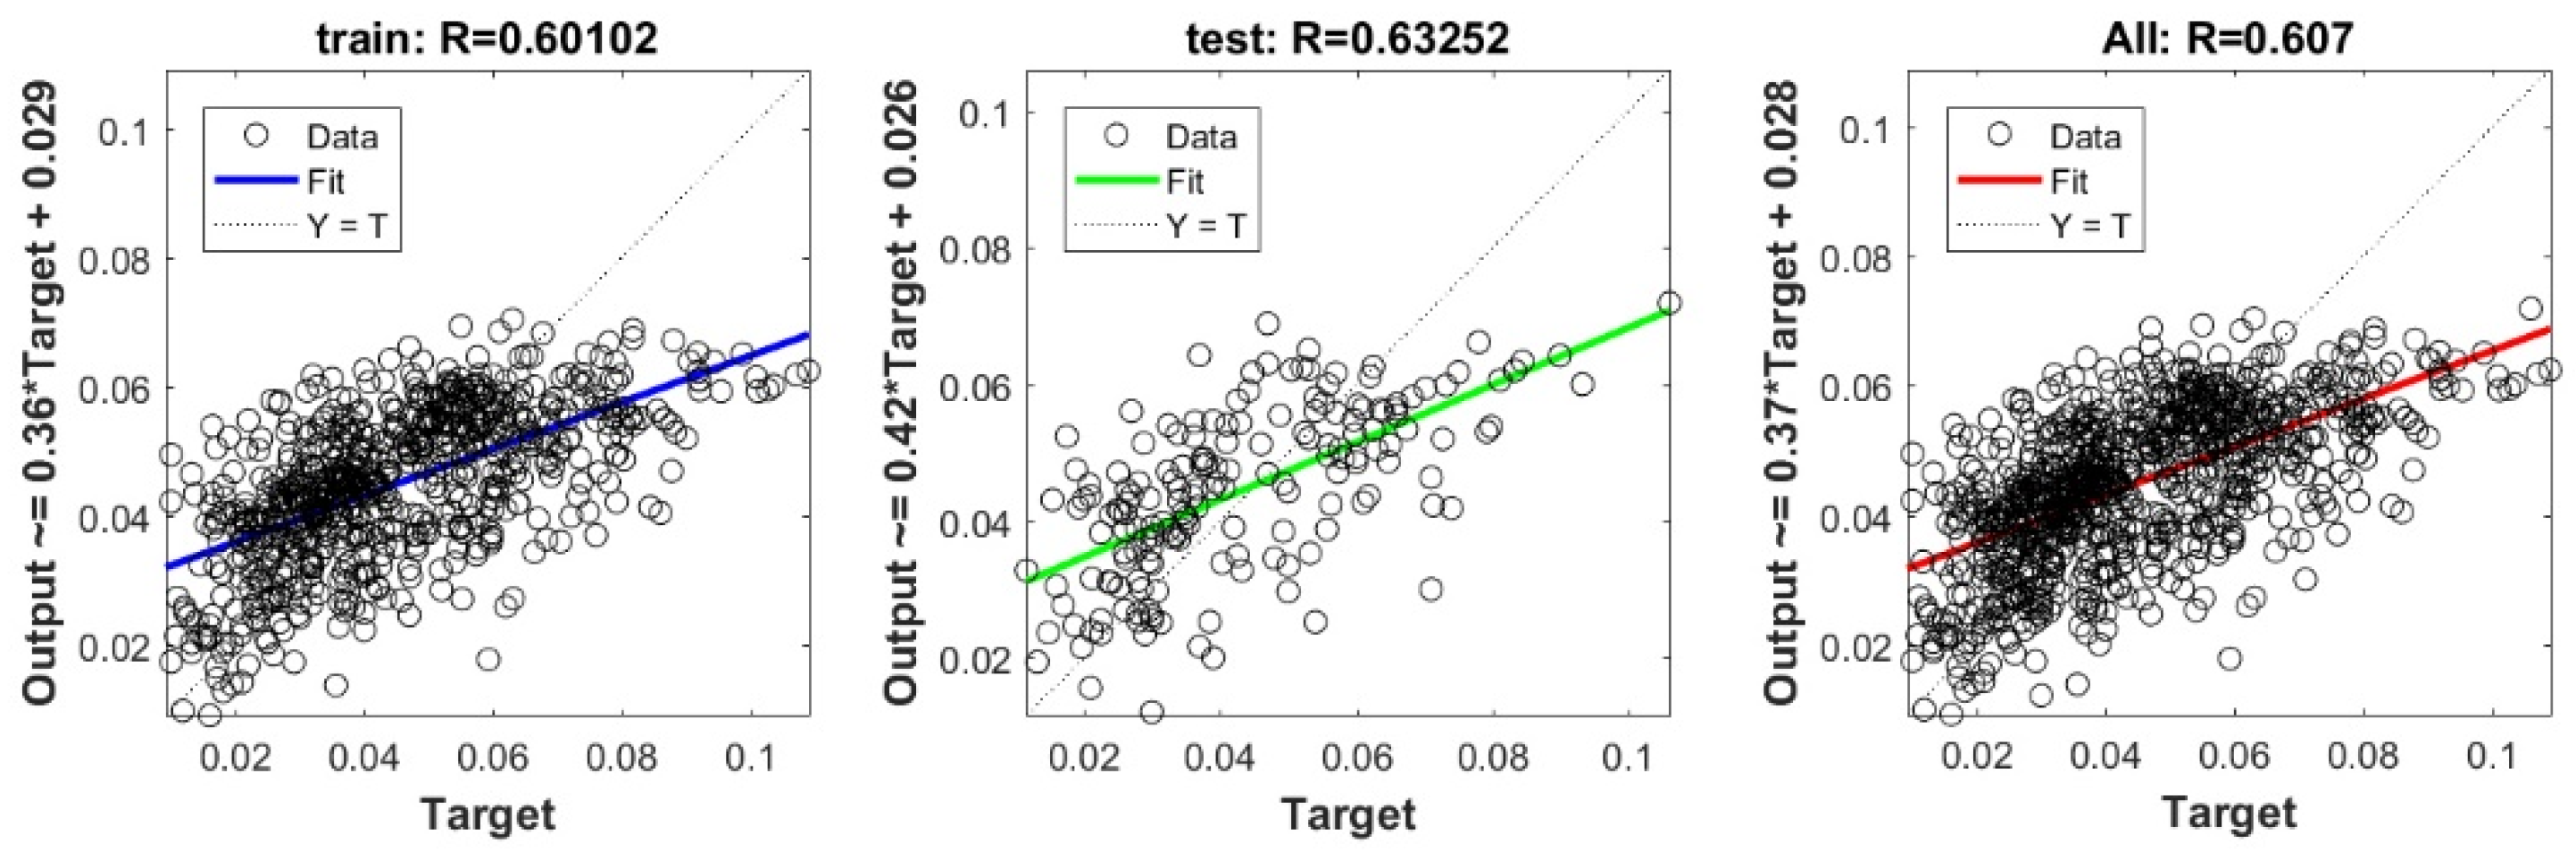

Figure A29.
Scatter plots between target and output value by the PSO-Step model.
Figure A29.
Scatter plots between target and output value by the PSO-Step model.
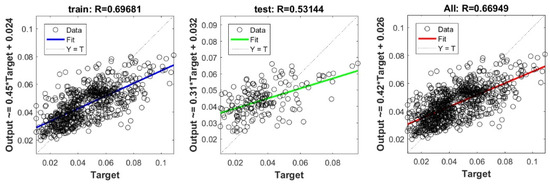
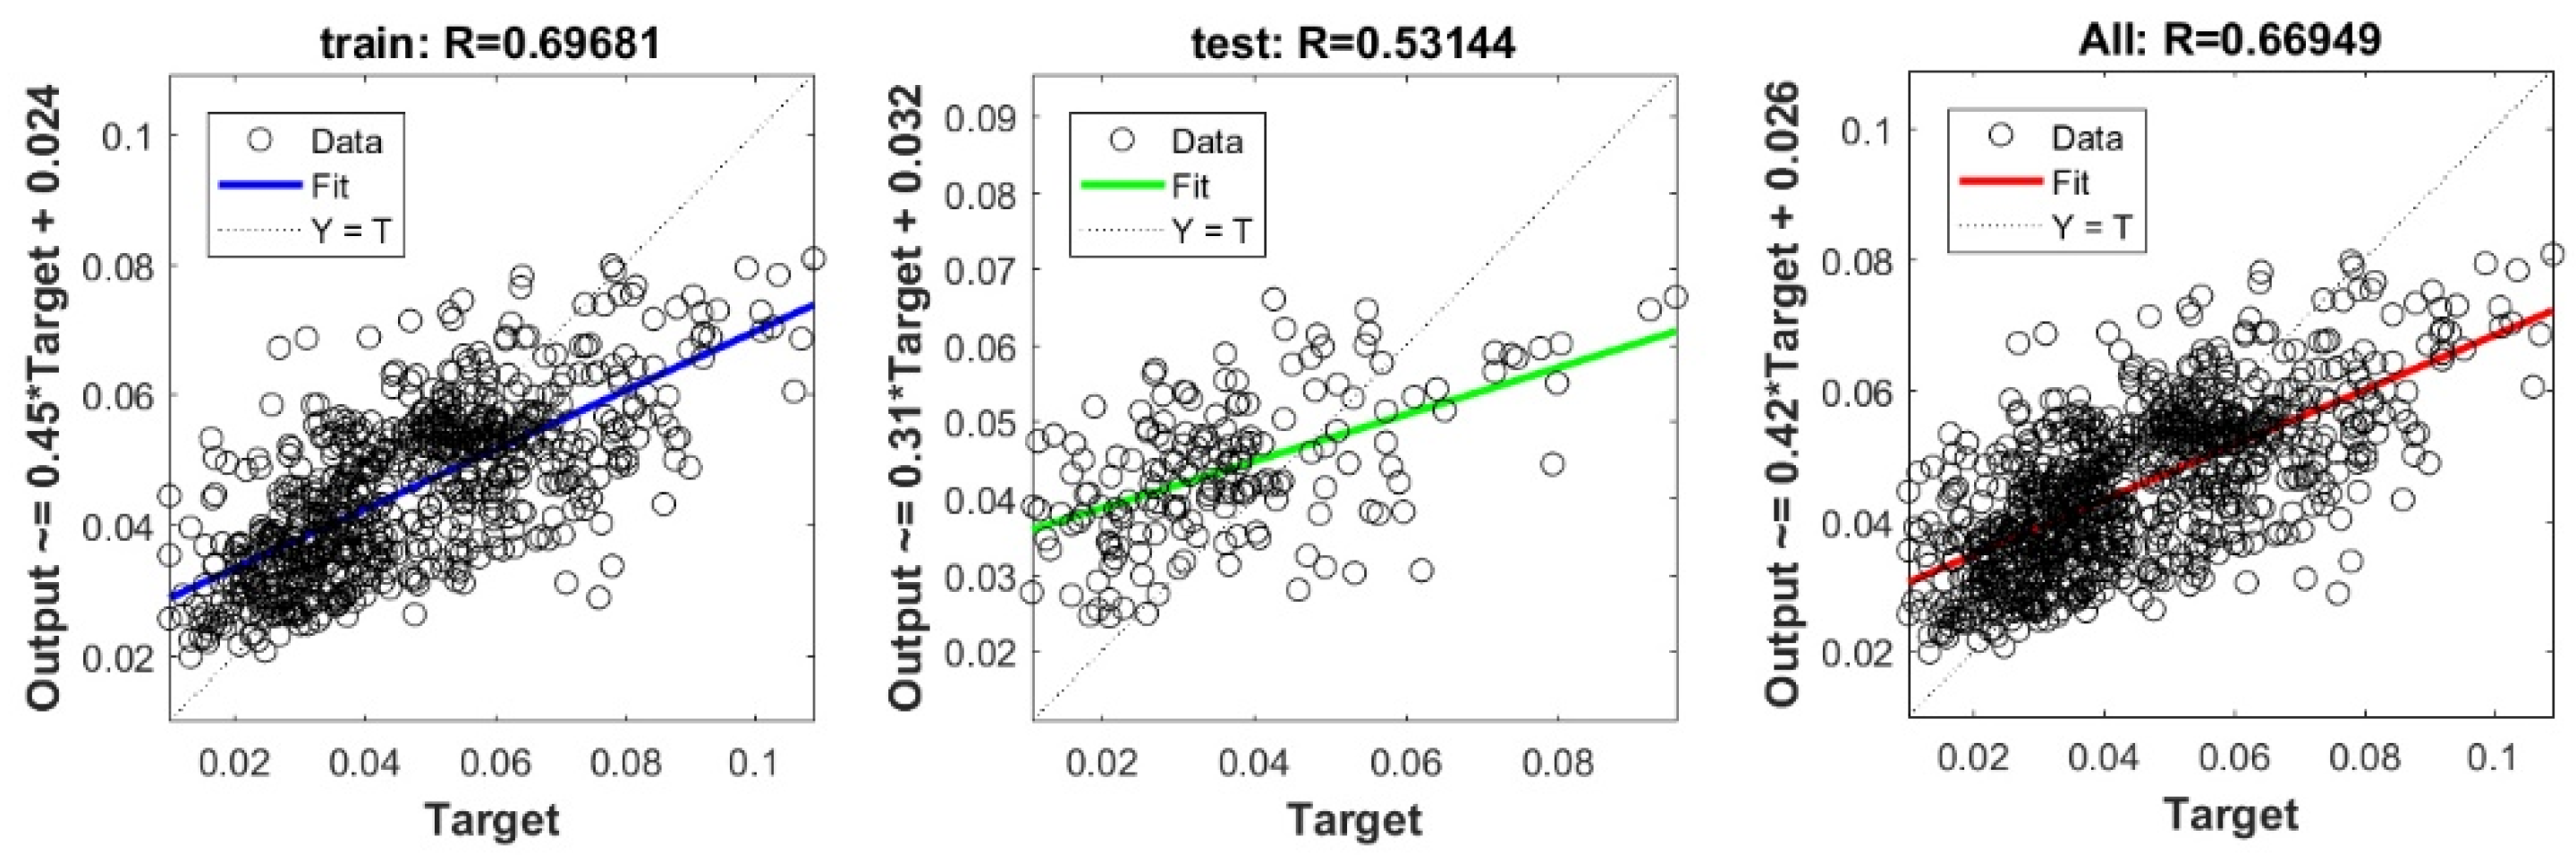
Figure A30.
Scatter plots between target and output value the by PSO-SVR model.
Figure A30.
Scatter plots between target and output value the by PSO-SVR model.
References
- Hunt, R. Geotechnical Investigation Methods: A Field Guide for Geotechnical Engineers; CRC Press: Boca Raton, FL, USA, 2006; ISBN 978-1-4200-4274-0. [Google Scholar]
- Benbouras, M.A.; Kettab, R.M.; Debiche, F.; Lagaguine, M.; Mechaala, A.; Bourezak, C.; Petrişor, A.-I. Use of Geotechnical and Geographical Information Systems to Analyze Seismic Risk in Algiers Area. Rev. Şcolii Dr. de Urban 2018, 3, 11. [Google Scholar]
- Yuan, S.; Liu, X.; Sloan, S.W.; Buzzi, O.P. Multi-Scale Characterization of Swelling Behaviour of Compacted Maryland Clay. Acta Geotech. 2016, 11, 789–804. [Google Scholar] [CrossRef]
- Zhang, X.; Lu, H.; Li, L. Use of Oedometer Equipped with High-Suction Tensiometer to Characterize Unsaturated Soils. Transp. Res. Rec. 2016, 2578, 58–71. [Google Scholar] [CrossRef]
- Teerachaikulpanich, N.; Okumura, S.; Matsunaga, K.; Ohta, H. Estimation of Coefficient of Earth Pressure at Rest Using Modified Oedometer Test. Soils Found. 2007, 47, 349–360. [Google Scholar] [CrossRef]
- Benbouras, M.A.; Kettab, R.; Zedira, H.; Petrisor, A.; Mezouer, N.; Debiche, F. A new approach to predict the Compression Index using Artificial Intelligence Methods. Mar. Georesour. Geotechnol. 2018, 6, 704–720. [Google Scholar] [CrossRef]
- Shahin, M.A. Artificial intelligence in geotechnical engineering: Applications, modeling aspects, and future directions. In Metaheuristics in Water, Geotechnical and Transport Engineering; Elsevier: Amsterdam, The Netherlands, 2013; pp. 169–204. [Google Scholar]
- Nagaraj, H.; Munnas, M.; Sridharan, A. Swelling Behavior of Expansive Soils. Int. J. Geotech. Eng. 2010, 4, 99–110. [Google Scholar] [CrossRef]
- Ameratunga, J.; Sivakugan, N.; Das, B.M. Correlations of Soil and Rock Properties in Geotechnical Engineering; Developments in Geotechnical Engineering; Springer India: New Delhi, India, 2016; ISBN 978-81-322-2627-7. [Google Scholar]
- Samui, P.; Hoang, N.-D.; Nhu, V.-H.; Nguyen, M.-L.; Ngo, P.T.T.; Bui, D.T. A New Approach of Hybrid Bee Colony Optimized Neural Computing to Estimate the Soil Compression Coefficient for a Housing Construction Project. Appl. Sci. 2019, 9, 4912. [Google Scholar] [CrossRef]
- Moayedi, H.; Tien Bui, D.; Dounis, A.; Ngo, P.T.T. A Novel Application of League Championship Optimization (LCA): Hybridizing Fuzzy Logic for Soil Compression Coefficient Analysis. Appl. Sci. 2020, 10, 67. [Google Scholar] [CrossRef]
- Onyejekwe, S.; Kang, X.; Ge, L. Assessment of Empirical Equations for the Compression Index of Fine-Grained Soils in Missouri. Bull. Eng. Geol. Environ. 2015, 74, 705–716. [Google Scholar] [CrossRef]
- Onyejekwe, S.; Kang, X.; Ge, L. Evaluation of the Scale of Fluctuation of Geotechnical Parameters by Autocorrelation Function and Semivariogram Function. Eng. Geol. 2016, 214, 43–49. [Google Scholar] [CrossRef]
- Shahin, M.A.; Jaksa, M.B.; Maier, H.R. Recent Advances and Future Challenges for Artificial Neural Systems in Geotechnical Engineering Applications. Adv. Artif. Neural Syst. 2009, 2009, 1–9. [Google Scholar] [CrossRef]
- Hossein Alavi, A.; Hossein Gandomi, A. A Robust Data Mining Approach for Formulation of Geotechnical Engineering Systems. Eng. Comput. 2011, 28, 242–274. [Google Scholar] [CrossRef]
- Park, H.I.; Lee, S.R. Evaluation of the Compression Index of Soils Using an Artificial Neural Network. Comput. Geotech. 2011, 38, 472–481. [Google Scholar] [CrossRef]
- Cai, G.; Liu, S.; Puppala, A.J.; Tong, L. Identification of Soil Strata Based on General Regression Neural Network Model from CPTU Data. Mar. Georesour. Geotechnol. 2015, 33, 229–238. [Google Scholar] [CrossRef]
- Nagaraj, T.S.; Srinivasa Murthy, B.R. A Critical Reappraisal of Compression Index Equations. Geotechnique 1986, 36, 27–32. [Google Scholar] [CrossRef]
- Cozzolino, V.M. Statistical Forecasting of Compression Index. In Proceedings of the Proceedings of the fifth international conference on soil mechanics and foundation engineering, Paris, France, 17–22 July 1961; Volume 1, pp. 51–53. [Google Scholar]
- Işık, N.S. Estimation of Swell Index of Fine Grained Soils Using Regression Equations and Artificial Neural Networks. Sci. Res. Essays 2009, 4, 1047–1056. [Google Scholar]
- Shahin, M.A.; Jaksa, M.B.; Maier, H.R. State of the Art of Artificial Neural Networks in Geotechnical Engineering. Electron. J. Geotech. Eng. 2008, 8, 1–26. [Google Scholar]
- Das, S.K.; Samui, P.; Sabat, A.K.; Sitharam, T.G. Prediction of Swelling Pressure of Soil Using Artificial Intelligence Techniques. Environ. Earth Sci. 2010, 61, 393–403. [Google Scholar] [CrossRef]
- Kumar, V.P.; Rani, C.S. Prediction of Compression Index of Soils Using Artificial Neural Networks (ANNs). Int. J. Eng. Res. Appl. 2011, 1, 1554–1558. [Google Scholar]
- Kurnaz, T.F.; Dagdeviren, U.; Yildiz, M.; Ozkan, O. Prediction of Compressibility Parameters of the Soils Using Artificial Neural Network. SpringerPlus 2016, 5, 1801. [Google Scholar] [CrossRef]
- Alavi, A.H.; Gandomi, A.H.; Mollahasani, A.; Bazaz, J.B. Linear and Tree-Based Genetic Programming for Solving Geotechnical Engineering Problems. In Metaheuristics in Water, Geotechnical and Transport Engineering; Elsevier: Amsterdam, The Netherlands, 2013; pp. 289–310. ISBN 978-0-12-398296-4. [Google Scholar]
- Narendra, B.S.; Sivapullaiah, P.V.; Suresh, S.; Omkar, S.N. Prediction of Unconfined Compressive Strength of Soft Grounds Using Computational Intelligence Techniques: A Comparative Study. Comput. Geotech. 2006, 33, 196–208. [Google Scholar] [CrossRef]
- Rezania, M.; Javadi, A.A. A New Genetic Programming Model for Predicting Settlement of Shallow Foundations. Can. Geotech. J. 2007, 44, 1462–1473. [Google Scholar] [CrossRef]
- Yin, Z.-Y.; Zhu, Q.-Y.; Zhang, D.-M. Comparison of Two Creep Degradation Modeling Approaches for Soft Structured Soils. Acta Geotech. 2017, 12, 1395–1413. [Google Scholar] [CrossRef]
- Stoica, I.-V.; Tulla, A.F.; Zamfir, D.; Petrișor, A.-I. Exploring the Urban Strength of Small Towns in Romania. Soc. Indic. Res. 2020, 152, 843–875. [Google Scholar] [CrossRef]
- Petrişor, A.-I.; Ianoş, I.; Iurea, D.; Văidianu, M.-N. Applications of Principal Component Analysis Integrated with GIS. Procedia Environ. Sci. 2012, 14, 247–256. [Google Scholar] [CrossRef]
- Lu, W.Z.; Wang, W.J.; Wang, X.K.; Xu, Z.B.; Leung, A.Y.T. Using Improved Neural Network Model to Analyze RSP, NO x and NO 2 Levels in Urban Air in Mong Kok, Hong Kong. Environ. Monit. Assess. 2003, 87, 235–254. [Google Scholar] [CrossRef]
- Çamdevýren, H.; Demýr, N.; Kanik, A.; Keskýn, S. Use of Principal Component Scores in Multiple Linear Regression Models for Prediction of Chlorophyll-a in Reservoirs. Ecol. Model. 2005, 181, 581–589. [Google Scholar] [CrossRef]
- Wackernagel, H. Multivariate Geostatistics: An Introduction with Applications; Springer Science & Business Media: Berlin/Heidelberg, Germany, 2013; ISBN 978-3-662-05294-5. [Google Scholar]
- Tabachnick, B.G.; Fidell, L.S.; Ullman, J.B. Using Multivariate Statistics, 7th ed.; Pearson: New York, NY, USA, 2019; ISBN 978-0-13-479054-1. [Google Scholar]
- Noori, R.; Karbassi, A.; Salman Sabahi, M. Evaluation of PCA and Gamma Test Techniques on ANN Operation for Weekly Solid Waste Prediction. J. Environ. Manag. 2010, 91, 767–771. [Google Scholar] [CrossRef]
- Noori, R.; Karbassi, A.R.; Moghaddamnia, A.; Han, D.; Zokaei-Ashtiani, M.H.; Farokhnia, A.; Gousheh, M.G. Assessment of Input Variables Determination on the SVM Model Performance Using PCA, Gamma Test, and Forward Selection Techniques for Monthly Stream Flow Prediction. J. Hydrol. 2011, 401, 177–189. [Google Scholar] [CrossRef]
- Koncar, N. Optimisation Methodologies for Direct Inverse Neurocontrol. Ph.D. Thesis, University of London, London, UK, 1997. [Google Scholar]
- Stefánsson, A.; Končar, N.; Jones, A.J. A Note on the Gamma Test. Neural Comput. Appl. 1997, 5, 131–133. [Google Scholar] [CrossRef]
- Kemp, S.; Wilson, I.; Ware, J. A Tutorial on the Gamma Test. Int. J. Simul. Syst. Sci. Technol. 2004, 6, 67–75. [Google Scholar]
- Huang, G.-B.; Zhu, Q.-Y.; Siew, C.-K. Extreme Learning Machine: Theory and Applications. Neurocomputing 2006, 70, 489–501. [Google Scholar] [CrossRef]
- Benbouras, M.A.; Kettab, R.M.; Zedira, H.; Debiche, F.; Zaidi, N. Comparing nonlinear regression analysis and artificial neural networks to predict geotechnical parameters from standard penetration test. Urban. Archit. Constr. 2018, 1, 275–288. [Google Scholar]
- Awad, M.; Khanna, R. Support Vector Regression. In Efficient Learning Machines: Theories, Concepts, and Applications for Engineers and System Designers; Awad, M., Khanna, R., Eds.; Apress: Berkeley, CA, USA, 2015; pp. 67–80. ISBN 978-1-4302-5990-9. [Google Scholar]
- Biau, G.; Scornet, E. A Random Forest Guided Tour. TEST 2016, 25, 197–227. [Google Scholar] [CrossRef]
- Hebiri, M.; Lederer, J. How Correlations Influence Lasso Prediction. IEEE Trans. Inf. Theory 2013, 59, 1846–1854. [Google Scholar] [CrossRef]
- Vinzi, V.E.; Chin, W.W.; Henseler, J.; Wang, H. Editorial: Perspectives on Partial Least Squares. In Handbook of Partial Least Squares: Concepts, Methods and Applications; Esposito Vinzi, V., Chin, W.W., Henseler, J., Wang, H., Eds.; Springer Handbooks of Computational Statistics; Springer: Berlin/Heidelberg, Germany, 2010; pp. 1–20. ISBN 978-3-540-32827-8. [Google Scholar]
- Hoerl, A.E.; Kennard, R.W. Ridge Regression—1980: Advances, Algorithms, and Applications. Am. J. Math. Manag. Sci. 1981, 1, 5–83. [Google Scholar] [CrossRef]
- Douak, F.; Melgani, F.; Benoudjit, N. Kernel Ridge Regression with Active Learning for Wind Speed Prediction. Appl. Energy 2013, 103, 328–340. [Google Scholar] [CrossRef]
- Jennrich, R.I.; Sampson, P.F. Application of Stepwise Regression to Non-Linear Estimation. Technometrics 1968, 10, 63–72. [Google Scholar] [CrossRef]
- Wagner, S.; Kronberger, G.; Beham, A.; Kommenda, M.; Scheibenpflug, A.; Pitzer, E.; Vonolfen, S.; Kofler, M.; Winkler, S.; Dorfer, V.; et al. Architecture and Design of the HeuristicLab Optimization Environment. In Advanced Methods and Applications in Computational Intelligence; Klempous, R., Nikodem, J., Jacak, W., Chaczko, Z., Eds.; Topics in Intelligent Engineering and Informatics; Springer International Publishing: Heidelberg, Germany, 2014; pp. 197–261. ISBN 978-3-319-01436-4. [Google Scholar]
- Tikhamarine, Y.; Malik, A.; Pandey, K.; Sammen, S.S.; Souag-Gamane, D.; Heddam, S.; Kisi, O. Monthly Evapotranspiration Estimation Using Optimal Climatic Parameters: Efficacy of Hybrid Support Vector Regression Integrated with Whale Optimization Algorithm. Environ. Monit. Assess. 2020, 192, 696. [Google Scholar] [CrossRef]
- Breiman, L.; Spector, P. Submodel Selection and Evaluation in Regression. The X-Random Case. Int. Stat. Rev. 1992, 60, 291–319. [Google Scholar] [CrossRef]
- Oommen, T.; Baise, L.G. Model Development and Validation for Intelligent Data Collection for Lateral Spread Displacements. J. Comput. Civ. Eng. 2010, 24, 467–477. [Google Scholar] [CrossRef]
- Goetz, J.N.; Brenning, A.; Petschko, H.; Leopold, P. Evaluating Machine Learning and Statistical Prediction Techniques for Landslide Susceptibility Modeling. Comput. Geosci. 2015, 81, 1–11. [Google Scholar] [CrossRef]
- Benbouras, M.A.; Kettab, R.M.; Zedira, H.; Petrisor, A.-I.; Debiche, F. Dry Density in Relation to Other Geotechnical Proprieties of Algiers Clay. Rev. Şcolii Dr. Urban 2017, 2, 5–14. [Google Scholar]
- Debiche, F.; Kettab, R.M.; Benbouras, M.A.; Benbellil, B.; Djerbal, L.; Petrisor, A.-I. Use of GIS systems to analyze soil compressibility, swelling and bearing capacity under superficial foundations in Algiers region, Algeria. Urban. Arhit. Constr. 2018, 9, 357–370. [Google Scholar]
- Abba, S.I.; Pham, Q.B.; Usman, A.G.; Linh, N.T.T.; Aliyu, D.S.; Nguyen, Q.; Bach, Q.-V. Emerging Evolutionary Algorithm Integrated with Kernel Principal Component Analysis for Modeling the Performance of a Water Treatment Plant. J. Water Process. Eng. 2020, 33, 101081. [Google Scholar] [CrossRef]
- Kanellopoulos, I.; Wilkinson, G.G. Strategies and Best Practice for Neural Network Image Classification. Int. J. Remote Sens. 1997, 18, 711–725. [Google Scholar] [CrossRef]
- Liong, S.-Y.; Lim, W.-H.; Paudyal, G.N. River Stage Forecasting in Bangladesh: Neural Network Approach. J. Comput. Civ. Eng. 2000, 14, 1–8. [Google Scholar] [CrossRef]
- Mawlood, Y.I.; Hummadi, R.A. Large-Scale Model Swelling Potential of Expansive Soils in Comparison with Oedometer Swelling Methods. Iran. J. Sci. Technol. Trans. Civ. Eng. 2020, 44, 1283–1293. [Google Scholar] [CrossRef]
- Ly, H.-B.; Le, T.-T.; Le, L.M.; Tran, V.Q.; Le, V.M.; Vu, H.-L.T.; Nguyen, Q.H.; Pham, B.T. Development of Hybrid Machine Learning Models for Predicting the Critical Buckling Load of I-Shaped Cellular Beams. Appl. Sci. 2019, 9, 5458. [Google Scholar] [CrossRef]
- Asteris, P.G.; Nikoo, M. Artificial Bee Colony-Based Neural Network for the Prediction of the Fundamental Period of Infilled Frame Structures. Neural Comput. Appl. 2019, 31, 4837–4847. [Google Scholar] [CrossRef]
- Sarir, P.; Chen, J.; Asteris, P.G.; Armaghani, D.J.; Tahir, M.M. Developing GEP Tree-Based, Neuro-Swarm, and Whale Optimization Models for Evaluation of Bearing Capacity of Concrete-Filled Steel Tube Columns. Eng. Comput. 2019. [Google Scholar] [CrossRef]
Publisher’s Note: MDPI stays neutral with regard to jurisdictional claims in published maps and institutional affiliations. |
© 2021 by the authors. Licensee MDPI, Basel, Switzerland. This article is an open access article distributed under the terms and conditions of the Creative Commons Attribution (CC BY) license (http://creativecommons.org/licenses/by/4.0/).

