Article

Size Effect of Mesoporous Silica Nanoparticles on Pesticide Loading, Release, and Delivery in Cucumber Plants

1
College of Food Science and Engineering, Beijing University of Agriculture, Beijing 102206, China
2
Key Laboratory of Integrated Pest Management in Crops, Ministry of Agriculture, Institute of Plant Protection, Chinese Academy of Agricultural Sciences, Beijing 100193, China
3
Henan HOPE Analytech Co., Ltd., Zhengzhou 451162, China
4
College of Biological and Resources Environment, Beijing University of Agriculture, Beijing 102206, China
*
Authors to whom correspondence should be addressed.
Appl. Sci. 2021, 11(2), 575; https://doi.org/10.3390/app11020575
Submission received: 2 December 2020 / Revised: 23 December 2020 / Accepted: 4 January 2021 / Published: 8 January 2021

Abstract

:
Mesoporous silica nanoparticles (MSN) are widely used as pesticide carriers to enhance their effective utilization, since it can promote the solubility and absorption of pesticides by plants. For plants, the particle size of pesticides influences their absorption and efficacy. Herein, is our research work of the size effect of MSN on the loading, release, and delivery behavior of pyraoxystrobin (Pyr) in cucumber plants. The well-ordered Pyr-loaded carbon quantum dots-MSN (Pyr@M) with sizes of 15, 100, and 200 nm were prepared. A comparative study among different particle sizes of Pyr@M was carried out on the aspects of control release performance, loading content, uptake, and transportation performance in cucumber plants. It was found that the loading content increased as the particle size increased. The nanoparticles as carriers increased the solubility of insoluble Pyr, but the nanoparticle size had no clear difference impact on the release rate. The efficiency of the cellular uptake strongly depended on the particle size. The smaller the MSN size, the easier it was to be absorbed and transmitted by cucumber plants. Compared to the free Pyr, the upward transportation rate of Pyr from Pyr@M in plant increased by 3.5 times. These findings provide new theoretical basis to design the MSN pesticide delivery system.

1. Introduction

Due to the serious ecological and environmental problems caused by the extensive use of pesticides, the world faces a serious pressure and challenge of reducing application and increasing effective utilization of pesticide. Improving the transport performance of pesticides in target crops is one of the important methods to improve pesticide utilization. Recently, the use of nanotechnology in crops is increasing, one of the applications is the study of controlled release of pesticides and another important is to promote uptake and transport [1,2]. Particle size is one of the most important factors that endow nanomaterials with special physical, chemical, as well as biological properties, bringing a wide range of promising applications [3].
In most cases, pesticides can be transported across biological membranes through passive diffusion or ion-trapping mechanisms, therefore, the primary way to improve the transmission performance is to increase membrane permeability by optimizing the physical and chemical properties of the active ingredients. The permeability can be changed by changing the lipophilic property, and particle size of the pesticide by loading on the carriers [4,5,6]. To take advantage of unique properties of nanoscale materials and structures, the size of nanoparticles need to be optimized, achieving their best control effect. Nanoparticles of extraordinarily small sizes are able to penetrate through tissues and be translocated from one pot to other organs in plant. In biological system, the penetration and translocation of foreign substances in vivo is highly dependent on the particle size [7,8]. Many studies focus on the size effect of nanoparticles on medicine translocation and distribution in marine mammals [9] or on cancer cells [10,11]. However, there are limited studies on the size effect of nanoparticles on pesticide loading, release, and delivery in plant.
Various nanomaterials are employed for pesticide delivery, including inorganic nano-porous materials [12], such as calcium carbonate [13], TiO2 [14], silica [15,16], metal oxide [17], and biodegradable polymer nano-materials such as chitosan [18] and nano-hydroxyapatite [19]. Among them, mesoporous silica nanoparticles (MSN) appears to be the most attractive [20,21,22,23]. Due to the large specific surface area and high loading rate, little toxicity to plants and the characteristics of promoting plant absorption and transmission, MSN is increasingly used as pesticide carriers [24,25]. Some studies indicated that only particles with a diameter less than or equal to 50 nm can pass through the cells walls in the root systems of most plants [26,27]. Sun et al. found that MSN with a diameter of 20 nm can penetrate the cells walls, enter the endodermis, the intercellular spaces, and reach the vascular tissue, to be transported to the aerial parts of the plants [28]. In our previous study, it was indicated that MSN with particle sizes between 200–300 nm could also be absorbed by cucumber leaves [29]. Herth et al. suggested that plant cells under the influence of calcium, silicon, proteins, viruses, and environmental stresses might appropriately change the size limits of the absorbed substances [30]. To date, the size effect of MSN on pesticide delivery in plant was not studied in detail. Therefore, it is important to understand the nanoparticle size effects on pesticide uptake and translocation in plants, when the pesticide delivery system is designed.
Pesticides in traditional formulations have some disadvantages such as coarse particles, poor water-solubility, and dispersibility, which make it difficult to give full play to their efficacy [31]. For example, Pyr, a novel strobilurins fungicide, was independently developed by the Shenyang Research Institute of Chemical Industry in China [32]. The compound exhibits fungicidal activities by binding at the coenzyme Qo site of cytochrome b, which blocks the electron transfer between cytochrome b and cytochrome c1. It has the characteristics of high efficiency, wide spectrum and low toxicity, and effective control of Pseu-doperonospora cubensis, Blumeria graminis, Erysiphe cichoracearum, Plasmopara viticola, and Magnaporthe grisea etc., and is suitable for cucumber, rice, tomato, rape, and other crops and fruits and vegetables [33,34,35,36]. However, Pyr has a low solubility in water and is hardly translocated in plants [37], which inhibits its application. The chemical structure of Pyr is shown in Figure 1. In this work, Pyr is selected as the model pesticide in the MSN delivery system.
A comparative study among different particle sizes of Pyr-loaded carbon quantum dots-MSN was conducted to figure out the size effect of MSN on Pyr loading, release, and delivery in cucumber plants. To improve the transportation performance of pesticide in plants, carbon quantum dots-MSN within 15, 100, and 200 nm were synthesized to load Pyr, respectively. The physical properties of the three kinds of Pyr@M were characterized, including their composition, structure, control release performance, and loading content. After root treatment, the uptake and transportation behaviors of Pyr@M in cucumber plants were studied. This research showed that the particle size of the nano-carriers has a great effect on pesticide loading, release, and delivery in plants.

2. Materials and Methods

2.1. Materials

Pyr (technical material, 95%) was provided by the Hope Analyetch Co., Ltd. (Nanjing, China). Tetraethyl orthosilicate (TEOS) and cetyltrimethylammonium bromide (CTAB) were provided by Aladdin Industrial corporation (Shanghai, China). N-[3-(Trimethoxysilyl)propyl]ethylenediamine (TSD) was purchased from Balinway Technolygy Co., Ltd. (Beijing, China). Acetonitrile of HPLC grade was purchased from Merck KGaA (Darmstadt, Germmany). A Milli-Q water purification system (Millipore Corporation, Bedford, MA, USA) was employed to obtain deionized water. Multi-walled carbon nanotubes (MWCNTs) was purchased from XFNANO Nanomaterials Technology Co., Ltd. (Nanjng, China). Anhydrous magnesium sulfate (MgSO4) was provided by Shanghai McLean Biochemical Technology Co., Ltd. (Shanghai, China). Sodium chloride (NaCl) was provided by the Sinopharm Group Chemical Reagent Co., Ltd. (Beijing, China).

2.2. Synthesis of Carbon Quantum Dots-MSN with Different Sizes

Carbon quantum dots-MSN were synthesized using CTAB as the template. The reactant dosage and reaction temperature are summarized in Table 1. The carbon quantum dots-MSN with different particle sizes were 15, 100, and 200 nm, referred to as M15, M100, and M200, respectively. In brief, 1.2 g of CTAB was added in deionized water and a magnetic stirrer was used to make it dissolve at room temperature. After this, 2 mol/L sodium hydroxide solution was added drop by drop. The mixture was heated to 80 °C in an oil bath, and 8.4 mL TEOS, 18 mL ethyl acetate, and 0.84 mL TSD were later added dropwise. After a 2 h reaction, the resultant white precipitate was collected by 10,000 rpm high speed centrifugation. The suspension was mixed with 240 µL of saturated hydrochloric acid and kept at 60 °C for 6 h, under stirring and refluxing. The particles were washed thrice with ethanol to remove the surfactant, and then dried at 60 °C. The carbon quantum dots were produced by calcination at high temperature in a muff furnace. First, the powders were treated at low temperatures (<200 °C), then the temperature was raised to 400 °C and kept constant for 3 h, then naturally cooled down to room temperature.

2.3. Construction of Pyr@M15, Pyr@M100, and Pyr@M200

Pyr was loaded into carbon quantum dots-MSN with different sizes through physical adsorption. First, a certain quality of carbon quantum dots-MSN was added into the Pyr-dichloromethane solution. Second, the suspension was continuously magnetically stirred for 6 h and centrifuged at 10,000 rpm for 10 min. Finally, the sediment was collected and dried at 60 °C to obtained the Pyr@M.
The loading content of Pyr@M was measured using the ultrasonic dissolution method. In brief, 25 mL of acetonitrile was used to soak 10 mg of Pyr@M. The suspension was treated by ultrasound for 2 h. After this, the supernatant was filtered with a 0.22 μm organic filter membrane. High performance liquid chromatography (HPLC, 1200-DAD, Agilent, Santa Clara, CA, USA) was used to determine the concentration of Pyr in the supernatant. An Agilent Extend-C18 column (5 μm × 4.6 mm × 250 mm) was employed as the chromatographic column and kept at 30 °C. The mobile phases were acetonitrile and water with 0.1% formic acid (80:20, v/v). The flow rate was 1 mL min−1 and the injection volume was 10 μL. The detection wavelength was set as 254 nm. The loading content (%) of Pyr were obtained as the following formulation—loading content (%) = (weight of Pyr in Pyr@M/weight of Pyr@M) × 100%.

2.4. Sample Characterization

The structure and morphological characteristics of nanoparticles were observed using transmission electron microscopy (TEM, Tecnai G2, F20 S-TWIN, FEI, Hillsboro, OR, USA). The samples were dispersed in water for TEM observations. A drop of the suspension was added onto the carbon-coated copper grids. After air drying, the nanoparticles were observed under TEM.
Fourier transform infrared spectrometer (FT-IR, NICOLET 6700, Thermo Scientific, Waltham, MA, USA) was used to record the FT-IR spectra of MSN, Pyr, and Pyr@M. In brief, a few sample powder and potassium bromide pellets were mixed, followed by grinding for 3–5 min, and finally being pressed into sheets. The spectral region was between 4000 and 500 cm−1 and the resolution was 4 cm−1.
The specific surface area and pore size analyzers (TriStarII 3020, Micromeritics Instruments Corp, Norcross, GA, USA) were used to measure nitrogen adsorption, and the pore characteristics and specific surface area changes of nanoparticles before and after pesticide loading were studied. The sample powder was degassed for 6 h at 120 °C, using N2 as the analyses gas. By measuring the adsorption volume under different adsorption pressures, the adsorption–analytical isotherm was obtained. The surface area and the pore size distribution were calculated using the Brunauer–Emmett–Teller (BET) equation and the Barrett–Joyner–Halenda (BJH) model, respectively.

2.5. In Vitro Release of Pyr from Pyr@M15, Pyr@M100, and Pyr@M200

Twenty milligrams of Pyr@M15, Pyr@M100, and Pyr@M200 was weighed and placed in a dialysis bag (molecular weight cut-off: 8000–14,000 Da), respectively. Phosphate buffered saline (PBS) and ethanol (80:20, v/v) was used as the release medium solution. The dialysis bag was soaked in 200 mL of release medium. A thermostatic oscillator (HZQ-X300C, Shanghai Yiheng Scientific Instrument Co., LTD, Shanghai, China) was used at 25 ± 1 °C, 150 rpm. Sampling was done at a certain time interval. At each sampling, a syringe was used to take out 1 mL of release medium. After that, an equal amount of fresh medium solution was supplied to keep the total volume constant. HPLC was employed to measure the concentration of Pyr in the release medium. For the release test, each sample was repeated three times and the final data were averaged. The accumulative release percentage of Pyr@M was calculated as the following equation.
E r = V e i =   0 n - 1 C i + V 0 C n m p e s t i c i d e × 100 %
  • Er: the accumulative release percentage of Pyr, %;
  • Ve: the volume of the release medium taken out at each sampling, Ve = 1 mL;
  • V0: the total volume of release solution, V0 = 200 mL;
  • Cn: the concentration of Pyr in release medium at sampling time n, mg/L;
  • mpesticide: the total mass of Pry in Pry@M, mg.

2.6. Translocation of Carbon Quantum Dots-MSN with Different Sizes in Cucumber Plants

The translocation of carbon quantum dots-MSN in cucumber plants were studied by root application. First, 60 mg of carbon quantum dots-MSN was added to plastic tanks with 200 mL deionized water, then four cotyledon cucumber seedlings were cultured in MSN disperse solution for 3 d. The roots and stems immersed in solution were washed with plenty of running water. The distribution of carbon quantum dots-MSN in cucumber plants was examined by a laser scanning microscope (Zeiss LSM 880 NLO, Carl Zeiss AG, Oberkochen, Germany). The laser for excitation was set as 488 nm.

2.7. Uptake and Dose Distribution of Pyr in Cucumber Plants

When the cucumber seedlings grew to the 3–4 leaf stage in plastic pots with the nutrient medium, the cucumber plants were immersed in the solution with Pyr and different particle sizes of Pyr@M. The mass concentration of the active ingredient was 5 mg/L. At the same time, the nutrient medium treatment was used as the control group. The treatment group and the control group were cultured in a greenhouse (temperature 26 °C, relative humidity 24%). After 2 h, 1, 3, 5, 7, and 10 d, the leaves and roots of cucumber were collected, respectively. The root samples were repeatedly rinsed with a large amount of pure water to remove pesticide residues on the surface. After homogenization, both the leaf and root samples were stored at −20 °C for analysis.

2.8. Analysis Method of Pyr in Cucumber

A modified QuEChERS method was used to extract Pyr from the cucumber samples. The specific operation was as follows—1.0 g of cucumber leaves or roots sample were weighed into a 50 mL polyethylene plastic tube, then 1 mL deionized water and 5 mL acetonitrile were added to extract the Pyr, by oscillating on a vortex oscillator (VX-III, Beijing Tajin Technology Co.,Ltd., Beijing, China) for 10 min. Then, 3.0 g of NaCl was added into the mixture. After high-speed centrifugation, 1 mL of the acetonitrile supernatant was taken out for purification. For the leaf samples, 10 mg of MWCNTs and 60 mg of MgSO4 was used as the loose sorbents. For the root samples, 60 mg of MgSO4 was added into the acetonitrile supernatant.
High performance liquid chromatography-tandem mass spectrometry (HPLC/MS/MS, Thermo TSQ Quantum Ultra, Seymour Fisher Technology Co., LTD, Shanghai, China) was used to determine the concentrations of Pyr. Separation was achieved on a reversed-phase column (Hypersil GOLD-C18, 1.9 μm, 2.1 mm × 100 mm, Agilent, Santa Clara, CA, USA) at 30 °C. The mobile phase consisted of acetonitrile and 0.1% formic acid (70/30, v/v). The injection volume was 5 μL and the flow rate was kept constant at 0.3 mL/min. The positive ionization mode was chosen for Pyr. Product ion mass spectra were obtained in electrospray ionization using collision-induced dissociation and the collision energy was optimized for two selective ion transitions. Two multi-response monitoring (MRM) ion transitions (m/z 413.19→145.28, m/z 413.19→205.31) were chosen for confirmation, and the more sensitive ion transitions (m/z 413.19→145.28) was used for quantification. The capillary voltage was 3500 V. The carrier gas was nitrogen with gas flow of 8 L min−1 and the nebulizer gas kept at 35 psi. The retention time of Pyr was 2.84 min.
The concentration of Pyr in fresh weight was measured using the above method.

2.9. Statistical Analysis

The mean ± standard deviation were determined in triplicates. For the statistical analysis, SPSS 24.0 was used to carry out one-way analysis of variance and Duncan’s multiple range test. The P values that were less than or equal to 5% were considered to be significant.

3. Results and Discussion

3.1. Preparation and Characterization of Carbon Quantum dots-MSN, Pyr@M15, Pyr@M100, and Pyr@M200

Different sizes of carbon quantum dots-MSN were synthesized by varying the proportion of sodium hydroxide and water, i.e., the pH of the solution, as shown in Table 1. It was found that the particle size increased when the pH of the solution increased, which was consistent with Lu’s study [8]. The TEM images in Figure 2 show that the carbon quantum dots-MSN nanoparticles exhibited uniform and regular spherical morphology, with a relatively smooth surface. Statistical analysis showed that the average particle size of carbon quantum dots-MSN was about 15, 100, and 200 nm, respectively. After pesticide loading, Pyr@M had similar structures, sizes, and dispersion with carbon quantum dots-MSN. Herein, the pesticide loading process did not change the size of nanoparticles, since the pesticide entered the mesoporous structure of MSN, as in our previous report [29,38,39]. In addition, it was shown in Figure S1 that Pyr in the technical material (TC) had an irregular crystal structure and the particle size was about 3 μm, much larger than the nanoparticles.
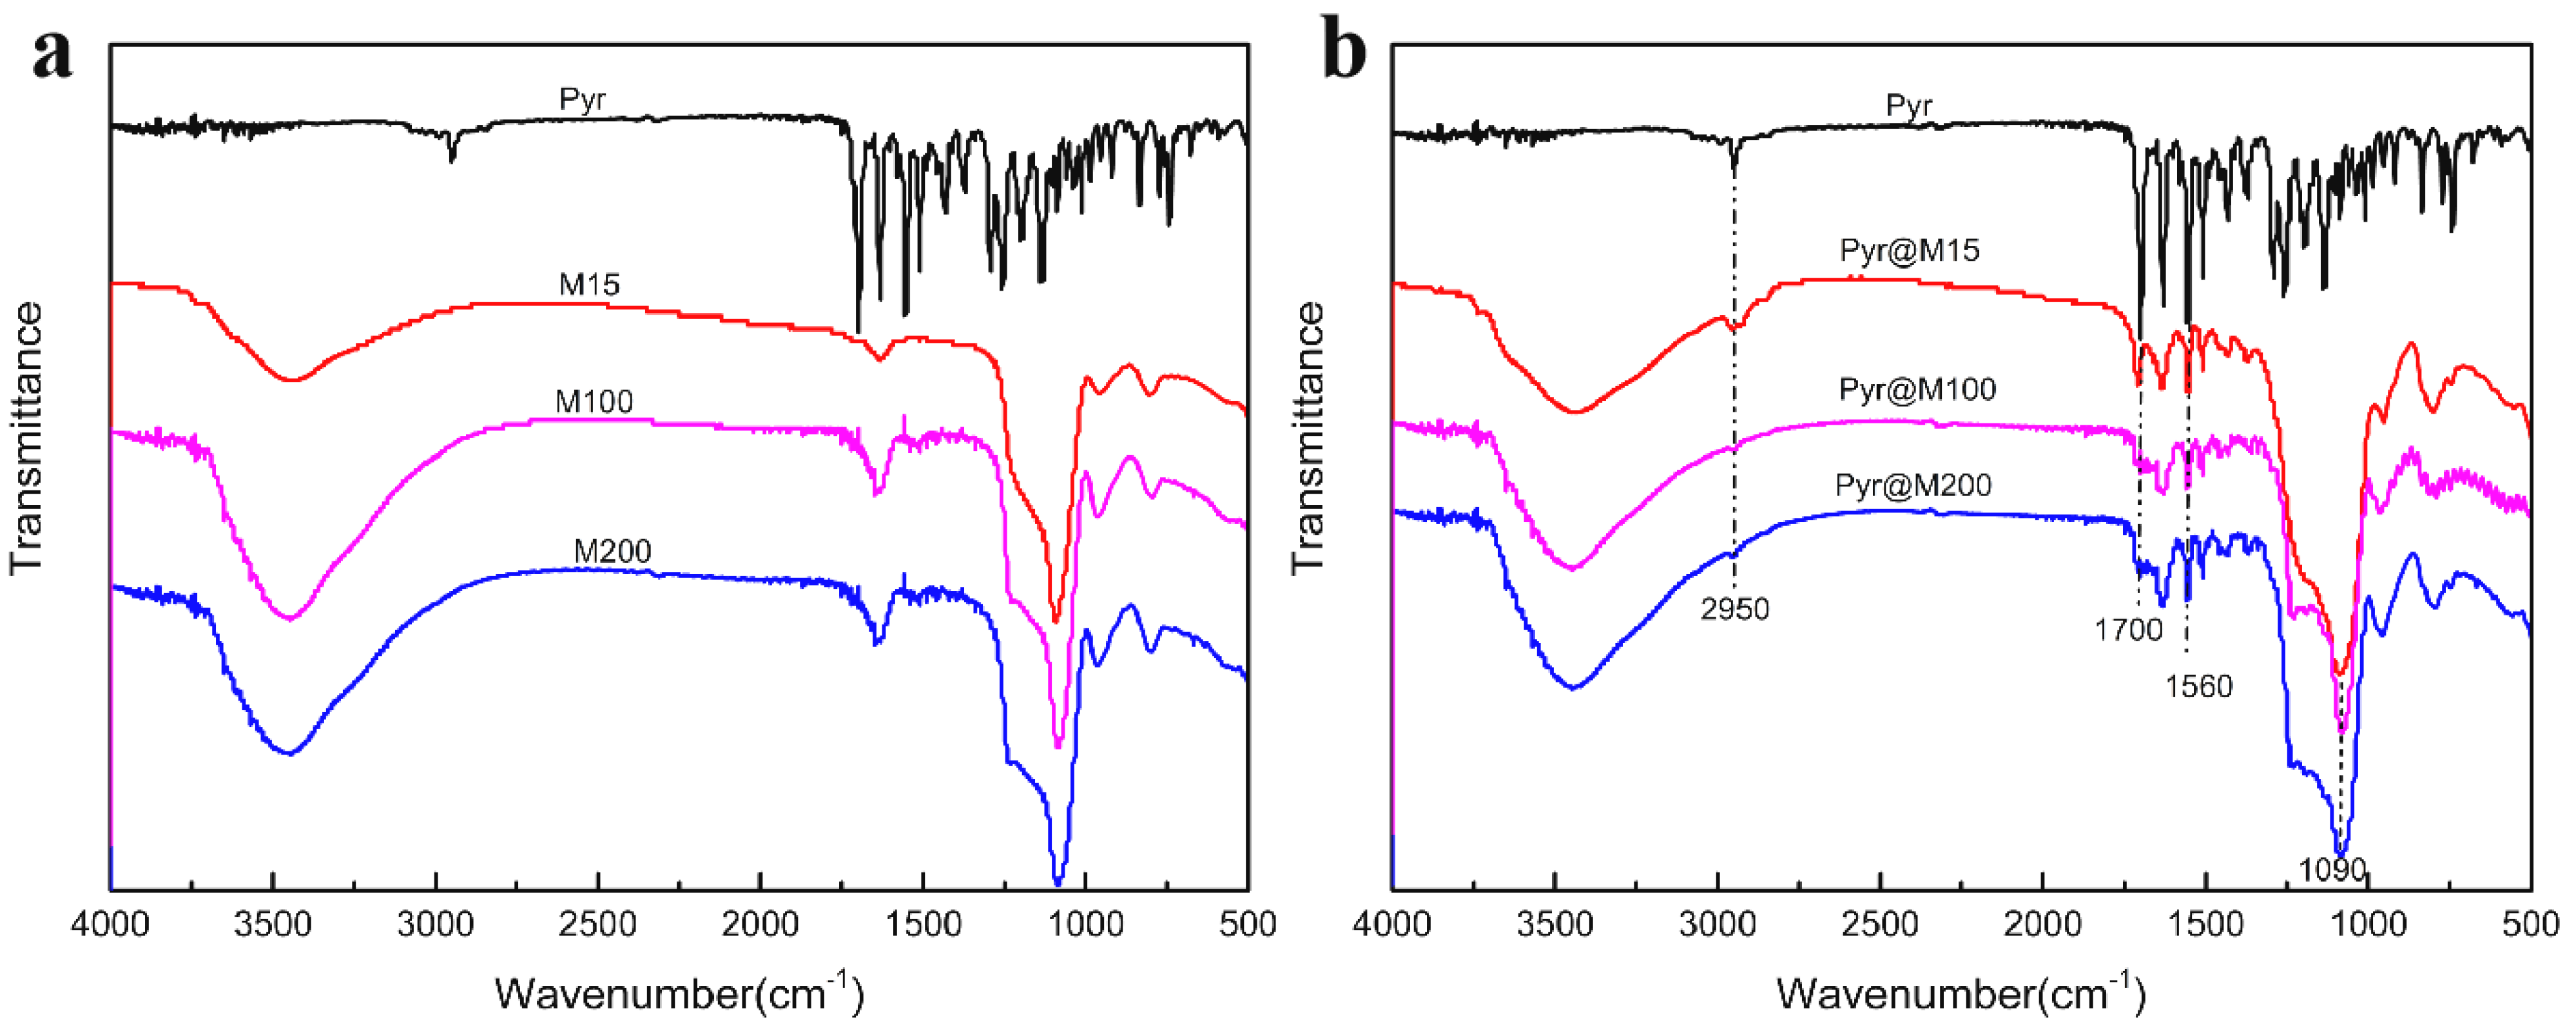
The FTIR spectra of carbon quantum dots-MSN with different particle sizes and Pyr@M are shown in Figure 3. The 1090 cm−1 broad absorption band was found in both carbon quantum dots-MSN and Pyr@M, which was attributed to the characteristic Si−O−Si (siloxane) stretching vibrations. As seen in Figure 3b, the 2950, 1700, and 1560 cm−1 broad absorption band found in Pyr were attributed to the characteristic –OCH3, C=O, and C-N stretching vibrations, respectively. This was also observed in Pyr@M15, Pyr@M100, and Pyr@M200, indicating the successful loading of Pyr into the carbon quantum dots-MSN.
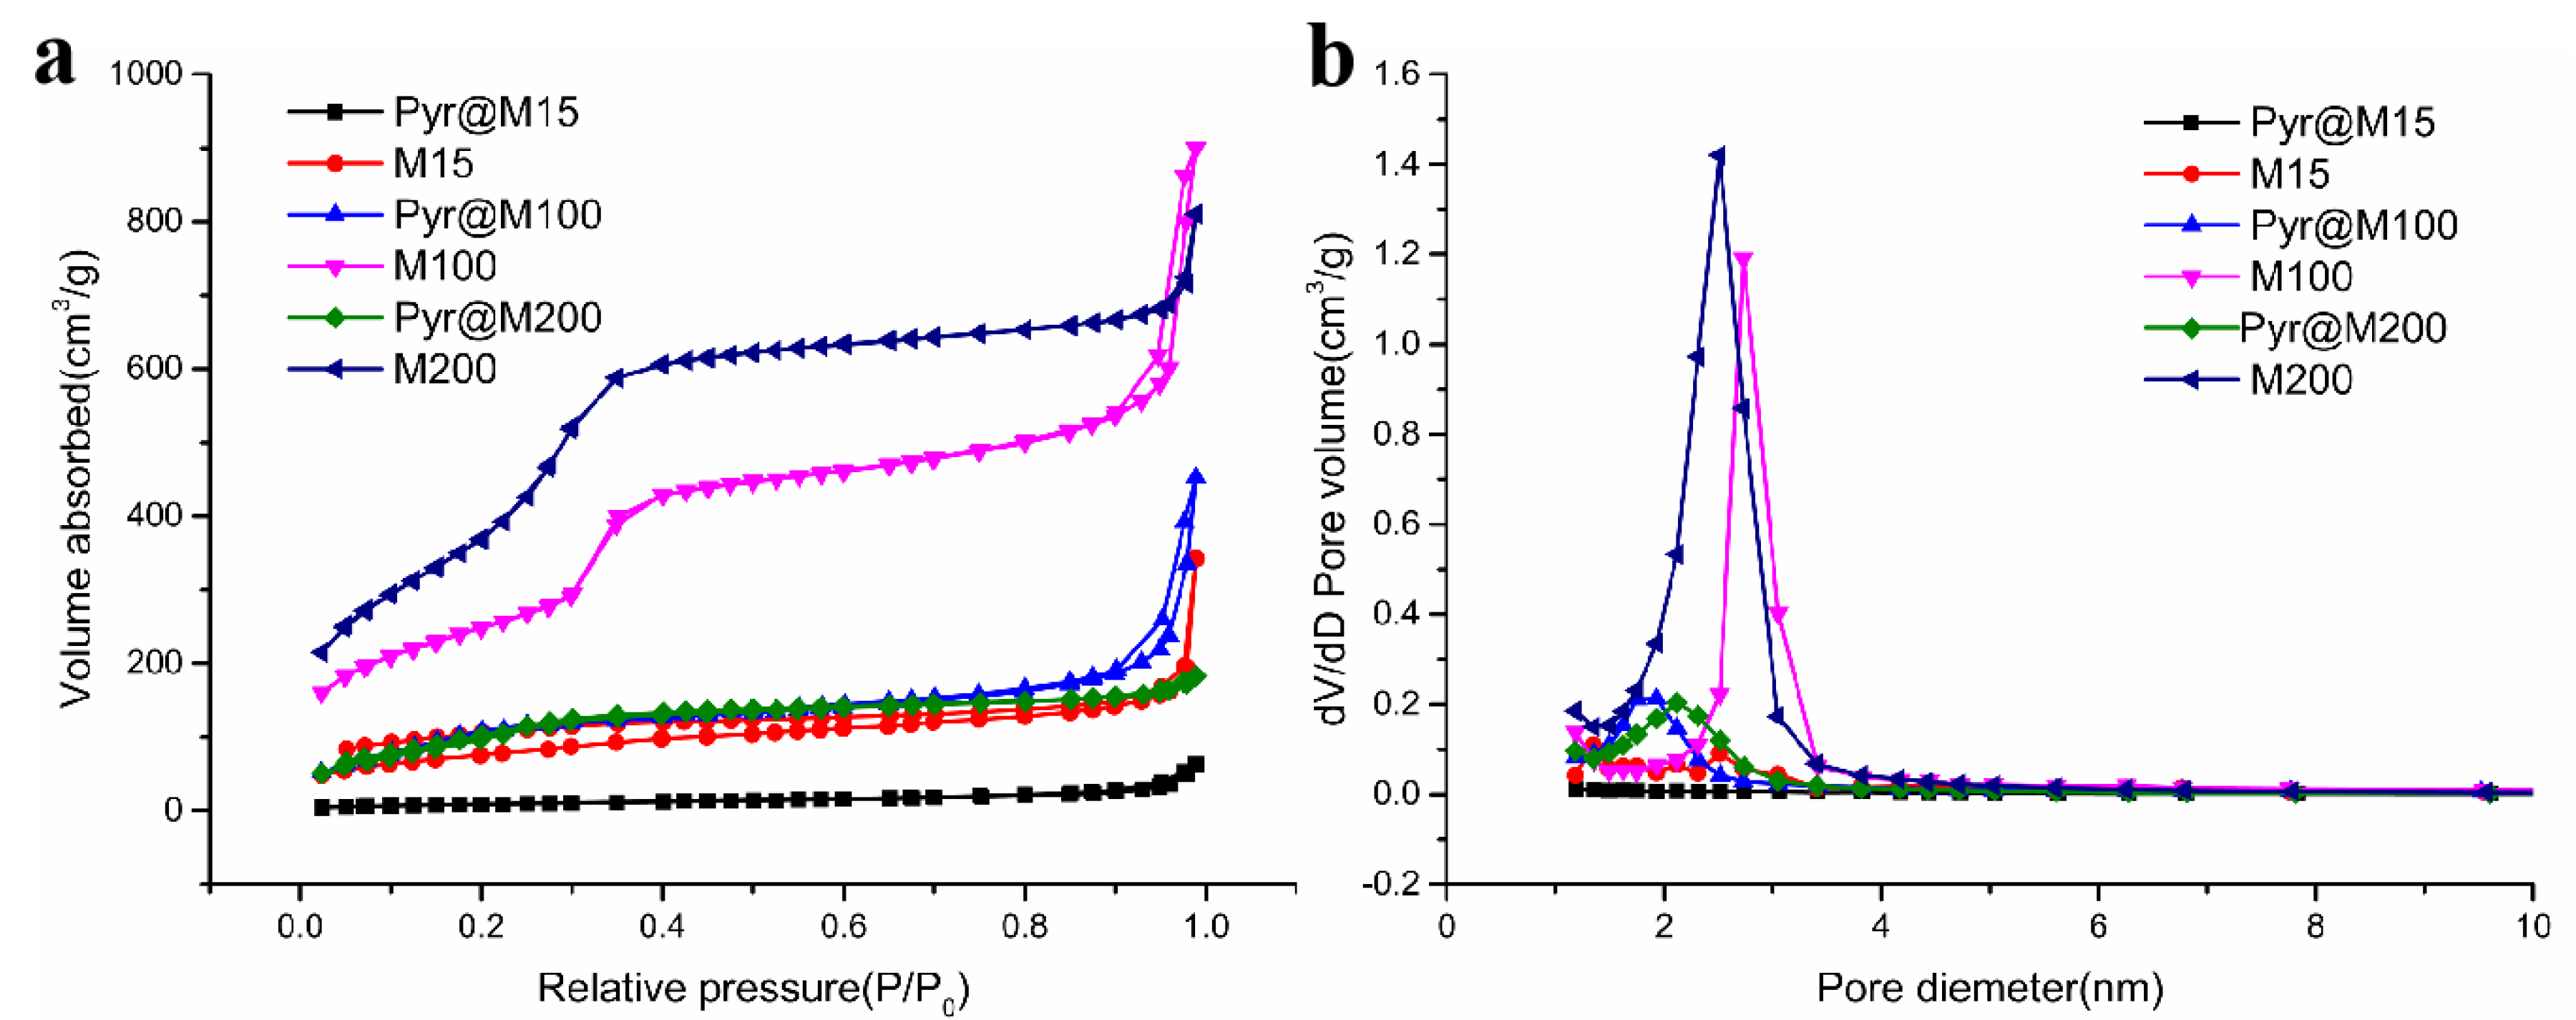
Figure 4 shows the nitrogen adsorption and desorption isotherms of carbon quantum dots-MSN and Pyr@M. It was seen that all of the sorption isotherms were of type IV isotherm, indicating that all samples had an ordered mesoporous structure. The mesoporous structure characterization of the prepared nanoparticles are summarized in Table 2. For carbon quantum dots-MSN, the specific surface area, pore volume, and pore diameter decreased as the particle size decreased. When the size of quantum dots-MSN reached 15 nm, the specific surface area decreased to 342.09 m2/g. After Pyr loading, the specific surface area, pore volume, and pore diameter reduced, as expected. For Pyr@M15, the specific surface area continued to decrease to 63.12 m2/g. Different sizes of carbon quantum dots-MSN were obtained by changing the pH of the solution, but the size of the pore structure in the carbon quantum dots-MSN decreased with the particle size.

3.2. Opitimization of Pyr Loading Content

It is important to obtain a high loading content in the pesticide delivery system. During the loading process, the solvent selection had a great effect on the loading content [39]. Acetonitrile, dichloromethane, and methanol were chosen to dissolve Pyr, respectively, to obtain the optimum solvent. In a preliminary experiment, M100 was used as the carriers and the mass ratio of Pyr to MSN was set as 2:1. As shown in Table 3, the loading content was as low as 5.86% and 4.25%, respectively, when acetonitrile and methanol was used. The highest loading content was obtained as 18.86% when dichloromethane was used to dissolve Pyr. As a result, dichloromethane was selected as the optimum solvent.
The mesoporous structure, surface, and pore size of nanoparticles would have a great effect on pesticide loading. Pry was loaded to M15, M100, and M200, respectively, when the mass ratio of Pyr to MSN was set as 2:1 and dichloromethane was used as the solvent. It was seen in Table 3 that the loading content reduced when the size of the nanoparticles decreased. As was mentioned in Section 3.1, the specific surface area, pore volume, and pore diameter of carbon quantum dots-MSN decreased as the particle size decreased. In the pesticide loading process, the pesticide would occupy the mesoporous structure of carbon quantum dots-MSN. When the pore volume diameter became smaller, it would be more difficult to enter the pore for pesticide. Therefore, the highest loading content was obtained when M200 was used as the pesticide carriers.
To reduce the influence of loading content on the study of pesticide uptake and translocation, similar loading contents of Pyr@M15, Pyr@M100, and Pyr@M200 were obtained, at about 23%, by changing the mass ratio of Pyr to MSN; shown in Table 3.

3.3. Controlled Release

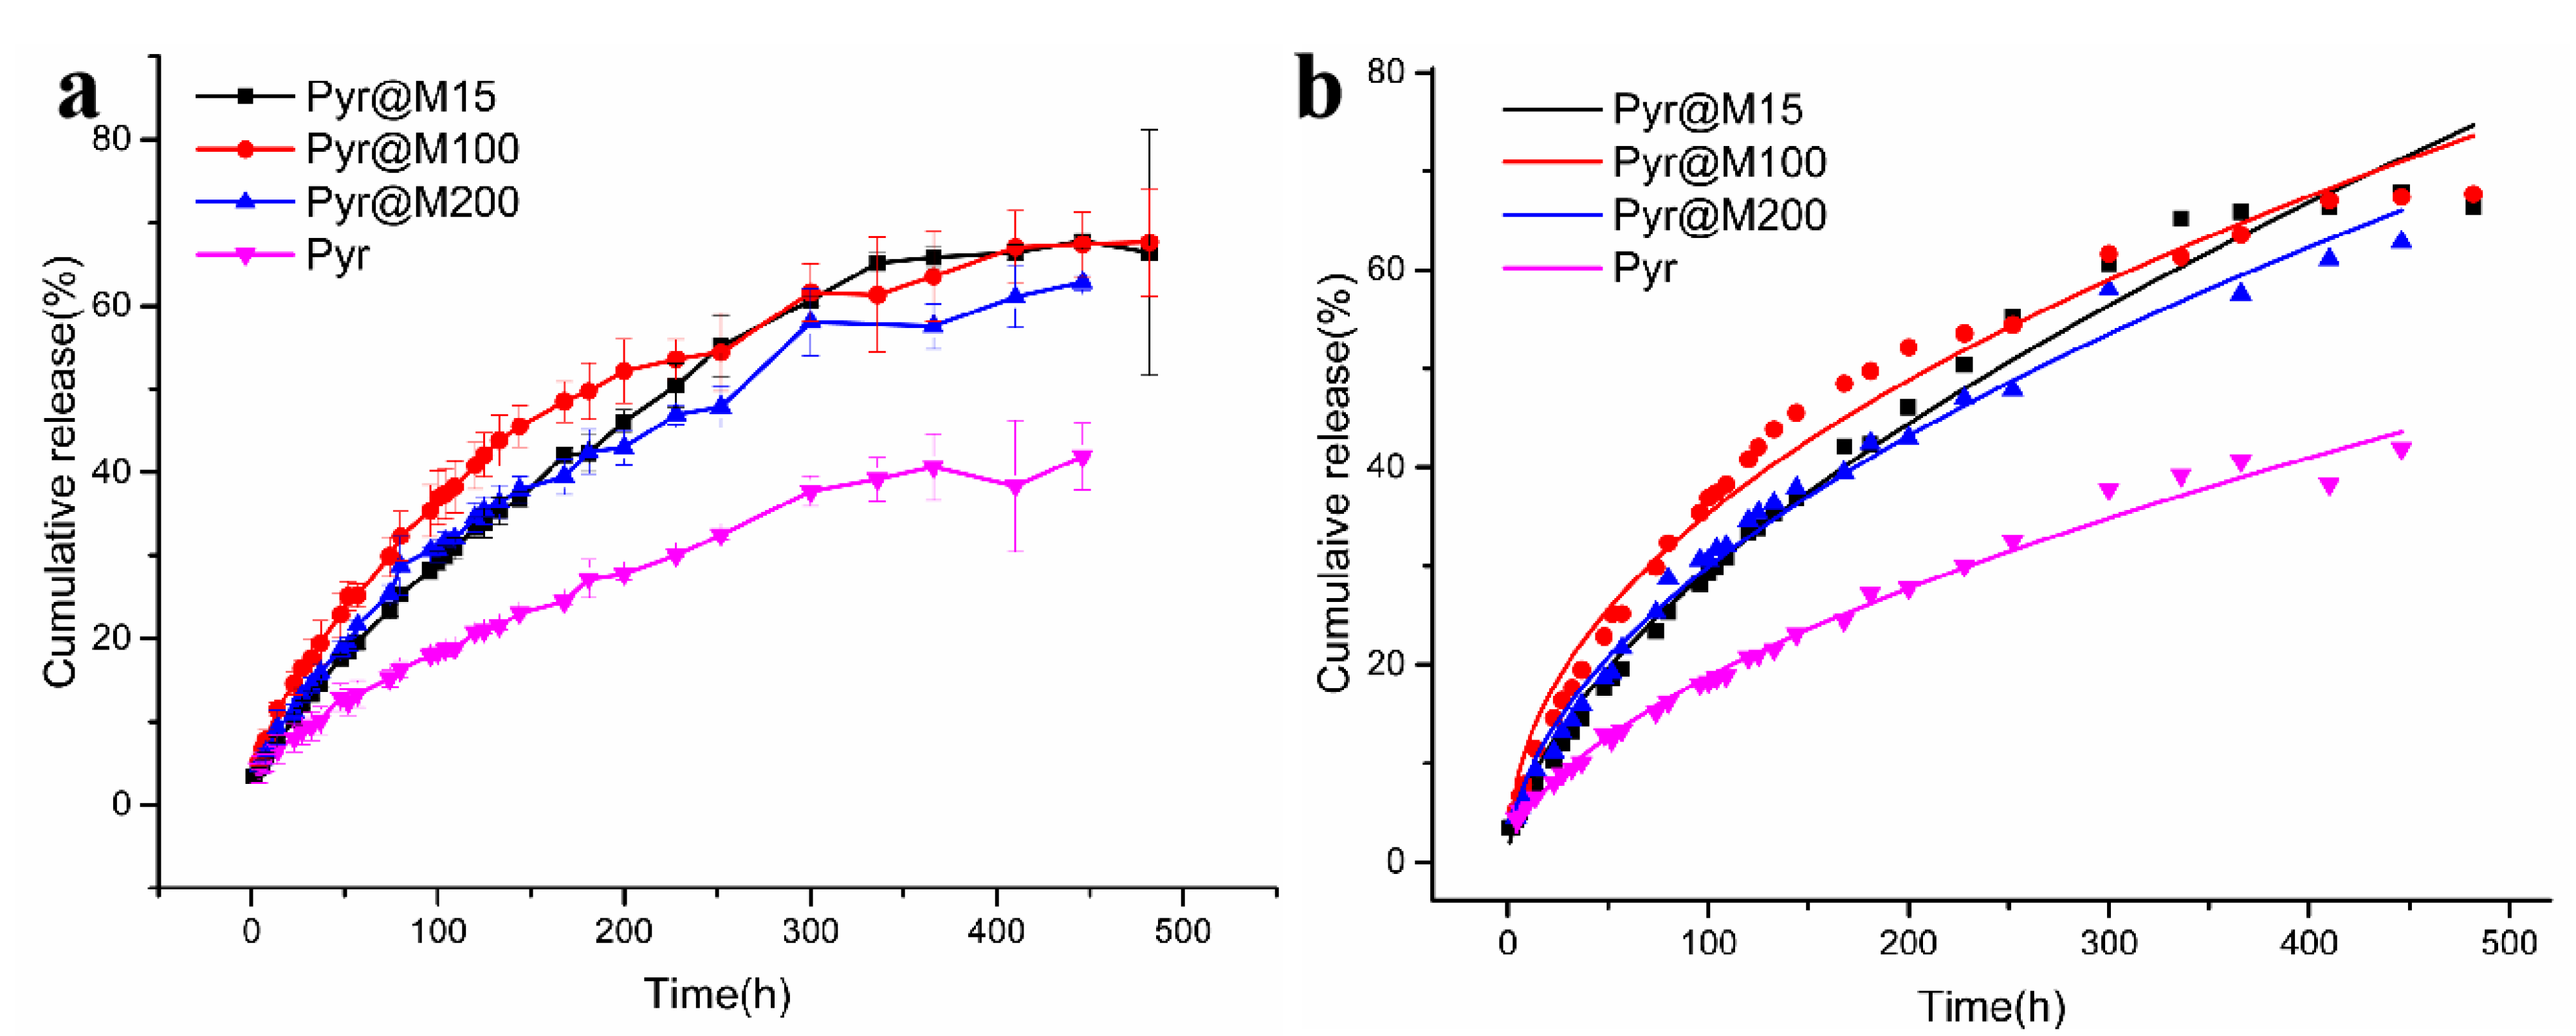
Figure 5 shows the release behaviors of the Pyr@M15, Pyr@M100, Pyr@M200, and Pyr. A certain proportion of ethanol is usually added to increase the solubility of pesticides due to the poor solubility of most pesticides. In order to completely dissolve the Pyr in the release medium, 20% PBS aqueous ethyl alcohol solution was used as the release medium. In vitro lab studies revealed that in comparison with Pyr@M15, Pyr@M100, Pyr@M200, and Pyr showed a better release of up to 400 h. After 400 h, the cumulative release rates of Pyr from the Pyr@M in the medium reached more than 60%. On the other hand, Pyr dissolved slowly at only 40%, due to its poor water-solubility. This suggested that the nanoparticles increased the solubility of insoluble drugs, which promoted the release of pesticides. It was mentioned in Section 3.1 that the average particle size of Pyr@M15, Pyr@M100, and Pyr@M200 was about 15, 100, and 200 nm, respectively, and the particle size Pyr in technical material (TC) was about 3 μm, much larger than the nanoparticles. As the particles size decreased, particle number and surface area would increase, which improved the solubility of the active ingredient. From Figure 5, the release curves of different particle sizes almost coincide, this indicated that size had no clear difference impact on the release rate. The effect of particle size on release, however, was found to be minimal.
To further clarify the release principle, the Pyr release data from Pyr@M15, Pyr@M100, and Pyr@M200 were fitted using the Ritger–Peppas equation [40], Mt/M = ktn, where Mt/M is the accumulative release (%) of Pyr from the nanoparticles at time t; k is the kinetic constant; n is the release exponent; the fitting plots are shown in Figure 5b. The kinetic parameters obtained from this fitting are summarized in Table 4, The n value indicated the type of release mechanism. It was observed that all n values exceeded 0.45 but were lower than 0.89, indicating a non-Fickian transport [41]. The release results demonstrated that the different sizes of carbon quantum dots-MSN loading pesticide did not change the release mechanism.

3.4. Transportation of MSN in Cucumber Plants

There are many ways to study the absorption and conduction of pesticides in plants. Liu et al. [35] labeled pyraoxystrobin with radioisotope 14C; the radiation intensity of various parts of plants can be observed using autoradiography, and then the distribution and route of pesticides in plants can be judged, but the method is costly and radioactive. Guglielmi et al. [42] used a non-destructive method to study the absorption and conduction of pesticides in plants, which would allow monitoring over a much longer period without degrading the plants, and the data are more reliable. In this study, the fluorescence labeling method was used to study the conduction process of nanoparticles in plants. This method is simple to operate and is low cost, and its fluorescence properties can be used to visualize the transport behavior of pesticides. Meanwhile, residue analysis was used to determine the difference in content and the distribution of pesticides in plants.
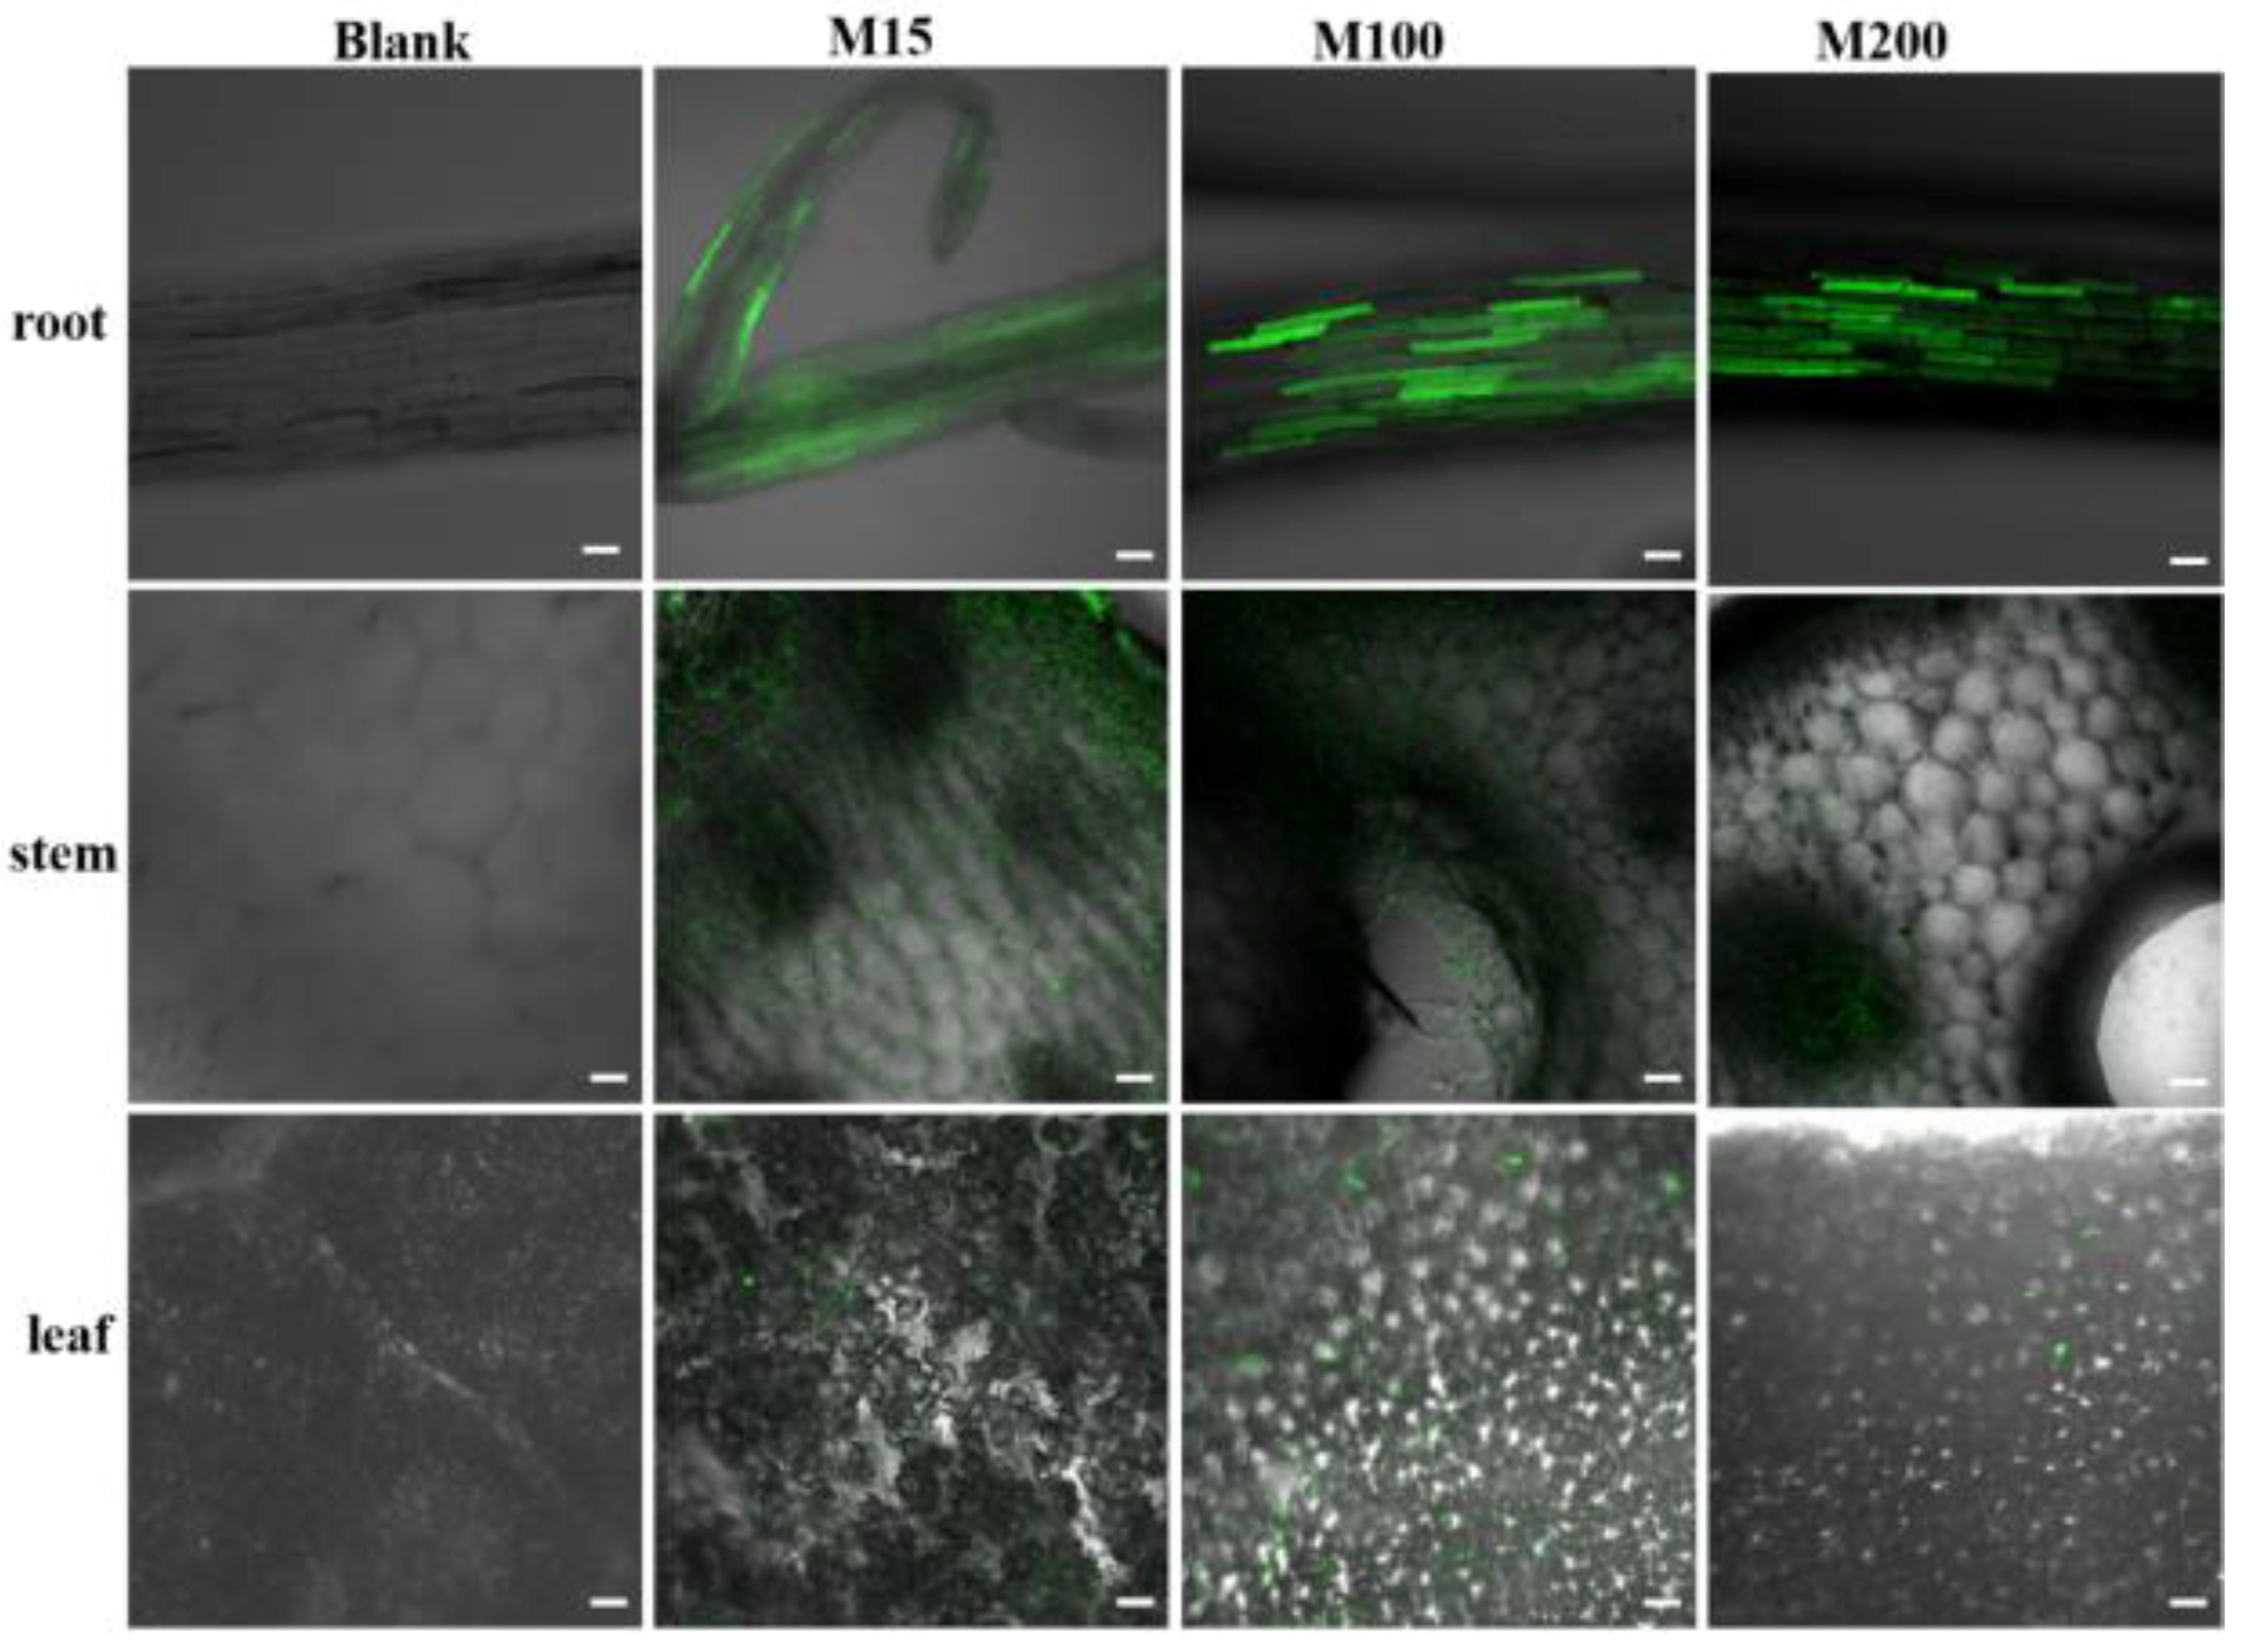
Carbon quantum dots-MSN have a strong fluorescence signal, which makes translocation visible under LSM. Figure 6 shows the LSM image of a cucumber plant. It was observed that all treated groups (M15, M100, and M200) had a strong fluorescent signal and a blank sample without any treatment of nanoparticles had no interference with the fluorescent signal. This finding was line with the fact that MSN could penetrate the cell wall of arabidopsis thaliana into the root maturation area [24]. From the LSM images of stem and leaf, fluorescent signals with patches of carbon quantum dots-MSN of different particle sizes were also observed. This indicated that carbon quantum dots-MSN with particle sizes of 15, 100, and 200 nm could enter the cucumber plant cell wall and translocate upward to other parts, such as the stem, petiole, and leaves, through transpiration, indicating that MSN would be used as the carrier of pesticide in plants.

3.5. Analytical Method Validation

Matrix influence was eliminated by setting the matrix standard. The results of quantitative analysis using the matrix external standard method showed that within the linear range (0.1–1 mg/kg), the peak area of Pyr showed a good linear relationship with the injection mass concentration in cucumber leaves and roots matrix, with a correlation coefficient (R2) better than 0.9996 (Table 5).
In this study, the feasibility of the method was verified by adding a recovery test. The recovery and reproducibility experiments were carried out for the leaf and root samples in five replicates, at three fortification levels 0.01, 0.1, and 1 mg/kg, respectively. The results of the addition recovery test in Table 5 showed that the recoveries of Pyr were in the range from 74–81% for the cucumber leaves, and 87–97% for the roots, respectively. RSD was 0.54–7.36%, which satisfied the requirements for pesticide residue detection. The results showed that the lowest detected concentration (LOD) of Pyr in the cucumber plants and the roots matrix was 0.1 μg/kg, and the lowest added level was used to determine the quantitative limit (LOQ).

3.6. Uptake and Distribution of Pyr@MSN in Cucumber Plants

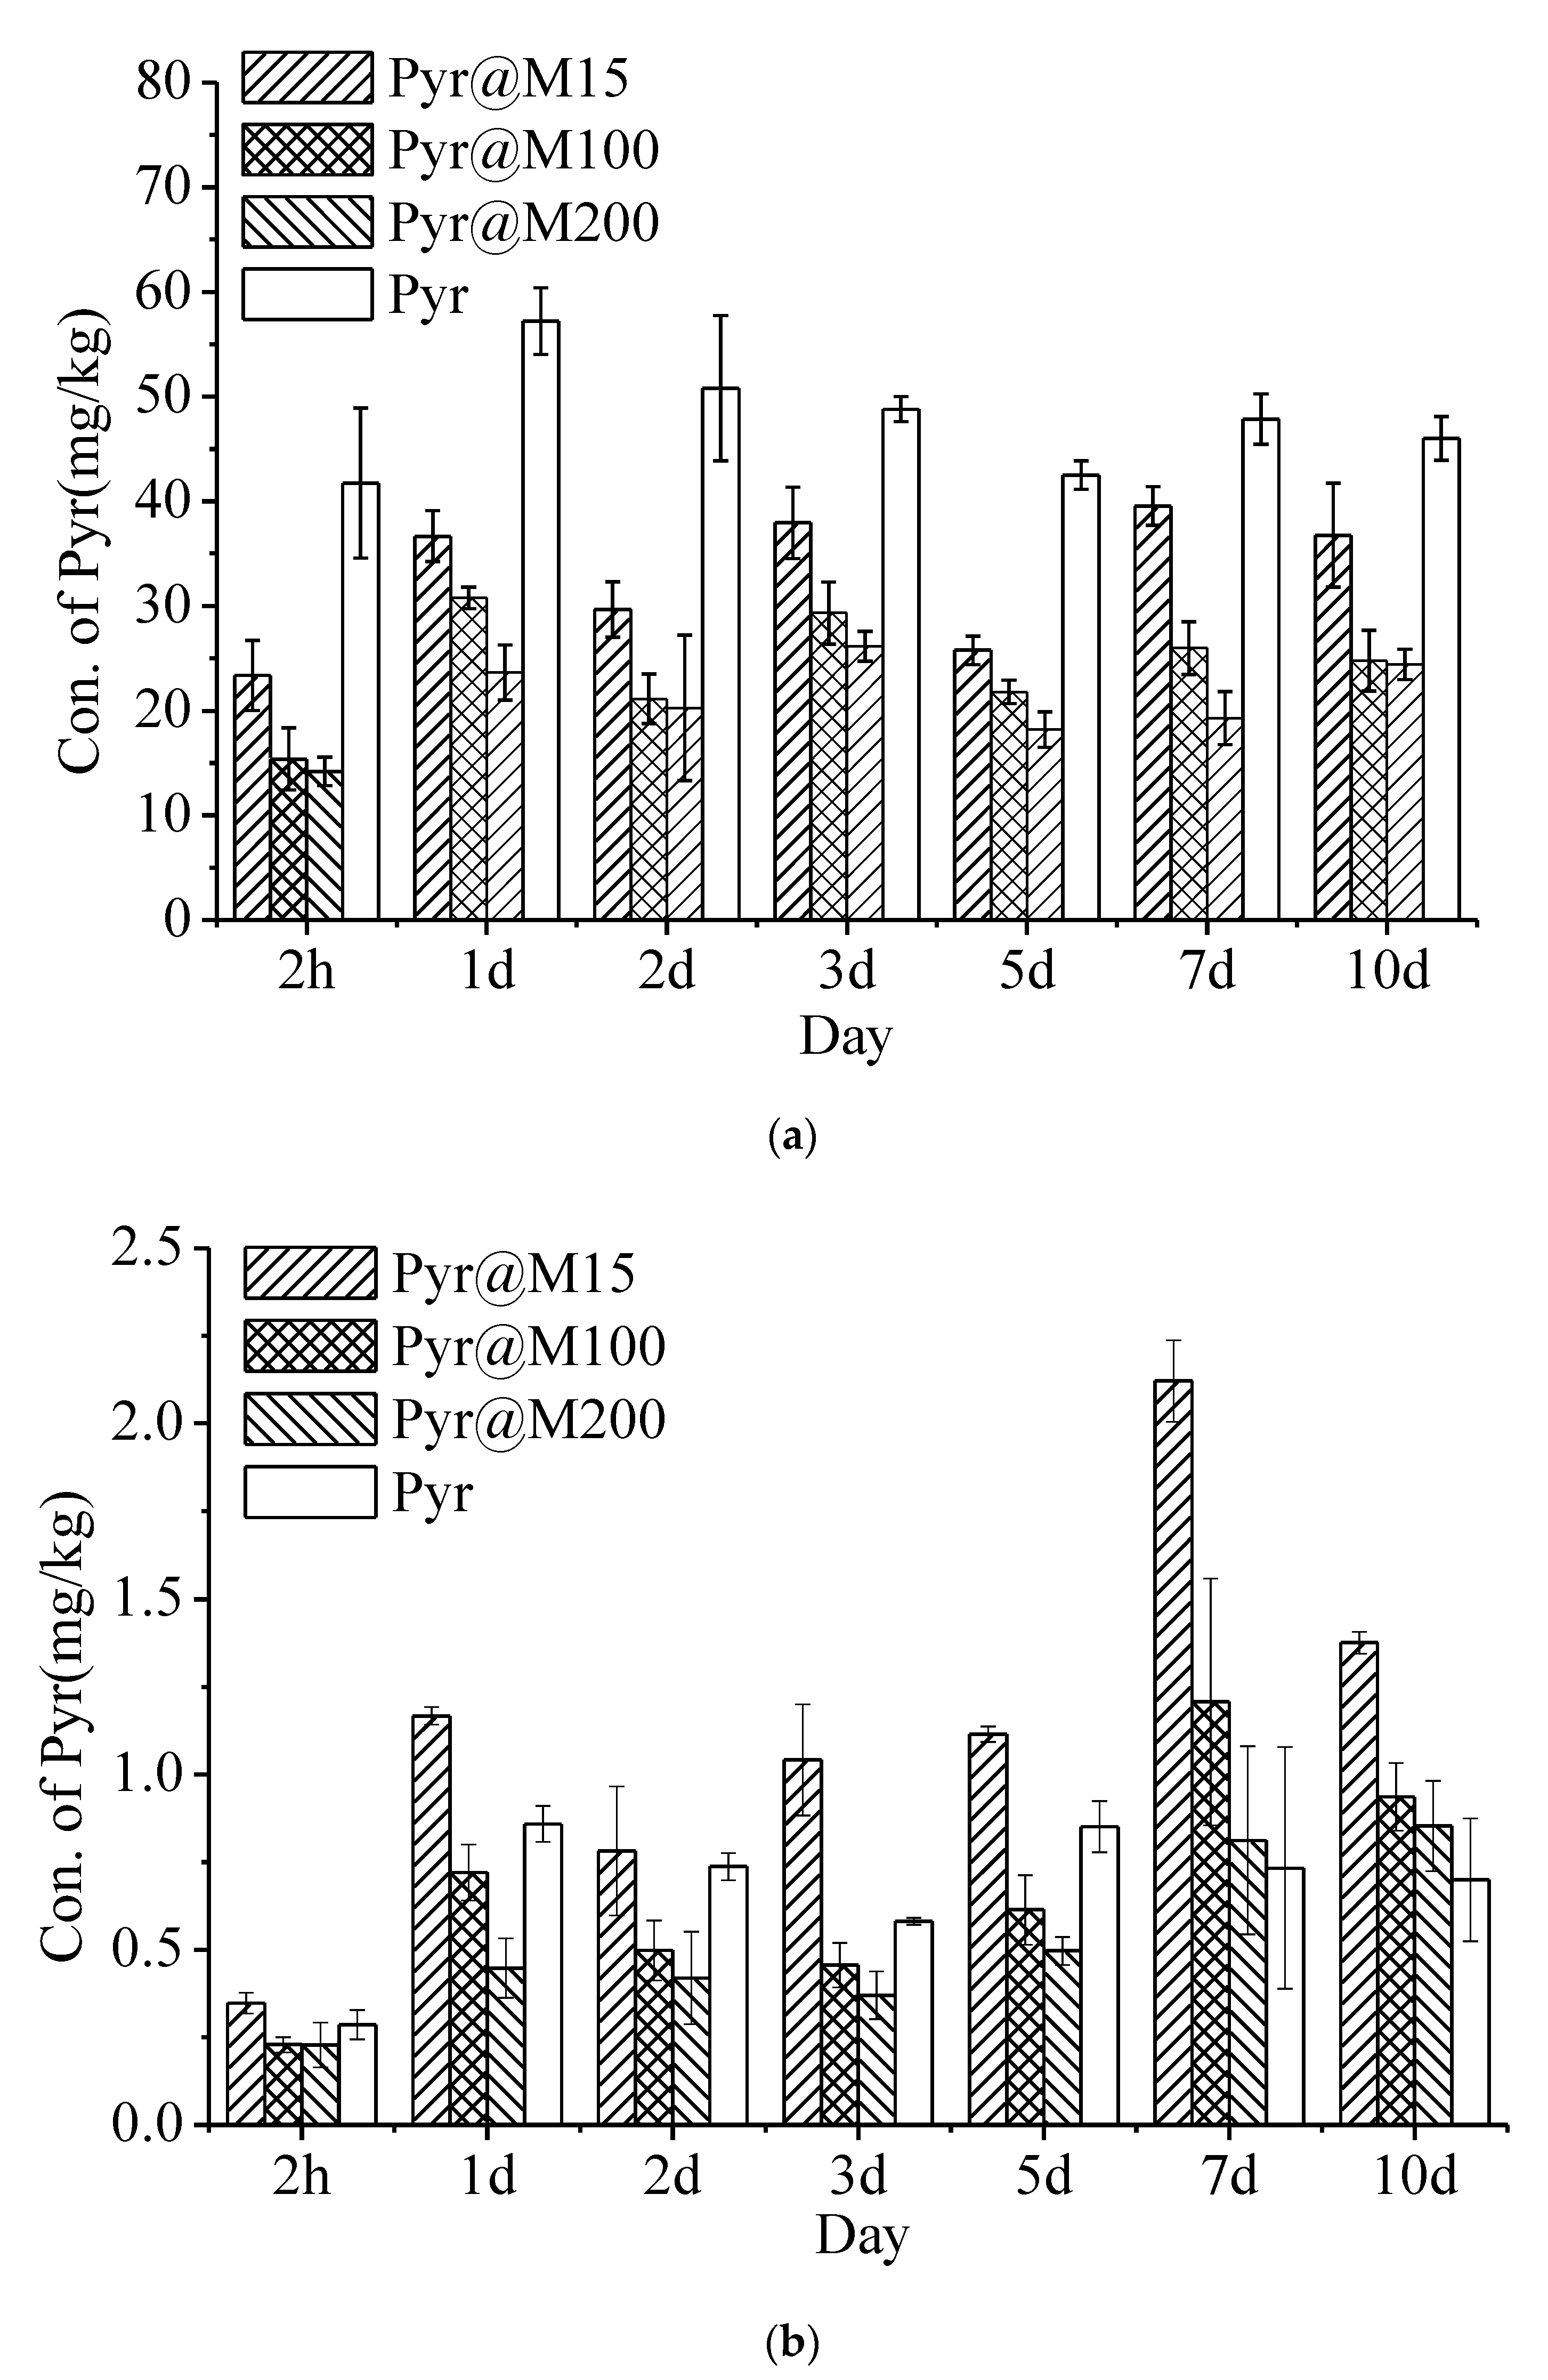
The plant root system is one of the most important parts in which pesticides enter the plant. In this study, the distribution behavior of Pyr@M and Pyr in cucumber plants was studied under roots application. Figure 7a showed that the uptake of Pyr was much higher than Pyr@M at the roots of cucumber. After the root application, pesticides were deposited or adsorbed on plant roots, then infiltrated into the cuticle and epidermis, and then migrated to the vascular tissues through the symplast or extracellular pathway. At this point, infiltration depended on the concentration of pesticides and particle size in the environment. The higher the concentration and the smaller the particle size, the easier it was to be absorbed by the roots. In this study, Pyr TC was first dissolved by acetone and then dispersed in water, as 5 mg/kg homogenous solution. However, Pyr@M enshrouded Pyr and kept it as suspension, so the concentration of Pyr around the roots was lower than the homogenous solution of Pyr, when Pyr@M was used. As a result, the concentration of Pyr in roots was lower than when Pyr@M was used.
On the other hand, it could be seen from the concentration levels of Pyr shown in Figure 7 that the pesticide could be found in the leaves and roots during the period of 2 h to 10 d. The results showed that the concentration was related to the size of Pyr@M. The cellular uptake was highly particle-size-dependent in the order Pyr@M15 > Pyr@M100 > Pyr@M200. Some studies report that only particles with a diameter of less than or equal to 50 nm can pass through the cells walls in the root systems of most plants [26,27], and in our previous study, it was observed that MSN with a particle size between 200–300 nm could also be absorbed by the cucumber leaves [29], but the dose in roots was very low. In roots, the uptake of Pyr@M15 was approximately 1.5 times that of Pyr@M100, and 2.5 times that of Pyr@M200. In leaves, the uptake of Pyr@M15 was approximately 1.7 times that of Pyr@M100, and 1.9 times that of Pyr@M200. Due to the smaller particle size, Pyr@M showed a better dispersion performance in water [43], and it became much easier for Pyr to be adsorbed by cucumber roots.
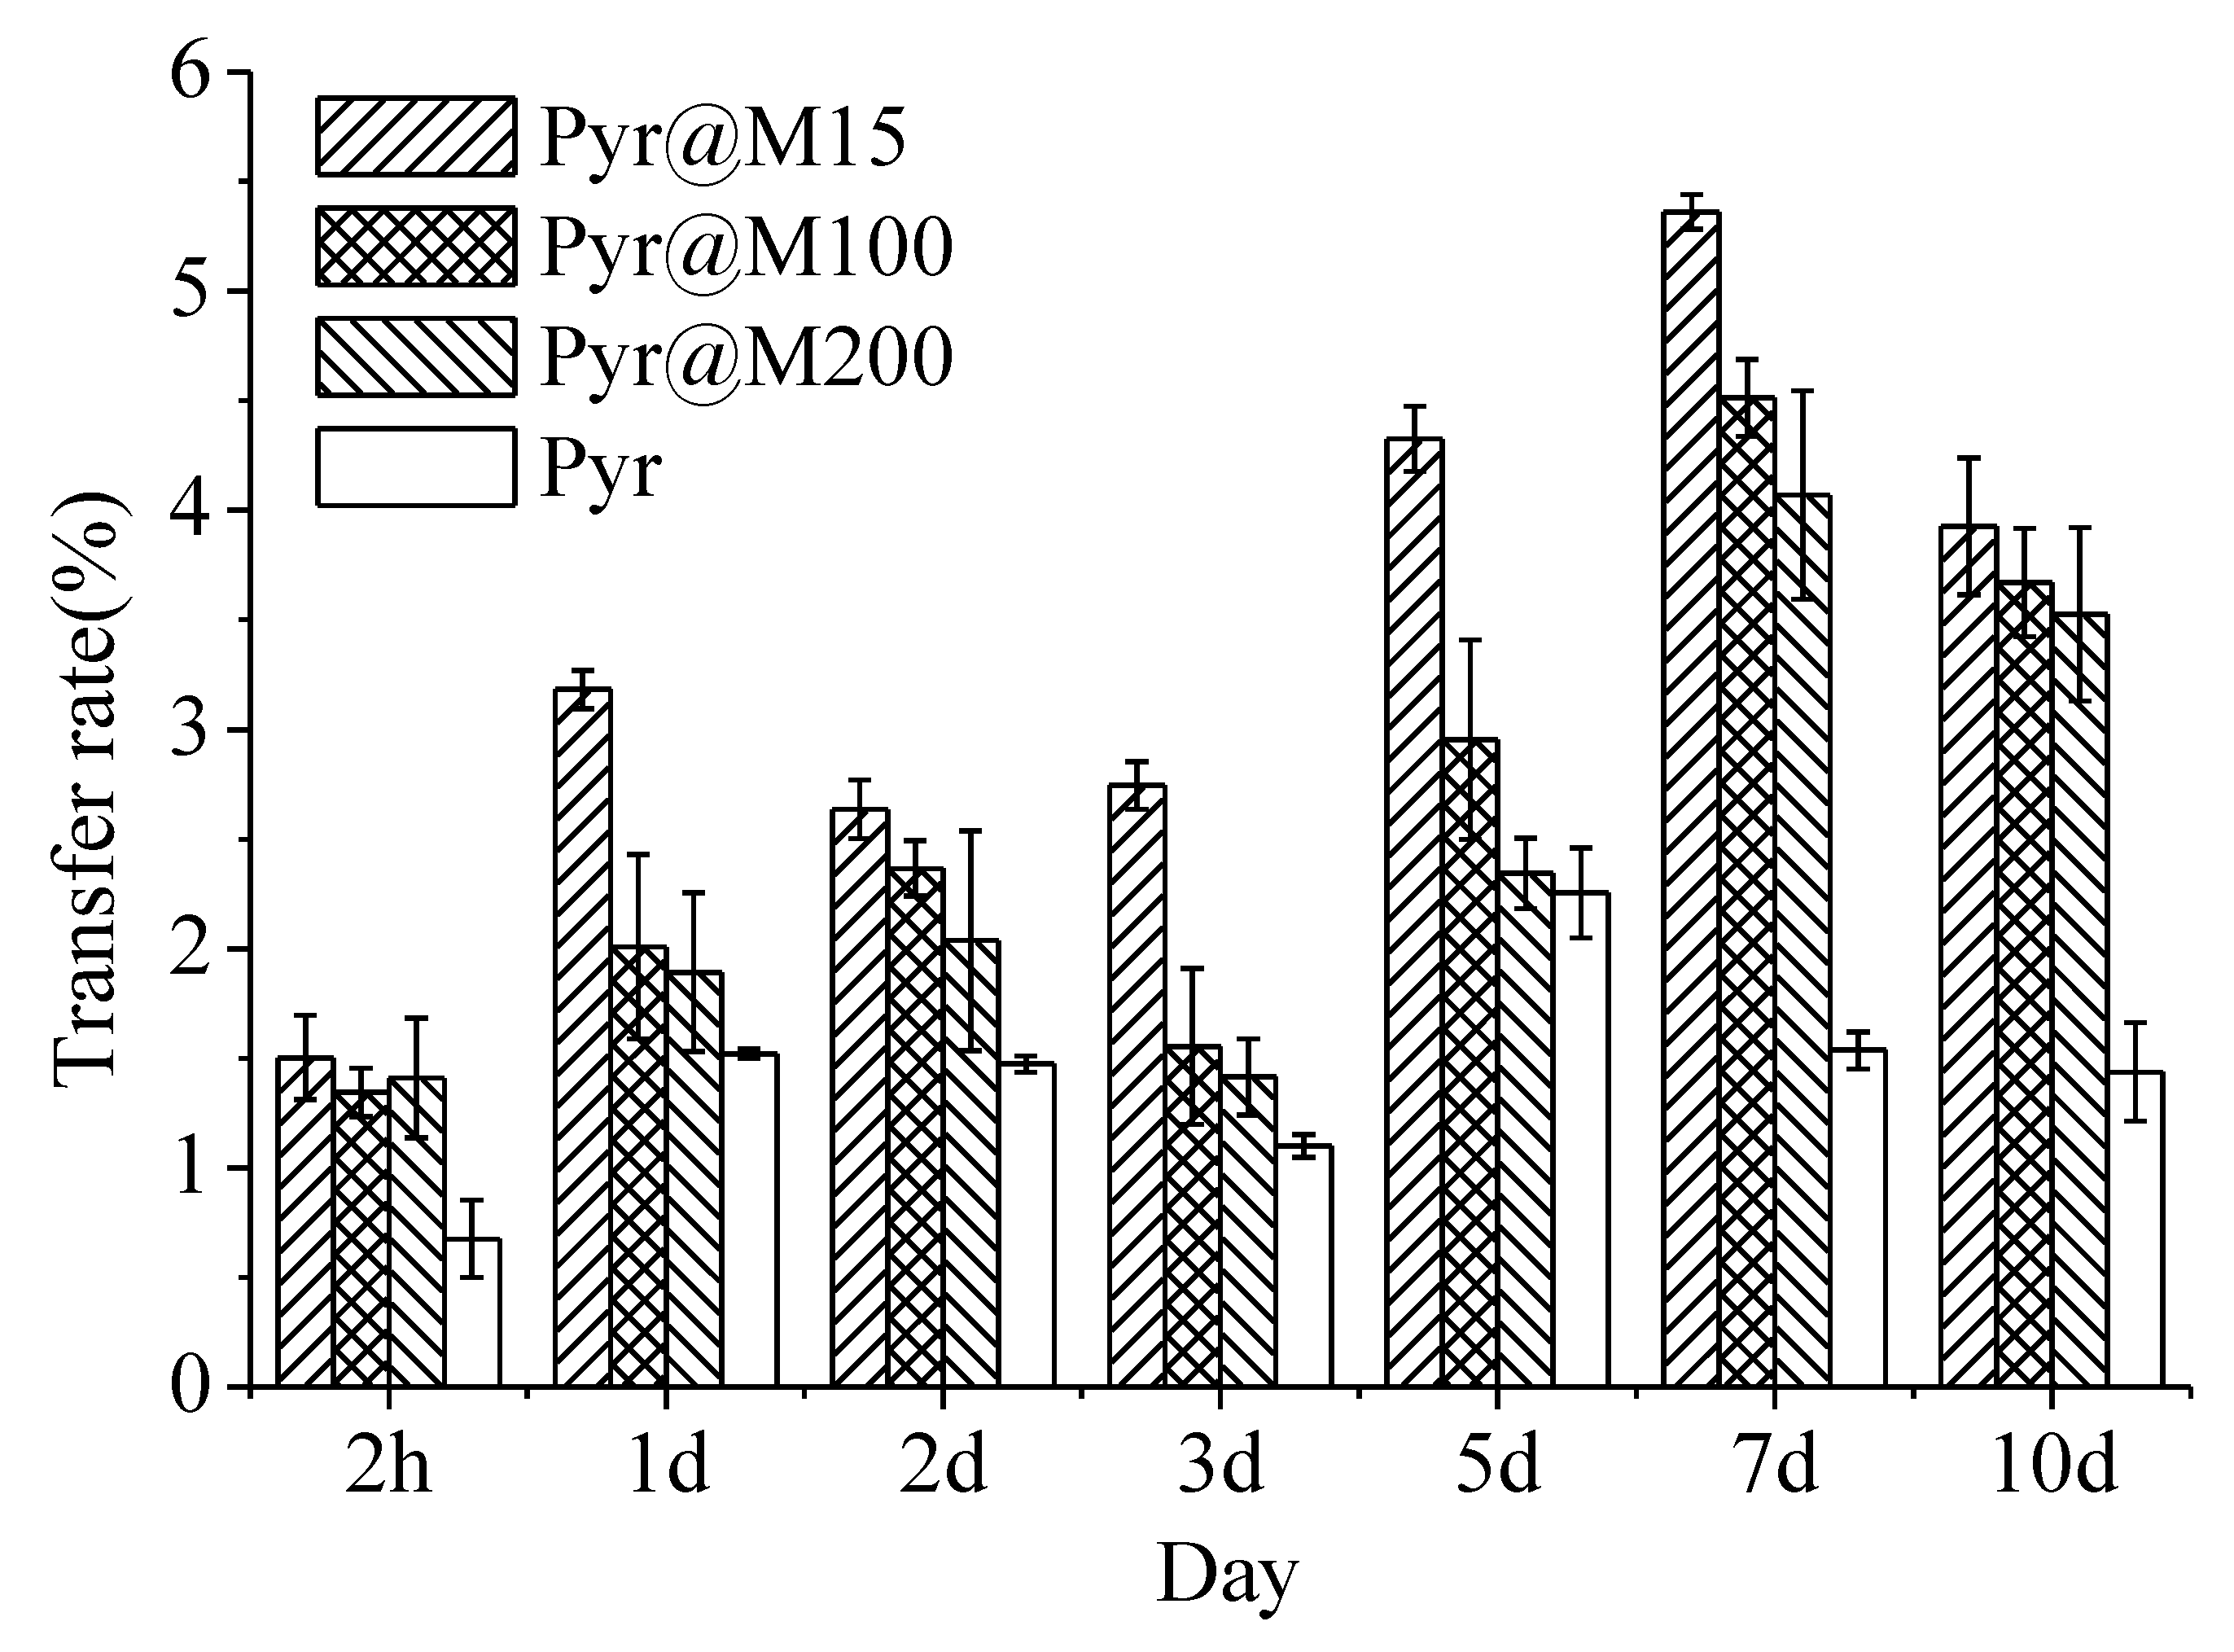
Figure 8 summarized the transfer rate of Pyr from the cucumber roots to leaves, which was calculated as the ratio of leaves concentration to root concentration. The results indicated that the Pyr@M had a significantly higher transfer rate than Pyr (p < 0.05). It was also shown that Pyr@M15 had the best transfer rate, which indicated that MSN with the smallest size would give the best transportation performance, as carriers. From the data, it was seen that the top transport capacity of Pyr was poor, with a maximum of 2.25%. Liu also reported that the Pyr had a poor transport performance on leaves and poor absorbability in cucumber and rice root [37]. After pesticide loading with mesoporous silica, the transfer rate of Pyr was increased by about 3.5 times, which further proved that the drug loading of mesoporous nanometer silica could improve the internality of pesticide. In our previous study it was also reflected that MSN could enhance the dose transfer of pesticide in plants [38,39]. The application of nanomaterial improves the internal conductivity of pesticides. The size had a great effect on the uptake and transportation performance of pesticide in plants.

4. Conclusions

In summary, we prepared the carbon quantum dots-MSN with different sizes (15, 100, 200 nm) to deliver pesticide in plant. It was found that the loading content increased as the particle size increased, which was related to the specific surface area, pore volume, and pore diameter of the nanoparticles. The carbon quantum dots-MSN as carriers increased the solubility of insoluble pesticide, and the nanoparticle size had no clear difference impact on the release rate. Meanwhile, uptake is particle-size-dependent and the smaller the Pyr@M size, the easier it is to be absorbed and transmitted by the roots and to be quickly transferred to other parts of the cucumber plant. This information guides the design of delivery systems based on MSN in target crops. In addition, the pathway and mechanism of nano-pesticide vary according to plant species, pesticide category, and application method.
It is worth discussing that nanomaterials might be potentially toxic [30,44,45]. There was a correlation between toxicity and particle size, however, the smaller particle size of MSN would make it unlikely to enter the cells and cause more toxic effects. In a future study, it is more important to figure out the human and animal toxicity of these kinds of products.

Supplementary Materials

The following are available online at https://www.mdpi.com/2076-3417/11/2/575/s1. Figure S1: SEM of Pyr TC.

Author Contributions

Conceptualization, P.Z. and M.J.; methodology, Y.X. and C.X.; Synthesis, C.X. and Y.X.; investigation, Y.X. and F.T.; data curation, Y.X.; writing—original draft preparation, Y.X.; writing—review and editing, P.Z., Q.H. and M.J.; supervision, P.Z.; project administration, Q.H.; funding acquisition, L.C. and Q.H. All authors have read and agreed to the published version of the manuscript.

Funding

This work was supported by the National Key Research Development Program of China (2017YFD0200300), National Natural Science Foundation of China (NSFC) (No. 31701828), Agricultural Science and Technology Innovation Program (CAAS-ZDRW202008), and Program of New Type Institution of Scientific Research (12ZCZDSY13900).

Data Availability Statement

Data sharing not applicable.

Conflicts of Interest

The authors declare no conflict of interest.

References

  1. Wang, Y.; Guan, W.; Tang, L.; Zhang, W.; Cui, H. Fabrication of novel avermectin nanoemulsion using a polyurethane emulsifier with cleavable disulfide bonds. J. Agric. Food Chem. 2018, 66, 6569–6577. [Google Scholar]
  2. Zhu, F.; Liu, X.; Cao, L.; Cao, C.; Li, F.; Chen, C.; Xu, C.; Huang, Q.; Du, F. Uptake and distribution of fenoxanil-Loaded mesoporous silica nanoparticles in rice plants. Int. J. Mol. Sci. 2018, 19, 2854. [Google Scholar] [CrossRef] [PubMed] [Green Version]
  3. Li, L.; Xi, W.; Su, Q.; Yan, G.; Liu, Y.; Wang, H.; Cao, A. Unexpected size effect: The interplay between different sized nanoparticles in their cellular uptake. Small 2019, 15, 1901687. [Google Scholar] [CrossRef] [PubMed]
  4. Wu, H.; Marhadour, S.; Lei, Z.; Yang, W.; Marivingt-Mounir, C.; Bonnemain, J.; Chollet, J. Vectorization of agrochemicals: Amino acid carriers are more efficient than sugar carriers to translocate phenylpyrrole conjugates in the Ricinus system. Environ. Sci. Pollut. R. 2018, 25, 14336–14349. [Google Scholar] [CrossRef]
  5. Mao, G.L.; Yan, Y.; Chen, Y.; Wang, B.F.; Xu, F.F.; Zhang, Z.X.; Lin, F.; Xu, H.H. Family of Ricinus communis Monosaccharide Transporters and RcSTP1 in Promoting the Uptake of a Glucose-Fipronil Conjugate. J. Agric. Food Chem. 2017, 65, 6169–6178. [Google Scholar] [CrossRef]
  6. Wu, H.; Xu, H.; Marivingt Mounir, C.; Bonnemain, J.L.; Chollet, J.F. Vectorizing agrochemicals: Enhancing bioavailability via carrier-mediated transport. Pest Manag. Sci. 2019, 75, 1507–1516. [Google Scholar] [CrossRef]
  7. Yuan, Y.; Liu, C.; Qian, J.; Wang, J.; Zhang, Y. Size-mediated cytotoxicity and apoptosis of hydroxyapatite nanoparticles in human hepatoma HepG2 cells. Biomaterials 2010, 31, 730–740. [Google Scholar] [CrossRef] [PubMed]
  8. Popat, A.; Liu, J.; Hu, Q.; Kennedy, M.; Peters, B.; Lu, G.Q.M.; Qiao, S.Z. Adsorption and release of biocides with mesoporous silica nanoparticles. Nanoscale 2012, 4, 970–975. [Google Scholar] [CrossRef] [PubMed]
  9. Xia, F.; Fan, W.; Jiang, S.; Ma, Y.; Lu, Y.; Qi, J.; Ahmad, E.; Dong, X.; Zhao, W.; Wu, W. Size-dependent translocation of nanoemulsions via oral delivery. ACS Appl. Mater. Inter. 2017, 9, 21660–21672. [Google Scholar] [CrossRef]
  10. Lu, F.; Wu, S.; Hung, Y.; Mou, C. Size effect on cell uptake in well-suspended, uniform mesoporous silica nanoparticles. Small 2009, 5, 1408–1413. [Google Scholar] [CrossRef] [PubMed]
  11. Cruje, C.; Chithrani, B.D. Integration of peptides for enhanced uptake of PEG ylayed gold nanoparticles. J. Nanosci. Nanotechnol. 2015, 15, 2125–2131. [Google Scholar] [CrossRef]
  12. Khot, L.R.; Sankaran, S.; Maja, J.M.; Ehsani, R.; Schuster, E.W. Applications of nanomaterials in agricultural production and crop protection: A review. Crop Prot. 2012, 35, 64–70. [Google Scholar] [CrossRef]
  13. Xiang, Y.; Han, J.; Zhang, G.; Zhan, F.; Cai, D.; Wu, Z. Efficient synthesis of starch-regulated porous calcium carbonate microspheres as a Carrier for slow-release herbicide. ACS Sustain Chem. Eng. 2018, 6, 3649–3658. [Google Scholar] [CrossRef]
  14. Wang, L.; Lei, L.; Kong, T.; Zhu, P.; Tian, X.; Kang, Z. Self-Assembly of TiO2 nanofiber-based microcapsules by spontaneously evolved multiple emulsions. Langmuir 2018, 34, 8785–8791. [Google Scholar]
  15. Li, Z.; Xu, S.; Wen, L.; Liu, F.; Liu, A.; Wang, Q.; Sun, H.; Yu, W.; Chen, J. Controlled release of avermectin from porous hollow silica nanoparticles: Influence of shell thickness on loading efficiency, UV-shielding property and release. J. Control Release 2006, 111, 81–88. [Google Scholar] [CrossRef] [PubMed]
  16. Trofimov, A.D.; Ivanova, A.A.; Zyuzin, M.V.; Timin, A.S. Porous inorganic carriers based on silica, calcium carbonate and calcium phosphate for controlled/modulated drug delivery: Fresh outlook and future perspectives. Pharmaceutics 2018, 10, 167. [Google Scholar] [CrossRef] [Green Version]
  17. Assadi, Z.; Emtiazi, G.; Zarrabi, A. Hyperbranched polyglycerol coated on copper oxide nanoparticles as a novel core-shell nano-carrier hydrophilic drug delivery model. J. Mol. Liq. 2018, 250, 375–380. [Google Scholar] [CrossRef]
  18. Ziaee, M.; Moharramipour, S.; Mohsenifar, A. MA-chitosan nanogel loaded with Cuminum cyminum essential oil for efficient management of two stored product beetle pests. J. Pest Sci. 2014, 87, 691–699. [Google Scholar] [CrossRef]
  19. Sun, H.; Liu, S.; Zeng, X.; Meng, X.; Zhao, L.; Wan, Y.; Zuo, G. Morphology effect of nano-hydroxyapatite as a drug carrier of methotrexate. J. Mater. Sci.: Mater. Med. 2017, 28, 158. [Google Scholar] [CrossRef]
  20. Shan, Y.; Cao, L.; Xu, C.; Zhao, P.; Cao, C.; Li, F.; Xu, B.; Huang, Q. Sulfonate-functionalized mesoporous silica nanoparticles as carriers for controlled herbicide diquat dibromide release through electrostatic interaction. Int. J. Mol. Sci. 2019, 20, 1330. [Google Scholar] [CrossRef] [Green Version]
  21. Gan, Q.; Dai, D.; Yuan, Y.; Qian, J.; Sha, S.; Shi, J.; Liu, C. Effect of size on the cellular endocytosis and controlled release of mesoporous silica nanoparticles for intracellular delivery. Biomed. Microdevices 2012, 14, 259–270. [Google Scholar] [CrossRef] [PubMed]
  22. Rascol, E.; Pisani, C.; Dorandeu, C.; Nyalosaso, J.; Charnay, C.; Daurat, M.; Silva, A.; Devoisselle, J.; Gaillard, J.; Armengaud, J.; et al. Biosafety of Mesoporous Silica Nanoparticles. Biomimetics 2018, 3, 22. [Google Scholar] [CrossRef] [PubMed] [Green Version]
  23. Jafari, S.; Derakhshankhah, H.; Alaei, L.; Fattahi, A.; Varnamkhasti, B.S.; Saboury, A.A. Mesoporous silica nanoparticles for therapeutic/diagnostic applications. Biomed. Pharmacother. 2019, 109, 1100–1111. [Google Scholar] [CrossRef] [PubMed]
  24. Luo, L.; Liang, Y.; Erichsen, E.S.; Anwander, R. Hierarchical mesoporous organosilica–silica core–shell nanoparticles capable of controlled fungicide release. Chemistry 2018, 24, 7200–7209. [Google Scholar] [CrossRef]
  25. Liang, Y.; Gao, Y.; Wang, W.; Dong, H.; Tang, R.; Yang, J.; Niu, J.; Zhou, Z.; Jiang, N.; Cao, Y.J. Fabrication of smart stimuli-responsive mesoporous organosilica nano-vehicles for targeted pesticide delivery. Hazard. Mater. 2020, 389, 122075. [Google Scholar] [CrossRef]
  26. Chang, F.; Kuang, L.; Huang, C.; Jane, W.; Hung, Y.; Hsing, Y.C.; Mou, C. A simple plant gene delivery system using mesoporous silica nanoparticles as carriers. J. Mater. Chem. B 2013, 1, 5279. [Google Scholar] [CrossRef]
  27. Slomberg, D.L.; Schoenfisch, M.H. Silica nanoparticle phytotoxicity to arabidopsis thaliana. Environ. Sci. Technol. 2012, 46, 10247–10254. [Google Scholar]
  28. Sun, D.; Hussain, H.I.; Yi, Z.; Siegele, R.; Cresswell, T.; Kong, L.; Cahill, D.M. Uptake and cellular distribution, in four plant species, of fluorescently labeled mesoporous silica nanoparticles. Plant Cell Rep. 2014, 33, 1389–1402. [Google Scholar] [CrossRef]
  29. Zhao, P.; Yuan, W.; Xu, C.; Li, F.; Cao, L.; Huang, Q. Enhancement of spirotetramat transfer in cucumber plant using mesoporous silica nanoparticles as carriers. J. Agric. Food Chem. 2018, 66, 11592–11600. [Google Scholar] [CrossRef]
  30. Dietz, K.; Herth, S. Plant nanotoxicology. Trends Plant Sci. 2011, 16, 582–589. [Google Scholar] [CrossRef]
  31. Zhao, X.; Cui, H.; Wang, Y.; Sun, C.; Cui, B.; Zeng, Z. Development Strategies and Prospects of nano-based Smart Pesticide Formulation. J. Agric. Food Chem. 2018, 66, 6504–6512. [Google Scholar] [CrossRef] [PubMed]
  32. Lin, L.; Yu, W.; Pang, Y.; Sun, C.; Meng, Q.; Li, X.; Guo, X. Validation of an LC-MS/MS method for the quantitative determination of a novel fungicide: Pyraoxystrobin in rat plasma and its application to a toxicokinetics study. Anal. Bioanal. Chem. 2014, 406, 5521–5526. [Google Scholar] [CrossRef]
  33. Yang, X.; Liu, H.; Jia, M.; Wang, J.; Wu, J.; Song, J.; Liu, Y. Evaluation of pyraoxystrobin bioconcentration in zebrafish (Danio rerio) using modified QuEChERS extraction. Journal of environmental science and health. J. Environ. Sci. Heath Part B Pesticides Food Contam. Agric. Wastes 2020, 55, 477–483. [Google Scholar] [CrossRef] [PubMed]
  34. Liu, X.; Ye, Q.; Kan, D.; Zhang, Z.; Ding, X. Synthesis of carbon-14 labeled pyraoxystrobin, a novel fungicide. J. Label. Compd. Rad. 2011, 54, 780–782. [Google Scholar] [CrossRef]
  35. Yang, T.; Xu, C.; Liu, X.; Chen, X.; Zhang, J.; Ding, X. Fate of a novel strobilurin fungicide pyraoxystrobin in flooded soil. Environ. Sci. Proc. Imp. 2014, 16, 1495–1500. [Google Scholar] [CrossRef] [PubMed]
  36. Liu, X.; Wu, H.; Hu, T.; Chen, X.; Ding, X. Adsorption and leaching of novel fungicide pyraoxystrobin on soils by 14C tracing method. Environ. Monit. Assess. 2018, 190, 86. [Google Scholar] [CrossRef]
  37. Liu, X.; Chen, X.; Ding, X.; Wu, H. Uptake and distribution characteristics of the novel fungicide pyraoxystrobin in cucumber plants. RSC Adv. 2018, 8, 27152–27156. [Google Scholar] [CrossRef] [Green Version]
  38. Zhao, P.; Cao, L.; Ma, D.; Zhou, Z.; Huang, Q.; Pan, C. Translocation, distribution and degradation of prochloraz-loaded mesoporous silica nanoparticles in cucumber plants. Nanoscale 2018, 10, 1798–1806. [Google Scholar] [CrossRef]
  39. Zhao, P.; Cao, L.; Ma, D.; Zhou, Z.; Huang, Q.; Pan, C. Synthesis of Pyrimethanil-Loaded Mesoporous Silica Nanoparticles and Its Distribution and Dissipation in Cucumber Plants. Molecules 2017, 22, 817. [Google Scholar] [CrossRef]
  40. Ritger, P.L.; Peppas, N.A. A simple equation for description of solute release II. Fickian and anomalous release from swellable devices. J. Control Release 1987, 5, 37–42. [Google Scholar] [CrossRef]
  41. Cavallaro, G.; Lazzara, G.; Lisuzzo, L.; Milioto, S.; Parisi, F. Selective adsorption of oppositely charged PNIPAAM on halloysite surfaces: A route to thermo-responsive nanocarriers. Nanotechnology 2018, 29, 325702. [Google Scholar] [CrossRef] [PubMed]
  42. Guglielmi, M.; Rocher, F.; Legros, S.; Bonnemain, J.; Chollet, J. A non-destructive method for testing two components of the behaviour of soil-applied agricultural chemicals over a long period. Pest Manag. Sci. 2012, 68, 897–905. [Google Scholar] [CrossRef] [PubMed]
  43. Zhang, Z.; He, X.; Zhang, H.; Ma, Y.; Zhang, P.; Ding, Y.; Zhao, Y. Uptake and distribution of ceria nanoparticles in cucumber plants. Metallomics 2011, 3, 816–822. [Google Scholar] [CrossRef]
  44. Yazdimamaghani, M.; Barber, Z.B.; Hadipour Moghaddam, S.P.; Ghandehari, H. Influence of silica nanoparticle density and flow conditions on sedimentation, cell uptake, and cytotoxicity. Mol. Pharmaceut. 2018, 15, 2372–2383. [Google Scholar] [CrossRef]
  45. Chou, C.; Chen, W.; Hung, Y.; Mou, C. Molecular elucidation of biological response to mesoporous silica nanoparticles in vitro and in vivo. ACS Appl. Mater. Inter. 2017, 9, 22235–22251. [Google Scholar] [CrossRef] [PubMed]
Figure 1. Chemical structure of pyraoxystrobin.
Applsci 11 00575 g001
Figure 2. TEM of samples M15 (a), M100 (b), M200 (c), Pyr@M15 (d), Pyr@M100 (e), and Pyr@M200 (f).
Applsci 11 00575 g002
Figure 3. FTIR spectra of carbon quantum dots–MSN (a) and Pyr@M (b).
Applsci 11 00575 g003
Figure 4. Nitrogen adsorption−desorption isotherms (a) and pore size distribution (b) of nanoparticles.
Applsci 11 00575 g004
Figure 5. The release curves of Pyr (a) and fitting plots using the Ritger–Peppas equation (b). Error bars correspond to standard errors of triplicate measurements.
Applsci 11 00575 g005
Figure 6. LSM images of cucumber root, stem, and leaf, 3 d after carbon quantum dots-MSN treatment. Bar scales: 50 μm.
Applsci 11 00575 g006
Figure 7. Concentrations of Pyr in cucumber root (a) and leaves (b) in certain intervals.
Applsci 11 00575 g007
Figure 8. Translocation rate of Pyr from cucumber root to stem and leaf in certain intervals. p < 0.05 compared between different treatments.
Applsci 11 00575 g008
Table 1. Raw material consumption of reactants and reaction temperature for synthesis of carbon quantum dots-MSN with different sizes.
SampleCTAB
(g)
NaOH
(mL)
Water
(mL)
TSD
(mL)
Temperature
(°C)
Particle Size
(nm)
M151.215760.848015
M1001.24.25760.8480100
M2001.24.22880.8480200
Table 2. Mesoporous Structure Characterization of Nanoparticles.
NanoparticleSpecific Surface Area (m2/g)Pore Volume (cm3/g)Pore Diameter (nm)
M15342.090.0911.487
M100900.010.2222.743
M200810.471.422.524
Pyr@M1563.120.006361.35
Pyr@M100452.050.04151.879
Pyr@M200182.900.1202.117
Table 3. Results of the loading content of Pyr into carbon quantum dots-MSN with different sizes.
Carrier MaterialSolventMass Ratio aLoading Content (%) b
M100Acetonitrile2:14.25 ± 0.68
M100Methanol2:15.86 ± 1.66
M100Dichloromethane2:118.86 ± 0.61
M15Dichloromethane2:18.8 ± 0.07
M100Dichloromethane2:118.86 ± 0.61
M200Dichloromethane2:123.06 ± 0.43
M15Dichloromethane5:123.43 ± 0.42
M100Dichloromethane3:122.63 ± 0.23
M200Dichloromethane2:123.06 ± 0.43
a Mass ratio of Pyr to carbon quantum dots-MSN. b Loading content values are mean ± SD of the three replicates.
Table 4. Kinetic parameters obtained from the fitting of the release data using the Ritger–Peppas equation.
Samplek/min−nnR2
Pyr1.40235 ± 0.0990.56322 ± 0.0130.98953
Pyr@M151.94883 ± 0.1740.59100 ± 0.0160.98659
Pyr@M1004.11986 ± 0.3310.46659 ± 0.0150.98049
Pyr@M2002.60443 ± 0.1810.52989 ± 0.0130.98871
Table 5. Average recoveries, RSD (n = 5), LOD linear equation, and determination coefficients (R2) of Pyr in leaves and roots.
SampleFortified Level
(mg·kg−1)
Average Recoveries
(%)
RSD
(%)
LOD
(μg·kg−1)
Linear EquationR2
Leaf0.01740.540.1Y = 153,971,544 x + 1,292,5420.9997
0.1754.16
1817.36
root0.01975.460.1Y = 155,065,913 x + 16,332,0630.9996
0.1905.62
1872.34
Publisher’s Note: MDPI stays neutral with regard to jurisdictional claims in published maps and institutional affiliations.