1. Introduction
Diabetes is an incurable chronic disease that occurs either when the pancreas is no longer able to produce insulin, or when the body is unable to utilize insulin properly [
1,
2]. This results in poor regulation of blood glucose level, which can lead to severe health complications such as chronic heart and kidney disease if blood glucose levels are not monitored carefully. According to the IDF (International Diabetes Federation) Diabetes Atlas [
3] published in 2019, 463 million people in the 20–79 demographic have diabetes and is projected to reach 700 million by 2045. More than 4.2 million people died due to diabetes-related disorders in 2019.
The conventional approach to glucose level monitoring requires several apparatuses such as a glucometer, a one-time test strip, and a single-use lancet or lancing device to draw blood [
4]. It also requires alcohol pads, gloves, and a band-aid to reduce the risk of infection for the patient. It is an uncomfortable process and one that people with diabetes need to use to monitor their blood glucose level regularly.
There is a demand for wearable, noninvasive, and smart health monitoring systems [
5,
6]. Previously, there have been studies conducted on noninvasive [
7] or minimally invasive wearable devices based on different types of technologies for blood glucose level monitoring [
8]. Some of the researchers used sensors built using carbon nanotubes [
9,
10], fluorescence [
11], and plasmonic materials [
12] to determine the glucose level. These techniques had some issues such as long calibration processes, size, and susceptibility to autofluorescence.
Several electrical techniques have been proposed for blood glucose level monitoring. Shaker, G. et al. experimented with a millimeter-wave radar system to track glucose level changes [
13]. Similarly, Hanna, J. et al. experimented with glucose monitoring using electromagnetic devices in a noninvasive manner [
14]. Other researchers utilized changes in bioimpedance [
15] and ultrasound signal [
16,
17] to determine a subject’s blood glucose level. In general, electrical techniques have room for improvement due to poor selectivity, temperature sensitivity, and skin irritation. A handful of previous studies have explored the potential of optical techniques in tracking changes in blood glucose level. Phan, Quoc-Hung [
18] studied a polarimetric optical measurement method for noninvasive glucose determination. Optical Coherence Tomography (OCT) [
19], near-infrared spectroscopy [
20], and mid-infrared (MIR) spectroscopy [
21] have also been utilized under laboratory conditions to gauge changes in blood glucose level in diabetic subjects. Unfortunately, optical techniques suffer from a significant lag time of up to 30 min as well as high temperature sensitivity. It is noteworthy that these proposed techniques require intricately organized and expensive laboratory equipment, making it unlikely for them to be used for daily measurement of blood glucose by millions of diabetics without significant reduction in price and complexity. Sensor-based noninvasive techniques have also been proposed for this purpose. Studies have shown the possibility of using GSR (Galvanic Skin Response) sensors [
22], saliva [
23,
24], tear-based sensors [
25], and sweat-based sensors [
26] in order to measure blood glucose level. These techniques are generally inexpensive and require biological fluid samples other than blood to be collected, thereby reducing the invasiveness of the procedure and the subject’s discomfort.
Photoplethysmography (PPG) is a low-cost, noninvasive technique that measures the volumetric change of blood in the arteries. Previously researchers have investigated the estimation of heart rate using PPG signals acquired by various methods such as endocavitary sensors [
27] and pressure sensors [
28]. Some researchers determined the glucose level using smartphone-based on the colorimetric and electrochemical methods [
29]—this required an external apparatus to collect the sample before analyzing the sample using a smartphone. We also previously demonstrated that PPG could be a useful tool for blood glucose estimation [
30].
A preliminary study conducted by Zhang, G. et al. proposed a subspace KNN (K–Nearest Neighbors) based method for classifying between diabetic/nondiabetic patients by using a PPG signal acquired from a single smartphone [
31]. Using a binary classifier, this study constructed two classes in the (70 mg/dL–130 mg/dL) blood glucose range. However, the reported approach achieved a classification accuracy of 86.2% and used a Butterworth filter for denoising motion artefacts.
This study outlines the initial development steps towards a new reliable technique for blood glucose level estimation using a smartphone camera. A smartphone camera is used to record multiple videos from the same position of the fingertips for fifty-two subjects. A Gaussian filter is applied to denoise the raw PPG waveform generated, and the Asymmetric Least Squares (ALSs) method is used to remove baseline wander. Attributes such as systolic and diastolic peaks, the peak to peak time interval (DelT), first derivative peaks, and second derivative peaks are extracted from the denoised signal. These extracted features are subsequently fed into four statistical learning approaches—Principal Component Regression (PCR), Partial Least Squares Regression (PLS), Support Vector Regression (SVR), and Random Forest Regression (RFR) for the prediction of glucose level in blood. The paper focuses on data acquisition techniques, noise removals which are a big challenge in smartphone-based data acquisition systems, and the development of algorithms to provide increased acquisition capabilities, comforts, and flexibilities in measurements compared to the existing systems.
2. Experiment Details
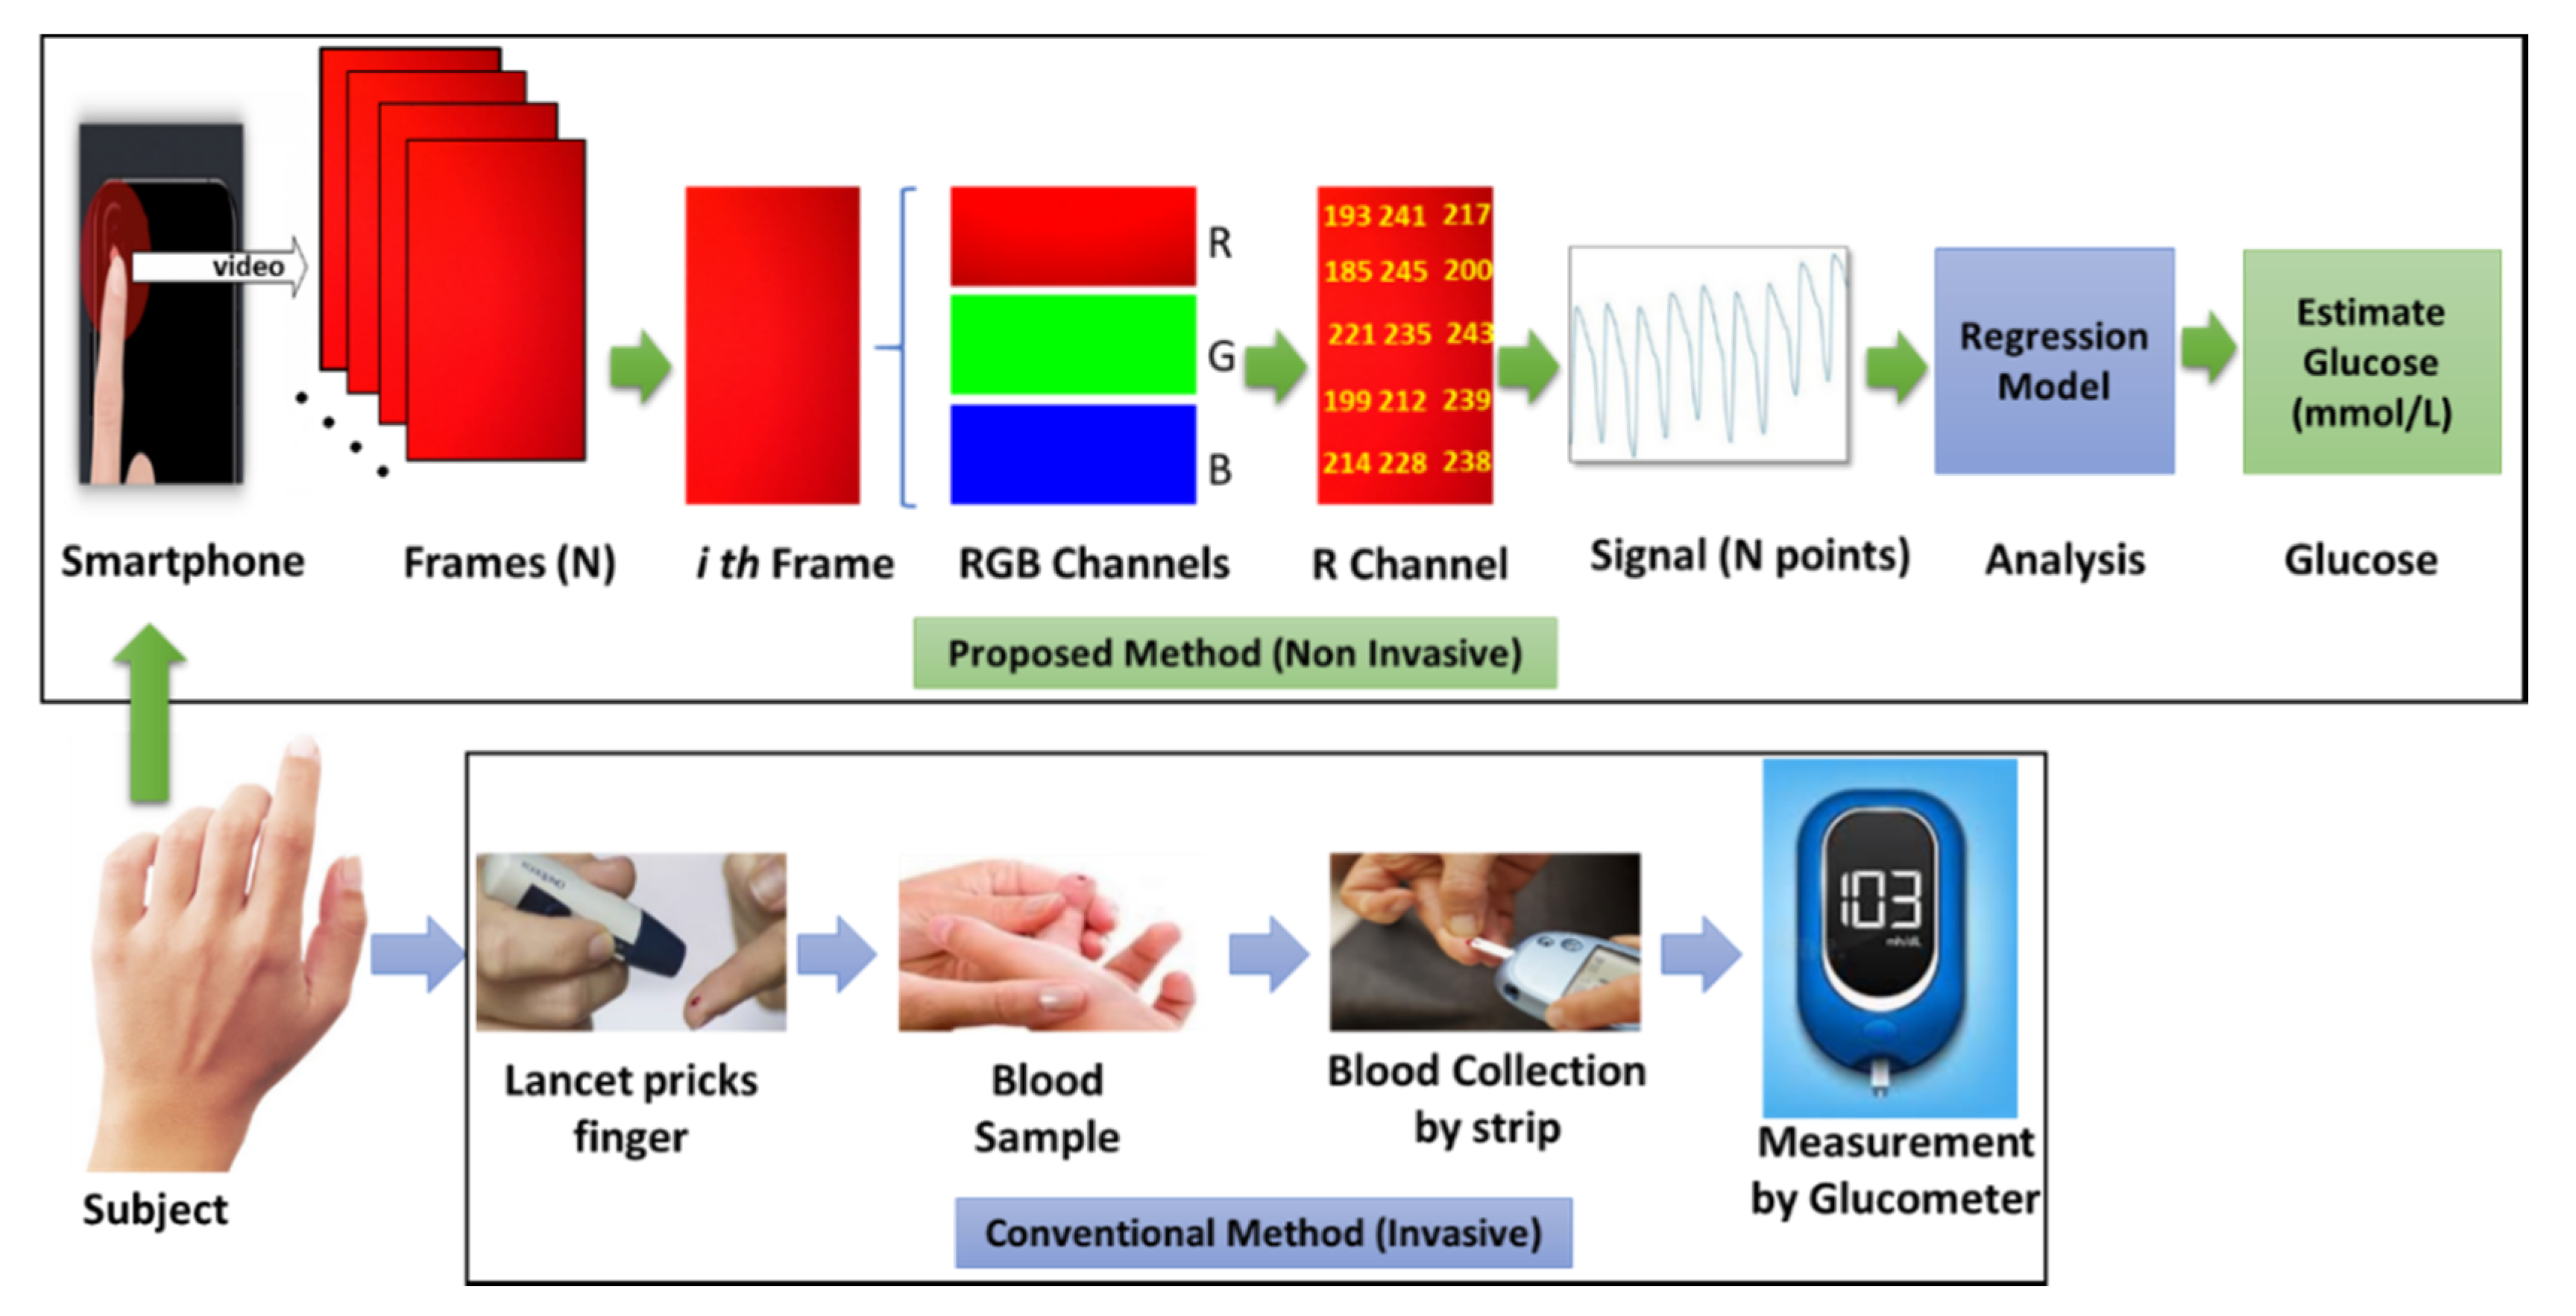
The complete experimental procedure of noninvasive sensing and a comparison with the conventional method of glucose level prediction have been depicted in
Figure 1. With the proposed noninvasive technique, a commercial smartphone camera can be used for the recording of a short video (20 s–50 s) of the subject’s fingertip, which is then converted into frames containing RGB channel information of different wavelength. Red light has a longer wavelength than green or blue, which consequently allows it to penetrate deeper into tissue. Consequently, data from the red channel can be used for generating the respective PPG signal from the video frames. Regression models can then be trained with the acquired smartphone PPG signals, and corresponding glucose levels are acquired with a commercially available glucometer.
Fifty-two subjects aged between 17 and 61 years, with a male to female ratio of 75:25, and with blood glucose levels ranging between 68 and 211 mg/dL participated in this experiment. The participants were as adequately briefed about the procedure before it began. A minimum of three trials were taken from each subject, resulting in one-hundred and ninety-one trials altogether. Each video recorded during the trials was 60 s long. All the subjects provided their informed consent paper and proper hygiene was maintained during the collection of reference values using a commercially approved glucometer (Accu-Check Active) which has an accuracy that meets the DIN EN ISO 15197:2013 requirements of a measuring interval that is 10–600 mg/dL. The subjects’ fingers and smartphone camera lenses were also cleaned using alcohol wipes before acquiring video as part of this study.
2.1. Data Acquisition with Smartphone
The camera quality of commercially available smartphones has improved a lot over the last decade and offers excellent potential utility as a biomedical apparatus for data acquisition [
32]. Nearly all smartphones can be used for the capture of PPG signals. However, the quality of the acquired signal can vary widely depending on the resolution and number of frames recorded by the camera per second. It is possible to extract PPG signals from a subject’s fingertips or earlobe. In our study, the fingertip was chosen for data acquisition due to the convenience and comfort in the process for the subject. Olive et al. have previously shown earlobe pulse oximetry to be less reliable than fingertip pulse oximetry [
33]. During the recording, the subject was asked to remain relatively still and comfortably place their index finger on the smartphone camera. Video data were subsequently collected for 60 s, with the participant’s right index finger placed on the horizontal camera array and the LED (Light Emitting Diode) flash. The duration of 60 s allowed for a greater likelihood of obtaining acceptable PPG data, and allowed enough time in the beginning and the end of the segment for motion artifacts that are common with biomedical signal measurements. A maximum of five trials were collected from each participant. Each video was captured using the default camera application of the smartphone at 30 frames per second (fps) with a resolution of 1280 × 720 pixels.
To enhance the generalizability of the regression models trained, and to test the effectiveness of our denoising protocol, we initially shortlisted four smartphones to collect data in this study. Three of these phones were on Android platforms, whereas the fourth was on iOS. The four phones had different camera software running and the built-in cameras and optical setups of each offer a wide range of specification for data collection. After a preliminary study on the performance of each phone, the data collection was narrowed down to two phones—one based on an iOS platform and a second on Android.
2.1.1. Acquisition with iPhone
In the iOS category, an iPhone 7 Plus (Made by Apple Inc, San Francisco, CA, USA) phone was used for noninvasive data collection. The imaging unit in the device consists of a WLED (White LED) as the illumination source next to a 12-megapixel camera at a center-to-center separation of around 5 mm. The phone supports color video recording at about 30 fps up to a resolution of 3840 × 2160 pixels. For this study, the fingertip was recorded at 30 fps at a resolution of 720 pixels. This did not reduce signal quality as compared to that of 1080 pixels or 4K but took up significantly less phone memory and data transfer time.
2.1.2. Acquisition with Android Phone
As for Android-based platform, the choice for the smartphone is more complex. Android devices come in a wide range of hardware specifications regarding the built-in camera and the optical setup. Therefore, the quality of acquired data can vary significantly in different models constructed by different manufacturers. We therefore conducted a preliminary study (
Supplementary Material Figure S1) to evaluate the performance of data acquisition on three smartphones with varying price ranges and camera specifications.
For the preliminary study, 3 trials were completed from five subjects using a Xiaomi Redmi Note 5 Pro (Xiaomi, Beijing, China), Samsung Galaxy Note 8 (Made by Samsung, San Jose, CA, USA), and OnePlus 6T (Made by OnePlus, Guangdong, China). The camera sensors on the Redmi Note 5 Pro and the Galaxy Note 8 are manufactured by Samsung, whereas the OnePlus 6T has a camera sensor produced by Sony IMX. All of them have a dual camera setup with an illumination source in the form of a WLED flash placed next to the cameras. For this portion of the study, the video data were recorded at 30 fps at a resolution of 1920 × 1080 pixels. Detailed specification for each of the phones is provided in
Table 1. The Aperture column of
Table 1 denotes the focal length of the smartphone camera.
The quality of the PPG signal acquired from the same subject using three different smartphones is shown in
Figure 2. In the first two signals, considerably more baseline variation can be observed in contrast with the third signal. To further evaluate the performance of the acquired signals by these phones, we attempted to extract the features from the acquired signals. For this, the signals were first preprocessed (
Supplementary Material Figure S2) to remove high-frequency noise and baseline drift. Then, peak analysis was performed on the preprocessed PPG (
Supplementary Material Figure S3)—the 1st derivative and 2nd derivative (
Supplementary Material Figure S4) of the signals. From
Supplementary Material Table S1, it can be seen the model was able to detect the 2nd derivative peak with very few misses and false positives across all the subjects. We performed peak detection and observed the results as shown in
Figure 2. With 5 different subjects and multiple trials with the three candidate smartphones, we could see that the Xiaomi was outperformed by the others in terms of accuracy.
Even though the acquisition quality of Samsung Galaxy Note 8 and OnePlus 6T are comparable, Samsung Galaxy is more expensive with very similar specifications. Consequently, OnePlus 6T has been chosen as the desired Android platform for data acquisition for the study of glucose level detection. The further details on this study are available in the
Supplementary resources.
2.1.3. Channel Selection
The video recorded from the subjects was stored onto the phone’s memory in MPEG-4 (Moving Picture Experts Group) format. As discussed earlier, acquired smartphone videos were first converted into RGB frames containing information from three color channels (red, green, and blue) with varying wavelengths. Channel selection for obtaining a good quality PPG has been a challenge for researchers and therefore extensively studied in the past [
34]. Blood perfusion variations depend on the wavelength of light since radiation of different wavelength penetrates and reaches vascular bed to varying depths in skin layers. Red light, which has a wavelength of 620 nm, reaches deeper (several centimeters) blood vessels in contrast to blue light (432 nm), which penetrates less than 1mm in deep. The red channel was often a default choice [
35,
36]. On the other hand, the authors of [
34,
37] claimed that the green color signal provided the best signal amplitude values for smartphones and considered this as more suitable than red and blue. Therefore, the authors of [
34,
38] conducted several experiments and compared the PPG signal strength in the three color bands, with and without a flashlight to obtain good quality PPG. [
39] Grimaldi reported that the distribution of the pixels in the green channel is not uniform for different smartphone models. Bolkhovsky [
40] suggested different channels for different phones. All these experiments prove that the selection of channel may vary based on several factors that include phone model due to camera characteristics, acquisition techniques (with or without LED), and region of interest.
In the proposed system, we initially extracted a PPG signal from all three channels. In most cases, PPG extracted from the red channel was more prominent and less noisy than that of the green and blue channels, as seen in
Figure 3.
2.1.4. Conversion into PPG Waveform
In a given frame, each pixel has slightly varying values. We averaged the red channel values of an entire frame to obtain one sample point of the respective PPG waveform. After extracting the sampling points from all the frames of recorded videos and ordering them in an array, complete PPG waveforms could be generated. The computation was performed using a custom-written MATLAB program. Regions of Interest (ROIs), where applicable, were removed from the frames before conversion.
2.1.5. Signal Quality
It was identified through experimental investigations that the best way to collect video data without much motion is to let the subject hold the phone on their hand and then place their fingertip on the camera sensor. This introduces fewer motion interferences as people naturally hold a phone in this way. Other approaches were also attenuated that caused many movements of the finger from the subject during data collection. A little distortion may result in scattered plots and acquired signals may suffer from severe baseline variations. An example of such an event is shown in
Figure 4. Videos were also captured with the flash on and off. PPG signals obtained with a flash were much cleaner than without flash, and the red channel yielded the best overall output (
Supplementary Material Figure S5).
Even after careful considerations about the type of camera to be used and orientation of the placement of the fingertip, the acquired signals had certain varieties. This is evident in
Figure 4, which provides three sample signals collected from different subjects. It can be seen that one of them is quite clean, another has few baseline variations, and the last one contains high-frequency noises and baseline variations. The accuracy of PPG signal is highly influenced by the motion artifacts resulting in inaccuracy in calculation of vital features. These motion artifacts, baseline wander, and high-frequency noise are due to the invariably interference of the contact between the smartphone camera and the finger, the voluntary or involuntary subject movement that includes respiration and extrusion between the finger and the smartphone camera. Therefore, it is crucial to develop a reliable series of preprocessing steps to enhance uniformity and reliability of PPG signal acquisitions.
2.2. Invasive Data Acquisition Methodology
During the study, actual blood sugar data were simultaneously collected as a reference from the subject invasively using a commercially available medical standard glucometer. The meter can measure the sugar level from a small drop (1–2 µL) of blood sample collected from the fingertip of the subject. It can work in a range of 10–600 mg/dL. This technique also requires a one-time test strip and single-use safety lancets in addition to the meter. At first, the subject’s hand was washed using a one-time hand sanitizer and alcohol solution on the finger from which the blood sample was taken. Then, a test strip was inserted into the glucometer to prepare the device for measuring the glucose level. The blood sample was collected by pricking the side of any finger using a lancet. Then, the pricked finger was touched and held on the edge of the test strip to transfer the blood drop from the finger to the test strip. The pricked finger was treated with a band-aid. The glucometer usually takes 5–8 s to process the samples and displays the glucose level in mg/dL on the screen. At least one trial was collected from each subject to acquire the reference value.
3. Methodology
The proposed approach for the noninvasive estimation of blood glucose level using a smartphone video has been explained through a flowchart in
Figure 5. Video data were first obtained from the subjects’ fingertips which were then converted into the respective PPG waveform. This signal contains noise and motion artefact, which were cleaned in the preprocessing steps. Relevant features were extracted from the preprocessed signals. These features were then fed into a regression model. The regression model was trained using extracted features and reference glucose values, collected invasively using a commercially available glucometer. Then, the trained model was used to estimate the glucose level of an unknown sample. The unknown samples used for the testing purpose followed the same preprocessing and feature extraction techniques as the training phase. The performance of the model was evaluated by calculating the Standard Error of Prediction (SEP), measured in mg/dL.
3.1. PPG Signal Preprocessing
3.1.1. Gaussian Filter
Signal cleaning can be completed using a variety of different filters. In our work, a Gaussian filter was used for high-frequency noise removal. A Gaussian filter [
41] is a nonuniform lowpass filter, and consequently is a popular choice among the general-purpose filters for the removal of the high-frequency components of a PPG signal. This filter performs remarkably well as a bandpass filter in the frequency domain when it is tuned by the values of the mean center frequency and standard deviation. In our work, a Gaussian filter was used for noise removal, as shown in Equation (1) below:
In Equation (1), the standard deviation can be adjusted by determining the degree of smoothing. The function performed the best for smoothing the PPG signal when the value of the center frequency was set to
and the standard deviation was set to
. A sample PPG signal with high-frequency noises which was cleaned by applying the Gaussian filter is given in
Supplementary Material Figure S6.
3.1.2. Asymmetric Least Squares
ALS is a useful baseline correction technique [
42]. Motion interferences were removed by the help of ALS, which is useful in correcting data with relatively narrow peaks. ALS is useful in making the systolic and diastolic peaks more prominent, which are crucial attributes for feature extraction. The baseline correction through ALS improved the overall signal quality as the fluctuations between peaks were decreased.
However, some high-frequency noise could still be observed in signals processed through ALS, as seen in
Supplementary Material Figure S7. ALS was followed by a smoothing process applied through the Gaussian filter on the signal to remove existing high-frequency noise. A preprocessing model with ALS as a first stage and Gaussian filter as the second stage significantly improves the quality of the acquired PPG signals. This can be seen in
Figure 6, which shows a raw PPG signal cleaned with Gaussian filter and corrected using ALS. All the signals were normalized from 0 to 1 F.
3.2. Feature Extraction
After applying preprocessing steps to the PPG signals, certain features were extracted from the signals. Multiple feature vectors were created through different combination of these features, which were then used in training the regression models. A feature could be any point in the signal or a multitude of information can be combined to make one feature. For this study, we extracted the following features from the PPG signal: systolic peaks, diastolic peaks, (DelT), first derivative peaks, and second derivative peaks.
3.2.1. Systolic and Diastolic Features
The direct pressure wave travelling from the left ventricle to the periphery of the body represents the systolic peak. On the other hand, the reflections of the pressure wave by arteries of the lower body represent the diastolic peak. Each cycle of the PPG signal contains one systolic and one diastolic peak as seen in
Figure 7a. These peak locations were extracted as features of the PPG signal.
DelT refers to the time separation between systolic and diastolic peaks. It was computed from each pair of the systolic–diastolic peaks of the signal. DelT found from the time difference between the systolic and diastolic peak in each cycle of the preprocessed PPG signal were stored in an array. The systolic, diastolic and DelT features are presented in a sample PPG signal in
Figure 7a.
3.2.2. First Derivative Features
The first derivative usually refers to the instantaneous rate of change. It indicates the function direction, whether the function is increasing or decreasing and how fast it increases or decreases. The number of peaks (features) in the PPG signal was increasing after the first derivative since PPG is a periodic function. To determine the first derivative of the PPG signal, a two-point central difference method was used as shown in Equation (2) below:
here
is coming from the existing preprocessed array whereas
is stored in a new array. Since the first derivative signals also had negative peaks, the signal was processed further before extracting features from the derivative signal. This makes the signal more prominent, and features could be extracted easily from it. A derivate of a sample PPG signal is shown in
Figure 7b where the extracted features have been marked.
3.2.3. 2nd Derivative Features
Similar to the first derivative, the second derivative is usually a derivative of the slope. It also increased the peaks (features) of the signal that is more than the first derivative. A three-point central difference method was used to calculate the second derivative, as shown in Equation (3):
here, the same as before,
a(
j) represents the points in the existing preprocessed array and d is the newly calculated second derivative of that array. The second derivate of a sample PPG signal is shown in
Figure 7c where the extracted features have also been marked. The figure shows how the first and second derivative enhances the peaks of a PPG signal.
3.3. Regression Analysis
To estimate the glucose level, regression analysis was performed on the PPG signals acquired through a smartphone camera and their references. A different regression model was trained on raw signals, preprocessed signals, and the signal features that were extracted from the preprocessed signals to evaluate and compare the performance in noninvasive quantitative estimation.
Regression techniques such as CLS (Classical Least Squares), PCA (Principal Component Analysis), PCR and PLS have been studied in the past for quantitative analysis. Both PLS and PCR have widely been used in chemometrics as multivariate calibration methods, and these methods can be applied when that dataset has correlated predictor variables [
40]. Both regression methods create new predictor variables (components) as linear combinations of the original predictor variables. PLS creates these components while considering the observed response values. On the other hand, PCR creates components without considering the response values at all. Both regression methods have reliable predictive power. PCR was chosen for this work due to its reported ability to predict glucose levels from NIR (Near Infrared) spectra with 94–95% accuracy [
20].
Additionally, models were trained using SVR and RFR. SVR is a modification to the commonly used classification algorithm called Support Vector Machine (SVM). While SVM is primarily used in classification problems with discrete finite labels, SVR can be used to predict continuous variables such as blood glucose level. In SVR, instead of trying to minimize the error outright as with traditional regression techniques, hyperplanes are constructed to fit the error observed within a small threshold of
ε (epsilon). Previous studies have used support vector-based techniques on PPG data to predict other continuous biological variables such as blood pressure estimation [
43].
Finally, ensemble learning was used in the form of RFR—a technique based on using several decision trees to predict a continuous value. Classical Decision Tree Regression (DTR) involves gradually developing a decision tree from smaller subsets of the training data and can work reasonably well in mapping nonlinear functions. Outputs from several decision trees are averaged together to provide an ensemble estimate of the predicted value. Other studies have demonstrated the efficacy of RFR in the prediction of biological variables from ECG or PPG data, often outperforming other regression techniques [
44].
The following sections discuss the experiment performed on each of these learning methods in detail. For the purpose of clarity in discussion, we refer to PLS and PCR as statistical learning, and refer to SVR and RFR as machine learning, in order to reflect the commonly used terminology for each technique.
5. Discussion
In this study, both statistical learning (PCR and PLS) and machine learning (SVR and RFR) models were built using various approaches to observe and compare their performances to SEP. At first the dataset was split into 75:25 ratios for model building an independent test set. A minimum of three PPG signals were acquired from each human subject. The data were split into training and test sets randomly without any prior stratification. This experiment was useful for identifying the dominating features and some of the key model parameters in prediction of glucose with the lowest error. Statistical learning methods performed well overall and first derivative and derivative features dominated in models built with both statistical and machine learning methods.
There was an around 8.5 mg/dL reduction in SEP in the subject wise rigorous testing. The key observation here is that the models that performed well in the earlier experiment maintained good performances in subject wise testing too. PCR and PLS models built with first derivative characteristics points performed well in both types of experiments. The SEPs achieved with these models were comparatively lower than the others. Furthermore, the lowest SEP for these models were recorded for the same no. of principal components. This shows the possibility of using the first experiment for the selection of dominating features, optimum model, and key model parameters which can then be used for real tests.
In this study, PCR- and PLS-based models generally outperformed the models based on SVR and RFR, as seen in
Figure 13. This could be attributed to the limited dataset used in the study. Zhang, G. et al. used PPG signals acquired from smartphones for the classification of the glucose level. Their model, with an accuracy of over 80%, can predict one of the three diabetic status—
normal,
borderline, and
warning of a subject. However, knowing the quantitative information of the actual glucose level is more important than knowing the diabetic status. We have demonstrated that our model can solve that problem by predicting the actual glucose level with an error of less than 20 mg/L. First derivative and second derivative characteristic points were the dominating features with the machine learning models. SVR based models performed comparatively well in prediction in both experiments, whereas RFR models performed poorly in both the experiments.
Since most of the glucose levels in the dataset were in the range of 70–150 mg/dL, the efficacy of the proposed model is limited to prediction of glucose level within the mentioned range. We anticipate an improvement in the models with an increase in the amount and variety in the data in the near future. Robustness, platform independency tests, and user side app development for instant analysis will be performed in the near future.
6. Conclusions
Here, we have investigated a noninvasive blood glucose estimation technique using only fingertip video acquired through a commercially available smartphone camera. Commercially available smartphones have been used to acquire video data which have been converted into PPG waveform. A computational model comprised of signal processing techniques used for cleaning the data and extracting the features and regression models trained with the features for the quantitative estimation of blood glucose has also been presented. Smartphone-based data acquisition system and disease diagnosis bring significant challenges with motion artifacts and noises. This work, therefore, pays special attention to the data acquisition techniques, and the development of algorithms to clean these artifacts. Numerous experiments were conducted with different acquisition techniques to identify a suitable method and duration of data acquisition. The models have been optimized by applying four regression algorithms along with different features. A PLS-based model could predict glucose with a SEP as low as 17.71 mg/dL, which is quite comparable to the overall lowest SEP achieved by PLS, 17.02 mg/dL. The experimental results confirm the usefulness of the first development steps towards a smartphone-based novel noninvasive estimation of blood glucose. Additional experiments are planned for the testing of robustness, platform independency, and, finally, implementing it in user side app for instant measurement. We believe that the proposed noninvasive technique has importance to the community as the system uses a much more natural and comfortable method of data acquisition compared to the traditional methods, can predict glucose value with high accuracy, and has the potential to acquire and deliver the glucose level information through only a smartphone that is now available to most people.


