1. Introduction
The headlamp is an important device in the vehicles. A well-designed headlamp system can provide safe and comfortable driving conditions for the driver at night or in bad weather. With the recent developments in semiconductor technology, light emitting diodes (LEDs) have the potential to be used as a light source for the front lighting systems of automobiles. Since 2007, some premium vehicles have begun using LED headlamps [
1]. An LED headlamp can be configured to a small size, thereby minimizing the space occupied by the headlamp and consequently allowing stylish vehicle design. In addition, LED headlamps have longer lifetimes and better energy efficiency than conventional headlamps [
2]. Recently, a headlamp using laser diode as a light source has been developed [
3,
4,
5]. Laser diode-based headlamps offer most of the advantages of LED-based headlamps and are expected to be smaller than the LED-based headlights. Therefore, a small headlamp using laser diode can revolutionize the exterior design of a vehicle [
6]. Another advantage of laser diode-based headlamps is their luminous efficiency. The luminous efficiency of a typical LED lighting can reach 100 lm/W, whereas the laser diode efficiency can reach 170 lm/W [
7]. In addition, laser diode-based headlamps have a lighting distance that is more than twice that of LED-based headlamps. Therefore, laser diode-based headlamps offer many advantages, motivating many automobile manufacturers to develop laser diode-based headlamps. In September 2013, BMW officially announced mass production of the i8 model with a new type of laser-based headlamp. Subsequently, BMW will apply laser-based headlamps to other models [
8,
9].
Vehicle headlamps were developed to improve the safety of the driver on the road. The adaptive front lighting system, which enables cornering lights, has been known for nearly a decade but has only been available since 2006. The matrix headlamp system developed by Audi is a technology that illuminates by controlling a wide range of lights at low driving speeds. In addition, this technology narrows the lighting area when driving at high speeds and increases the lighting intensity such that it can illuminate farther away [
10]. In addition, when the adaptive driving beam (ADB) function is applied, a high beam is switched to a low beam or turned off by recognizing oncoming traffic and preceding traffic using a camera integrated in the vehicle, thereby preventing glare from other drivers. The ADB function can be implemented in an LED-based headlamp by organizing the headlamps via arranging 50 to 100 LEDs that can be individually controlled to individually process-specific parts of the light distribution. As this type of LED-based headlamp uses many LEDs, more power sources and larger heat-sinks are required. In addition, the spatial resolution of the area that illuminates the headlamp is limited only by the number of LEDs. Therefore, a pixelated system was proposed to overcome this disadvantage [
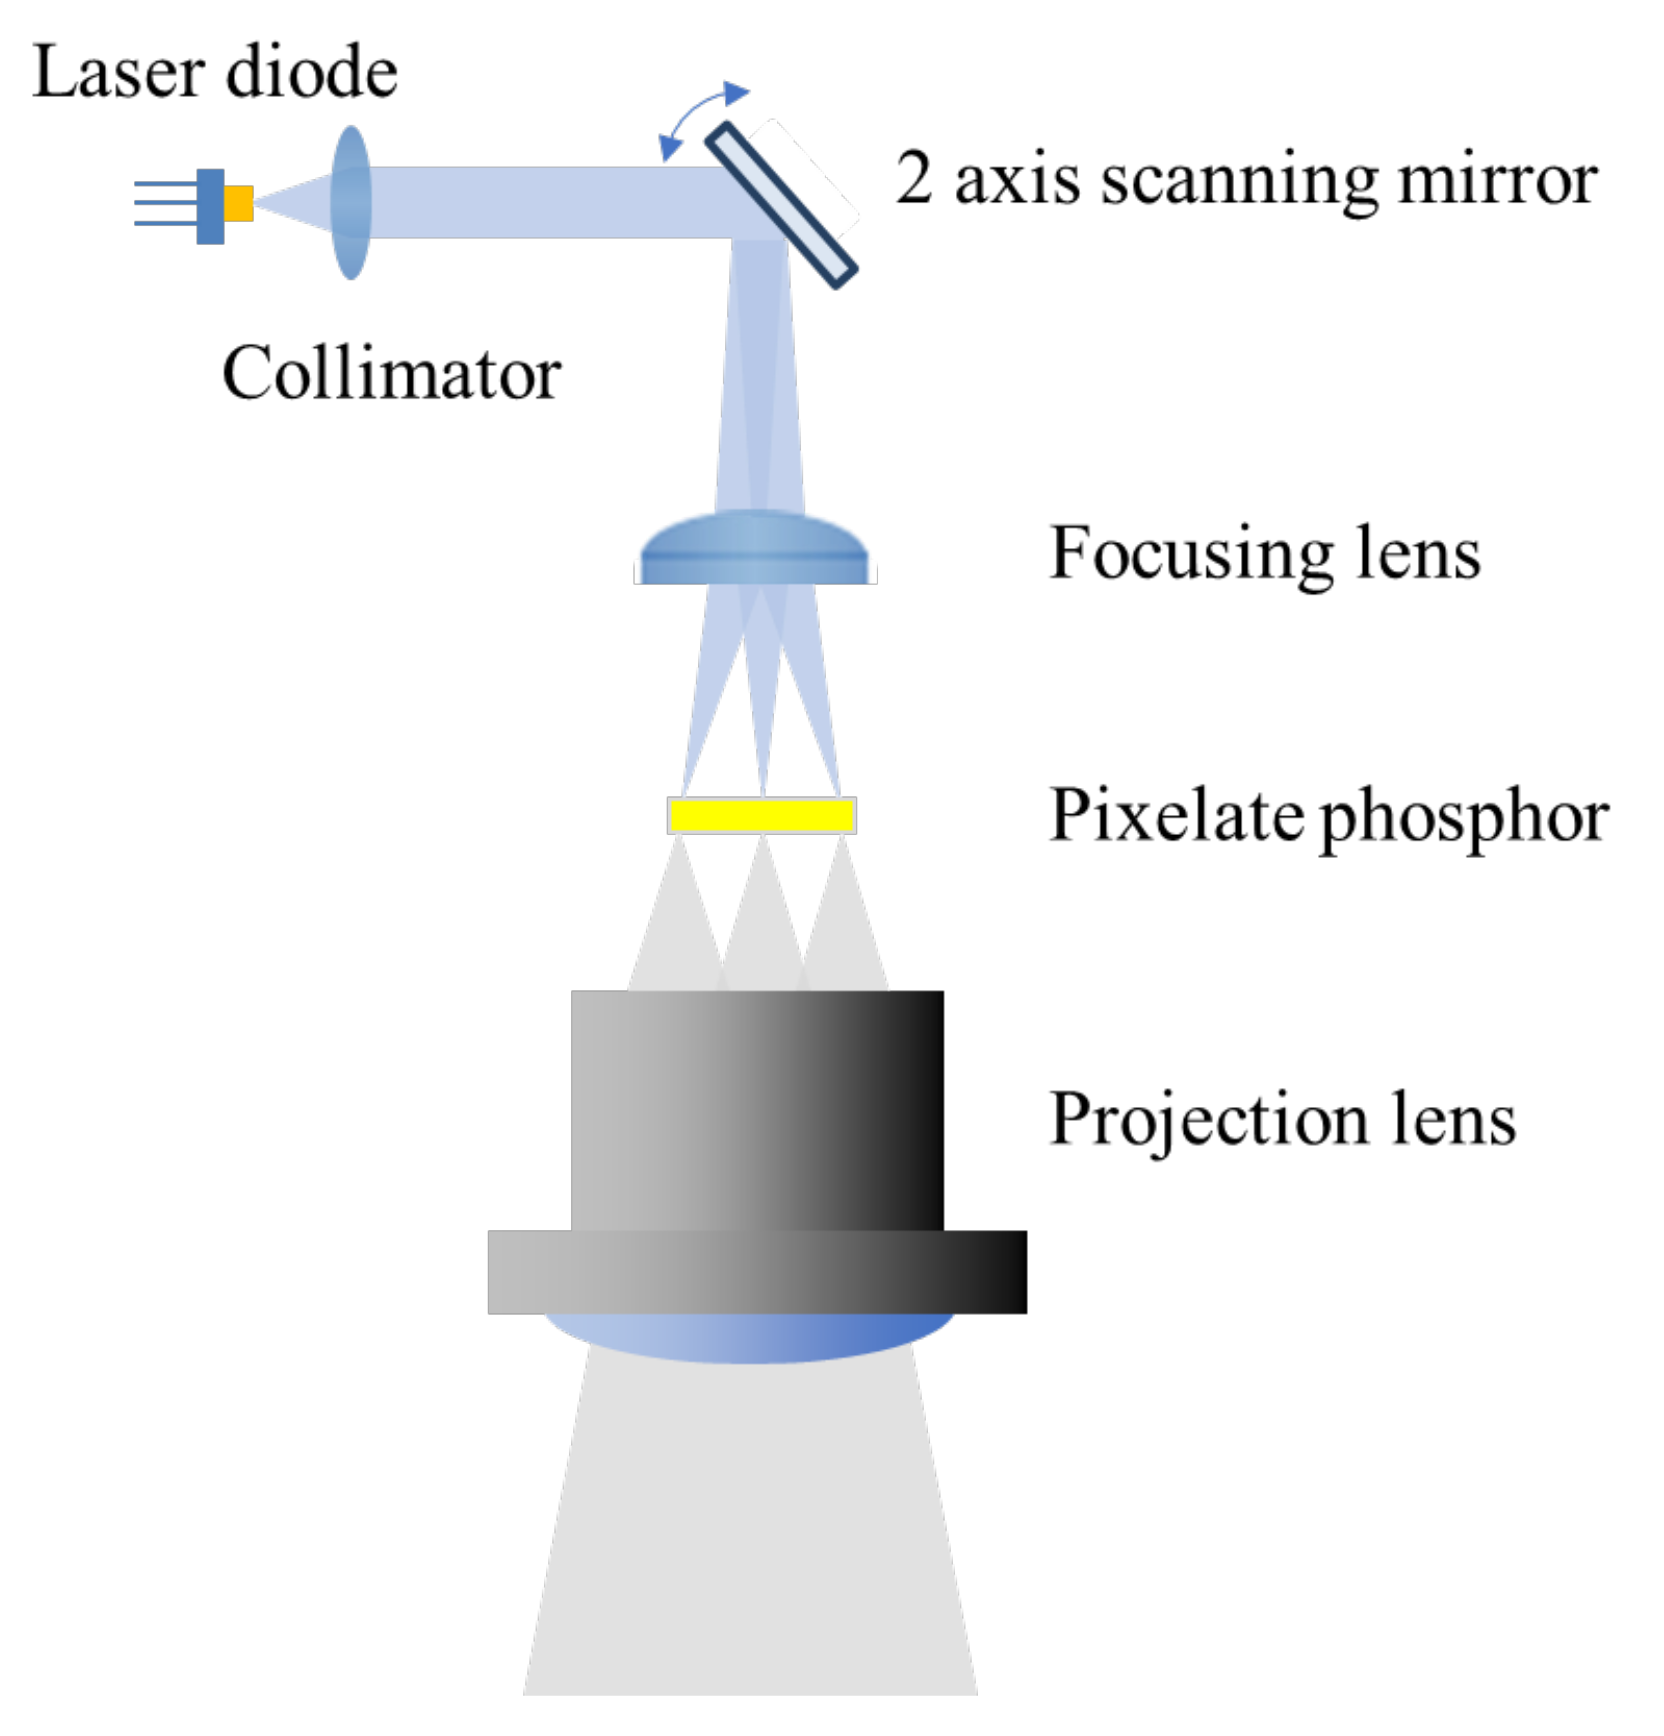
11]. The pixelated system is a technology that illuminates a road in a manner similar to an optical projector, as shown in
Figure 1. As it can manage thousands of pixels or more, it can maintain a higher lighting resolution than LED-based headlamps arranged in a matrix and can be designed to a smaller size as it is implemented with fewer light sources than LED-based headlamps.
The scanning optics of the pixelated system typically involves a small micromirror, such as an MEMS mirror with two rotational degrees of freedom [
12,
13]. The light emitted from the source is deflected by a micromirror such that it can be illuminated in the desired direction. In this case, it is desirable to collimate the light emitted from the source such that a limited size scanning mirror can be used while increasing efficiency. As an LED has a wide emission pattern, it is difficult to collimate while maintaining high efficiency. Therefore, it is desirable to use laser diode light as a light source to collimate light maximally and then send it to the scanning mirror. In addition, to construct a pixelated system with a small number of light sources, it is advantageous to use a laser diode source with a higher light efficiency than LEDs, as shown in
Figure 1.
Generally, three methods of scanning using a mirror exist. The first is to create a Lissajous pattern while both axes operate in the resonance mode, as shown in
Figure 2a. When forming the Lissajous pattern, the scanning light is decelerated at the edge of the illumination area because of the sinusoidal path of the resonance mode; therefore, the illuminance at the center is relatively low compared with that at the edge. In vehicle headlamps, the light intensity in the center should generally be the largest. Therefore, a light source with an extremely high intensity is required to drive both axes at high speed and at a resonance frequency. Therefore, if the beam is formed in the Lissajous pattern, the light at the edge will have a higher light distribution than the center area, which is inefficient for realizing the vehicle headlamp. In the second method, as shown in
Figure 2b, one axis operates in the resonant mode and the other axis operates in the quasistatic mode. This method can output light relatively uniformly in the short axis, which can then be driven at a relatively low speed; however, in the long axis, the illuminance in the center is reduced for the same reason as discussed for the Lissajous pattern. In the third method, both axes operate in the static mode. Although the illuminance can be increased in all areas, the frame rate is extremely low, rendering it unsuitable for forming complex patterns when driving at high speeds.
Herein, we propose a new laser diode scanning optical scanning system that can be used in a pixelated system to build an ADB headlamp. The proposed optical system design involves adding a simple optical prism to improve the amount of light in the center (which is lower than that at the edge area) that inevitably occurs in mirror scanning in the conventional resonance mode. By applying an optical scanner designed in this manner, an optical scanner applicable to vehicle headlamps that can increase the amount of light in the center compared with that at the edge can be implemented without using a complicated control method.
2. Conceptual Design of Scanning Optics with Efficiently Distributed Optical Power
Scanning devices, such as MEMS mirrors and galvanometers, which are frequently used in conventional scanning optics, are driven by sinusoidal functions for high-speed scanning. This reduces the surrounding scan speed compared with the center speed and results in a light distribution that does not satisfy the standard specifications of the headlamp. When scanning the center part, the speed of the mirror scanning device is maximized; therefore, the optical power is relatively low. When scanning the edge area, the speed of the mirror scanning device is minimal; as such, the optical power is relatively high. To overcome these shortcomings, a method to implement a sharp peak when scanning the edge to minimize the residence time of light in the surrounding environment has been considered; however, vibrations occurred owing to the large external force applied to the system. Therefore, precise and complex control methods are required to apply this method [
12].
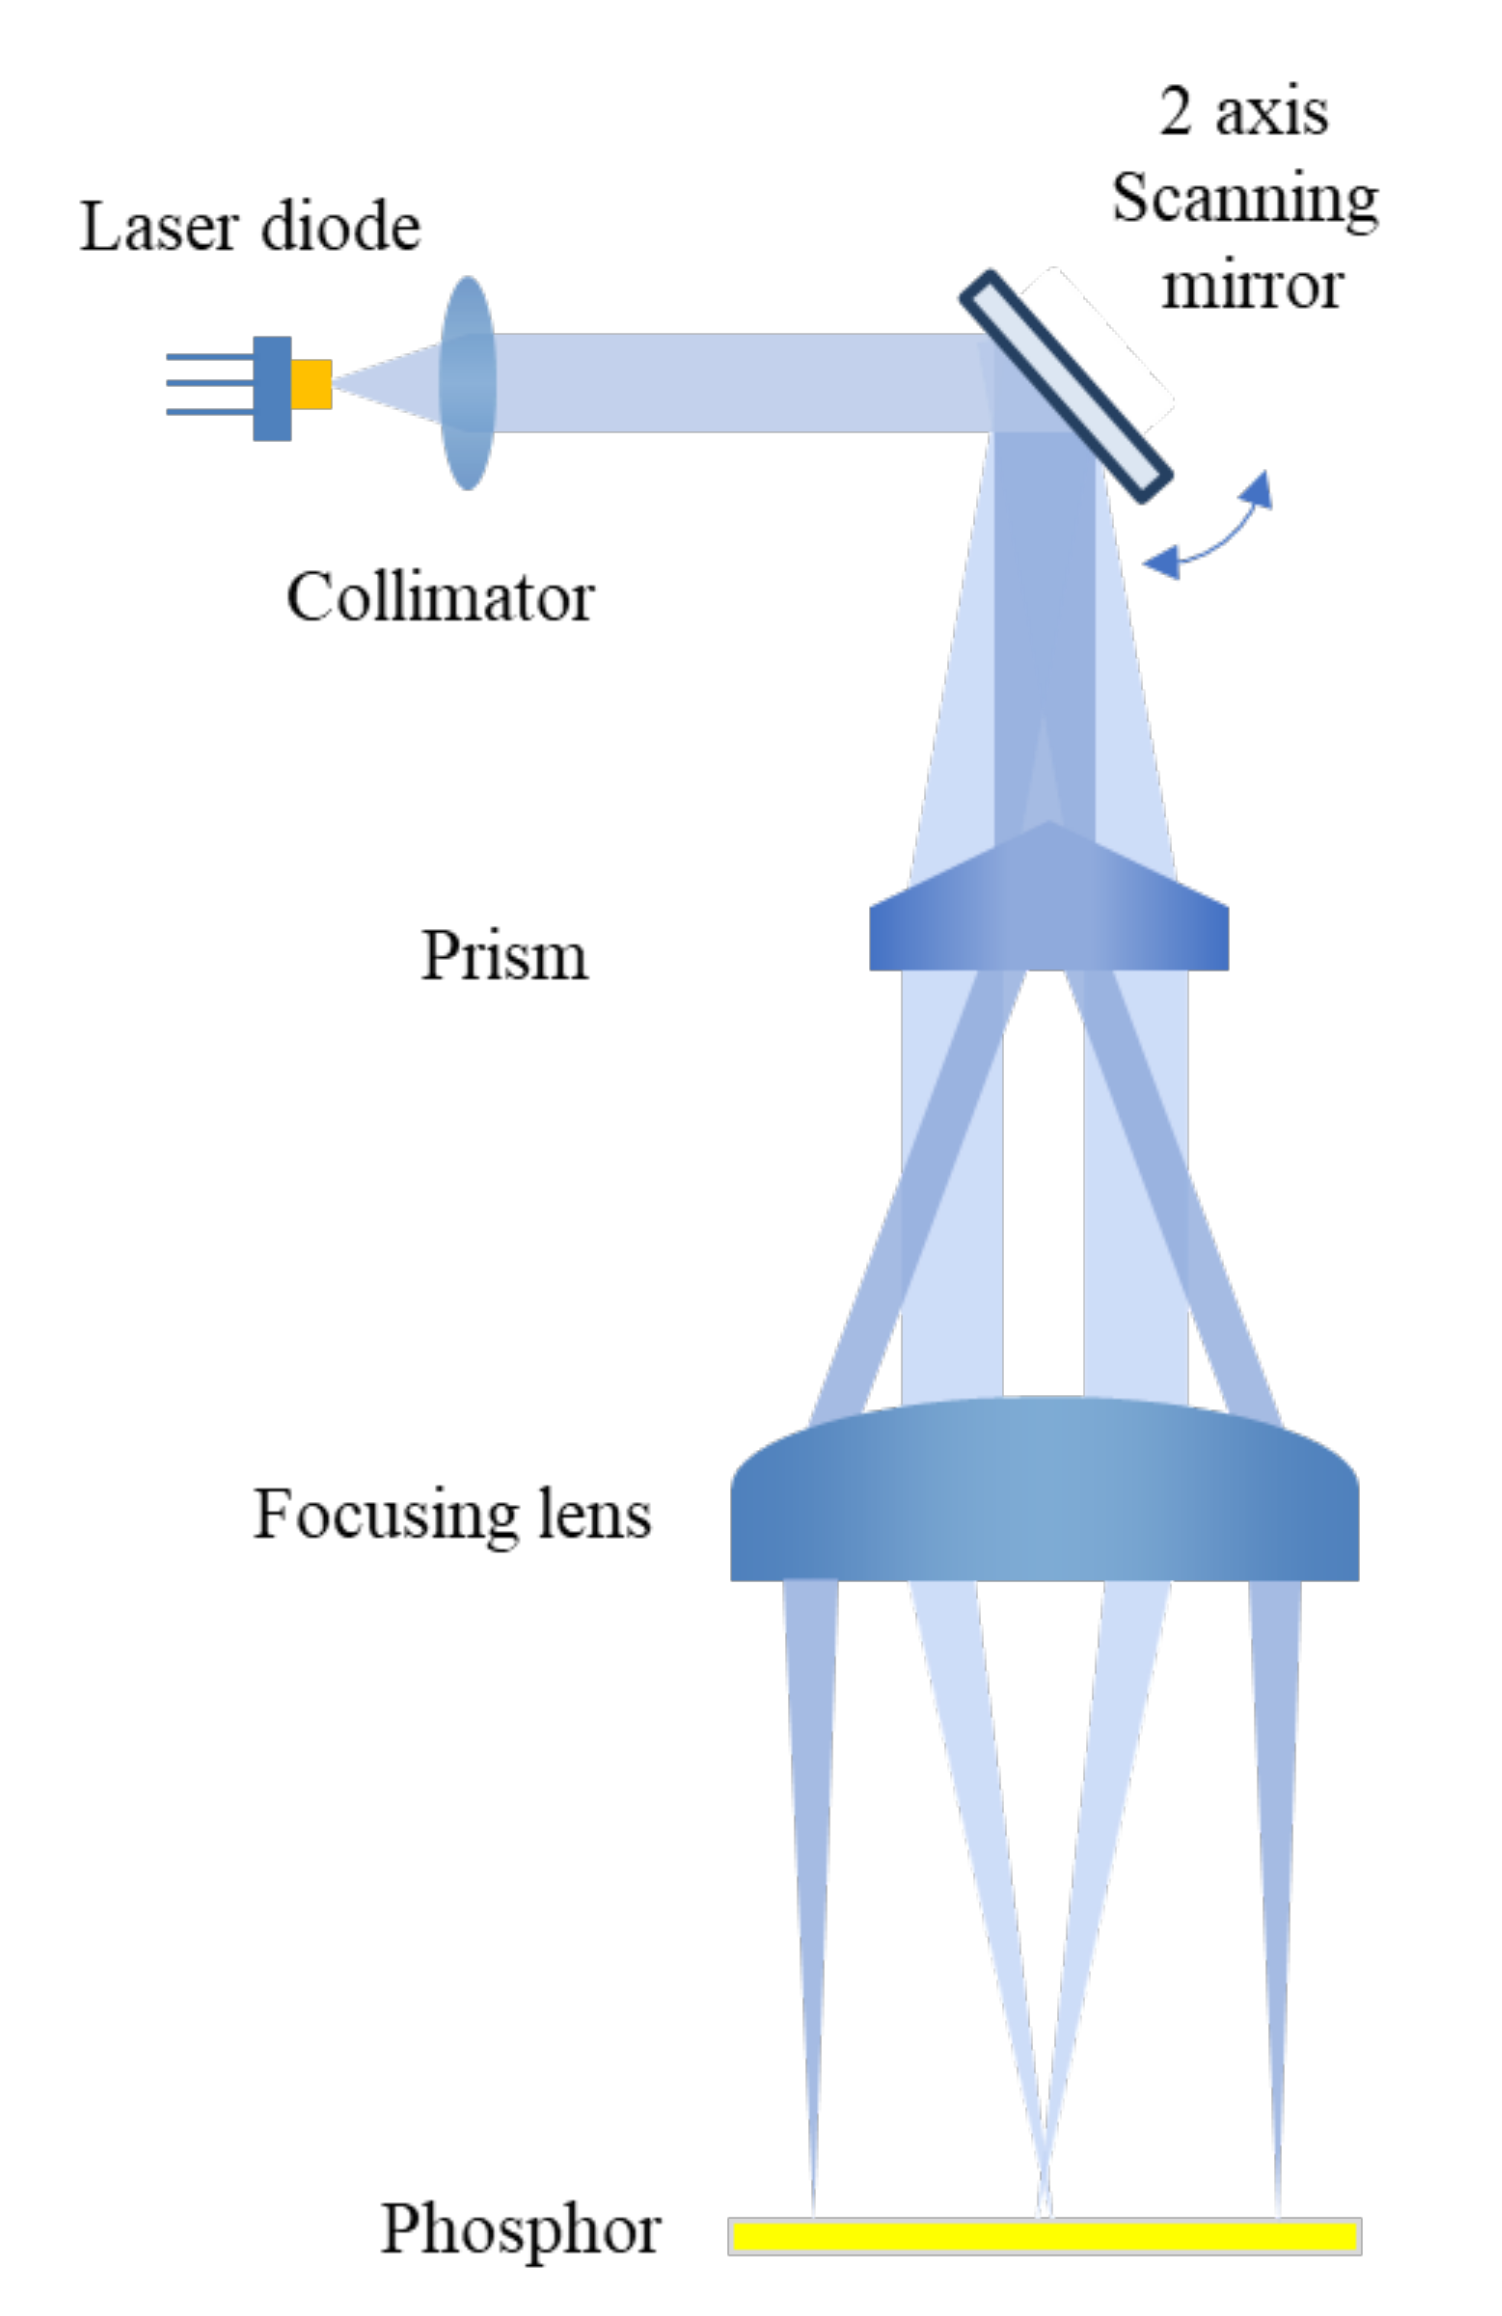
Herein, we propose an optical system that can increase the amount of light in the center through simple sinusoidal scanning without applying additional control methods by adding a prism designed to refract light in the appropriate direction, as shown in
Figure 3.
When considering the design of the optical system, first, allow the light passing through the prism to pass through the outside of the focusing lens in the low-angle region where the scanning mirror is fast, and allow light to pass through the prism when scanning the large-angle region where the scanning mirror is slow. This allows light to focus on the phosphor center through the focusing lens. In addition, because the pixelated phosphor has a partition structure [
14], when light enters the phosphor, it must be allowed to enter at a minimum angle. In addition, to ease alignment, and reduce the manufacturing cost, the prism surface is designed as a flat surface, and light focused only through the focusing lens.
3. Design of Optical Scanner System
To achieve an efficient optical power distribution, the laser diode scanner system was designed to direct the optical flux to the edge of the phosphor plane when the scanning angle is small. It was designed to direct the optical flux to the center of the phosphor plane at a relatively slow maximum scanning angle. Hence, the optical system was designed by including a prism with a specific angle based on the specifications shown in
Table 1 below to apply the pixelated phosphor system, as shown in
Figure 1. The diameter of the collimated beam was 2 mm, and the designed wavelength was 450 nm. Considering the size of the pixelated phosphor, the size was less than 40 µm when light was concentrated on the phosphor surface, and it was designed such that no large deviations appeared in the spot size over the entire area of the phosphor surface. The tilt angle generated by the scanning mirror was designed to be ±12°. The specifications shown in
Table 1 were specified for experimental verification. The design concept presented herein can yield an efficient light distribution, which is the main purpose of this study, even when using scanning mirrors with different scan angles, and phosphor planes with different areas.
Table 2 lists the specifications of the designed prism. The prism’s apex angle was 140°. The smaller the prism’s apex angle, the larger is the deflection angle of the beam through the prism. Therefore, the optical scanner system can be miniaturized, but the focusing lens must be designed to have a larger refractive power. The prism was also designed with a flat short axis for ease of fabrication and alignment of optical components. If the length of the short axis of the phosphor is relatively long, and if one wishes to control the light distribution along the short axis, a prism shape can be achieved by creating a square pyramid shape using the design method proposed herein.
The beam deflected by the prism can be assumed as offset to a certain height in the optical axis. The offset amount can be calculated as shown in Equation (1).
where
x,
d,
θ, and n are the offset position along the
x-axis, the distance between the galvanometer and prism, the angle of one side of the prism (
θ = (180 − apex angle of prism)/2), and the refractive index of the prism, respectively, as shown in
Figure 4a. The scanning mirror was placed at position
x and calculated using Equation (1), as shown in
Figure 4b. The focusing lens was optimized by setting the light beam to pass through the scanning mirror at the offset position and enter the focusing lens. In addition, the position in the
z-axis direction of the scanning mirror was adjusted by the optical path difference that occurred when light passed through the prism. In this study, the distance between the galvanometer and prism was 20 mm,
θ was 20°, and n was 1.525; hence,
x was 4.6 mm.
Table 3 lists the specifications of the focusing lens optimized for virtual objects. The focusing lens was designed as a doublet, and the glass used was N-BK7, SF2.
In the designed optical scanning system, ray tracing by scanning angle is shown in
Figure 5.
Figure 5a–e show the ray tracing when the scanning angles were 12°, 5°, 0°, −5°, and −12°, respectively. As shown in
Figure 5c, owing to the prism shape, when the scanning angle was small, the light split into two directions. However, when the scan angle reached an angle that split into two paths, the light appeared outside the area of the effective plane set in this design. In addition, turning off the laser diode when scanning this area while operating the system will remove stray light, which is split into two paths.
Figure 6 shows the change in the focusing beam position on the
x-axis (long axis) of the phosphor plane owing to the scanning angle. In the designed scanning optical system, because the light split in the −5°~5° region, the focusing light was designed to deviate from the phosphor’s effective area by ±8 mm when the scanning angle was between −5° and 5°.
A general imaging optical system is primarily evaluated by calculating its aberrations. However, in a laser diode scanner headlamp, the designed optical system spreads light evenly across the pixelated phosphor plane. Therefore, considering the role of the scanner system, the performance evaluation of the designed optics only confirmed that the beam spot size was formed to a size suitable for the size of the pixel-rate phosphor. The beam spot size on the phosphor plane considered in this study was 40 μm, as shown in
Table 1. Therefore, the focusing lens was designed to maintain a beam spot size of 40 µm or less in the scanning area. The spot size change according to the scanning angle is shown in
Figure 7. The minimum spot size was 5.29 μm at 11.16°, and the maximum spot size was 23.66 μm at 8.36°. Therefore, we confirmed that a spot size of less than 40 µm was maintained in all scan angle ranges.
4. Experimental Results and Discussion
To verify the performance of the designed optical scanner system experimentally, we constructed an optical scanner system to detect the optical power at the phosphor plane, as shown in
Figure 8. In this optical scanning system, the power of laser diode was always constant, and a difference in optical power at the phosphor plane occurred because of the difference in scanning speed due to the scanning mirror’s driving characteristics. Therefore, to analyze the performance of the designed optical system, we focused on detecting the distribution of optical power due to the change in the scanning speed inside the phosphor plane. Previously studied laser scanning headlamps use MEMS mirrors to reduce the size of the optical system. However, in this experiment, the optical system was constructed using a two-axis galvanometer (GVS012, Thorlabs Inc., Newton, United States) for a simple setup. In addition, a photodiode (PD, SM05PD2A, Thorlabs Inc., Newton, United States) with an effective detection area of 1 mm in diameter was selected to detect the optical power. A 450 nm beam, resized to 2 mm by a pair of expanding lenses and aperture, was reflected by a pair of galvanometers and focused by a designed prism and lens, as shown in
Figure 8. The PD was placed at the phosphor plane of the system such that the optical power of the focused spots can be measured. As the phosphor plane was scanned by an optical spot, the light received by the PD was measured; hence, we can acquire the optical power of a Ø1.0 mm area inside the plane where the PD was placed by multiplying the optical power and detection time. Furthermore, by moving the position of the PD and measuring the optical power of each position, the optical power distribution in the entire phosphor plane can be measured.
Because the short axis (y-axis) was not affected by the prism, the optical power distribution by scanning along the short axis indicated a large amount of optical power at the edge, similar to that by a normal sinusoidal scanning mirror. In this experimental setup, the optical power was concentrated at the center of the phosphor plane for the long axis (x-axis) one-dimensional scan only. The experimental conditions were as follows: scanning angle of ±12°, scan frequency of 5 Hz considering the PD response time, and detection frequency of 160 kHz.
Figure 9 shows the PD signal measured on the phosphor plane at 2 mm intervals in the −8 to 8 mm range using the designed scanning optical system. The
x-axis in
Figure 9 represents the scanning period, and the period of galvanometer scanning means that the range of −12° to 12° was scanned with a sinusoidal curve. In
Figure 9a, the signal measured by the PD is displayed as a graph in a different color according to the position where the optical power was measured. Subsequently, the beam spot position at the phosphor plane in the scanning period is shown in the same color bar on the graph in
Figure 9b. For example, in
Figure 9a, the voltage values measured at the PD around 0.25 T and 0.75 T are the signals measured when the PD is placed on the 0 mm of phosphor plane. The reason for the long duration of the signal measured by the red line in
Figure 9a is that the scanning mirror is scanned slow around 0.25 and 0.75 T, and the duration of the beam spot staying on the PD is long. When the PD is placed in the center, the duration of the scanning beam spot was measured approximately 0.096 T, and this value may be slightly different due to the PD alignment error. The period within the phosphor plane region of 8 mm or less (scanning angle ≥ 5°) was approximately 0.086; therefore, when scanning period from 0 T to 0.086 T, the beam spot in the phosphor plane passed through −16 to −8 mm, as shown in
Figure 9b. However, this area is not a valid phosphor plane, so it is marked as 0 in
Figure 9a. Similarly, the value in the phosphor region measured at 0.5 ± 0.086 is indicated as 0.
To compare the performance of the designed optics with that of the existing scanning system, the prism was removed and an experiment was performed, as shown in
Figure 10a. Unlike previous experiments, we discovered that the detection time of the PD signal increased as the detection position approached the edge of the phosphor plane.
Figure 10b shows the position of the beam spot in the phosphor plane along the scanning period in the scanning system without a prism; as shown, the time for the beam spot to pass through the edge of the phosphor was longer than the time to pass through its center. This means that the optical energy increased when the phosphor spot was at the edge.
Figure 11 shows the normalized optical energy measured in the designed scanning system with a prism and a scanning system without a prism. The optical energy was calculated by integrating the voltage values measured from
Figure 9 and
Figure 10 by the measured time. In the designed scanning system and the scanning system without a prism, the optical energies of light passing through the center were 5.4 and 0.35 times that at the edge, respectively.
The distributions of light illuminated on the phosphor plane by the designed scanning system and the scanning system without a prism are shown in
Figure 12. The scanning velocities of the long and short axes were 100 and 1 Hz, respectively. For the designed scanning system, the center of the phosphor plane was brighter than the edge, as shown in
Figure 12a. For the scanning system without a prism, the edge of the plane was brighter than the center, as shown in
Figure 12b. In
Figure 12a,b, the effective area of the phosphor plane is represented by the dashed yellow box. These experimental results imply that the optical power in the headlamps can be distributed more efficiently using the proposed scanning system.
5. Conclusions
We proposed an optical scanning system design for a pixelated system of a laser diode-based headlamp with a simple prism added. In the case of mirror scanning with a sinusoidal function, e.g., to implement the Lissajous pattern, the optical power in the edge became larger than that in the center area, which was disadvantageous. When the optical power distribution was formed in this manner, it was difficult to use the maximum optical intensity from the light source because of the inefficient headlamp distribution. To improve this optical power distribution, we proposed an optical scanning system with a simple prism and discussed a design method to implement it. The optical system was optimized assuming that the object of the optical system viewed through the prism shifted in the x-axis direction by geometric optical calculation. The optimized design of the optical system was verified by placing a PD on the phosphor plane and measuring the optical power. Using the PD, the lighting time in the center or edge can be measured; subsequently, the relative optical power can be calculated. The optical power distributions between the center and edge of the designed system, and the system without a prism were compared. We observed that the optical power at the center of the designed optical scanning system was approximately 5.4 times greater than that at the edge. Through experimental verification, we confirmed that the proposed scanning system had a higher optical power distribution in the center than at the edge, which is meaningful for the implementation of an efficient pixelated system for headlamps. Therefore, using the proposed optical scanner, a brighter headlamp can be configured in a simple form because the light intensity distribution can be efficiently configured, unlike the existing pixelated system.


