1. Introduction
Datacenters (DCs) consume large amounts of energy for IT infrastructure operations, such as servers, storage devices, and network equipment, and also use energy to maintain an environment with constant temperature and humidity. DCs have significantly higher operating expenditures than capital expenditures and are considered to be the single largest power consuming buildings that account for approximately 2% of the global power consumption [
1]. The recent growth of the ICT industry, along with the increasing demand for artificial intelligence, big data, and Internet of Things (IoT) has driven the transformation from on-premises to the cloud environment. Further, the number of DCs worldwide, which is about 8.6 million as of 2017, is expected to grow rapidly in the future. In fact, the Hyper-Scale DC, which is a datacenter with thousands of servers focused on processing and managing the exponentially increasing volumes of data, is expected to grow by about 53%, from 338 in 2016 to 628 by 2021 [
2].
DCs must provide uninterrupted service for 365 days in a year, and the downtime cost per minute is estimated to be about
$9000 [
3]. In addition, malfunctions of DCs, which are associated with the social system, can cause secondary and tertiary damages, which are difficult to quantify in terms of scale. Therefore, the management of DCs has been conservative thus far instead of considering power-efficient operational measures. Examples of conservative management include allocating too many resources to react to less frequent potential peak loads when operating under the same original configuration from the beginning to end and allocating resources by estimating the demand growth of the cloud resource during the lifespan of the DC.
Power usage effectiveness (PUE) is an evaluation index of a DC’s energy efficiency and is the ratio of the total power requirement of the DC to the power consumed by the IT equipment in the DC. A PUE value close to unity means higher energy efficiency [
4]. Globally, companies have built and operated eco-friendly DCs utilizing geological advantages, such as using external air-conditioning in the arctic circle or building DCs at the bottom of the sea [
5,
6]. It also utilizes solar, wind, and renewable energy to operate DC efficiently [
7]. These eco-friendly DCs show high energy efficiencies because heat management of the equipment requires less manual effort. However, as these DCs are built in remote areas, they are harder to access and respond to because of latency. Therefore, eco-friendly DCs with geological advantages are utilized as backups to analyze and store data rather than as main DCs for operating mission-critical systems. Thus, to improve the energy efficiencies of DCs, utilizing only geological advantages has limitations, and efforts must be considered to improve the operating systems internally.
Many studies related to computing systems for energy efficiency have been conducted at the DC, operating system (OS), virtualization, hardware, and firmware levels. Analyses of various methodologies to reduce the power consumption of the DC have shown that the most effective scheme involves a server-idle switch [
8]. It has been shown that the server-idle switch has a significant effect on energy savings because leaving the server on and idling accounts for approximately 70% of total energy consumed in comparison to full utilization of the server [
9].
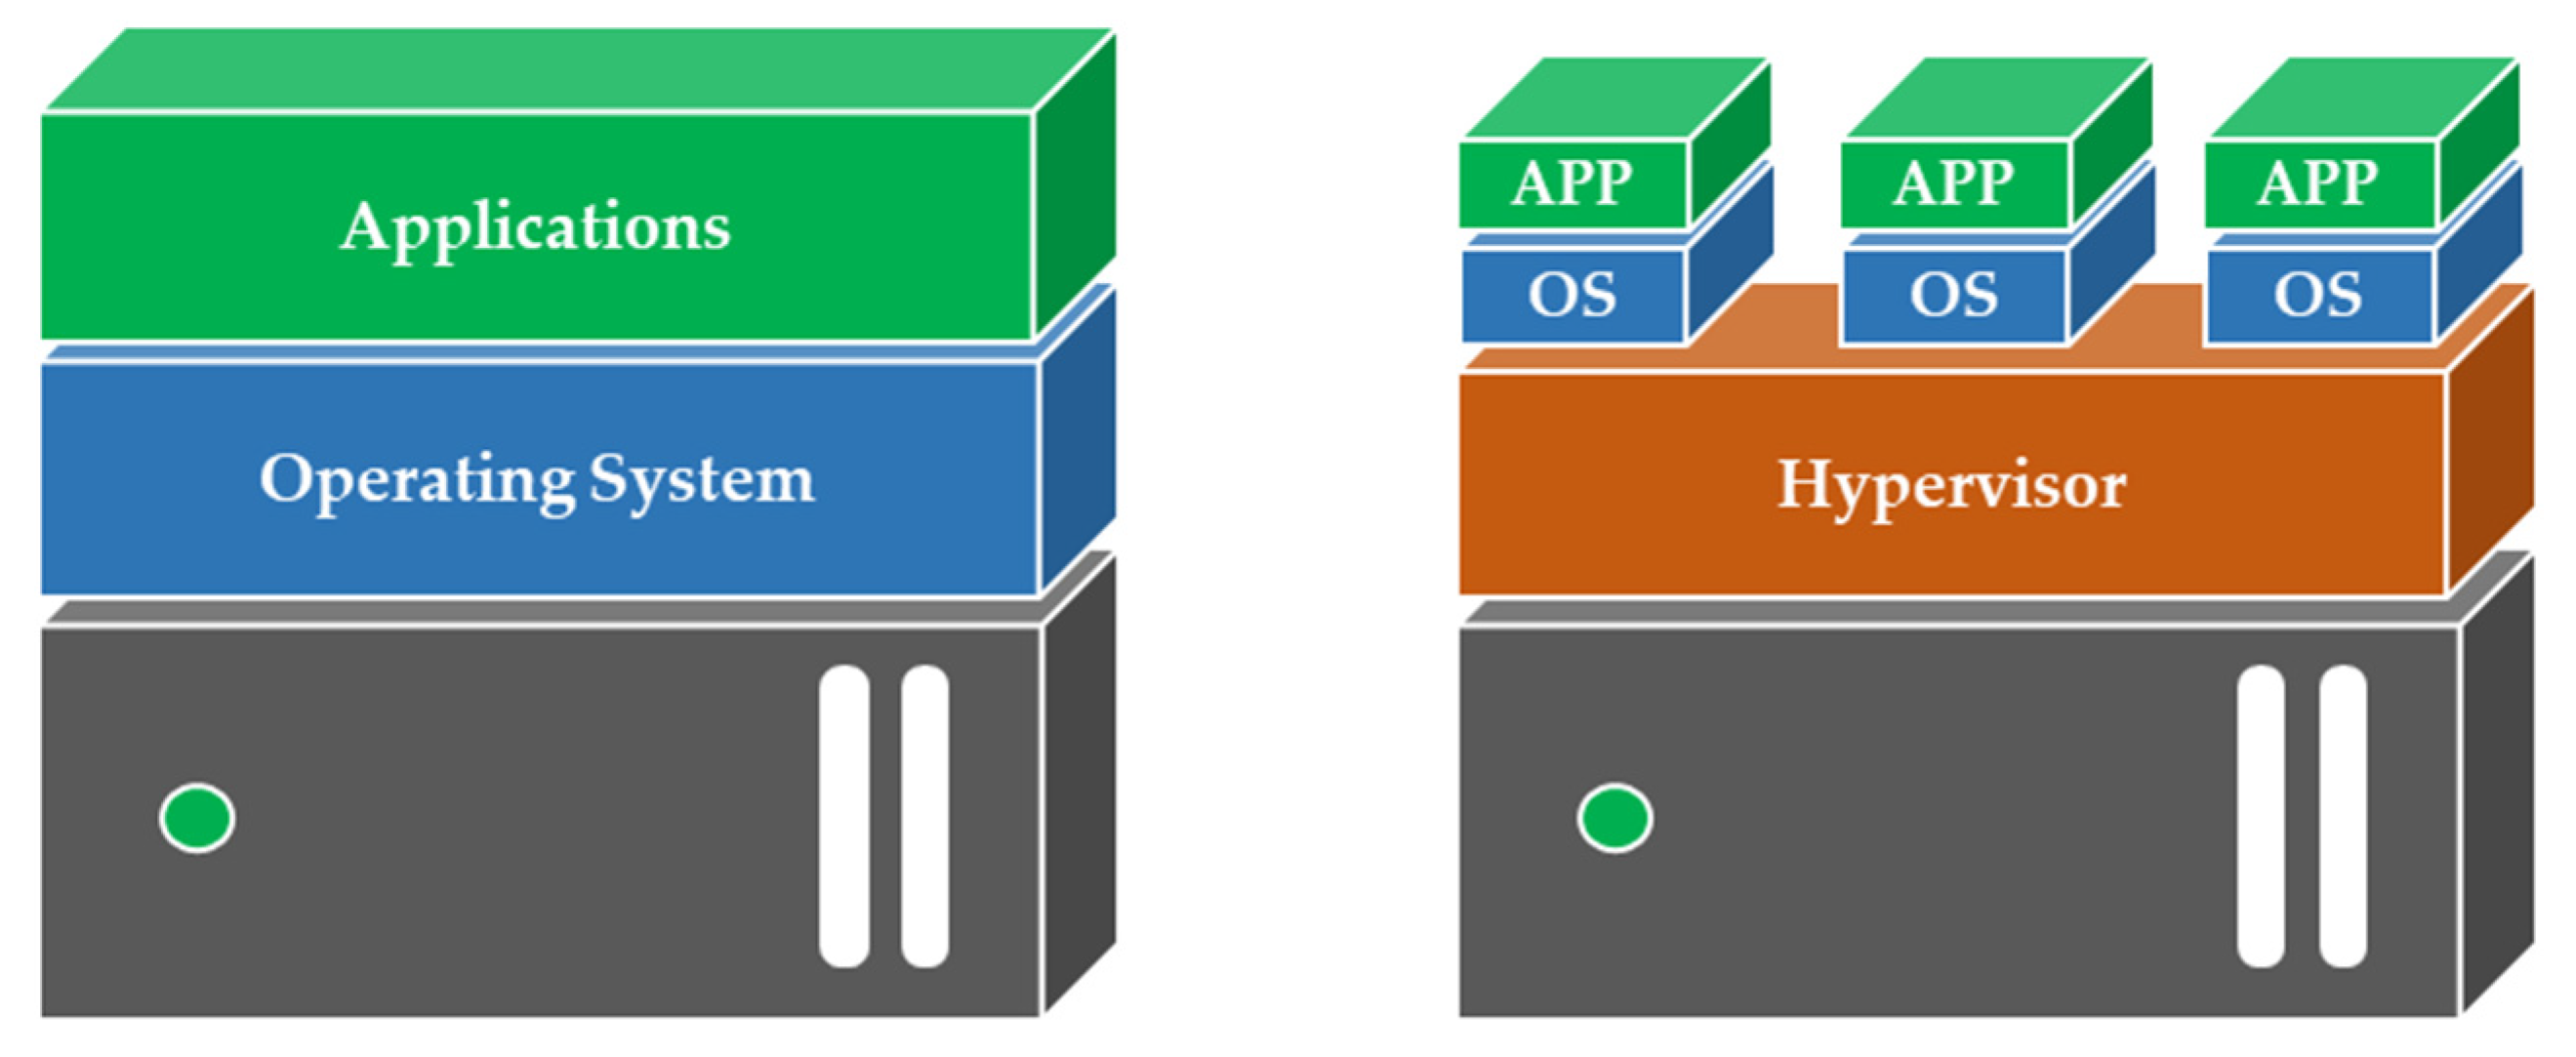
Servers (physical machines: PMs) have higher specifications than personal computers, with the purpose of providing computing power for large volumes of data, and server virtualization technology is applied to efficiently utilize these resources. Server virtualization refers to logically dividing a PM into several virtual machines (VMs). As shown in
Figure 1, virtualization runs the application by dividing the main OS into several smaller OSs through a hypervisor, which is a virtualization platform, unlike the traditional architecture of one OS for each server. The hypervisor allocates PM resources, such as central processing unit (CPU), memory, and network, to individual OSs. One unit of such an OS is called the VM. Most of the recently developed PMs for DCs are managed in virtualization environments.
The hypervisor configures the virtualization environment and offers live migration features that allow the operational VM to move between PMs without service interruptions. When a destination PM has available resources for the VM resource allocated to a source PM, then a VM can be migrated. When all the VMs in a certain PM are migrated to another PM, the original PM is empty and available for the idle switch. This methodology minimizes power consumption by migrating the VMs and switching a PM to idle, i.e., VM consolidation, which is one of the methods to effectively improve excessive power consumption by a DC [
10].
VM consolidation maximizes PM idle switching by migrating the VMs to appropriate places, but the VM migration itself should be discouraged as much as possible [
11,
12]. Sometimes, downtimes occurring during VM migration can violate the SLA although applications installed in the VM continue operating during the migration [
13,
14]. In addition, migration itself is a task that induces overloading; hence, it is not recommended to migrate several VMs simultaneously. In the actual environment, this function is only utilized as cold migration after suspending the VM during a scheduled preventive maintenance. From the practical perspective of operating a DC, decision makers must have some insights into PM–VM mapping information. However, if this information changes frequently owing to VM migration, the complexity of management is intensified.
PMs generate large quantities of heat while handling tasks; this heat generated by a PM is proportional to its performance and power consumption, which means that high performance and high power consumption generate large quantities of heat. Excessive heat generated from the rack of a DC may cause equipment damage, which adversely affects the lifespan of IT equipment. Consequently, budget planning should be established for when and how much of the IT equipment must be replaced during the course of operating a DC. However, budget planning for DCs cannot be accurately implemented, and breakdown cannot be accurately predicted if the PMs are frequently replaced before expiration of their lifespans owing to performance degradation.
In this study, we propose a VM consolidation model to reduce the DC power consumption and minimize VM migrations. The VM consolidation model improves the power efficiency and ensures reliable operation of the DC. In addition, we explore VM combinations to steadily maintain PM workloads to enable reliable operation from the perspective of lifespan of the IT infrastructure. To effectively solve the proposed model, we apply the adaptive harmony search method to reduce the complexity of setting parameters among the various harmony search methods, which have shown excellent performance for optimizing various problems in the field.
The remainder of this paper is organized as follows. In
Section 2, research related to VM consolidation and harmony search are reviewed. We propose the VM consolidation model in
Section 3 and describe the design of the metaheuristic technique for solving the model in
Section 4.
Section 5 presents the experimental design and results, and
Section 6 presents some conclusions and scope for future study.
2. Related Work
VM placement and VM migration are the backbone to the VM consolidation process [
15]. VM placement involves deciding the PM to which a VM must be assigned and is similar to the multidimension bin packing problem (BPP), which concerns filling the maximum number of items into minimum number of bins. Here, the PM is considered as the bin, and the VM is considered as the item in VM placement. BPP can be a two-dimensional or three-dimensional problem, and the dimensions of the BPP comprise width, depth, and height. For VM placement, the number of dimensions increase according to the number of resources (CPU, memory, bandwidth, etc.). Specifically, VM placement is defined as a multidimensional vector packing problem with independence of each dimension, as shown in
Figure 2. VM placement has the characteristic that a problem starts with a VM that is already assigned to the PM because the DC is operated throughout the year and differs from the BPP as it places the item in an empty bin [
13,
16].
The VM consolidation framework uses a separate monitoring tool, as shown in
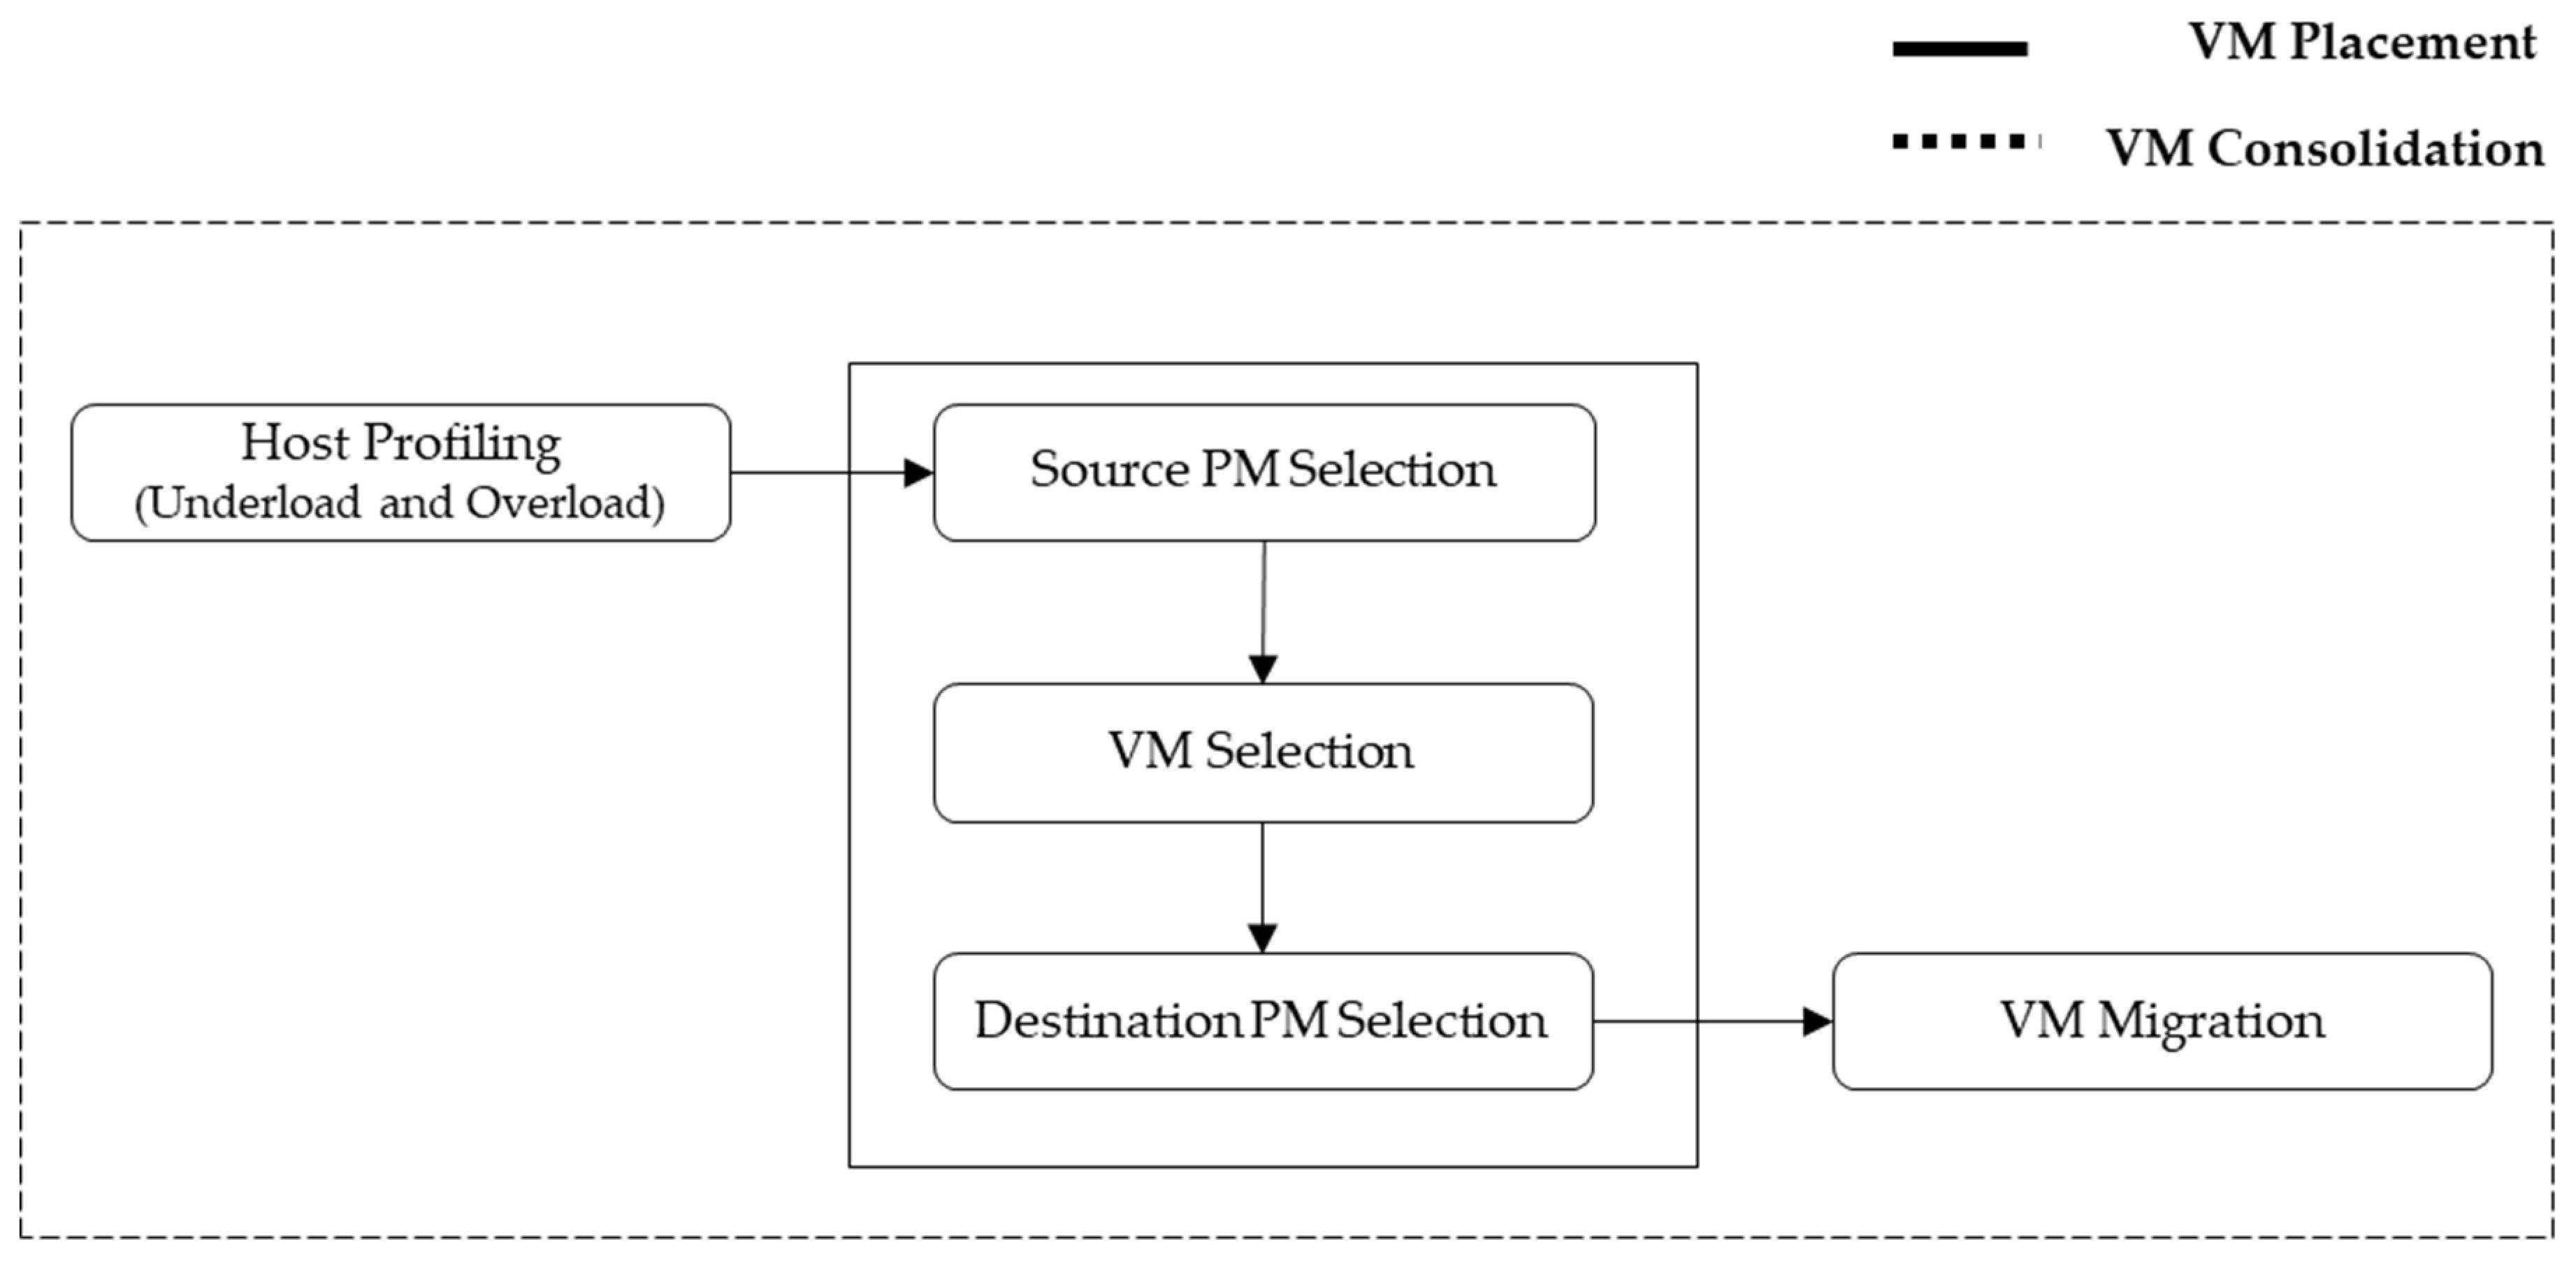
Figure 3, where the PM is monitored to minimize the number of active PMs using the idle switch in the event of an overload or underload. VM placement is then implemented if certain conditions are met. The key element of VM consolidation is VM placement, which consists of the source PM selection to determine which PM is placed in the power-saving mode, VM selection to determine which VM to migrate from the source PM, and destination PM selection to determine which PM is assigned the selected VM. It detects PM overload or underload; the detected PM then selects the VM to migrate from the VMs assigned to the source PM, and VM placement is implemented to decide the PM to migrate to.
Threshold-based algorithm (THR), which is the most basic methodology to detect PM overload, calculates the average CPU usage for a specific time period
t and determines that the PM is overloaded if the defined threshold is exceeded. The THR is a simple method but difficult to apply to dynamic and unpredictable environments [
17]. Therefore, to overcome the THR limitations, an adaptive utilization threshold-based algorithm is suggested to analyze the collected workloads of the virtual machines statically and adjust the thresholds automatically [
8,
18]. The median absolute deviation (MAD) and interquartile range (IQR) are used as statistical measures. The MAD is a technique that uses the median instead of the average to find the absolute deviation, and IQR measures the overload using the quartile range. This is a general technique for measuring outliers, and the PM overload can also be interpreted in a manner similar to searching for outliers. The adaptive utilization threshold algorithm is more suited for dynamic environments than the static utilization threshold, but its overload forecast performance is poor. Local regression methods such as local regression robust (LRR) are suggested for better performances than the static and adaptive thresholds.
PM with overload detection is used to decide the VM to which migration must occur. The VM selection policies suggested are dynamic management algorithm (DMA) policy, which selects the VM with the lowest CPU utilization to minimize migration cost, minimum migration time (MMT) policy, which selects the VM with the lowest migration completion time, random selection (RS) policy, which selects a random VM [
19], and maximum correlation (MC) policy, which selects the VM that has the highest CPU utilization correlation with the original VM [
20]. Comparison of the results for each policy shows that the MMT has better results than RS and MC, suggesting that minimizing of VM migration time is an important objective. For DMA, MMT, and MC, the use of the fixed standard renders the policies unsuitable for dynamic environments. To improve these shortcomings, fuzzy Q-learning (FQL), which is an online decision-making strategy, is suggested. The FQL can choose one of the VM selection strategies dynamically to obtain better results than using the individual selection strategies alone [
21].
VM placement determines the PM to which the selected VM is migrated, which is the same mechanism as the BPP as mentioned previously. The BPP is a typical NP-hard problem, and the solution exploration time exponentially increases with the size of the problem. Hence, studies proposing optimization techniques, such as integer programming (IP), linear programming (LP), integer linear programming (ILP), and binary integer programming (BIP), to solve for VM placement simplify the conditions and have long execution times. Consequently, most of the research related to VM placement apply the greedy heuristic or metaheuristic techniques, such as first fit decreasing (FFD) and best fit decreasing (BFD) strategies [
22].
Adamuthe et al. designed a suitable genetic algorithm (GA) for VM placement and compared this with the FFD method [
23]. Wu et al. utilized the genetic algorithm, NSGA, and NSGA II to maximize load balancing and profit and to minimize wastage of resources for VM consolidation [
24]. Mark et al. predicted the VM resource demand and proposed the evolutionary algorithm to minimize cost by optimizing VM placement [
25]. Ant colony optimization (ACO), which was inspired by the pheromone mechanism in ants, demonstrated high performance in various studies, but it was characterized to be an algorithm specialized for routing problems. However, the ACO method became one of the most well-known metaheuristic techniques that can be applied for VM consolidation since several works have defined the VM migration rule as the pheromone [
26,
27,
28]. Farahnakian et al. suggested the green cloud computing method for the Ant colony system-based VM consolidation (ACS-VMC). They used the ant colony to find the most appropriate PM for VM placement after detecting the overload host using linear regression based on CPU usage prediction.
Kansal and Chana proposed the VM consolidation model to manage a cloud resource and increase its utilization by applying the artificial bee colony (ABC) method to solve the model [
29]. This proposed VM consolidation model aimed to reduce energy consumption by referring to historical resource utilization and energy consumption data. Ibrahim et al. proposed particle swarm optimization (PSO) to reduce power consumption without violating SLA and showed excellent results in terms of SLA through a comparative experiment with Power-Aware BFD Algorithm [
30]. Haghighi et al. used k-means clustering and proposed an improved micro-genetic algorithm. This effectively reduces the energy consumption of DC and simultaneously considers continuous quality of service. Comparative experiments were conducted with PSO and GA, and improved results were shown in terms of VM migration and make-span [
31]. Kim et al. proposed the grouping harmony search (GHS) method to solve the VM consolidation problem by applying an efficient representation aimed at maximizing the migration efficiency, which is the ratio of the number of released PMs to the number of migrations [
32]. The simulation is referred from a generator presented in an existing study, and comparison experiments between the harmony search (HS) and GHS are performed. Fathi and Khanli also applied the HS to solve the VM consolidation model by considering energy [
33]. Renugadevi et al. proposed the power-aware algorithm and an adaptive HS to reduce the power consumption of the PMs [
34]. They proved the efficiency of the HSA for the energy problem, but the simulations did not consider varying workloads.
This study (1) minimizes the power consumption of a DC by considering the violation of SLA and minimum VM migration simultaneously, (2) suggests the VM consolidation model that induces sustainability of the DC, and (3) apply new VM Selection rules the HS as an efficient method for solving the proposed model. Furthermore, (4) an adaptive HS is designed for simple parameter setup and comparative experiments are conducted to validate the proposed model.
3. VM Consolidation Model
VM consolidation is primarily aimed at increasing the power efficiency by dynamically switching the PM to idle, but its priority is low from the perspective of an actual DC administrator. The reason for this is that failures occur when operating enough number of PMs in the current environment. In this situation, reducing the number of PMs to increase the energy efficiency of the DC, where stability is the priority, increases the risk of failure in an uncertain environment, which is considered as a risk factor from the perspective of an administrator. In other words, energy efficiency is inversely related to stability of the DC from a conservative operational point of view. In addition, an administrator needs to be aware of PM–VM assignments, but frequent VM migration from VM consolidation can disrupt management efficiency. Therefore, this study proposes a VM consolidation model to maximize the operational stability considering the maximum energy efficiency of the DC, increase in the number of applications of the quality of services (QoS), and persisting period of the PM. This section describes the VM placement and VM migration, which are key elements of VM consolidation, and the objective function of this study.
3.1. Virtual Machine Placement
This study targets a virtualized environment that assigns PM resources to a large number of VMs and considers CPU, memory, and network as the resources. The CPU is the most influential factor for CM consolidation since it is the resource that has the largest impact on performance and energy consumption of the PM. Consequently, most of the research on VM placement consider the CPU. Memory is also considered here since it is the resource affecting the performance of the PM and is a major factor in VM migration. Swap memory in the storage drive is used when the PM does not have spare memory, which slows down, causing decrease in the QoS and failures. Network bandwidth is also an element to consider since its DC network environment is remote, but it is only considered as a resource affecting VM migration and not a resource that is assigned, like the CPU and memory.
The constraint for VM placement is defined as follows:
Equation (1) represents that the sum of every VM assigned to PMs is 1 and also indicates that only one VM can be assigned to a PM.
is a binary variable representing whether the
VM is assigned to
PM (if it is assigned, 1; otherwise, 0).
Equations (2) and (3) are the constraints for the PM capacity, and the sum of the total resources (CPU and memory) of VMs assigned to PM cannot exceed the total amount of resources for the PM. In addition, the spare resources of the PM to prepare for a sudden increase in resource demand is reflected in the total amount of resources for the PM as a threshold.
3.2. Power Consumption Minimization for DC
The purpose of VM consolidation is to minimize power consumption for energy efficient management of a DC. In the recent operation environment of the DC, accurate power consumption data can be collected through the IoT sensors embedded in a server. However, it is difficult to identify the power consumption of a particular system. Similarly, new PM–VM mapping information obtained by the VM consolidation needs to be estimated since it is a plan that has not yet been implemented.
Fan et al. presented the power consumption estimation model to estimate the power consumption of a particular system by analyzing the power consumption data from thousands of PMs. The analysis results show strong correlations between power consumption and CPU utilization, and the power consumption tends to increase linearly when utilization of the CPU changes from idle to full utilization [
35].
Based on the model by Fan et al., the estimated power consumption of the PM is calculated as shown in Equation (4).
Here, and represent the idle status and power consumption (W) of fully utilized PM and are constants defined according to the specifications of the PM. Power consumption of the PM is calculated proportional to CPU utilization, and is even when CPU utilization is 0%. In general, CPU utilization of 0% means that the PM is idle, and the power consumed can be conserved by setting this PM to the power-saving mode. CPU utilization in a 24-h operating DC environment is time-series data that varies according to user demand, and the cumulative amount of power consumed over a specific time period () is calculated as shown in Equation (5).
3.3. VM Migration
The virtualized environment provides live migration, which supports non-disrupted service by the VM during migration to another PM. However, live migration decreases the performance owing to overload during the process of memory copying and causes a short downtime even though the application service does not stop, which is why frequent VM migrations should be avoided. VM migration is divided into precopy and postcopy at the point of VM interruption. Precopy is the commonly used technique, and its process is shown in
Figure 4 [
10].
Precopy migration begins with premigration and reservation to check whether the VM can be migrated. When migration is decided, the iterative precopy process transmits the memory pages repeatedly. All the memory pages are sent to the destination PM during the first iteration, and the modified memory pages (dirty pages) are sent repeatedly during subsequent iterations. The process of sending the memory pages causes overheads. During the stop and copy, the VM is suspended at the source PM and the entire network traffic is redirected to the destination PM. Then, the remaining dirty pages and kernel data, such as CPU states and registers, are sent. The commitment process confirms that the VM is migrated to a destination PM, which is then considered as the primary PM, and the VM that is in the source PM is abandoned. During activation, the VM is activated after appropriate actions for the destination PM, such as connection of the device drivers and change of IP addresses.
This study calculates the migration cost to avoid VM migration and reflects this in the VM consolidation model. Factors affecting the VM migration are the memory size of the VM, page dirty rate, CPU utilization of the source/destination PM, network bandwidth, and application sensitivity. Accurate calculation of the VM migration considering all of these factors have challenges. Therefore, this study considers the VM migration cost proposed by Wu et al., as shown in Equation (6) [
36].
VM migration sends the memory page, so it correlates with the memory size () of the VM. Page dirty rate () is also considered to calculate the migration cost since a higher percentage of the page dirty rate increases the number of memory pages during migration. In addition, migrating a VM to the destination PM is achieved through the network associated with a network bandwidth. Application sensitivity () is defined as a variable considering a network-intensive VM with the heavier burden of the migration process from providing streaming services compared to a VM that is not network-intensive.
The current allocation information of the PM–VM
) is changed to
according to the VM consolidation condition. VM migration cost from VM consolidation
is calculated by Equation (7). The absolute value of the difference between
and
indicates the number of changed VMs when the source and destination PMs are compared, and half of the absolute value represents the number of migrated VMs. The total VM migration cost
is calculated by multiplying the number of migrated VMs and the migration cost
.
represents the cost when all the VMs are migrated.
3.4. Objective Function
The proposed VM consolidation model aims to reduce power consumption and avoid VM migration for stable DC operations. To evaluate the results of the VM consolidation model, the consolidation score, which unifies the values for the amount of energy and migration cost, is defined and calculated as shown in Equation (9).
The VM migration cost is evaluated by normalizing the number of migrations compared to the worst case, when all VMs are migrated. The variables evaluating the power consumption is normalized and the power saved is compared to the maximum power savings (
) based on the specification of the current PM and VM [
37]. The maximum power savings concept is demonstrated in previous studies. Two of the multiobjective variables are calculated as one objective function using the weight variable
. This weight variable represents the conservatism of DC management; the low value of
chooses an operational plan to reduce the amount of energy by enduring some penalties and high value of
represents the small interest in reducing the amount of energy. The value of
is adjusted by the decision maker who determines the operation strategy of the DC.
4. Application of HS to VM Consolidation
VM placement has the same mechanism as BPP, which is an NP-hard problem, and its computational complexity increases as the number of nodes increases. Thus, efficient algorithm design should be considered to obtain a high-quality local optimal solution. The DC environment, which is the subject of the VM consolidation model application, is generally a large-scale problem as it is an environment operating with a large number of PMs and even larger number of VMs.
HS is an algorithm specialized for discrete problems, and has advantages such as easy implementation and quick convergence [
38]. Compared to other metaheuristics, GA generates new chromosomes using only one or two existing ones, but HS is advantageous for exploration because it generates new solution based on all the solutions. In addition, unlike ACO, which is difficult to define a pheromone rule and requires updating the pheromone of all ants for every iteration, HS has the advantage of being able to quickly converge because it creates only one solution for each iteration. For this reason, HS was adopted.
4.1. Harmony Search
The HS is an algorithm that imitates the process of developing chords by improvised music players and is relatively simple compared to other algorithms; however, it shows high performance in optimal search in many engineering fields [
38]. The algorithm is a population-based metaheuristic in which a solution is represented by the harmony memory (HM), and the number of HMs is determined by the harmony memory size (HMS). HS uses three operators to develop from dissonance to harmony. The operators comprise memory consideration (MC) that extracts the sound played in the past, pitch adjustment (PA) that allows adjustments to the extracted sound within the range of the bandwidth (BW), and randomization that allows random plays. The process of generating solutions for each operator is shown in Equations (10) and (11).
HS generates the new HM in order starting at index . First, it generates first random number between 0 and 1 to determine whether to generate a solution using the HMC or randomly. If it is smaller than or equal to the HMCR, one of the HMs is selected to generate . The second random number is generated, and if it is smaller than the PAR, a neighborhood solution that is calculated by adding a random value to within the appropriate range (BW) is generated as . If the first random number is greater than the HMCR, the solution is generated randomly in a feasible range. If a newly generated HM is a better solution than the worst HM from the existing HMs, the newly generated HM replaces the existing worst HM. The process is then repeated a certain number of times to obtain the best HM.
4.2. Harmony Search for VM Consolidation
VM placement allows decisions to select the source PM for power saving (or other purposes), selects the VM to migrate from the selected PM, and selects the destination PM to which the VM migrates. The proposed HS is described in this section and is designed to efficiently solve the VM placement model. The harmony considering rate (HMCR), which determines whether to create the new harmony based on the existing harmony or to generate randomly, pitch adjustment rate (PAR), which determines whether to consider the neighborhood values from the existing harmony, and bandwidth (BW), which determines the range of the neighborhood value, are the HS parameters that must be set separately.
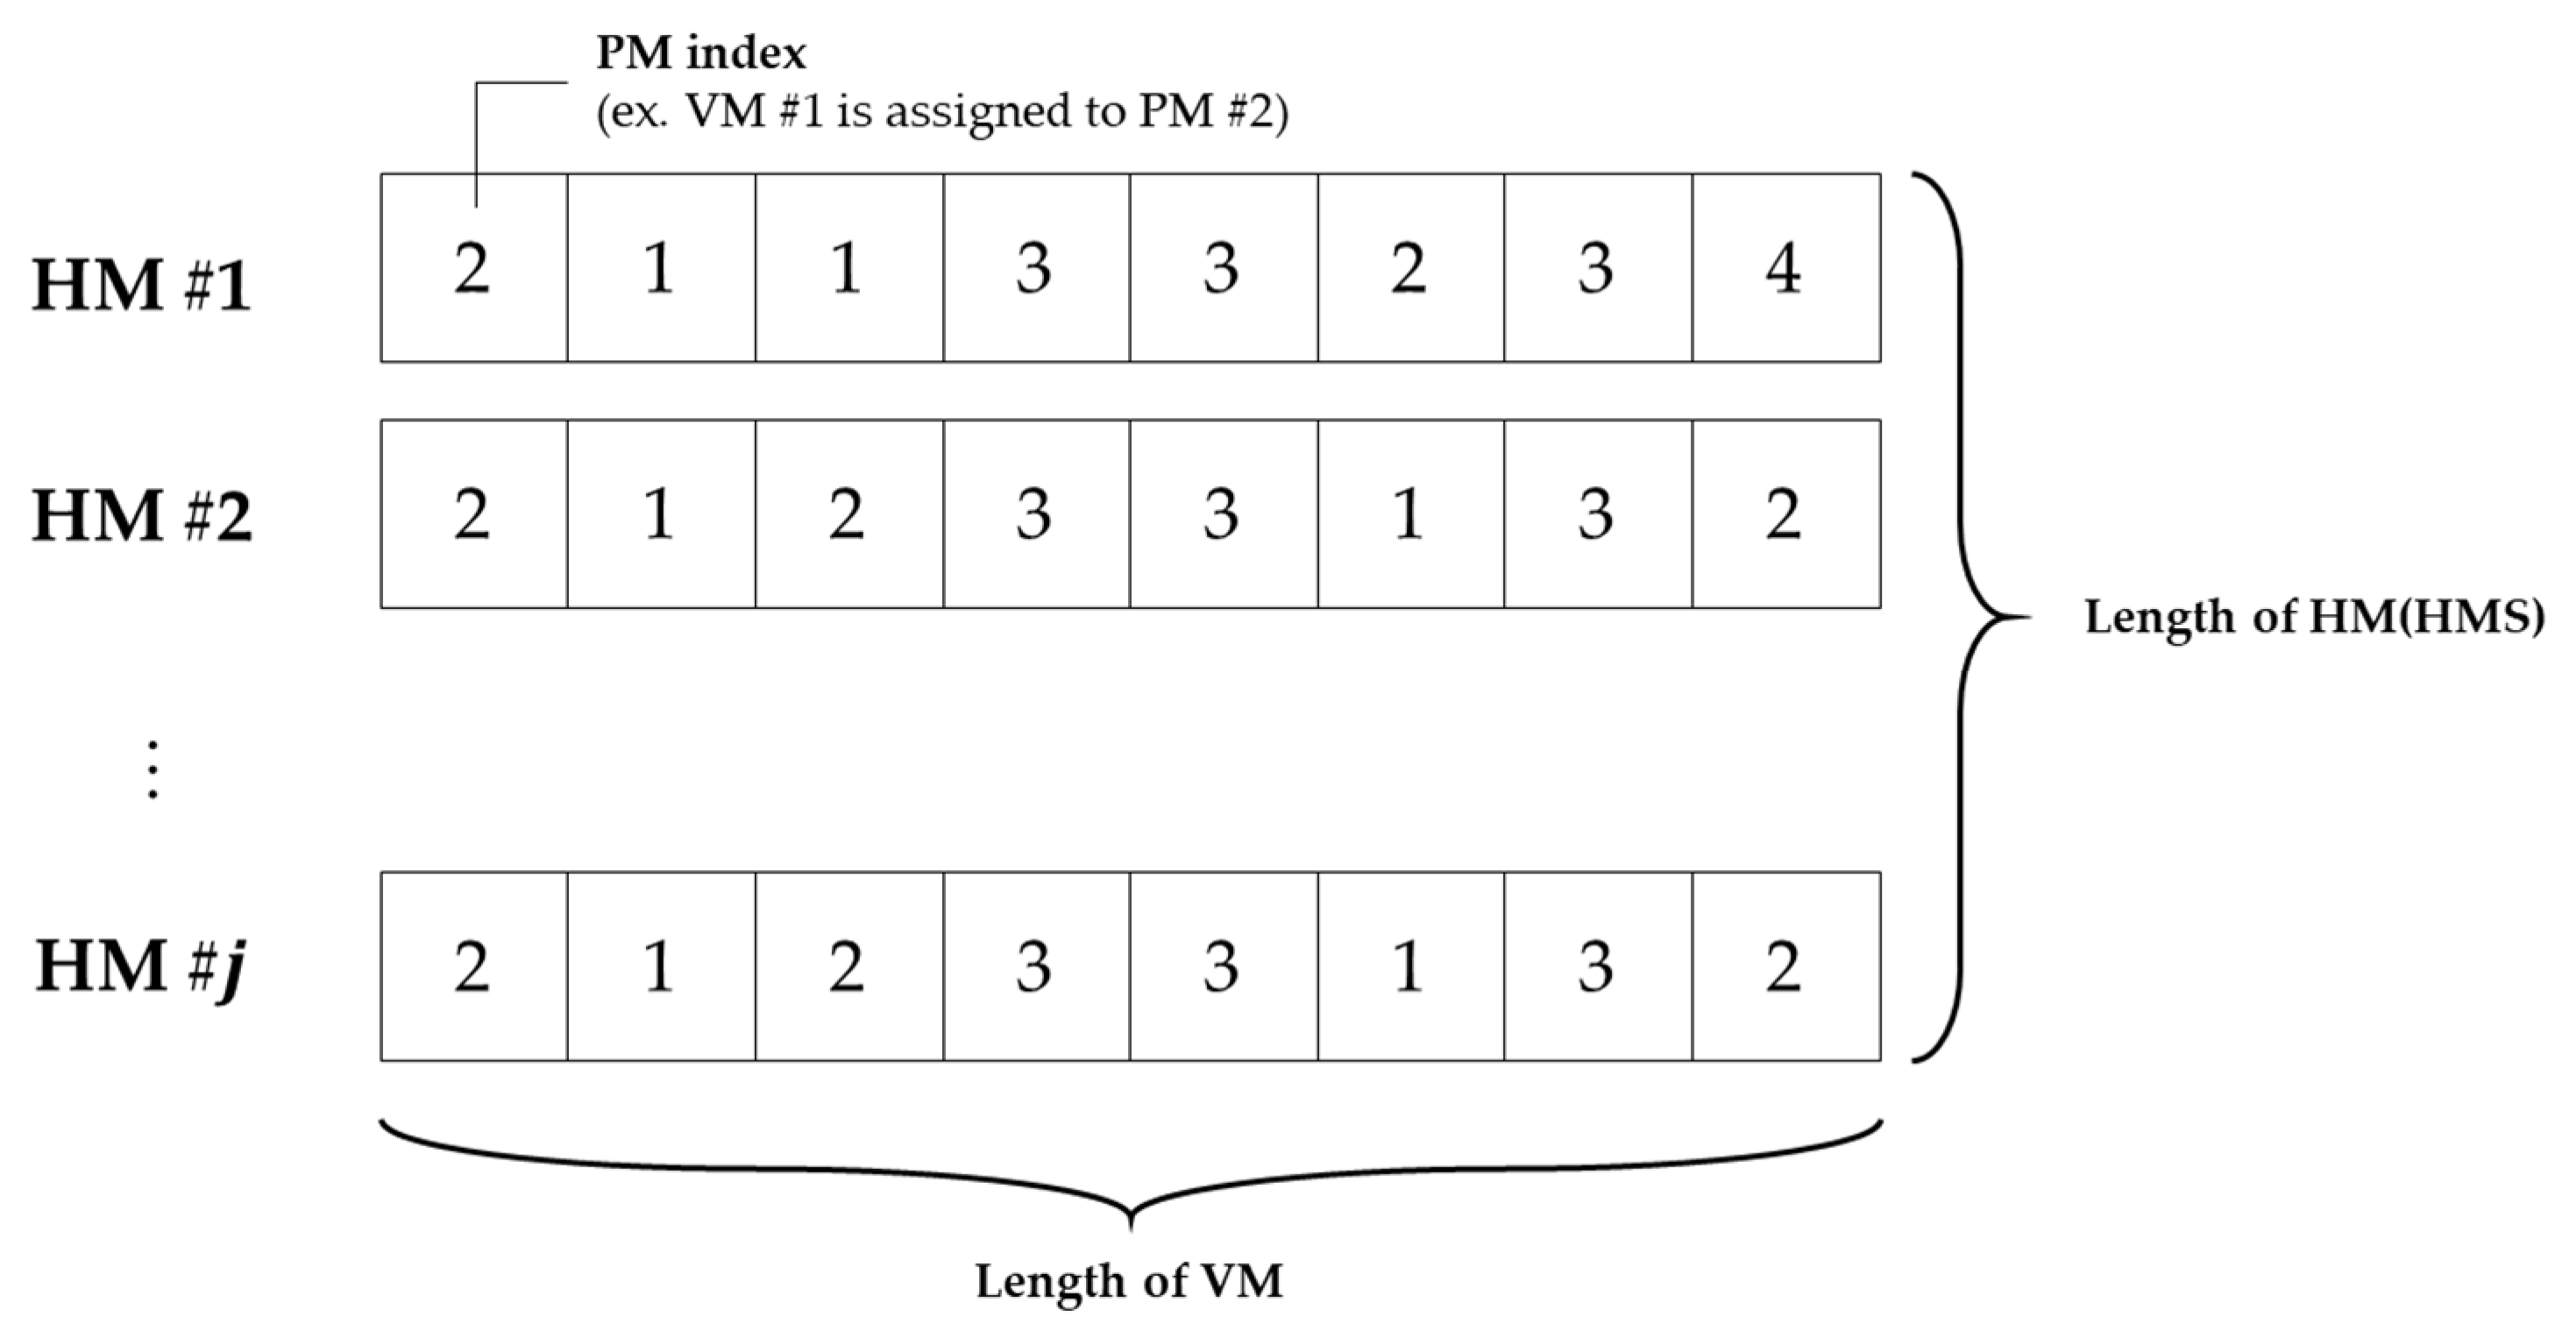
4.2.1. Solution Representation
For VM placement, HM contains the PM–VM mapping information, which is the VM assignment to PM information. One HM is in a permutation form, where each array represents the VM index, and each index value represents the PM index to which the VM is assigned. This solution representation is schematically shown in
Figure 5.
4.2.2. Pitch Adjustments of HS for VM Consolidation
For HS, the most influential operator that creates a significant neighboring solution is the PA. The HMC is the standard for neighborhood search, and randomization contributes to avoiding the local solution. Their suitable combination plays an important role in creating an improved solution. The PA is designed to demonstrate high performance and search for an efficient solution for the VM consolidation model. In VM consolidation, VM migration occurs when either overload or underload of the PM workload is detected. The contrapositive of the proposition mentioned above becomes “if overload or underload of the PM workload does not occur, then VM migration is not necessary”. Ultimately, if the PM workload remains constant, the VM need not migrate. As shown in
Figure 6, if a VM with the inverse workload is combined, the PM workload remains constant, and the VM can achieve sustainable operation by minimizing DC power consumption and VM migration, which is the objective of VM consolidation. The measure indicating the degree of stability of the PM workload is calculated as the standard deviation of the workload time-series data. The closer the standard deviation is to 0, the more stable is the workload.
When generating a new HM, the first random number is generated based on the length of the VM, and whether MC or randomization is performed is determined collectively. Next, the MC generates a second random number for the determined VM index and determines whether it is a PA. Applying PA to the corresponding VM means selecting the VM to be migrated, which corresponds to VM selection in VM placement. The VM selection consists of three cases.
First, a VM allocated to a PM with detected overload is selected. When PM overload occurs, it violates the SLA, so the VM of the PM must be migrated. For this reason, the VM located in the PM where overload is to be detected is always selected. Second, a VM allocated to a PM that can be idle is selected probabilistically. Since VM consolidation aims to minimize the power consumption of the DC, it is necessary to select a PM that can idle the server. A PM capable of idle conversion is a PM that has an assigned number of VMs of 1 or less or is classified as underload by a specific condition (THR, MAD, IQR, etc.), and a VM assigned to the corresponding PM is selected probabilistically. Third, when a specific VM is migrated, a VM with high workload stability is selected probabilistically. When the VM is migrated to each PM, the PM stability (
) measure calculates the workload of the PM
by summing the workload of the VMs (
) assigned to each PM as shown in Equation (12), the average of the workload for all PMs (
) as shown in Equation (13), and is calculated as the standard deviation between each workload and the average as shown in Equation (14).
The smaller the value, the higher is the stability measure, and it is considered a VM with a higher priority to migrate to another PM. Among the VMs that can be migrated, a higher level VM with a high stability measure is randomly selected. This VM selection rule was defined as a stability correlation (SC) policy. A second random number is generated for the VM index selected under the above three conditions, compared with PAR, and whether or not the PA is determined.
The VM whose PA is determined generates a neighboring solution by adding the values in the BW, which is the same as the concept of migrating the VM to the destination PM. The feasible PM list that can migrate the VM thus becomes the bandwidth, and the roulette-wheel-based weighted selection is made based on the stability measure.
4.2.3. Procedure of HS for VM Consolidation
The proposed VM consolidation model aims to achieve its original purpose of reducing the DC power consumption while deriving stable operation by searching for combinations of stable VM and reducing unnecessary VM migrations. To explore the stable workload combinations hereafter, an environment that can predict the workload is assumed based on the VM workload collected. Workload prediction is an essential process for resource allocation, capacity planning, and energy savings in dynamic cloud computing environments [
39]. VM consolidation utilizes a separate monitoring tool to detect overload or underload of the PM workload. When certain conditions are met, VM placement is implemented based on the prediction data and resource information of the VM workload, and HS is utilized to find the optimal PM–VM mapping information. The pseudo code representing the proposed VM consolidation model is shown in
Table 1.
To implement VM placement, the initial value for the HS parameters (HMS, HMCR, PAR, and BW) are set at the beginning of the algorithm (line 3), PM–VM mapping information for consolidation is entered and duplicated for the same number of times as the HMS (line 4). The HS method uses the MC, PA, and RS to generate a new HM with improved objective value through repeated iterations (line 7–37). The new HM is generated sequentially through HS operators for the length of HM (number of VMs) (line 9–28). The first number is randomly generated between 0 and 1 to determine the existence of the MC and randomization collectively (line 10–15). Then, the second random number is generated to determine the existence of PA (line 22–28). If the second random number is smaller than PAR, then the neighborhood solution is generated using PA (line 29–30). The method of generating the neighborhood solution and the conditions of determining the PM that is migrated to the VM are described in
Section 4.2.2. If the new HM generated has a better objective value than the worst HM from the existing HMs, the new HM is replaced with the worst HM (line 34–36). Although the objective value is worse, even when the stability of the PM is improved, the worst HM is replaced with the new HM. When the stopping condition is met, the HS terminates and VM migration occurs with the newly generated PM–VM mapping result (
x′) (line 38).
4.3. Adaptive Harmony Search for Parameter Setting
Metaheuristic algorithms can be applied to a variety of problems, but the process of appropriate parameter setup for different problems should be performed. In addition, since these algorithms are based on probability, it is common to conduct statistical analysis on repeated experiments; the number of iterations here can be a disadvantage considering the combinations of parameters. Despite these efforts for the solution quality, the parameters cannot guarantee solution quality with slight changes in the nature of the problem. To overcome this disadvantage, a self-adaptive HS, which explores and obtains the parameters itself, is widely being studied. This study addresses the parameter-setting-free harmony search (PSF-HS), novel self-adaptive harmony search (NS-HS), Improved Harmony Search (I-HS) and parameter adaptive harmony search (PA-HS) to reduce the complexity of setting the parameters [
40,
41,
42,
43].
The PSF-HS, introduced by Geem et al., implements the operation type memory (OTM), which stores the operator that improves the solution during iterations. It updates the HMCR and PAR by remembering the operator contribution to the generation of the improved new HM among the HMC, PA, and RS. The characteristic of increasing HMCR and decreasing PAR with increasing number of iterations is maintained to improve search efficiency by increasing the global search at the beginning of the iteration and increasing the local search towards the end of the iteration.
Based on the NS-HS proposed by Luo, which finetunes the improvisational music by a musician from the beginning to end, a self-adaptive variant that does not consider the PAR is proposed. The HMCR is calculated by substituting
, the dimension of the problem. The BW is calculated by utilizing the number of iterations
, number of improvisations
, and standard deviation of the HM objective function values
to reflect the finetuned characteristic of exploring the solution wider at the beginning and narrower towards the end. The generation of the new HM uses two random numbers,
U[0, 1] and
U[−1, 1], for the HMCR and dynamic BW.
Mahdavi et al. proposed the I-HS, which increased the diversity of solution vectors at the beginning of the search and converges to the optimal solution through fine tuning as it goes to the end. As the number of iterations continues, the value of PAR decreases, and the fatigue of repeated experiments can be reduced compared to Original HS with fixed parameters.
Kumar et al. and Mahdavi et al. proposed the PA-HS, which improves upon the I-HS that is characterized by the dynamic changes to the PAR and BW for each iteration. The PAR increases linearly and BW decreases exponentially within this range. Kumar et al. proposed that the HMCR and PAR be dynamically set and changed to linear and exponential forms through iterative calculations.
6. Conclusions and Future Study
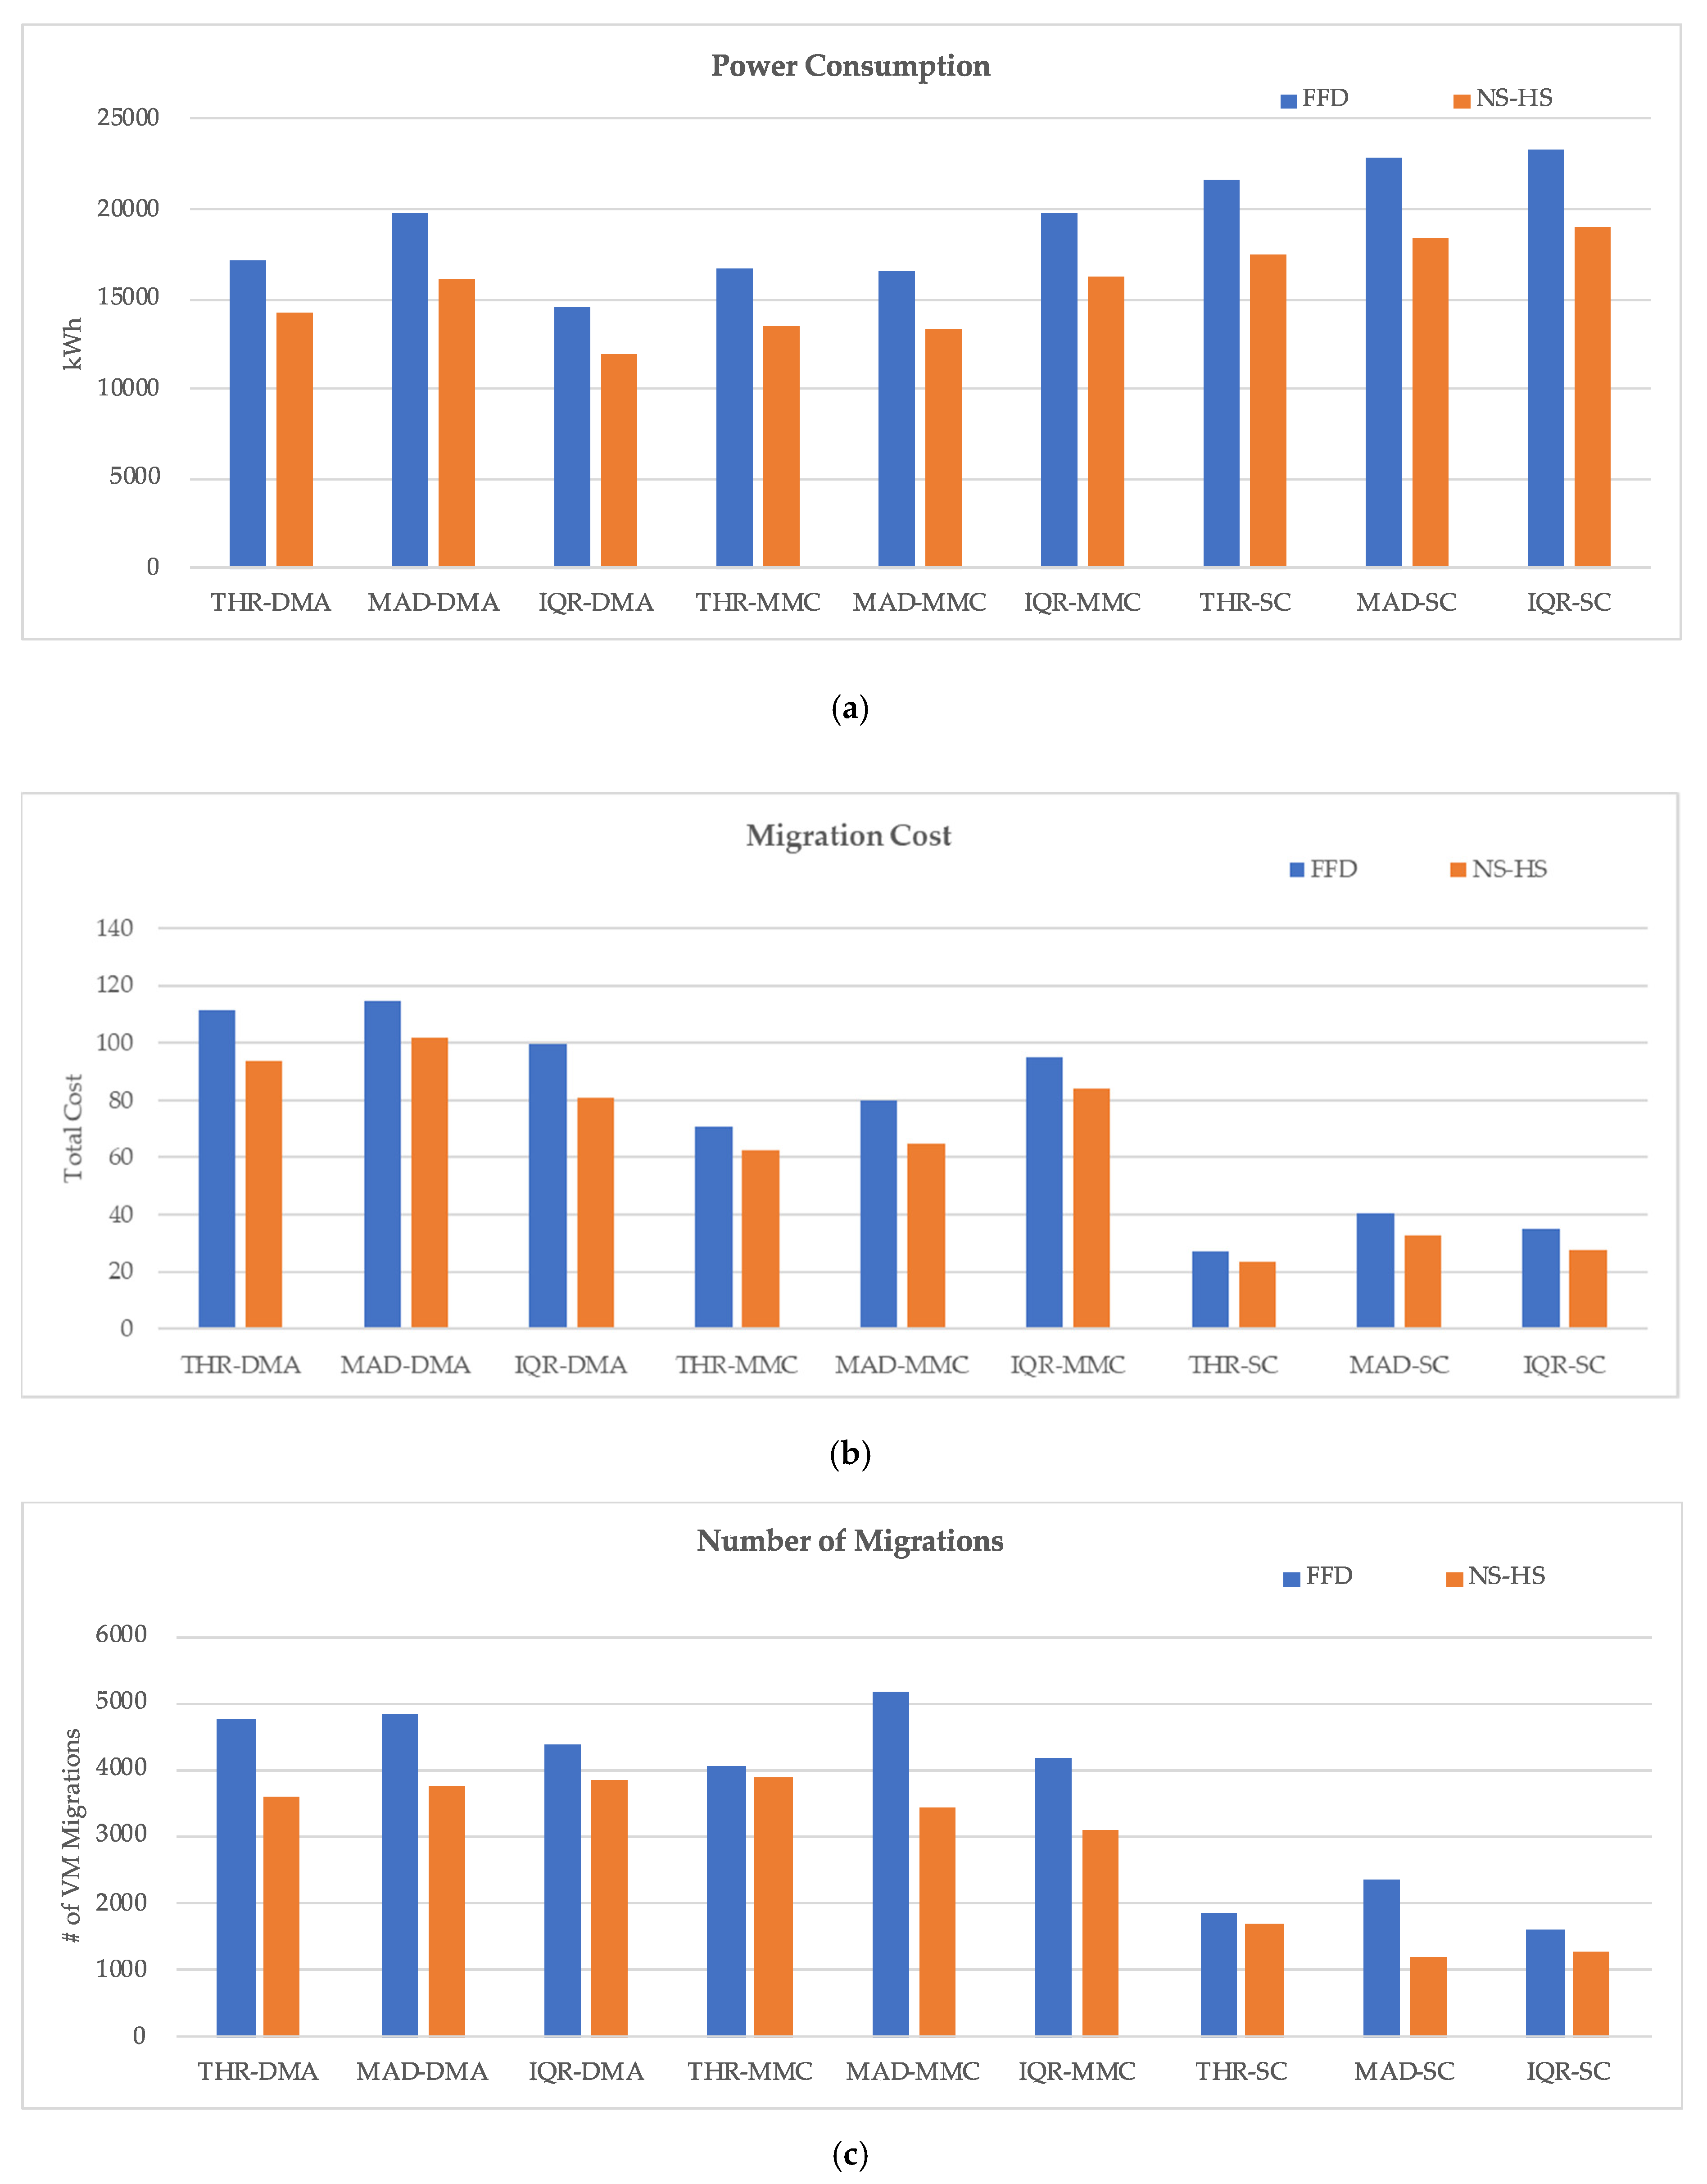
In this study, we proposed a VM consolidation model to induce stable operation of a DC by exploring VM combinations, where the sum of the workloads remain stable, to reduce the power consumption of the DC. The HS scheme is designed to efficiently solve the proposed VM consolidation model, and the adaptive HS, where the parameters change dynamically, is applied. The adaptive HS shows better results than the original HS, and comparative analysis with the heuristic algorithm FFD shows that the proposed algorithm also has superior performance compared to the conventional approaches. In particular, when the SC policy, which searches for a combination of VMs in which the workload of the PM is stably maintained, showed excellent results in terms of the quality of the DC operation environment than other policies.
Benchmark data were used for the VM workload, and the VM workload was forecast to apply the proposed VM consolidation model to real world applications. In dynamic cloud computing environments, workload forecasting is an essential process for resource assignment, capacity planning, and energy savings. In a future study, an integrated VM consolidation model that combines the proposed VM consolidation model and a workload prediction subsystem will be explored. Through this, we intend to improve the limitations of this study, assuming the VM workload as a definite value.
The workload prediction subsystem in the integrated VM consolidation model would be expected to cluster similar VMs through behavioral analyses, and each cluster would be used as a unit of the learning model. The clustering forecast technique is aimed at maintaining unique patterns of VMs while increasing the management efficiency of the learning model with appropriate numbers of clusters. In the future study, the integrated VM consolidation model combining the proposed model in this study and a clustering forecasting technique that is appropriate for large-scale DC environments will be considered.
Till date, DCs have generally adopted conservative operation measures that prioritize environmental stability owing to uncertainties. As a large number of organizations are migrating to cloud-based computing environments, the scale of the DC, which has been characterized as “Bigger is Better” is expected to grow exponentially in the future. Therefore, intelligent cloud integrated management platforms utilizing advanced technologies, such as artificial intelligence and big data analysis, along with stable and efficient automatic operation strategies must be considered so that future researches will be aimed at these goals.


