Multiphysics Modeling, Sensitivity Analysis, and Optical Performance Optimization for Optical Laser Head in Additive Manufacturing


1
Singapore Institute of Manufacturing Technology, 73 Nanyang Drive, Singapore 637662, Singapore
2
School of Mechanical and Aerospace Engineering, Nanyang Technological University, 50 Nanyang Avenue, Singapore 639798, Singapore
*
Authors to whom correspondence should be addressed.
Appl. Sci. 2021, 11(2), 868; https://doi.org/10.3390/app11020868
Submission received: 16 December 2020
/
Revised: 6 January 2021
/
Accepted: 15 January 2021
/
Published: 19 January 2021
(This article belongs to the Special Issue Advancements in Laser Based Additive Manufacturing Technologies)
Abstract
:Optical laser head is a key component used to shape the laser beam and to deliver higher power laser irradiation onto workpieces for material processing. A focused laser beam size and optical intensity need to be controlled to avoid decreasing beam quality and loss of intensity in laser material processing. This paper reports the multiphysics modeling of an in-house developed laser head for laser-aided additive manufacturing (LAAM) applications. The design of computer experiments (DoCE) combined with the response surface model was used as an efficient design approach to optimize the optical performance of a high power LAAM head. A coupled structural-thermal-optical-performance (STOP) model was developed to evaluate the influence of thermal effects on the optical performance. A number of experiments with different laser powers, laser beam focal plane positions, and environmental settings were designed and simulated using the STOP model for sensitivity analysis. The response models of the optical performance were constructed using DoCE and regression analysis. Based on the response models, optimal design settings were predicted and validated with the simulations. The results show that the proposed design approach is effective in obtaining optimal solutions for optical performance of the laser head in LAAM.
1. Introduction
Laser technology has played an important role in advanced manufacturing processes, including 3D additive manufacturing (AM), welding, cutting, and micro/nano processing, etc. With low-cost, higher-power laser sources widely available to many manufacturing industries, there is a growing transition trend using high-power lasers in the multi-kilowatt (kW) range for material processing. The benefits of these high-power lasers are (1) scaling-up processing productivity by increasing the laser spot size, the hatch spacing, and layer thickness and (2) expanding more materials such as refractory and highly reflective metals and ceramics, which usually need higher-power lasers [1]. However, laser material processing using high-power lasers may also create new challenges such as thermal-induced effects [2,3]. A high-power laser beam passing through an optical lens could locally heat up the optical elements in the laser head. The nonuniform temperature distribution will then induce thermal deformations, changes in temperature-dependent refractive properties, and thermal stress in both optical and mechanical components. The above phenomena will have an adverse impact on optical lens distortions, laser beam focal shift or defocusing errors, and even degradation of laser power irradiation quality, which detrimentally affect the manufacturing process and product quality [4,5]. In order to mitigate these thermal effects, an optimal design of the optical laser head is desired to minimize the effect of the sources of thermal environmental changes in high-power laser material processing.
The optical laser head for material processing, such as in welding and additive manufacturing, is an integrated structural-thermal-optical system. Therefore, a systematic design and modeling strategy is required. Traditionally, optical design and mechanical design simulations are conducted separately or sequentially due to a lack of a design and modeling data shared platform. Recently, a combined structural-thermal-optical-performance (STOP) analysis approach was proposed as a systematical design modeling solution for performance improvement in the telescope, camera, and precise optical instrument applications [6,7,8,9]. Model data mapping approximated from one physics model to another model was adopted. Thermal effects in the protective window during different selective laser meting (SLM) scanning processes were also analyzed by using a multiphysics simulation model [10]. However, there are few references relating the use of the STOP simulation approach in designing and optimizing an optical laser head. On the other hand, product design optimization through the design of computer experiments (DoCE) is an efficient and practical engineering approach in developing manufacturing processes. Sensitivity analyses by DoCE can further evaluate the sensitive effects of design parameter settings on product performance. The purpose of a sensitivity analysis is to find optimal design settings of the input variables so that optimal performance can be achieved. Over the past years, the response surface model (RSM) has been widely employed in product design and optimization for best performance. RSM utilizes a set of statistical and mathematical methods to predict the robustness and optimal design [11,12]. It was initially developed in design optimization based on experiments or field testing by building a polynomial mathematical model between independent design variables and dependent responses [13,14]. Based on the fitted mathematical model, optimal responses were predicted using the optimization technique and validated with experiments. Now, RSM-based DoCE is also used in the simulation-based optimal product and process design in many industrial applications [14,15,16].
Additive manufacturing using lasers has been attracting more and more interest in both academia and industry applications for processing high-value-added components. Power-blown and wire-fed laser-aided additive manufacturing (LAAM) has shown great potential in surface modification, repair, as well as 3D printing advanced materials [17,18,19,20,21]. Compared with powder feeding, coaxial wire feeding has advantages in processing materials with low melting points [22,23,24,25,26,27,28], such as aluminum and magnesium alloys, to avoid explosions when using powders. Furthermore, the costs saved are also very attractive, as wire is much cheaper than powder.
The objective of this paper is to build a multiphysics model for developing an optical laser head for laser-aided additive manufacturing (LAAM) and to use the DoCE technique followed by the RSM as an efficient design approach to optimize the optical performance of a laser head. The performance responses are evaluated by developing a coupled structural-thermal-optical-performance (STOP) simulation model. In the following section, the design, modeling, and sensitivity analysis using coupled STOP analysis are firstly described by illustrative design cases. Then, the application of RSM is introduced as a DoCE design and optimization procedure. Furthermore, a number of experiments are designed and analyzed using the STOP simulation models. The fitted response models are constructed by regression analysis. The optimal design settings are predicted through optimization techniques and validated with the simulation models. Finally, the laser head is fabricated and tested to verify the performance.
2. Design, Modeling, and STOP Simulation of an Optical Laser Head for LAAM
2.1. Optical System and Structural Design
Figure 1 shows a schematic CAD drawing of the optical laser head. It integrates multiple optical and mechanical components to perform highly efficient laser beam delivery. The optical elements such as lenses and mirrors are made of fuse silica, while the materials of the mechanical components are stainless steel. In addition, the reflective prism is made of copper. The coaxial laser beam path design is given in Figure 2. A laser beam transmits through a set of designed lenses including the collimating lenses and focusing lenses. Then, the laser beam is split into two sub-beams by the reflected prism towards the two scanning side mirrors and, consequently, re-focuses the two sub-beams to the same point on the workpiece. The mechanical components were designed to house the whole laser delivery systems with high structural stiffness for operating stability and effective thermal management capability. The entire optical laser head is cooled by the internal water channels embedded in the housing structure.
2.2. Structural-Thermal-Optical-Performance (STOP) Modeling
After simplifying the geometry model, a meshed model of the whole optical laser head was created in COMSOL, as shown in Figure 3. The laser-irradiated areas such as the lenses and mirrors were modelled with fine meshes (minimum element size is 10 μm), while the other zones were modelled with coarse meshes to maintain computation accuracy as well as to reduce simulation time. The whole model consists of three physics-based models: a thermal model, a structural model, and a ray-tracing optical model. The total number of the elements is about 430 k. The output and input data interfaces were implemented for the STOP analysis. In this study, the former two models were sequentially coupled and simulated in a stationary domain, while the ray tracing optics model was simulated in the time-dependent field.
For the thermal model, the partial differential equation (PDE) of heat conduction (Fourier’s Law) is given by
where kx, ky, and kz are thermal conductivities (W/mK) in x, y, and z directions, respectively; T is the temperature (K); and Qr is the input laser energy density (W/m3) due to absorption and reflection by laser beam irradiation. The thermal boundary condition is governed by
where h is the convection coefficient. Equation (1) was used to obtain the steady-state temperatures. The temperatures were applied to the structural model as the thermal loading. The thermal-induced displacements and stresses were calculated by the following elasticity equilibrium equation (Hooke’s Law) with the thermal expansion equation:
where σ is stress, E is elastic modulus, ε is strain, σ is thermal expansion coefficient, T0 is temperature at initial time, and εth is thermal strain.
The optical model adopted ray-tracing approach, which computed the angles of each ray emitting or refraction based on Snell’s Law equation. However, ray paths could be changed due to the thermally deformed geometry and temperature-dependent refractive index. The ray heating source is represented by
where Qj (W/m3) is the laser power transmitted by the jth ray, Nr is the total number of rays, and μj is ray power coefficient in the jth ray. Since the optical components such as lenses focusing the laser beam are almost completely transparent, the amount of heat generated in these optical components can degrade the ability of the system to correctly focus the beam. In this study, the laser power in an absorbing medium (lens) is assumed to decay exponentially as the wave propagates, assuming the absorption coefficient remains constant:
where Q0 is the laser source power, λ0 is the free-space wavelength, c is the speed of light in a vacuum, and t is the current time. The complex-valued refractive index is expressed as n − κi, where n and κ are dimensionless real numbers.
The flowchart of the STOP simulation procedure is depicted in Figure 4. Firstly, the laser beam parameters and laser power, material properties, and structural and thermal boundary conditions were defined in the geometry model. The laser heating flow on the surfaces of optical lenses was initiated as an absorbent heat source. The temperature distribution was computed by finite element method (FEM) based thermal analysis. Combined with the integrative constraints on the optical system design and housing structures, the deformations of the optical components and structural housing were calculated by FEM base structural analysis under the thermal-force coupling conditions (thermal expansion coefficient). Next, based on the temperature-dependent thermo-optic dispersion coefficient and deformed optic lens from structural analysis, the ray-tracing optical simulation model computed the optical performance such as ray paths, spot size, laser beam intensity, and deposited ray power. If the convergence criterion (self-consistent) was unsatisfying, the process with the adjusted deposited ray power went back to the heat sources. Such an iterative process was repeated until it met the convergence criterion.
2.3. Thermal Effect on Optical Performance with Sensitivity Analysis
One design example of the laser head with a 1064-nm fiber laser beam at a designed 300-μm spot radius size with 1.634 kW laser power output utilized for the STOP simulation. The cone-shaped laser beam was incident perpendicular to the center of the front surface of the collimating lens, as shown in Figure 2. In the original design, a 302-μm root-mean-square (RMS) spot radius size at the focal plane position was obtained by using ray-tracing optical simulation only. The incident optical intensity was calculated at 4630 W/mm2. Unlike ray tracing optical simulation, the STOP simulation model includes thermal effects due to high power laser heating and mechanical and thermal boundaries. The following thermal and mechanical boundary conditions of the STOP simulation were assumed:
- (1)
- the ambient surrounding working condition at the temperature T0 = 293 K;
- (2)
- heat convective coefficientshn = 5 (W/m2K) for all exposed surfaces of the housing andhc = 1500–3500 (W/m2K) for cooling water channel plates;
- (3)
- surface emissivity set at 0.1 at the reflected mirrors due to the copper coating; and
- (4)
- one side of the laser head mounted on the fixed plate via the screws.
In the STOP simulation, thermal and optical properties of the lenses and mirrors were adopted as the temperature-dependency model. However, material properties of the housing metal components (stainless steel and copper) at room temperature were used due to smaller temperature changes in the range of 30–80 °C in this study. They are summarized in Table 1.
The solution was converged in five iterative processes of the STOP simulation. The simulated temperature and thermal-induced deformation distributions are shown in Figure 5. The temperature rises to Tmax = 179 K at the collimating lens, and the maximum thermal-induced deformations are 47.7 μm and 47.2 μm for the housing and the reflected mirrors, respectively. Figure 6 displays the temperature and deformation distributions of the focusing lens. It is observed that the temperature and deformation distributions are not placed centrically with small eccentric gaps. In the current design, the lenses are fully fitted into the ring structures. However, the mechanical components surrounding the rings may not be all cylinder shapes, as shown in Figure 1. It will generate unequal heat dissipation in the radial direction. In addition, one side of the laser head is mounted on the fixed plate via screws. Such a boundary condition may also result in temperature-induced radial gradient deformations with smaller eccentric gaps. Consequently, these thermal-induced deformations cause the lens to warp at 4-μm differences in the radial direction, which will affect the laser beam focusing spot size and laser irradiation intensity.
The calculated thermal-induced optical laser beam intensity and the root-mean-square (RMS) spot radius size at the focal plane position are presented in Figure 7. The optical performances at the same focal plane position computed by using ray-tracing simulation only are also given in the figure for comparison. The results indicate that the high-power laser beam generates a direct thermal influence on laser beam intensity and focal spot size in the operating condition. From Figure 7, it is shown that the RMS spot radius size with STOP is 16.5% less than one with ray-tracing simulation only while optical intensity is 2.6% more than the results by ray-tracing simulation. It is expected that thermal effects with higher than a 1.634 kW laser power level can generate significant impacts on the optical performance variations, such as laser beam irradiation quality. These optical performance variations will eventually affect laser intensity quality in manufacturing processing.
Figure 8 shows the RMS spot radius and optical intensity under 1.634 kW and 3.364 kW laser power levels as a function of the focal plane positions. From the plot, it is shown that the designed RMS spot radius at the same focal plane position is directly proportional to a rise in the laser power level. However, the optical intensity has no such linear relationship with the increasing laser power level as it is also inversely related to the squared spot radius. Figure 9 plots the RMS spot radius and optical intensity as a function of laser power at the original focal plane position (Fz = −0.1 mm). It is seen that the RMS spot radius has similar changes. However, the optical intensity may reach a peak at 2.0-kW laser power between 1.634 kW and 3.364 kW. Figure 10 shows the optical intensity distributions irradiated by 1.634 kW and 3.364 kW laser power, respectively, with the focal plane location at 0.1 mm. It is seen that different laser power levels generate different power density distributions.
3. Optimization with Design of Computer Experiments
In this study, the aim of design optimization is to achieve homogeneous laser power density distribution I at focus plane with laser spot radius Rrms at 300 μm. The proposed design is a constrained optimization problem. It is defined as a maximum value of I, subject to the constraint that Rrms must be limited at 300 μm within an allowable tolerance ε, which can be represented by
To achieve this, we used the DoCE and response surface models. The response surface model includes two types of inputs: controllable variables and uncontrollable variables. The controllable variables were inputs that can be specified freely by engineers. The uncontrollable variables were those that vary according to the environmental uncertainty that the engineers have no direct control. Here, two input design variables, laser power (P), and laser beam focal location (Fz) were considered controllable variables, while water cooling indicator h (here, convection coefficient was used for simplification) was an uncontrollable variable. It was because the water cooling indicator had a dynamically varying range controlled by manufacturing process environmental conditions.
For the response surface models, a set of experiments was conducted to obtain the laser power density distribution and spot size at focal plane positions under different levels of the input design variables. We adopted a modified central composite design (CCD) [11] for the current simulation-based experiment designs. The modified CCD design can include the main effects of the controllable and uncontrollable variables, the quadratic effects of controllable variables, and interactions between the controllable and uncontrollable variables.
The design variables and the related coded levels are summarized in Table 2. The performance responses of laser power density I and RMS spot radius Rrms at laser beam focal plane were considered as output variables. The thirteen experimental designs by RSM and the results of the different response values computed by the STOP simulations are presented in Table 3.
A quadratic polynomial approximation model for RSM is used in the form given in Equation (8) so that the second-order interactions (cross-product terms) can be modeled as
where Yu represents the response characteristic of I or Rrms in the uth experiment; β0, β1, β2, β11, β22, β12, γ, δ1, and δ2 are coefficients to be estimated; xu1, xu2, and zu represent the laser power P, laser beam focus plane position Rz, and water cooling indicator h in the uth experiment, respectively; and εu is the random error. With N experiments, the response surface model in Equation (8) can be further rewritten by matrix notation:
where
Using the least-squares method, the estimated efficient b of the coefficient can be obtained as
Finally, the fitted regression model is
Based on Equations (10) and (11), the two fitted response models are
Upon the two response models, analyses of variance were performed following the procedure introduced in [12,13]. The results reveal that the two RSM models with the R-squared (R2) = 86.2% and 99% are adequate and satisfactory from the statistical point of view. They indicate that the proportion of the variance for the predicted response is represented by the input variables or variances in the regression model. The 3D response surfaces and contours of the two response models are plotted in Figure 11 and Figure 12. From the graphical representations of the regression responses models, we can clearly observe the sensitivity relationships between the responses and the input coded variables. As shown in Figure 11a, the laser power density increases with the focal plane, shifting in a negative direction and decreasing in a positive direction. A plateau laser power exists within some optimal regions. Additionally, the RMS spot radius size increases with laser power, as shown in Figure 12a,b. On the other hand, the convection coefficient at the cooling water channel plate surfaces has little influence on both optical intensity and spot radius size, which mainly depend on laser power and focal plane position.
The optimization solution for the objective function, as represented in Equation (7), was sought using MATLAB programming. The optimal design settings were found with the maximum laser power density I = 5813 kW by laser power P = 2.28 kW, focal location Fz = −0.1732 mm, and cooling indicator h = 1500 W/m2K. After optimization, the STOP simulation model was again used to validate the optical performance with the predicted solution by the response models. The optical performances under the predicted optimal design settings were also compared with the original design settings, as shown in Table 4. The results show that the optical intensity can achieve a 31.3% increase while RMS spot radius size maintains 0.3 mm with 0.33% tolerance. It is shown that the optimal solution using STOP can improve the optical performance in delivering higher laser power density with a targeted spot size, which are important processing parameters for laser-aided additive manufacturing.
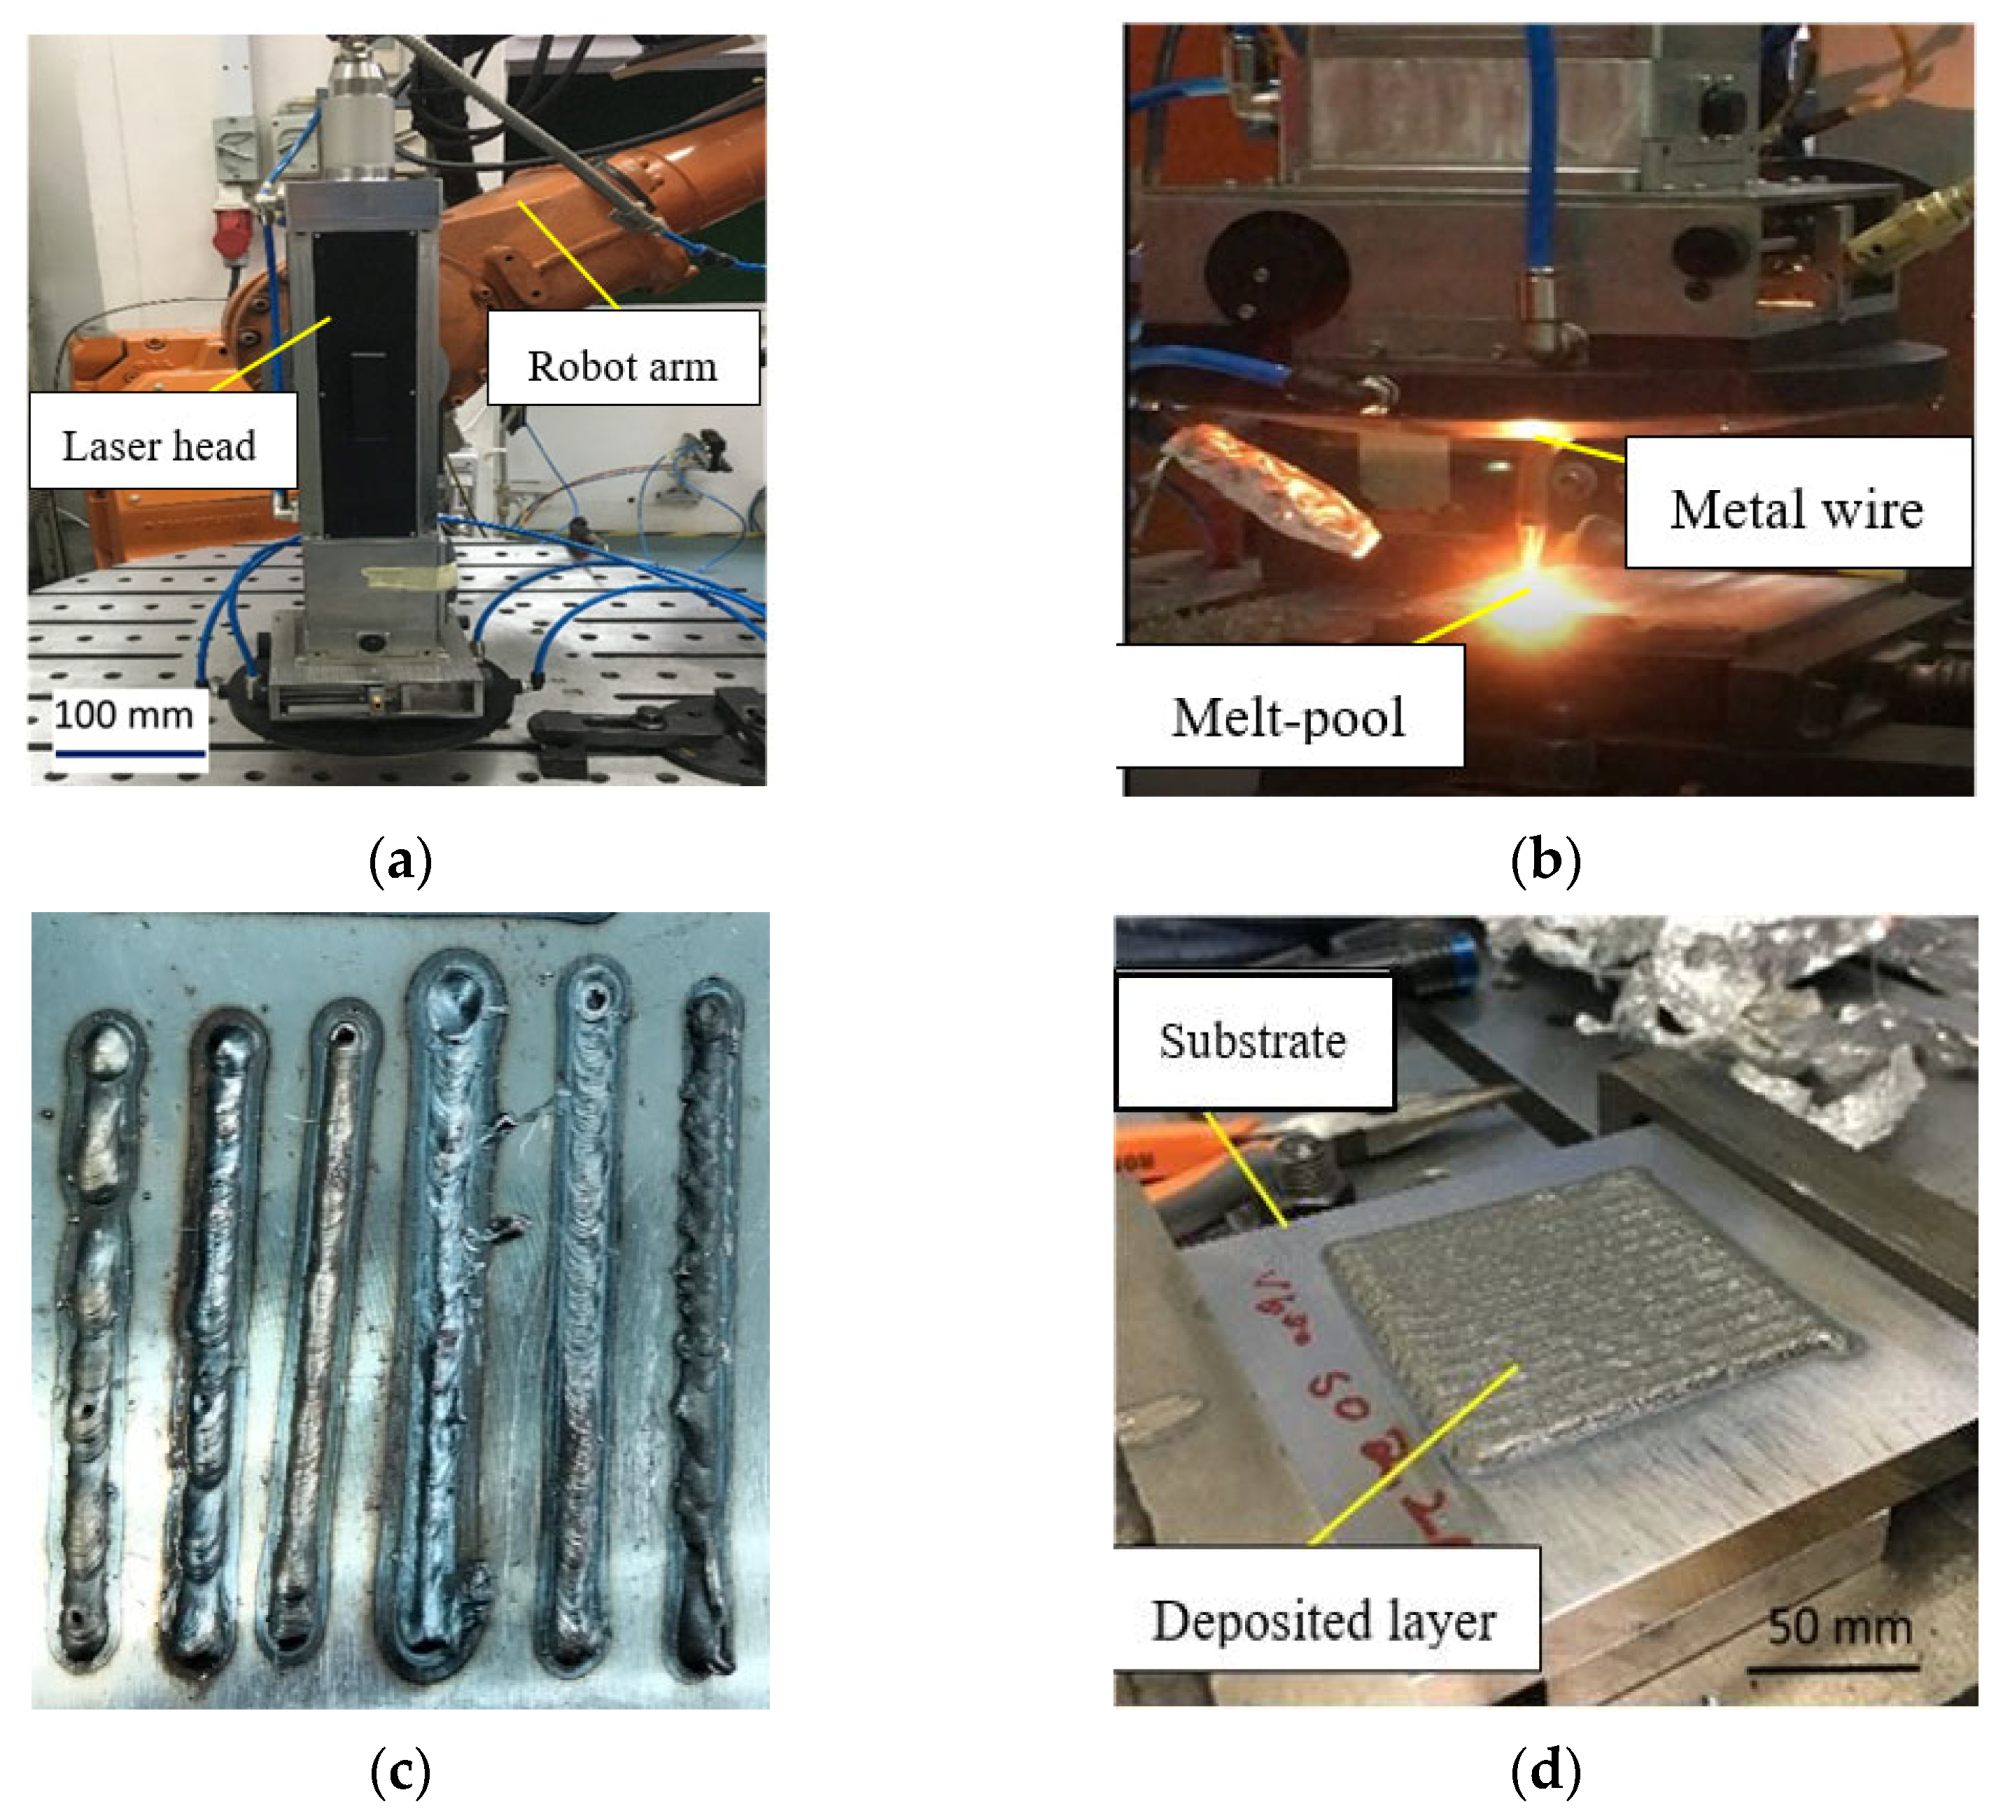
The preliminary testing result showed the effectiveness of the optimized optical performance obtained from the STOP analysis in depositing the metal wires for LAAM applications. Based on the optimized design, a laser head was fabricated and tested. The setup of the laser head in metal LAAM processing is given in Figure 13a. The optical laser head was mounted on a robot arm. During laser material processing, the metal wire generated a melt-pool on the surface of the substrate, whereas the metal wire was coaxially fed into the melt-pool. Subsequently, the wire was melted and deposited onto the substrate successfully, as shown in Figure 13b. Figure 13c,d shows the samples produced using the develop laser head. The deposited material was stainless steel 316. This research focused on STOP simulation and using it to obtain the desired optical performance. An investigation of the material’s mechanical properties was beyond the scope of this research. We did, however, conduct preliminary process development for wire-fed LAAM using the optical head, which involved not only the laser power but also other parameters such as wire feeding rate and printing speed. The outcome of preliminary process development is shown in Figure 13c, where single tracks were printed with non-optimized LAAM parameters that resulted in poor deposition quality. After the process was optimized, we were able to print a solid layer with the following parameters, as shown in Figure 13d. A laser power of 2.28 kW was used in the LAAM process for this sample, and the other process parameters were 600 mm/min printing speed, 1.7 m/min wire-feeding rate, and 2.2 mm overlap between adjacent raster lines. The resultant layer thickness was 1.5 mm. Further process development and material property investigation will be conducted in future research.
4. Conclusions
In this paper, we developed a multiphysics model that is capable of simulating the coupled structural-thermal-optical performance of a laser head in LAAM. Temperature distributions, thermal-induced deformations, optical focal spot shift, and laser intensity variations were simulated by the STOP model. The thermal effects on laser energy intensity and focal spot size were evaluated with the sensitivity analysis. The optimal design settings for the optical performance were predicted by the DoCE-based response surface models and were validated with simulations. The results indicate that the laser intensity can increase by 31.3% with a targeted 300-μm RMS spot radius for laser material processing. Thus, the proposed design approach offers designers and manufacturers a potential modeling and simulation solution for the design and optimization of a high-power laser head in laser-aided additive manufacturing processes. Furthermore, the design and optimization approach can be easily extended to include other parameters such as materials of optical and mechanical components to minimize the thermal-induced effects in laser material processing.
Author Contributions
Conceptualization, J.Y., X.Y. and G.B.; methodology, J.Y. and X.Y.; software, J.Y. and Y.C.; validation, J.Y., X.Y. and G.B.; investigation, J.Y.; resources, X.Y. and G.B.; data curation, X.Y.; writing—original draft preparation, J.Y.; writing—review and editing, X.Y. and G.B.; supervision, G.B.; project administration, X.Y.; All authors have read and agreed to the published version of the manuscript.
Funding
This research received no external funding.
Institutional Review Board Statement
Not applicable.
Informed Consent Statement
Not applicable.
Data Availability Statement
Not applicable.
Conflicts of Interest
The authors declare no conflict of interest.
References
- Laskin, J.; Faidel, D.; Laskin, V. Optics to control thermal effects in selective laser melting. Laser 3D Manuf. V 2018, 10523, 1052319. [Google Scholar] [CrossRef]
- Louca, R.G.; Yannis, K.; Jean-Pierre, K.; Brecht, V.H. On the influence of thermal lensing during selective laser melting. In Proceedings of the 29th Annual International Solid Freeform Fabrication Symposium, Austin, TX, USA, 13–15 August 2018; pp. 2267–2274. [Google Scholar]
- Huang, Z.; Meng, L.-Q.; Shen, H.; Han, Z.; Zhu, R. Analysis of influence of thermally induced aberrations on laser beam quality factor (M2) in a high-power laser system. Opt. Eng. 2018, 57, 1. [Google Scholar] [CrossRef]
- Thiel, C.; Stubenvoll, M.; Schäfer, B.; Krol, T.A. Reliable beam positioning for metal-based additive manufacturing by means of focal shift reduction. In Macro Processing: Additive Manufacturing; WLT: Munich, Germany, 2015. [Google Scholar]
- Laskin, J.; Laskin, V.V.; Ostrun, A.B. Influence of thermally induced aberrations on resulting intensity distribution. High-Power Laser Mater. Process. Appl. Diagn. Syst. VII 2018, 10525, 1052506. [Google Scholar] [CrossRef]
- Turella, A.; Della Corte, V.; Paolinetti, R.; Palumbo, P.; Amoroso, M.; Castronuovo, M.; Mugnuolo, R. Structural-Thermal-Optical-Performance (STOP) analysis for the prediction of the line-of-sight stability of JANUS camera on board JUICE ESA mission. Opt. Model. Syst. Align. 2019, 11103, 111030E. [Google Scholar] [CrossRef]
- Scola, S.; Stavely, R.; Jackson, T.; Boyer, C.; Osmundsen, J.; Turczynski, C.; Stimson, C. Development and implementation of a generic analysis template for structural-thermal-optical-performance modeling. Opt. Model. Perform. Predict. VIII 2016, 9953, 99530A. [Google Scholar] [CrossRef]
- Gracey, R.; Bartoszyk, A.; Cofie, E.; Comber, B.; Hartig, G.; Howard, J.; Sabatke, D.; Wenzel, G.; Ohl, R. Structural, thermal, and optical performance (STOP) modeling and results for the James Webb Space Telescope integrated science instrument module. Model. Syst. Eng. Project Manag. Astron. VI 2016, 9911, 99111. [Google Scholar] [CrossRef] [Green Version]
- Buleri, C.; Kehoe, M.; Lukashin, C.; Jackson, T.; Beckman, J.; Curtis, A.; Edwards, B.; Owen, T.; Phenis, A.; Stebbins, M. Structural, Thermal, and Optical Performance (STOP) analysis of the NASA ARCSTONE instruments. Photon. Instrum. Eng. VI 2019, 10925, 1092503. [Google Scholar] [CrossRef]
- Bonhoff, T.; Poppe, M.; Stollenwerk, J.; Schleifenbaum, J.H.; Loosen, P. Multi-physical analysis of thermo-optical effects for different Selective Laser Melting (SLM) scanning strategies. Procedia CIRP 2018, 74, 97–101. [Google Scholar] [CrossRef]
- Borror, C.M. Response Surface Methods for Experiments Involving Noise Variables; UMI: New York, NY, USA, 1998. [Google Scholar]
- Gunst, R.F.; Myers, R.H.; Montgomery, D.C. Response Surface Methodology: Process and Product Optimization Using Designed Experiments; John Wiley and Sons: New York, NY, USA, 1995. [Google Scholar]
- Khuri, A.I.; Cornell, J.A. Response Surfaces: Design and Analyses, 2nd ed.; Marcel Dekker: New York, NY, USA, 1996. [Google Scholar]
- Benyounis, K.; Olabi, A.-G. Optimization of different welding processes using statistical and numerical approaches—A reference guide. Adv. Eng. Softw. 2008, 39, 483–496. [Google Scholar] [CrossRef] [Green Version]
- Huehnlein, K.; Tschirpke, K.; Hellmann, R. Optimization of laser cutting processes using design of experiments. Phys. Procedia 2010, 5, 243–252. [Google Scholar] [CrossRef] [Green Version]
- Madrid, J.; Lorin, S.; Söderberg, R.; Hammersberg, P.; Wärmefjord, K.; Lööf, J. A Virtual Design of Experiments Method to Evaluate the Effect of Design and Welding Parameters on Weld Quality in Aerospace Applications. Aerospace 2019, 6, 74. [Google Scholar] [CrossRef] [Green Version]
- Weng, F.; Liu, Y.; Chew, Y.; Yao, X.; Sui, S.; Tan, C.; Ng, F.L.; Bi, G. IN100 Ni-based superalloy fabricated by micro-laser aided additive manufacturing: Correlation of the microstructure and fracture mechanism. Mater. Sci. Eng. A 2020, 788, 139467. [Google Scholar] [CrossRef]
- Liu, Y.; Weng, F.; Bi, G.; Chew, Y.; Liu, S.; Ma, G.; Moon, S.K. Characterization of wear properties of the functionally graded material deposited on cast iron by laser-aided additive manufacturing. Int. J. Adv. Manuf. Technol. 2019, 105, 4097–4105. [Google Scholar] [CrossRef]
- Bi, G.; Gasser, A. Restoration of Nickel-Base Turbine Blade Knife-Edges with Controlled Laser Aided Additive Manufacturing. Phys. Procedia 2011, 12, 402–409. [Google Scholar] [CrossRef]
- Weng, F.; Chew, Y.; Zhu, Z.; Yao, X.; Wang, L.; Ng, F.L.; Liu, S.; Bi, G. Excellent combination of strength and ductility of CoCrNi medium entropy alloy fabricated by laser aided additive manufacturing. Addit. Manuf. 2020, 34, 101202. [Google Scholar] [CrossRef]
- Chen, L.; Yao, X.; Xu, P.; Moon, S.K.; Bi, G. Rapid surface defect identification for additive manufacturing with in-situ point cloud processing and machine learning. Virtual Phys. Prototyp. 2020, 1–18. [Google Scholar] [CrossRef]
- Shi, T.; Lu, B.; Shi, S.; Meng, W.; Fu, G. Laser metal deposition with spatial variable orientation based on hollow-laser beam with internal powder feeding technology. Opt. Laser Technol. 2017, 88, 234–241. [Google Scholar] [CrossRef]
- Paul, C.P.; Mishra, S.; Kumar, A.; Kukreja, L.M. Laser rapid manufacturing on vertical surfaces: Analytical and experimental studies. Surf. Coat. Technol. 2013, 224, 18–28. [Google Scholar] [CrossRef]
- Thompson, S.M.; Bian, L.; Shamsaei, N.; Yadollahi, A. An overview of Direct Laser Deposition for additive manufacturing; Part I: Transport phenomena, modeling and diagnostics. Addit. Manuf. 2015, 8, 36–62. [Google Scholar] [CrossRef]
- Dwivedi, R.; Zekovic, S.; Kovacevic, R. A novel approach to fabricate uni-directional and branching slender structures using laser-based direct metal deposition. Int. J. Mach. Tools Manuf. 2007, 47, 1246–1256. [Google Scholar] [CrossRef]
- Hammeke, A.W. Laser Spray Nozzle and Method. U.S. Patent 4,724,299, 9 February 1988. [Google Scholar]
- Sato, A.; Ishikawa, Y.; Nowotny, S.; Scharek, S. Powder Metal Cladding Nozzle. U.S. Patent 7,626,136, 1 December 2009. [Google Scholar]
- Guo, W. Compact Coaxial Nozzle for Laser Cladding. U.S. Patent 7,259,353, 21 August 2007. [Google Scholar]
- Data and Properties Optics Fused Silica; Heraeus Quarzglas GmbH & Co. KG: Kleinostheim, Germany, 2019.
- Incropera, F.; DeWitt, D. Fundamentals of Heat and Mass Transfer, 2nd ed.; John Wiley: Hoboken, NJ, USA, 1985. [Google Scholar]
Figure 1.
Geometric model of the developed optical laser head.

Figure 2.
Optical delivery path design.

Figure 3.
Meshed model of the optical laser head for the structural-thermal-optical-performance (STOP) analysis.
Figure 3.
Meshed model of the optical laser head for the structural-thermal-optical-performance (STOP) analysis.
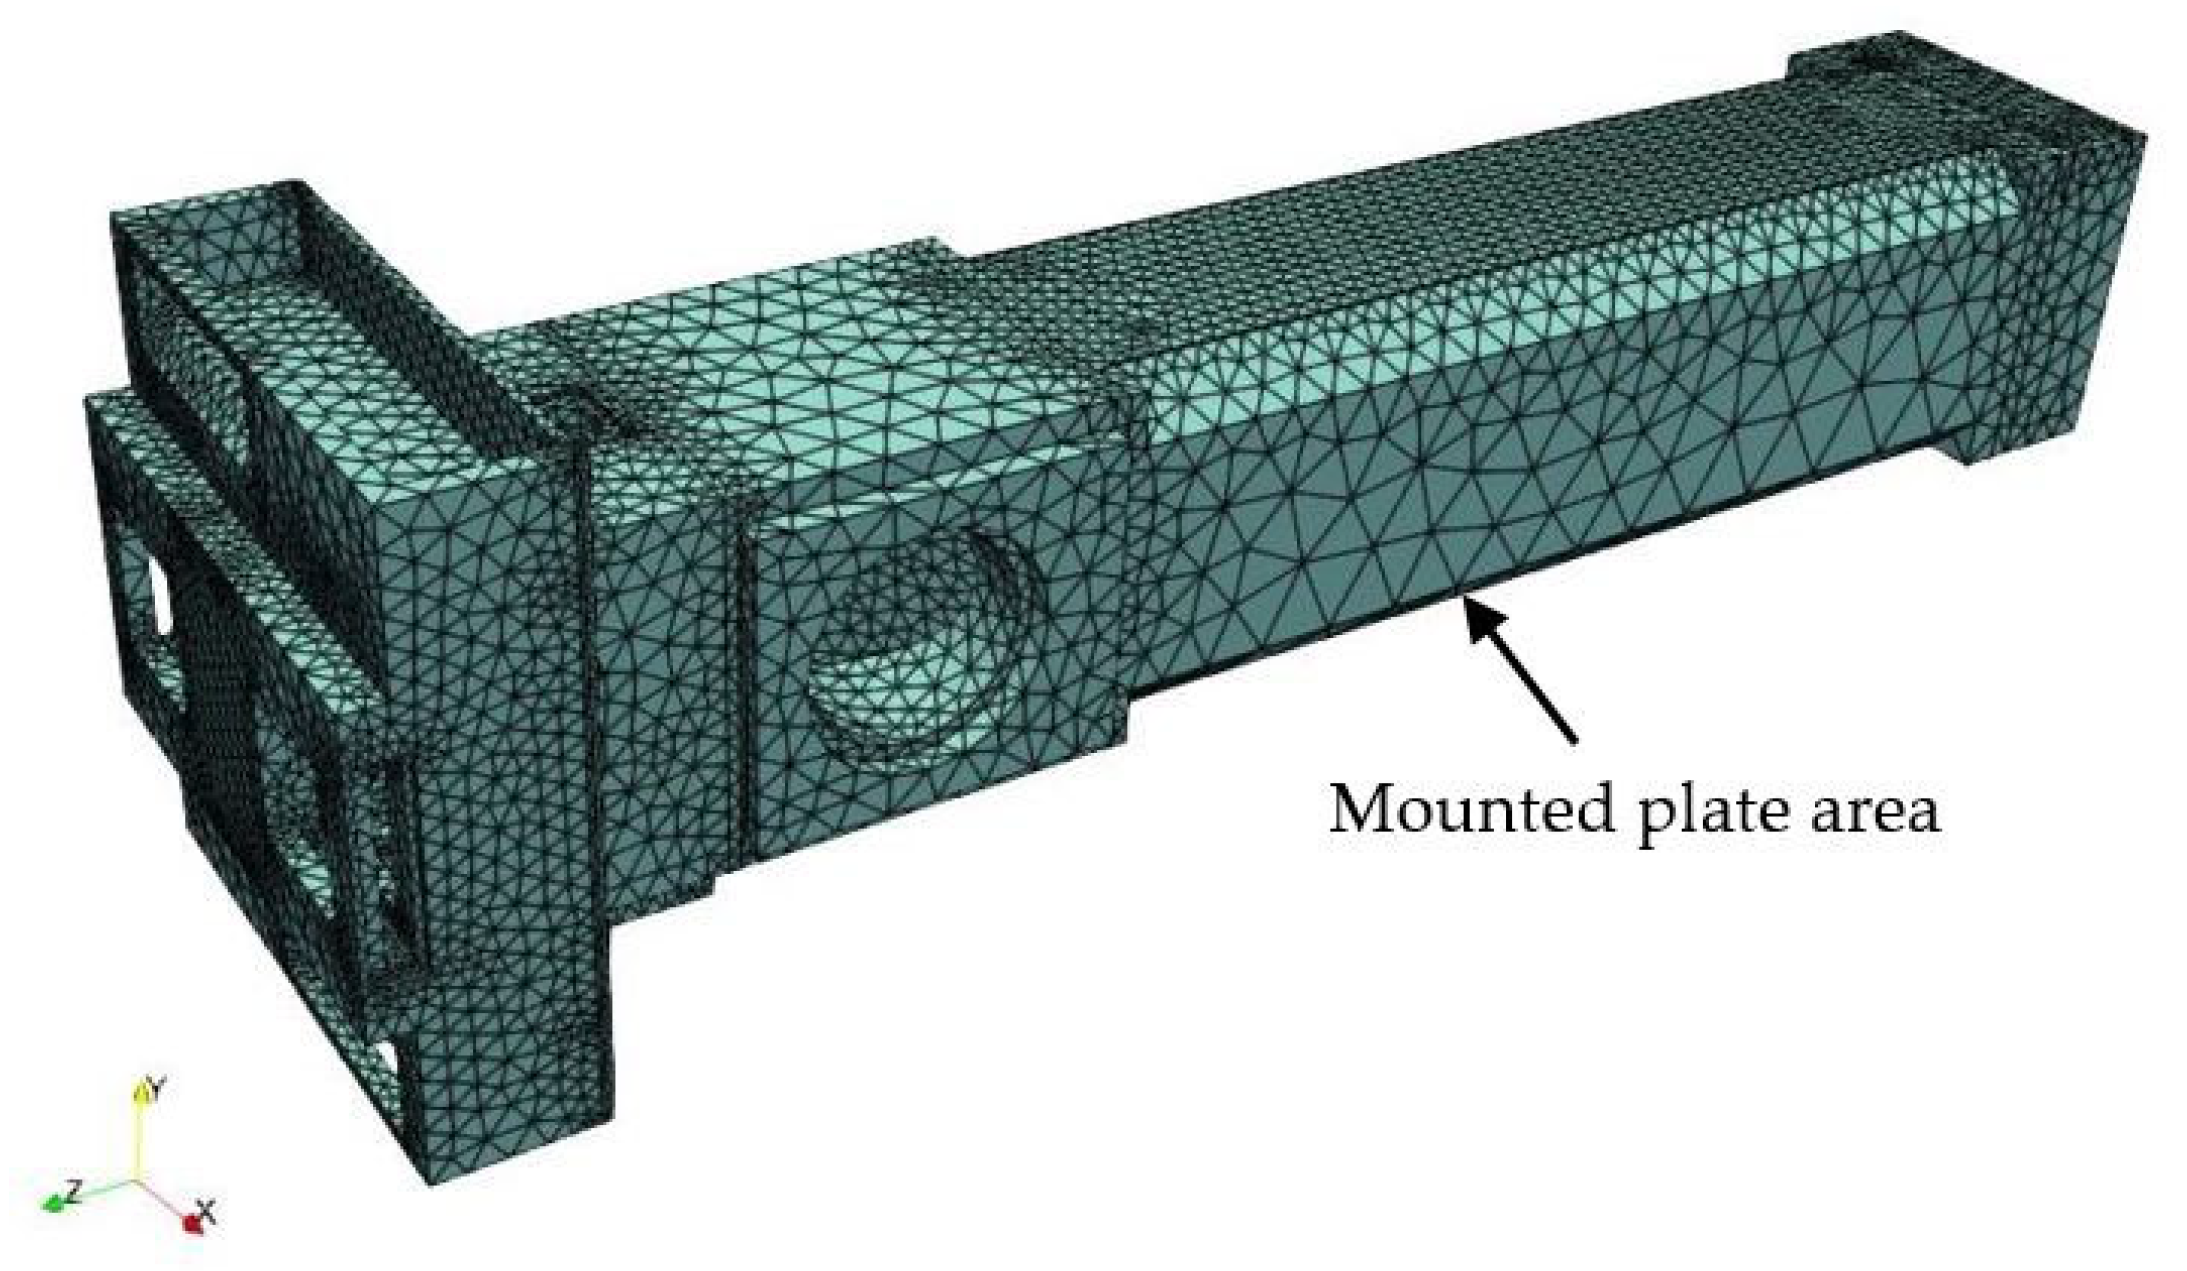
Figure 4.
The flowchart of the STOP analysis for the optical laser head.
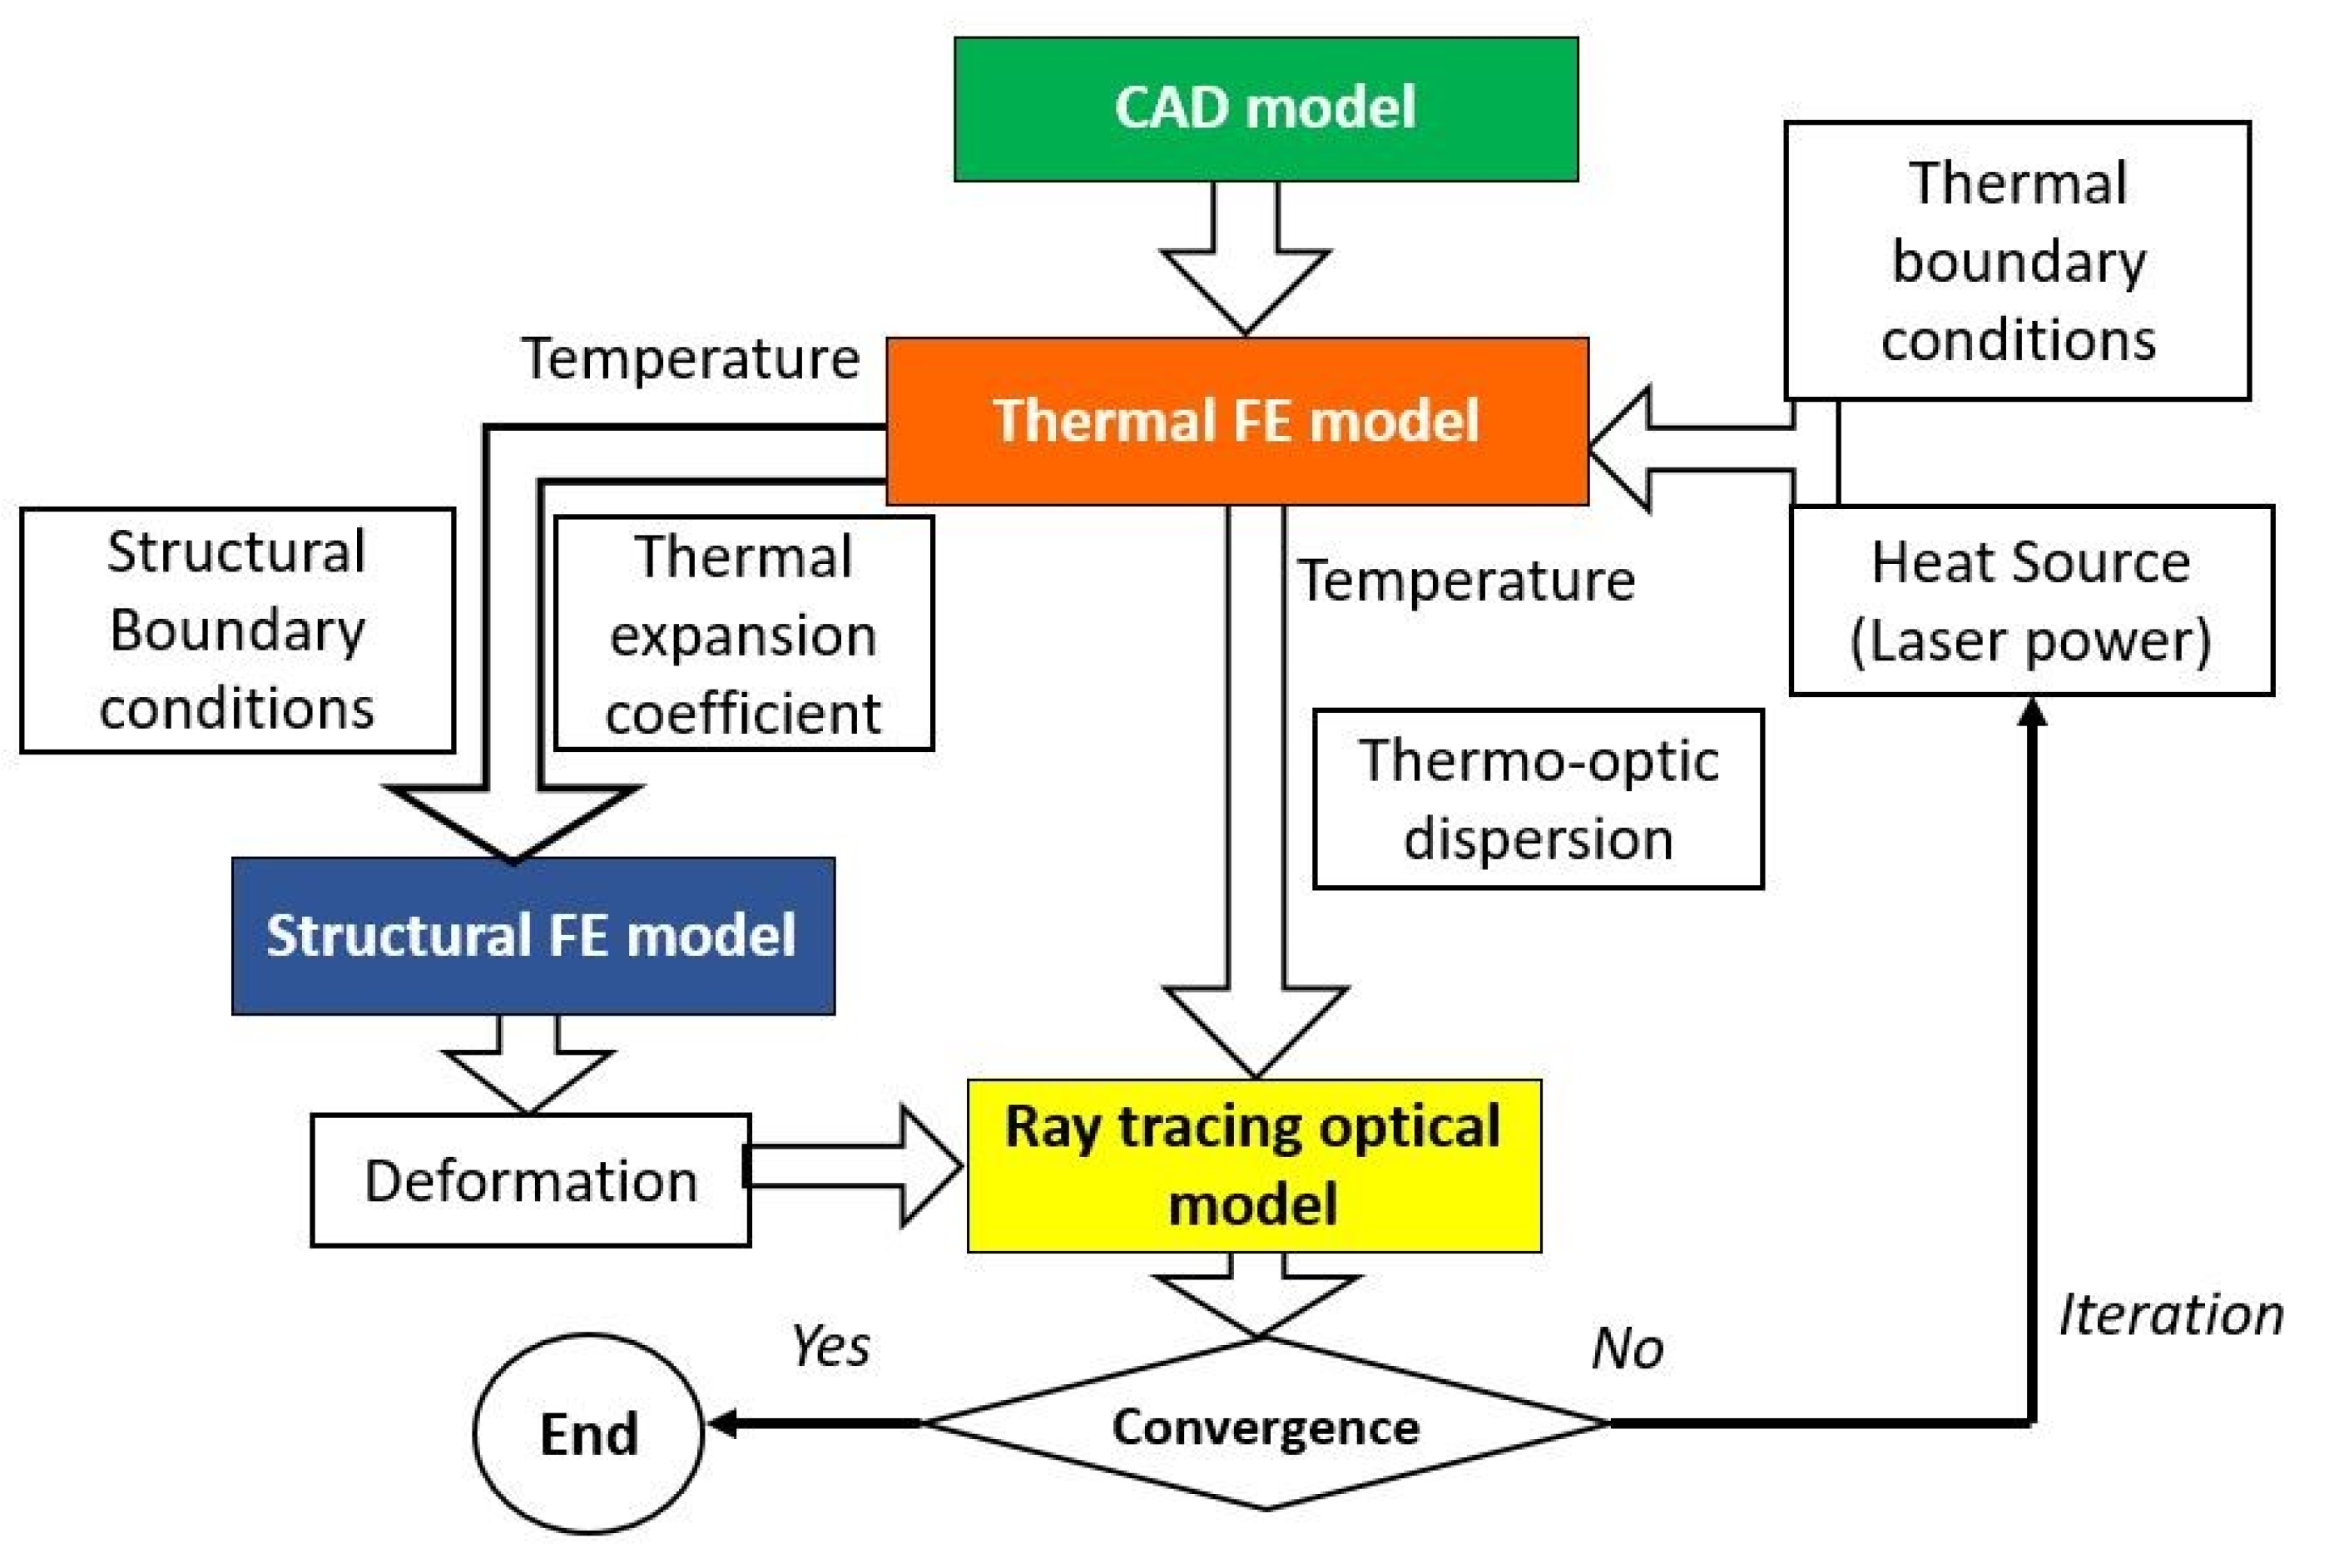
Figure 5.
Temperature distributions by 1.634 kW in (a) housing structure and (b) lenses, and deformation distributions in (c) housing structure and (d) lenses.
Figure 5.
Temperature distributions by 1.634 kW in (a) housing structure and (b) lenses, and deformation distributions in (c) housing structure and (d) lenses.

Figure 6.
(a) Temperature and (b) displacement distributions of the focusing lens irradiated by laser power at 1.634 kW.
Figure 6.
(a) Temperature and (b) displacement distributions of the focusing lens irradiated by laser power at 1.634 kW.
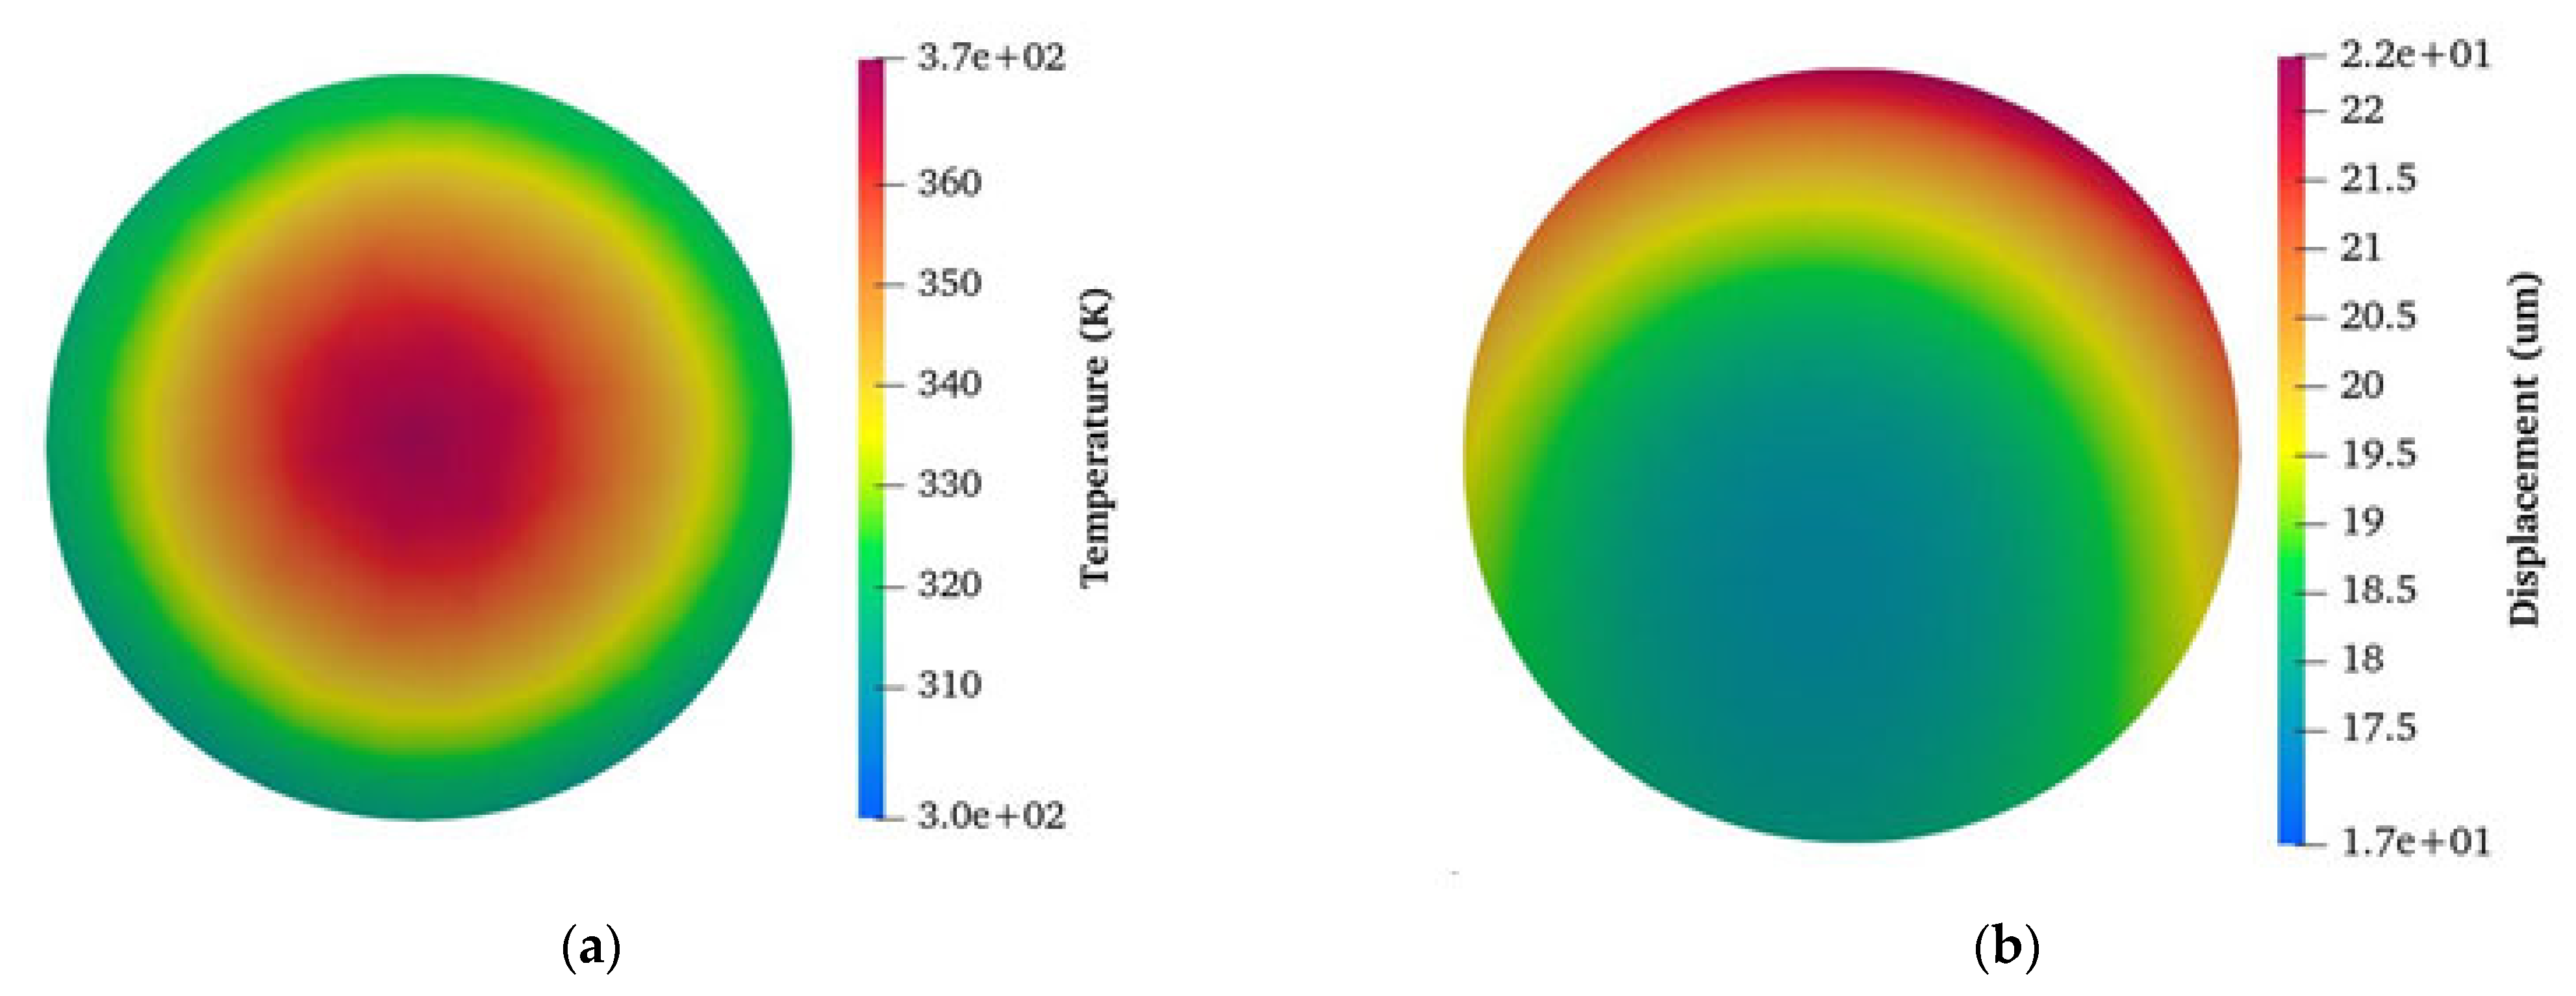
Figure 7.
RMS spot radius (a,c) and optical intensity (b,d) by the STOP analysis (top) and ray tracing simulations (bottom).
Figure 7.
RMS spot radius (a,c) and optical intensity (b,d) by the STOP analysis (top) and ray tracing simulations (bottom).
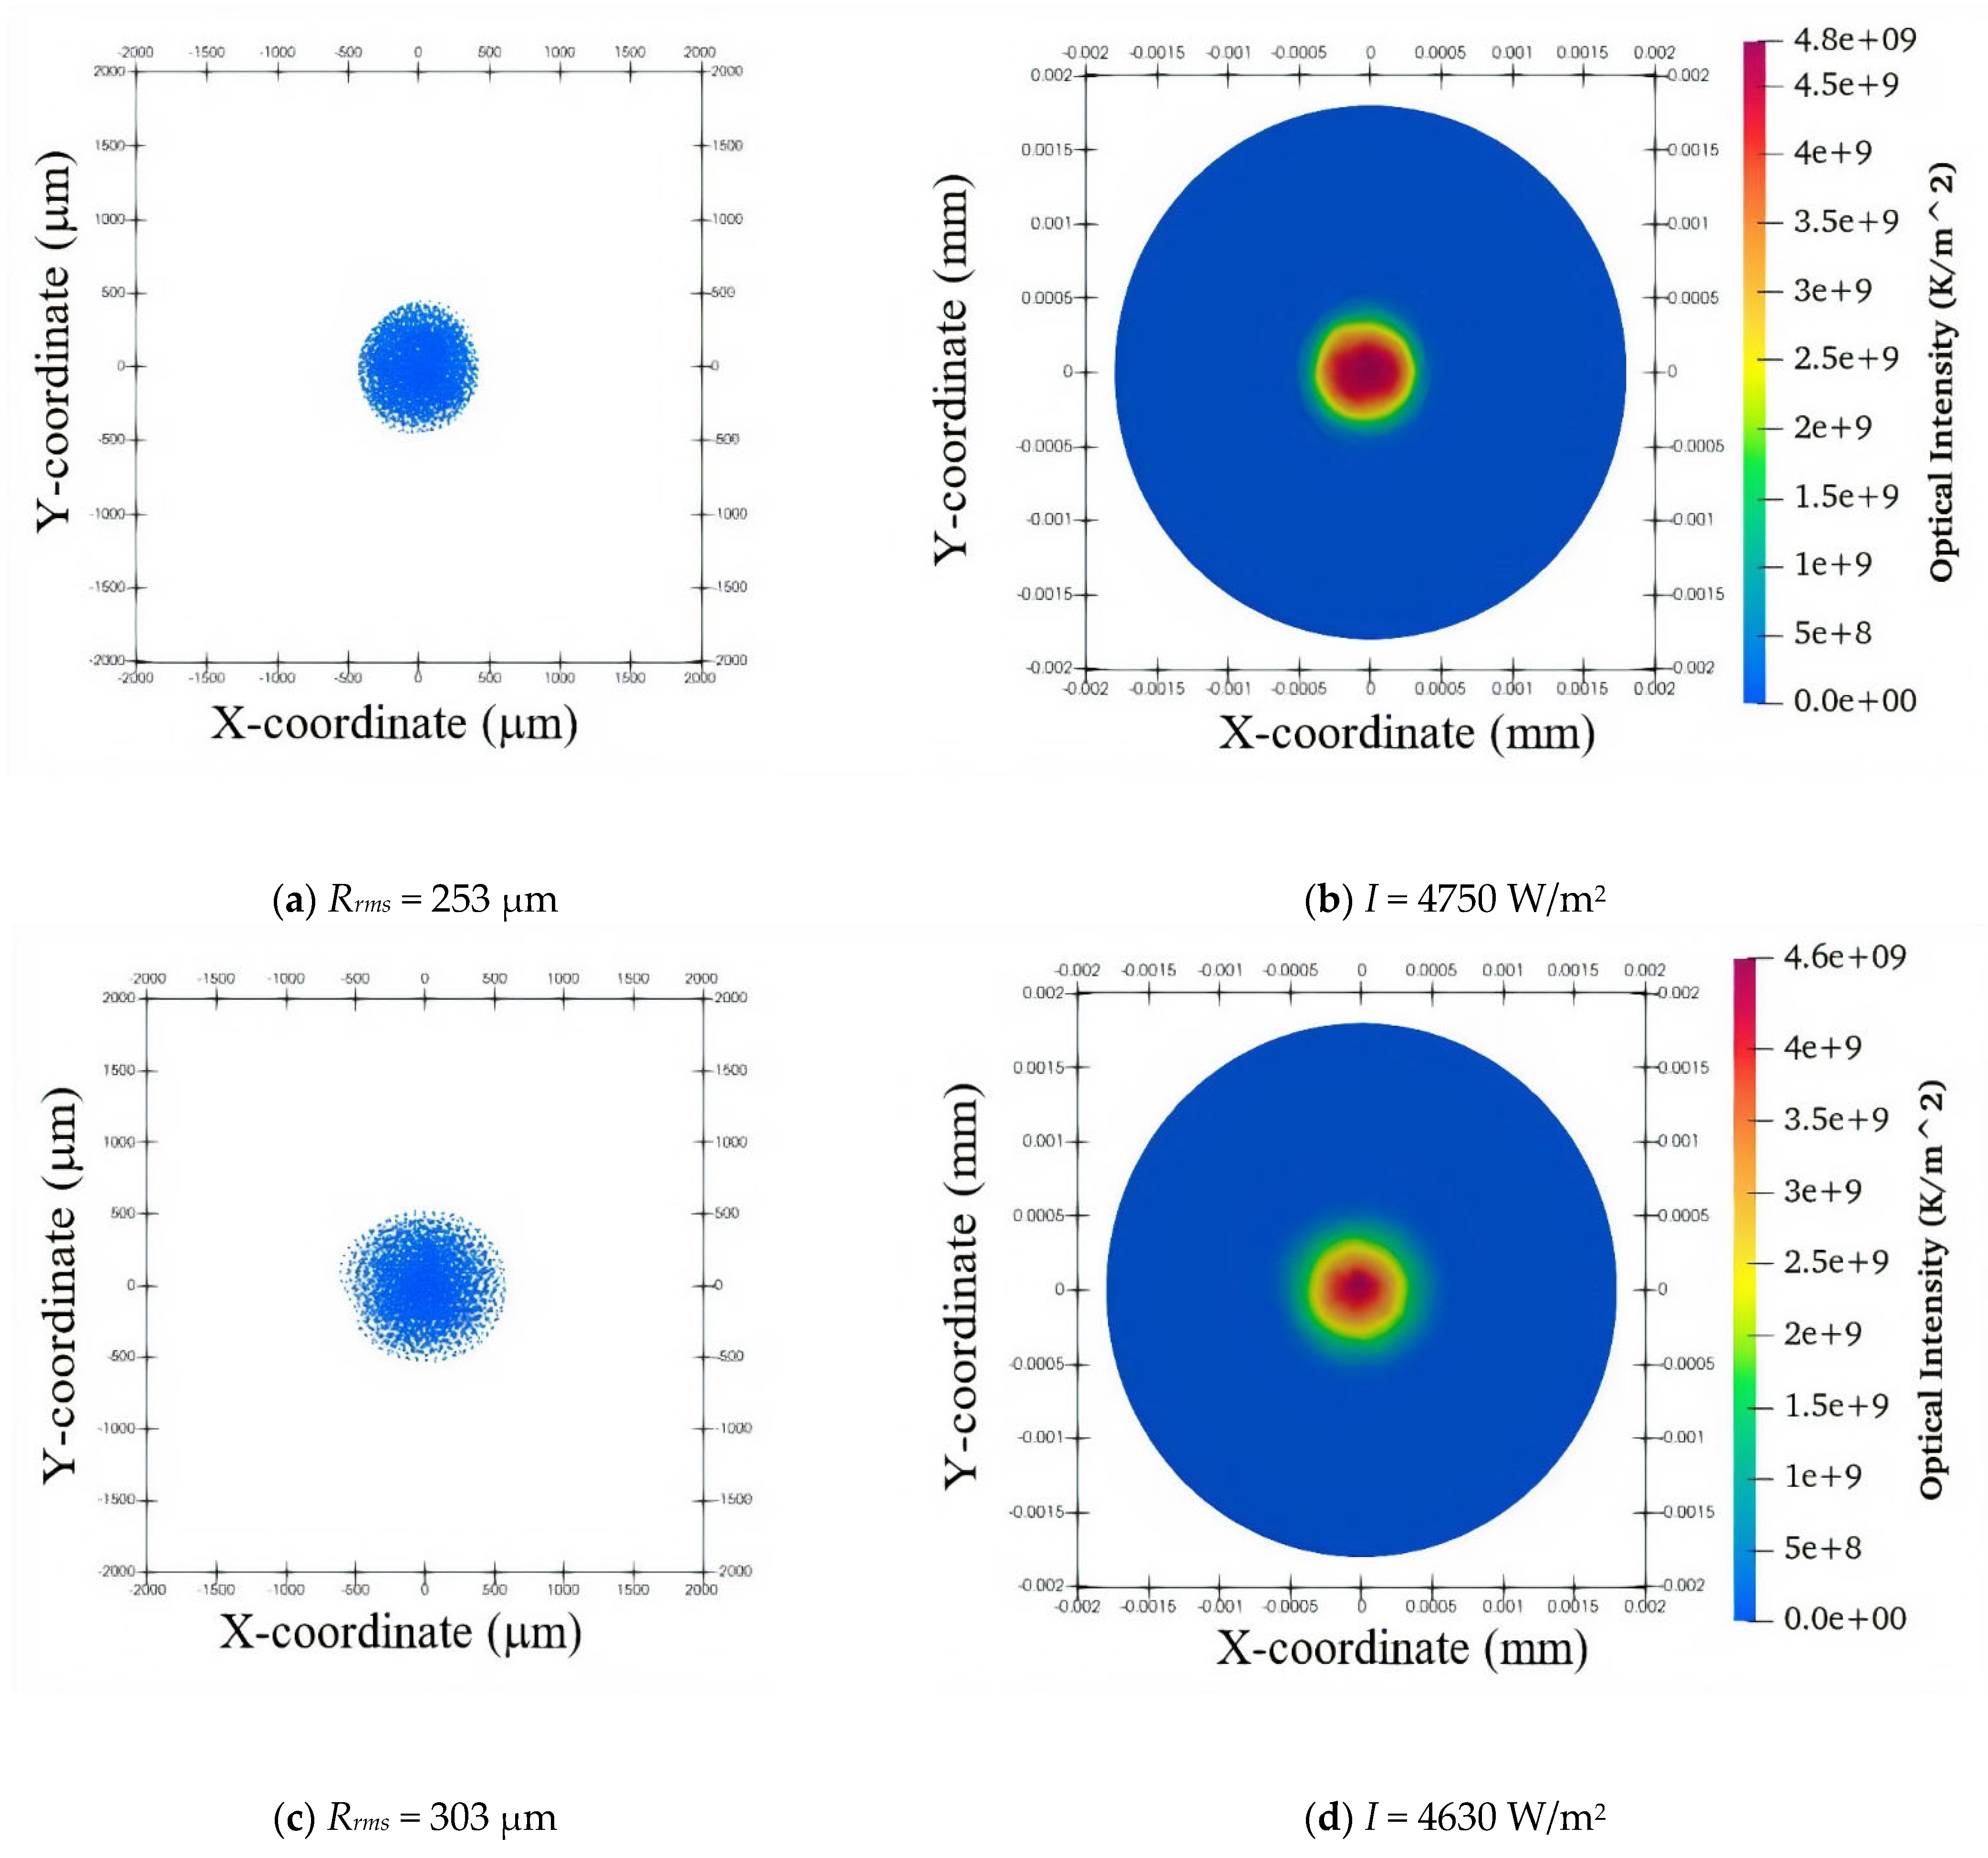
Figure 8.
RMS spot radius Rrms and optical intensity I as the function of focal plane position Fz.

Figure 9.
RMS spot radius Rrms and power density distribution I as the function of laser power P.
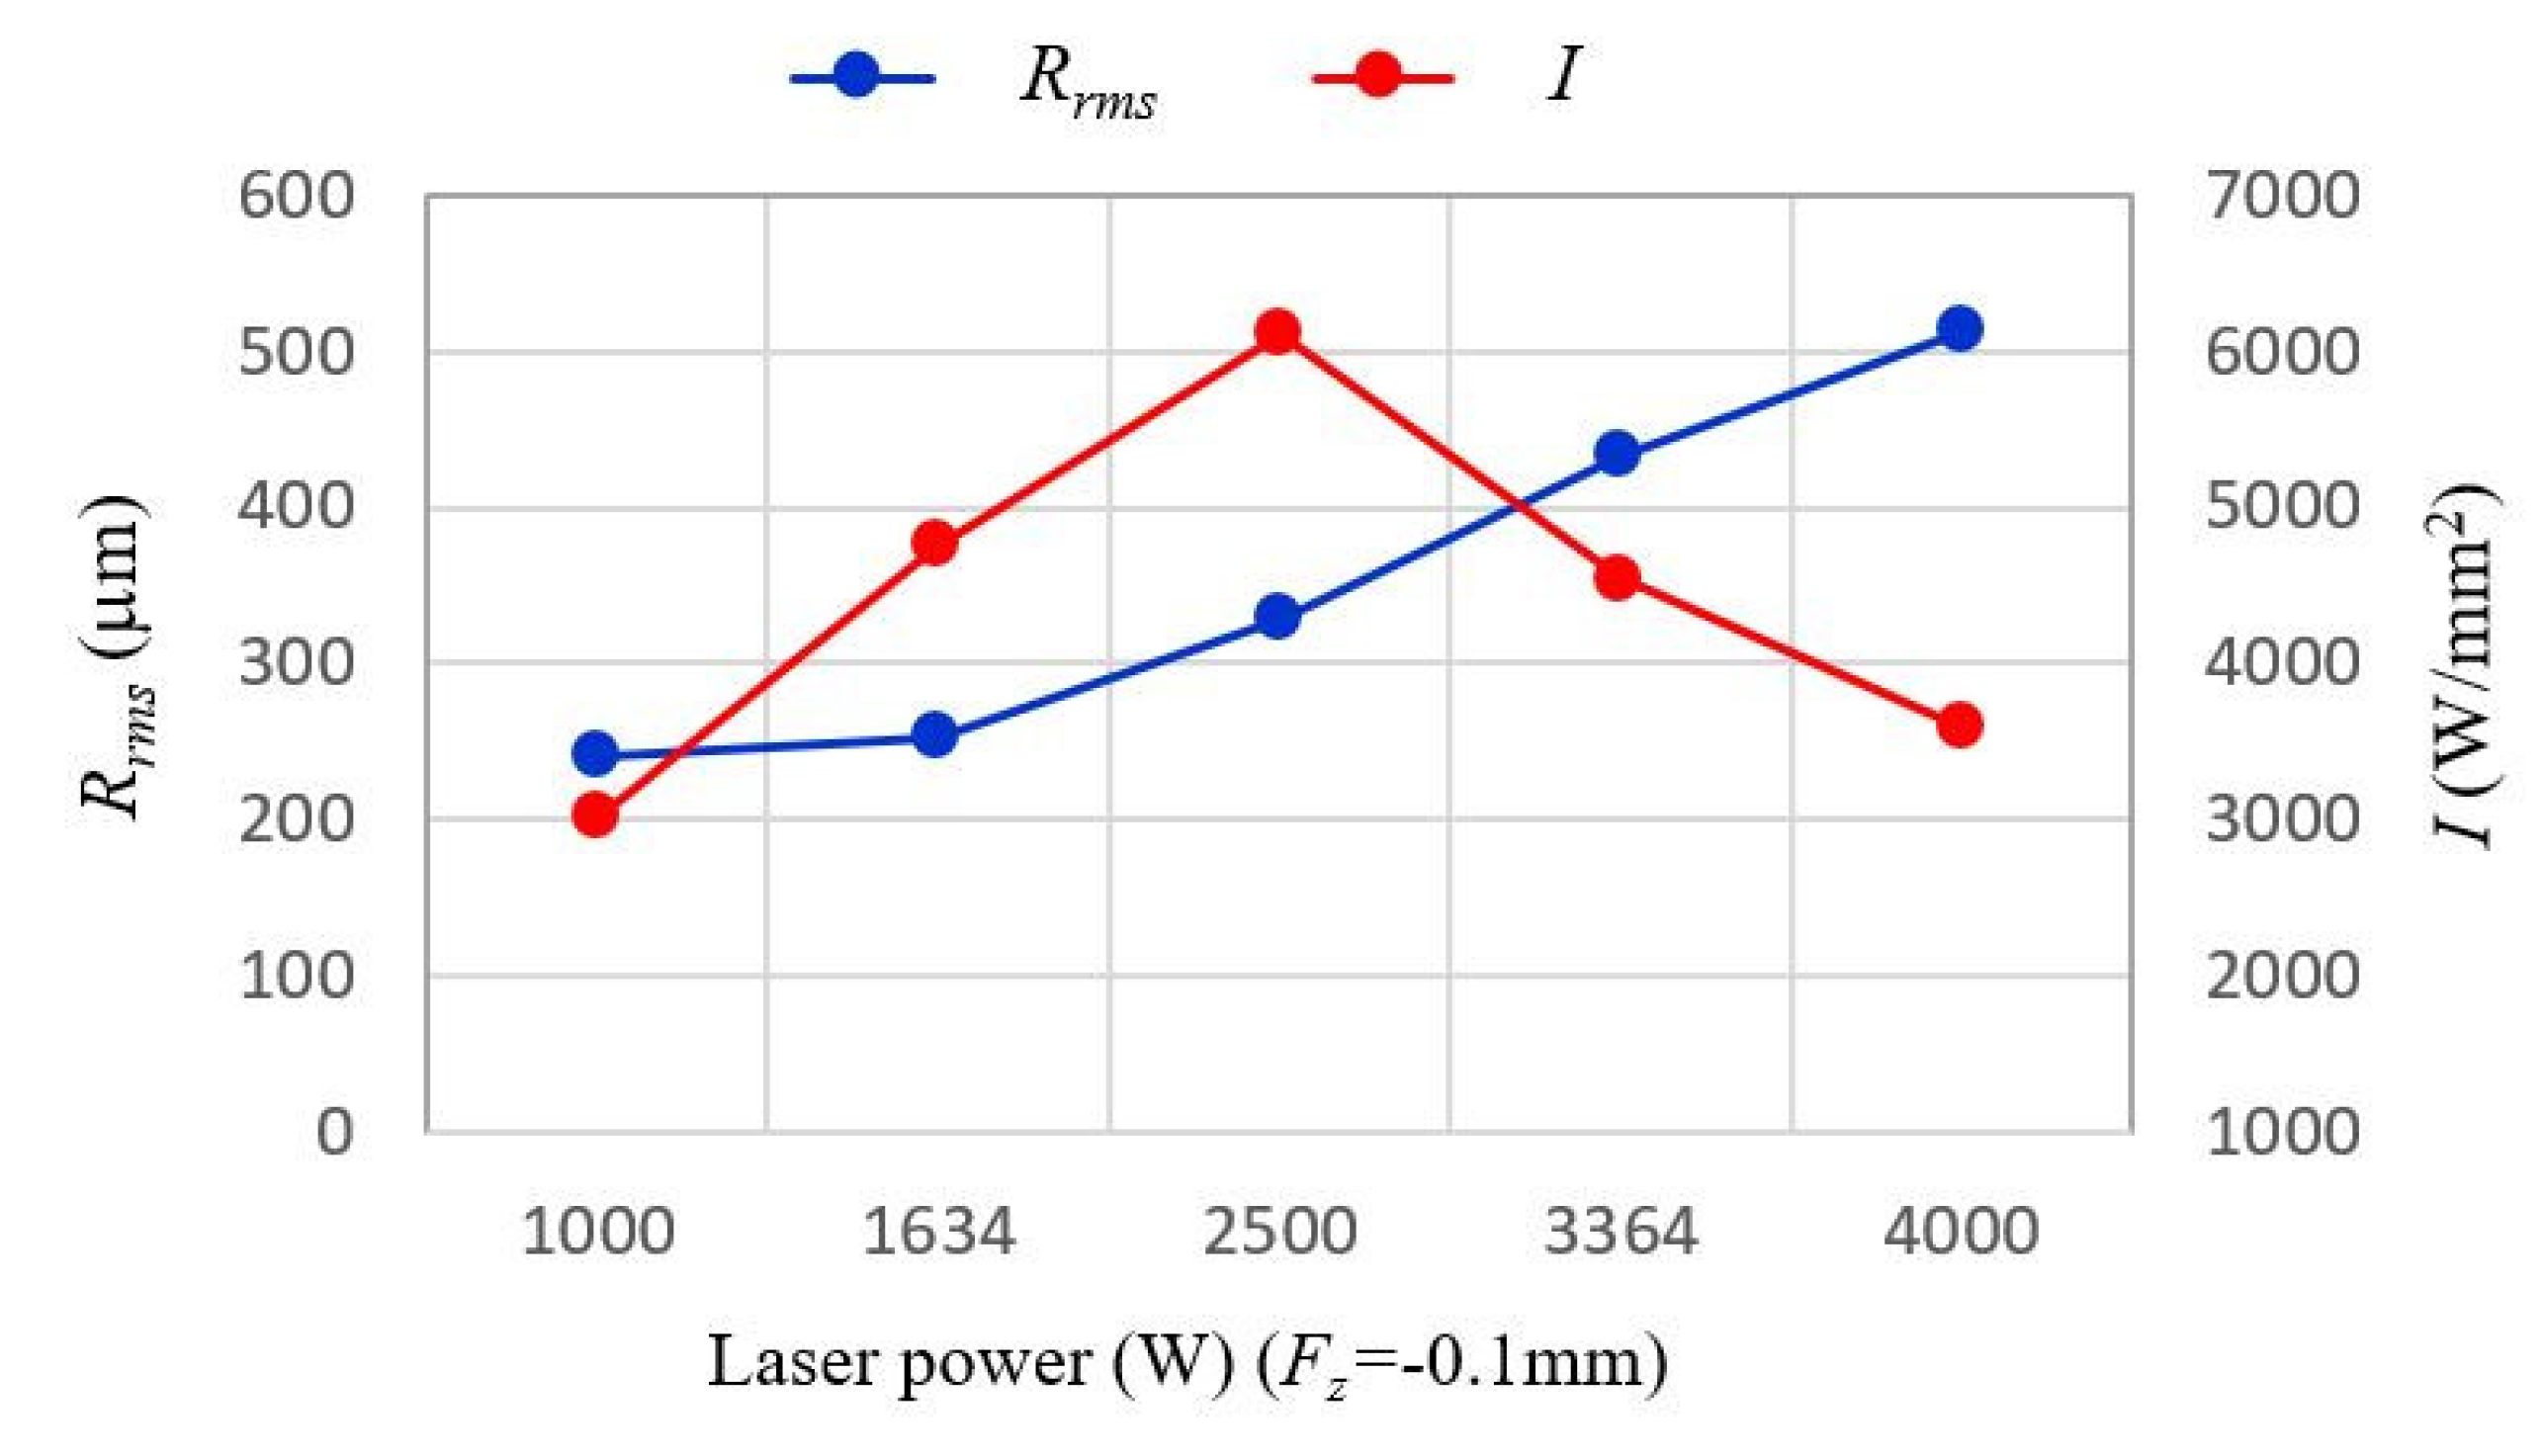
Figure 10.
Power density distributions (a) 1.634 kW and (b) 3.364 kW in the focal plane position of Fz = 0.1mm.
Figure 10.
Power density distributions (a) 1.634 kW and (b) 3.364 kW in the focal plane position of Fz = 0.1mm.

Figure 11.
Response surfaces and contours of optical intensity as the function of any two variables among x1, x2, and z1: (a) I (x1, x2), (b) I (x1, z1), and (c) I (x2, z1).
Figure 11.
Response surfaces and contours of optical intensity as the function of any two variables among x1, x2, and z1: (a) I (x1, x2), (b) I (x1, z1), and (c) I (x2, z1).
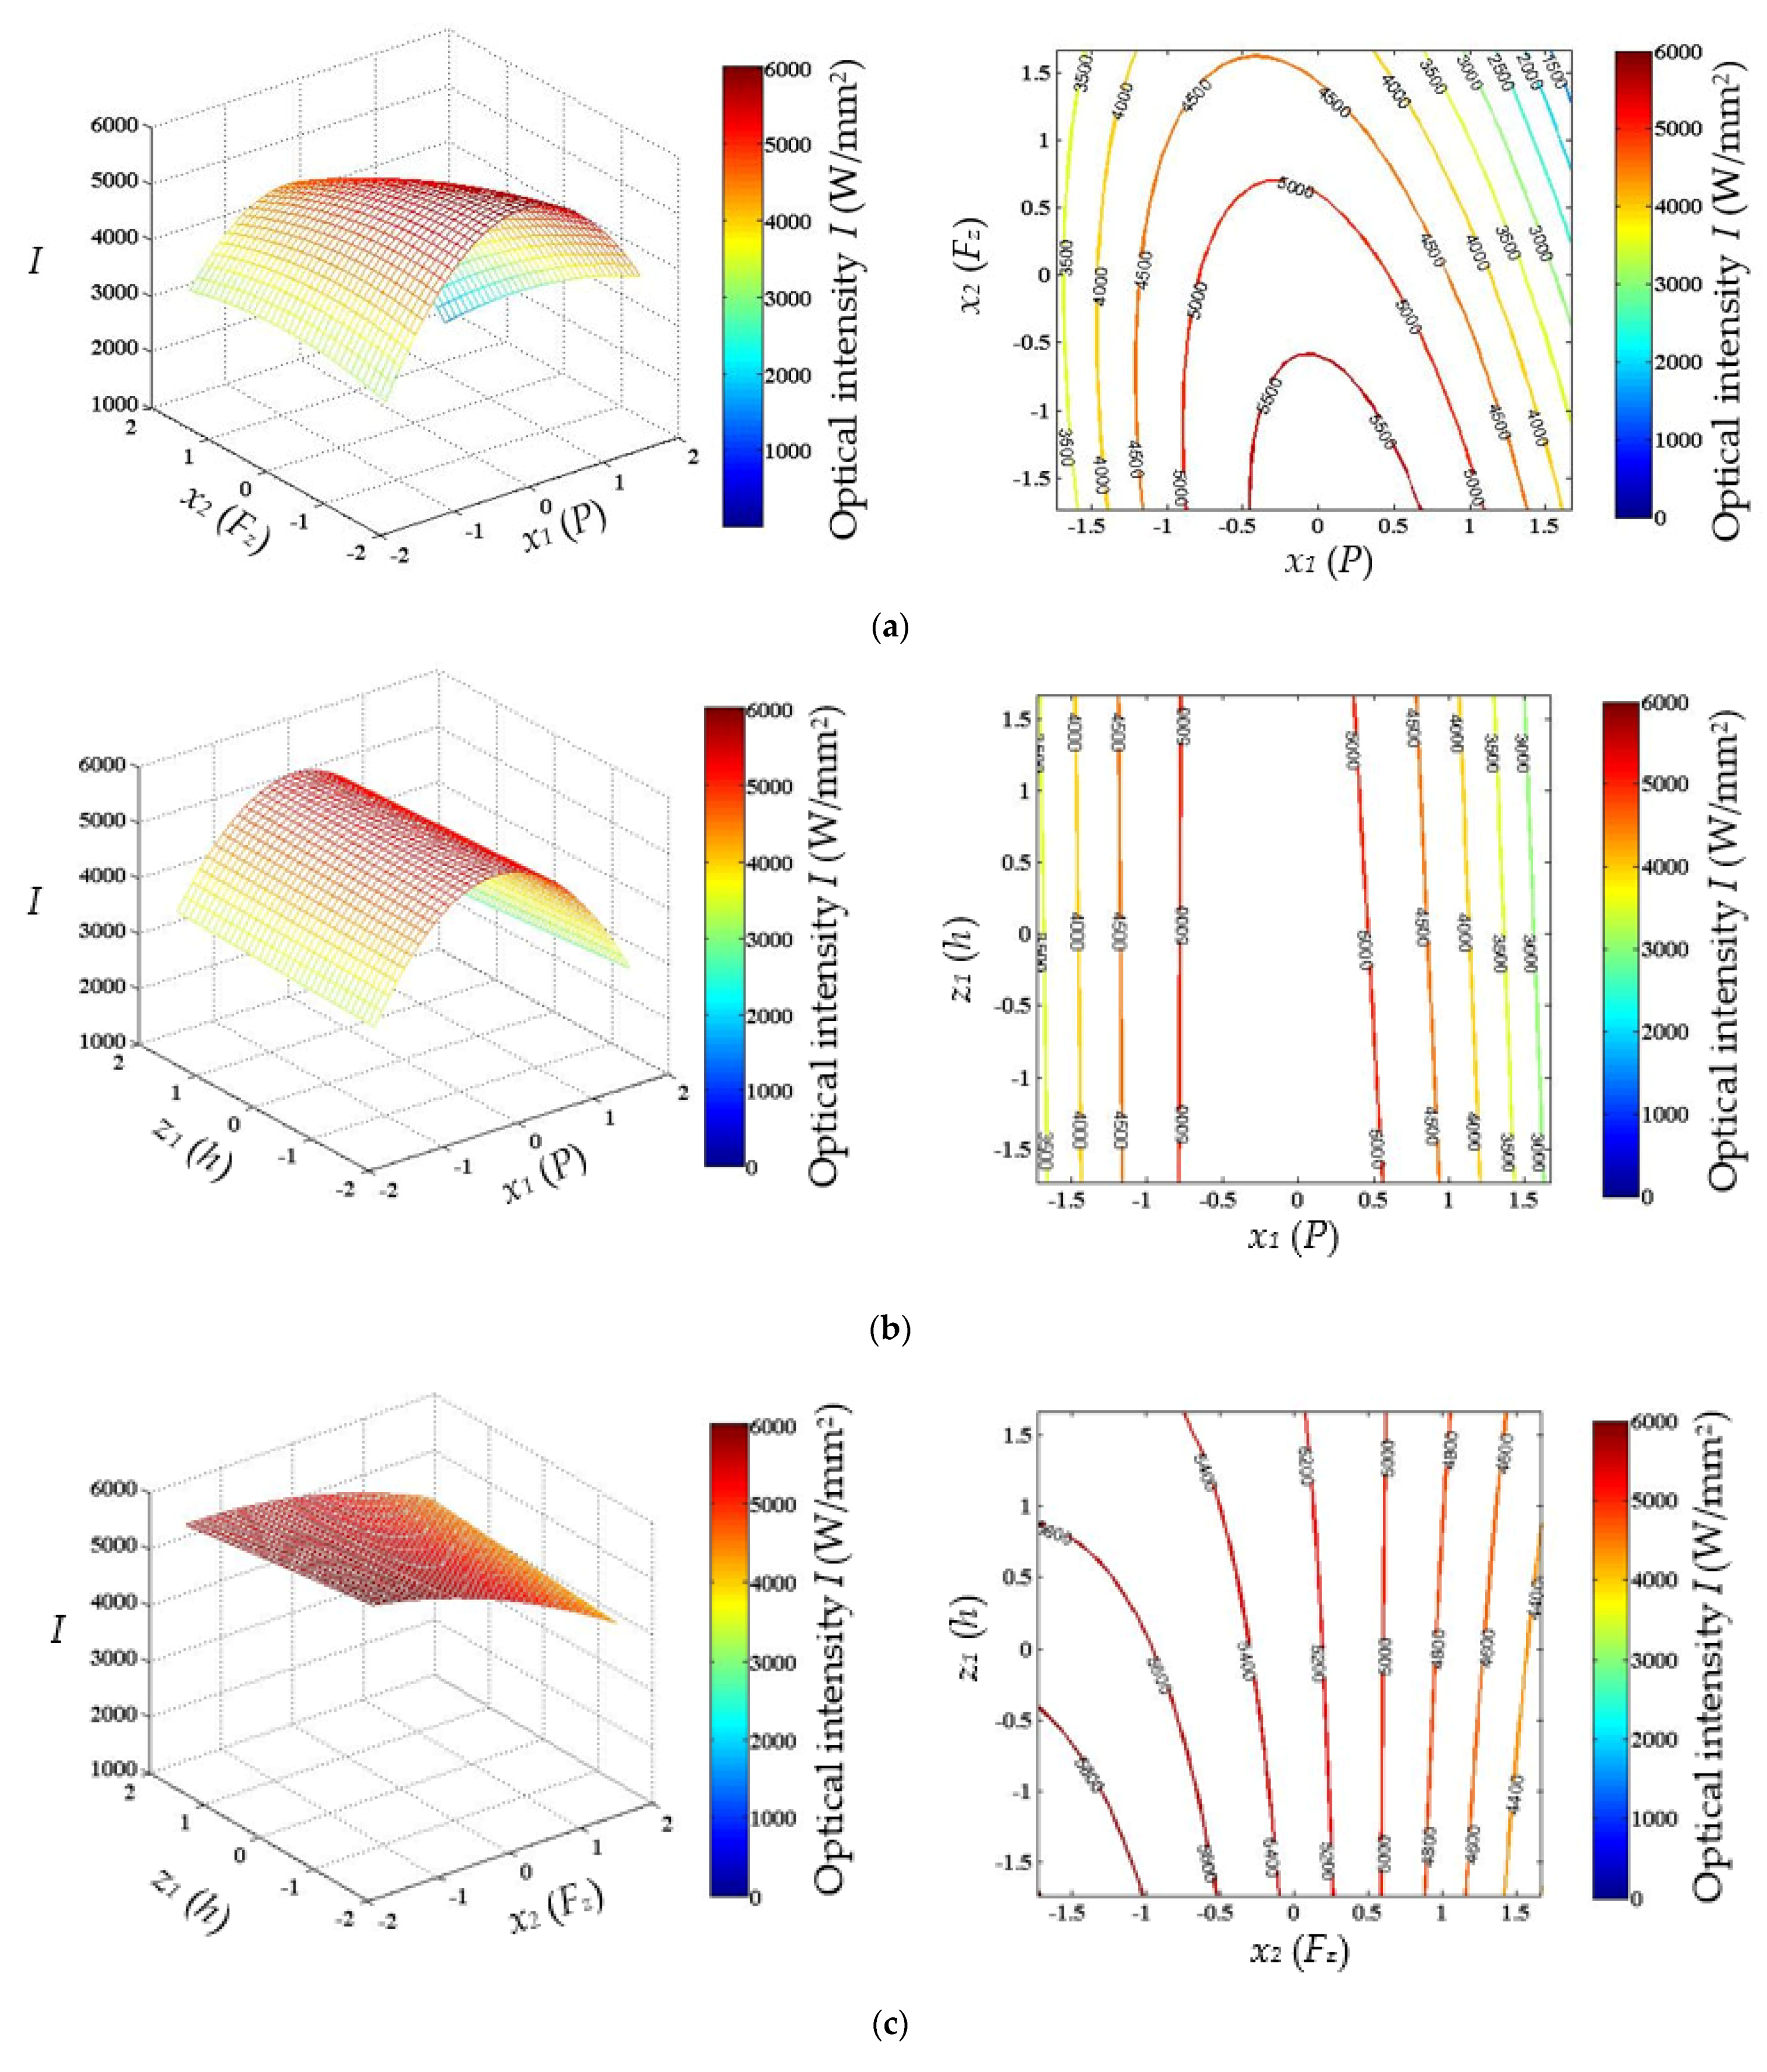
Figure 12.
Response surfaces and contours of RMS spot radius Rrms as the function of any two variables among x1, x2, and z1: (a) Rrms (x1, x2), (b) Rrms (x1, z1), and (c) Rrms (x2, z1).
Figure 12.
Response surfaces and contours of RMS spot radius Rrms as the function of any two variables among x1, x2, and z1: (a) Rrms (x1, x2), (b) Rrms (x1, z1), and (c) Rrms (x2, z1).
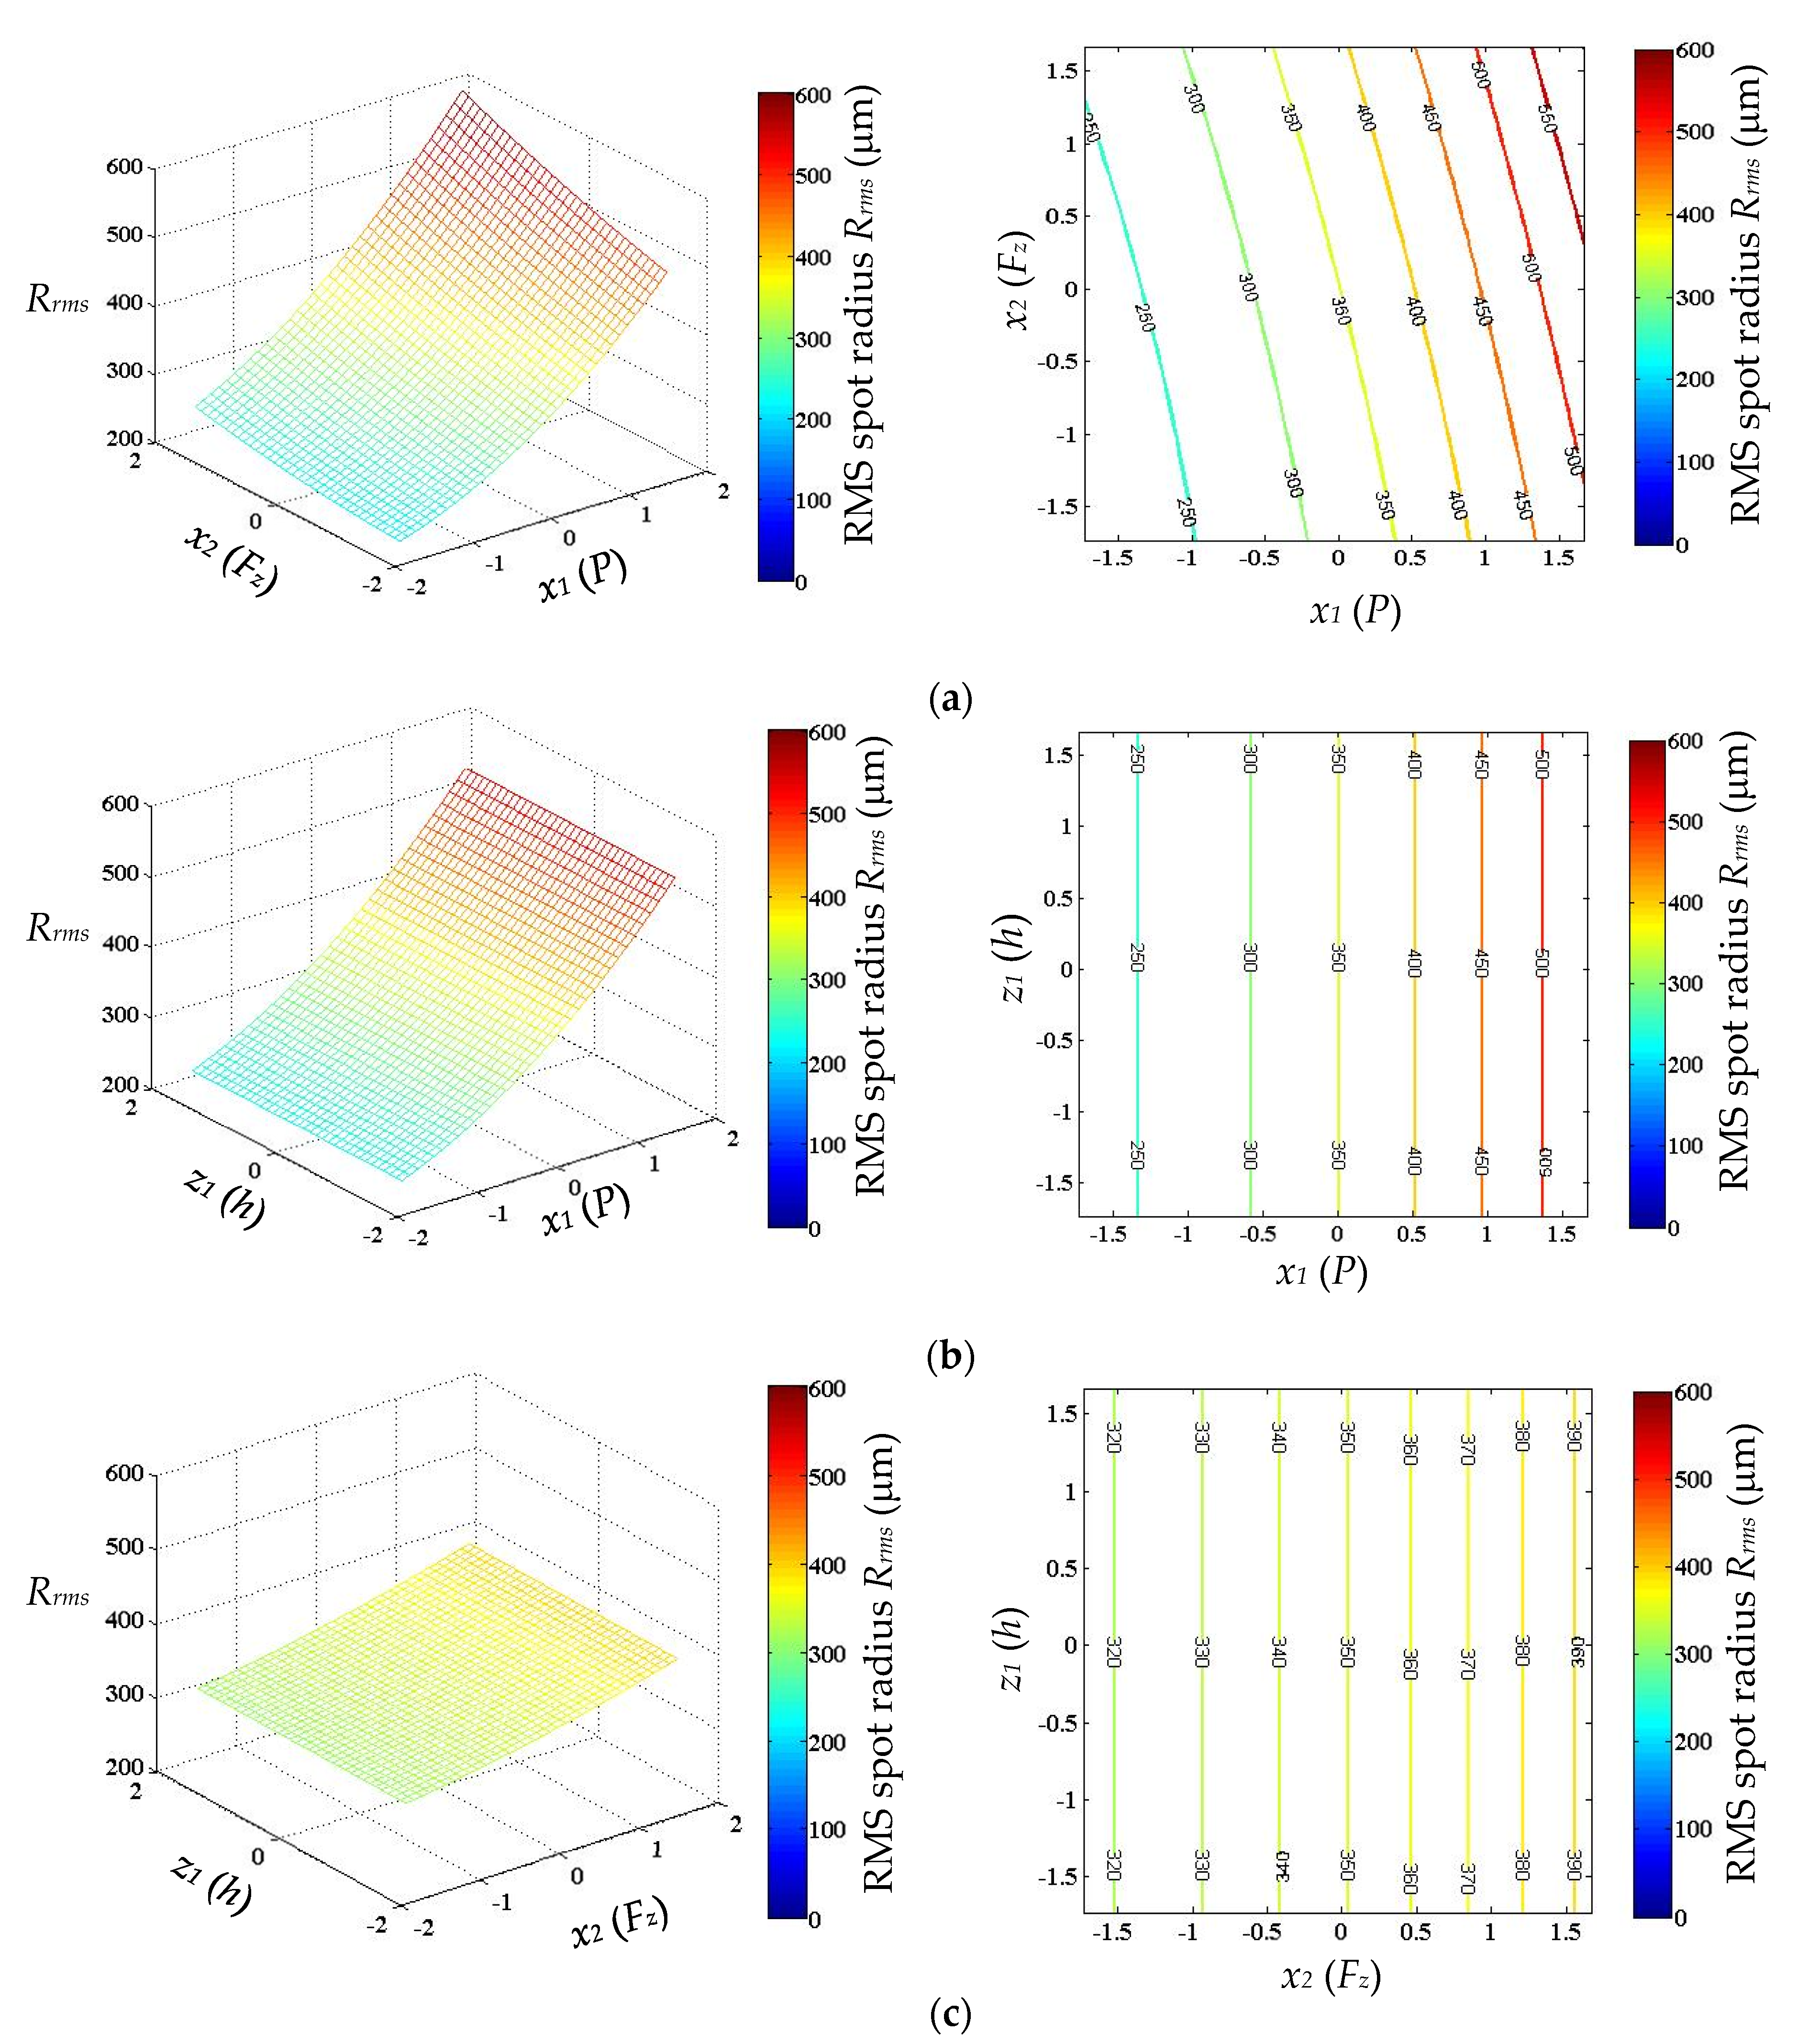
Figure 13.
(a) Setup of the optical laser head, (b) laser-aided additive manufacturing (LAAM) process, (c) single-tracks deposited with nonoptimal process parameters, and (d) solid layer deposited with optimal process parameters.
Figure 13.
(a) Setup of the optical laser head, (b) laser-aided additive manufacturing (LAAM) process, (c) single-tracks deposited with nonoptimal process parameters, and (d) solid layer deposited with optimal process parameters.

Table 1.
Material properties used in the simulation.
| Material Properties | Fused Silica [29] | Stainless Steel 316 [30] | Copper [30] |
|---|---|---|---|
| Thermal conductivity (W/mK) | 1.38 at 293–375 K 1.47 at 375–475 K 1.55 at 475–575 K 1.67 at 575–675 K | 19 | 401 |
| Heat capacity (J/kgK) | 1.84 at 675–800 K 772 at 293–375 K 964 at 375–775 K 1052 at 775–1175 K | 500 | 384 |
| Thermal expansion coefficient (K−1) | 0.51 × 10⁻⁶ at 293–375 K 0.58 × 10⁻⁶ at 375–475 K 0.59 × 10⁻⁶ at 475–575 K 0.54 × 10⁻⁶ at 575–800 K | 18.0 × 10⁻⁶ | 17.0 × 10⁻⁶ |
| Density (kg/m3) | 2203 | 7990 | 8960 |
| Young’s modulus (Pa) | 73.1 × 10⁹ | 193 × 109 | 120 × 109 |
| Poisson ratio | 0.17 | 0.26 | 0.34 |
| Refractive index | 1.45 − i(T − T0) × 10−5 | ||
| T0 = 293 K |
Table 2.
Design variables and their coded levels.
| Original Level | Coded Level | −1.732 | −1 | 0 | 1 | 1.732 |
|---|---|---|---|---|---|---|
| P (kW) | x1 | 1.00 | 1.634 | 2.50 | 3.364 | 4.00 |
| FZ (μm) | x2 | −173.2 | −100 | 0 | 100 | 173.2 |
| h (W/m2K) | z1 | 1500 | 2500 | 3500 |
Table 3.
Experiments of designs in coded levels and simulated responses.
| x1 | x2 | z1 | I (W/mm2) | Rrms (μm) | |
|---|---|---|---|---|---|
| 1 | −1 | −1 | −1 | 4750 | 253 |
| 2 | 1 | −1 | −1 | 4540 | 432 |
| 3 | −1 | 1 | −1 | 4740 | 284 |
| 4 | 1 | 1 | −1 | 3320 | 487 |
| 5 | −1 | −1 | 1 | 4740 | 253 |
| 6 | 1 | −1 | 1 | 4130 | 432 |
| 7 | −1 | 1 | 1 | 4770 | 284 |
| 8 | 1 | 1 | 1 | 3420 | 487 |
| 9 | −1.732 | 0 | 0 | 3090 | 239 |
| 10 | 1.732 | 0 | 0 | 3130 | 541 |
| 11 | 0 | −1.732 | 0 | 6310 | 315 |
| 12 | 0 | 1.732 | 0 | 4020 | 399 |
| 13 | 0 | 0 | 0 | 5590 | 351 |
Table 4.
Comparison of the original and optimal solutions.
| P (kW) | Fz (mm) | h (W/m2K) | I (STOP) (W/mm2) | I (RSM) (W/mm2) | Rrms (STOP) (μm) | Rrms (RSM) (μm) | |
|---|---|---|---|---|---|---|---|
| Original | 1.634 | −0.1 | 1500 | 4820 | 4875 | 257 | 260 |
| Optimal | 2.28 | −0.173 | 1500 | 6320 | 5813 | 299 | 300 |
Publisher’s Note: MDPI stays neutral with regard to jurisdictional claims in published maps and institutional affiliations. |
© 2021 by the authors. Licensee MDPI, Basel, Switzerland. This article is an open access article distributed under the terms and conditions of the Creative Commons Attribution (CC BY) license (http://creativecommons.org/licenses/by/4.0/).
Share and Cite
MDPI and ACS Style
Yang, J.; Yao, X.; Cai, Y.; Bi, G. Multiphysics Modeling, Sensitivity Analysis, and Optical Performance Optimization for Optical Laser Head in Additive Manufacturing. Appl. Sci. 2021, 11, 868. https://doi.org/10.3390/app11020868
AMA Style
Yang J, Yao X, Cai Y, Bi G. Multiphysics Modeling, Sensitivity Analysis, and Optical Performance Optimization for Optical Laser Head in Additive Manufacturing. Applied Sciences. 2021; 11(2):868. https://doi.org/10.3390/app11020868
Chicago/Turabian StyleYang, Jiaping, Xiling Yao, Yuxin Cai, and Guijun Bi. 2021. "Multiphysics Modeling, Sensitivity Analysis, and Optical Performance Optimization for Optical Laser Head in Additive Manufacturing" Applied Sciences 11, no. 2: 868. https://doi.org/10.3390/app11020868
Note that from the first issue of 2016, this journal uses article numbers instead of page numbers. See further details here.