1. Introduction
During the past 30 years, optical metrology has found numerous applications in scientific and commercial fields because of its non-contact and inherent nonintrusive advantages [
1], and its speed and accuracy has increased substantially in recent years [
2]. Cross laser-pattern is often used as a cooperative measuring marker in optical metrology, with a laser plane projecting on the measured surface and digital processing of the acquired images [
3], such as infrared viewing equipment [
4] or three-dimensional visual measurement system [
5].
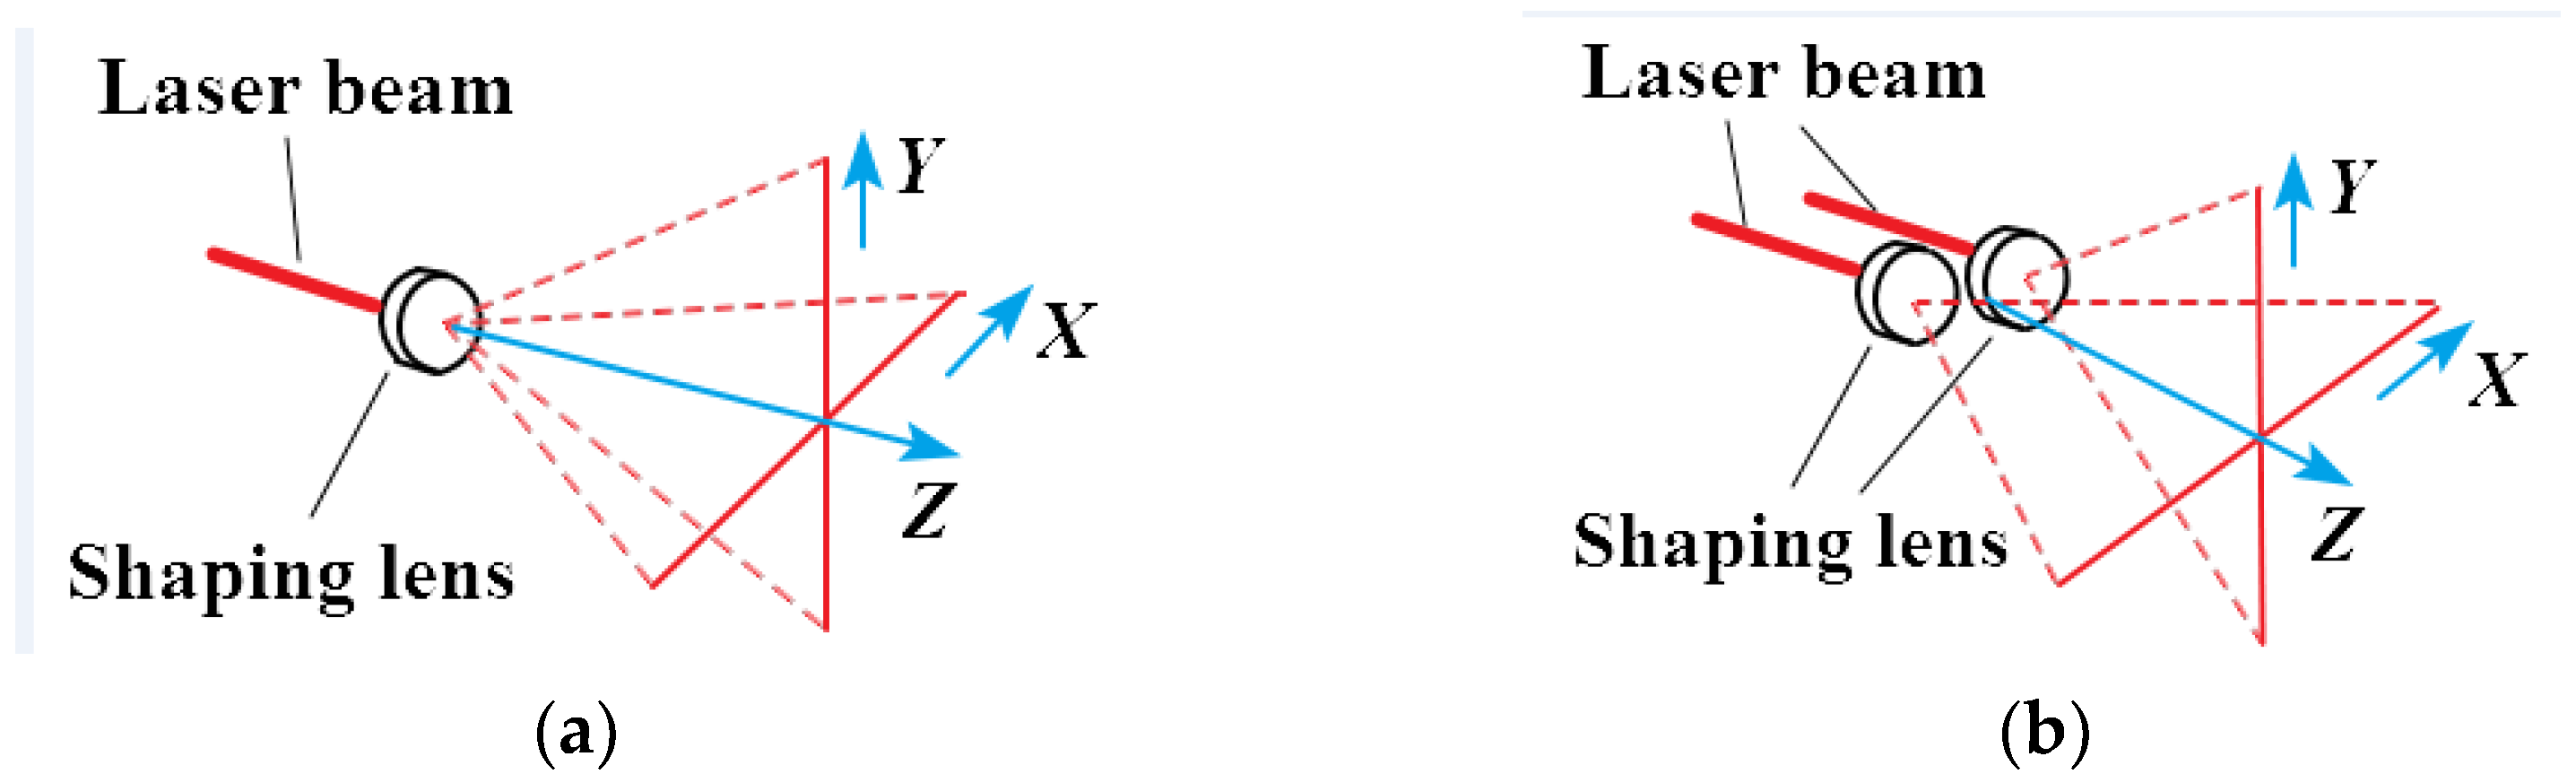
There are two forms of cross laser, as shown in
Figure 1a, it is formed of a single point light source. The laser beam emitted by the laser source propagates along the Z direction, and all light is divided into two perpendicular planes by refraction of the shaping lens. The intersection line between the two planes and the imaging plane is cross-shaped, that are distributed along the X and Y directions, respectively [
6];
Figure 1b shows the other form. The laser beams emitted by two laser sources form two planes through the refraction of the shaping lens, and the cross laser is formed when the two planes are perpendicular. The propagation direction of the two planes is Z, and the two beams are distributed along the X and Y directions, respectively.
In general applications of scientific or commercial fields [
7,
8], the image acquisition model is near the laser, and the laser projection distance is within decimeters, so that the image quality is less affected by the environment. Existing methods may realize the digital processing of the acquired image. However, the proposed method is applied in a shipboard environment, and the cross laser-pattern projection distance is a dozen meters to the measured surface, therefore, adverse environmental effects, such as stray light, smoke, water mist [
9] and other interference [
10] in the environment, may result in poor contrast, low signal-to-noise ratio (SNR), uneven energy distribution to the acquired image, which brings challenges to digital processing.
Cross laser-pattern in the second form is used as a cooperative marker to establish optical reference [
11] in this paper. Since the cross-laser projection direction is not perpendicular to the imaging plane, and the relative position between cross laser and imaging plane changes in real time, when the position of the measured point changes relative to the laser during measurement, this causes an angle change between the projection [
12], images of the X axis line and the Y axis line of the cross laser-pattern on the imaging plane. The center and attitude (namely the angles of X and Y axis laser lines of cross laser-pattern in camera image coordinate) are the key parameters to be detected [
13] in this paper, while existing cross marker image center positioning algorithms cannot meet the attitude positioning requirements.
At present, existing methods for central point coordinate extraction of cross-laser-pattern include Hough transform, projection statistical feature and k mean clustering, morphology and so on. Zhang Jingdan et al. [
14] proposed a sub-pixel center detection algorithm for cross laser images, after binary processing of laser image, the pixel groups of the two-laser center line are detected by the method of line search and average, then the pixel groups are taken as fitting sample points, with which two laser lines are fitted by least square method. Finally, the coordinates of the center of the cross laser pattern can be obtained. However, this method assumes that the transverse line of cross laser is strictly horizontal. Due to the uncertainty of the cross-laser attitude in image coordinates in the project and the need for real-time detection, this method cannot meet the project requirements. Liu Bingqi et al. [
15] proposed a center positioning method for infrared cross division line, this method uses the top hat operator of gray morphology to process the image, and uses the maximum inter-class variance method to segment the processing results. According to the characteristics of the cross laser-pattern, the cross-shaped brush is designed for image corrosion, achieving cross laser-pattern center positioning. The algorithm can effectively extract the cross-laser center with a poor contrast and blurred edges image, and it is not affected by random noise. However, this algorithm is only effective for low resolution image such as 263 × 290 pixels, for the cross laser-pattern image extraction with more pixels, there are too many points, it takes time and has poor real-time performance. Besides, it cannot meet the cross-attitude positioning requirements. Dong Dai et al. [
16] proposed a sub-pixel cross microscopic image positioning algorithm based on Hough transform. The main idea of this method is to extract the four edge lines of cross laser-pattern with rough Hough transform, and then apply precise Hough transform around the four rough edge lines, and then four precise edge lines can be obtained. The average of the four precise edge lines intersection points is the calculated cross center. This method is good for the detection of ideal cross laser-pattern center. However, in view of the large amount of acquired cross laser-pattern image data, poor contrast, low signal-to-noise ratio and uneven energy distribution, this method cannot meet the real-time and precision requirements of the project. Miao Jiazhuang et al. [
17] proposed a cross center positioning algorithm based on projection statistical features and K mean clustering. This algorithm is essentially a statistical method. First, acquire the projection values of all the pixels of cross laser-pattern in 180 directions from 0 to 180 degrees, and then determine the optical bar projection boundary by constructing the frequency histogram using the K mean clustering algorithm, finally, the central coordinates are obtained by coordinate transformation. However, this method is not suitable for a wide cross laser-pattern, and cannot achieve attitude positioning, therefore, it does not meet project requirements.
In this paper, cross laser-pattern is used as cooperative measuring marker in shipboard environment with stray light, smoke, water mist and other interference, a method is proposed to process the acquired digital image with poor contrast, low signal-to-noise ratio (SNR) and uneven energy distribution, detect the center point and attitude of cross laser-pattern image, based on the combination of Gaussian fitting and least square fitting. The results show that the method is robust, and meets the requirements of real-time and precision of the project.
3. Methodology
The flow chart of the proposed algorithm is shown in
Figure 5.
3.1. Distortion Correction
Due to the limitations of the equipment and various problems in the assembly of the system, the cross laser-pattern images collected by the industrial cameras in the position and attitude measurement system will produce various distortions. According to the characteristics of the project, perspective distortion [
18] and radial distortion [
19] are the two most important factors affecting the result, so this paper mainly considers perspective distortion and radial distortion, and corrects them in real time.
Before distortion correction, a thin Zhang Zhengyou [
20] checkerboard grid was placed on the interior surface of the screen, and an image of the checkerboard grid was acquired by the industrial camera. This acquired checkerboard grid image was used to obtain distortion calibration parameters, and with these parameters distortion corrections can be realized in real time.
3.1.1. Perspective Distortion Correction
Due to the assembly error of the image acquisition system, the camera optical axis was not absolutely perpendicular to the receiving screen, thus introducing perspective distortion, which needs to be corrected by perspective transformation. The schematic diagram is shown in
Figure 6.
Suppose that
is the coordinate point of the original image plane,
is the corresponding coordinate point after transformation, then:
where
and
are the target point matrix and the source point matrix respectively, A is the perspective transformation matrix. This is a transformation from two-dimensional space to three-dimensional space, as the target image point is still a two-dimensional image, suppose
is the point on the target image plane, then:
where
. From the above formula, the following equations can be obtained:
There are eight unknowns in the equations. The correction of distorted image by perspective transformation requires obtaining the coordinates of a group of four points of distorted image and a group of four points of target image. The transformation matrix of perspective transformation can be calculated by two sets of coordinate points A, and then the transformation matrix of the whole original image can be implemented, realizing perspective distortion correction.
Since the position relationship between the laser receiving screen and the camera was fixed in this paper, once calibrated, the perspective transformation matrix was also constant. Therefore, the perspective transformation matrix can be obtained by prior calibration, and the perspective distortion can be corrected in real time by using the same matrix.
3.1.2. Radial Distortion Correction
Radial distortion is a distortion distributed along the radius due to the non-ideal properties of the lens itself, which can be corrected by the radial correction–distortion model.
It is assumed that the center of distortion is the origin of the coordinates, the coordinates of the corrected image is
, the coordinates corresponding to the distorted image is
, and the coordinates of the distorted center is
. The radial correction-distortion model is shown as follows:
where
. In this paper, the radial distortion coefficient
was calibrated by Zhang Zhengyou checkerboard grid method, and once calibrated,
were also constant, and the real-time correction of radial distortion of cross laser-pattern image can be realized by using this formula.
Projected error [
21] is often used to evaluate distortion correction accuracy. In this paper, after image distortion corrections, the projected error was 0.35 pixel, indicating it had good distortion correction effect.
3.2. Image Preprocessing
Image preprocessing refers to some image processing to the original image before doing the main algorithm operation, in order to make the features of interest parts more prominent or adapt to the subsequent algorithm. Common image preprocessing includes smoothing, image threshold segmentation and so on.
Image smoothing is a method to reduce the gray difference between some pixels and adjacent pixels in the image. The purpose of smoothing is to reduce image noise and image blur. In order to preserve the edge sharpness and detail of the image and suppress the noise at the same time, the median filter was used to smooth the original image and got the filtered image.
Image threshold segmentation is to divide the picture scene into two categories: target object and background object. Image segmentation is the basis of image recognition. The Gray threshold method is a common image segmentation method, it includes the direct threshold method and optimal threshold method. Optimal threshold method is a method to determine the optimal segmentation threshold by using statistical knowledge. Its representative method is the maximum inter class variance method (Otsu) [
22]. For the laser image under interference in the environment, the maximum inter-class variance method, which determines segmentation threshold automatically, was used to binary the filtered image to eliminate the background interference caused by adverse environment. The gray histogram is divided into two groups at a certain threshold, and the threshold is determined when the variance between the two groups is maximum. Further, the method can effectively distinguish the cross laser-pattern from the background [
23]. However, when the stray light is too bright, it brings noise to the acquired image, causing low discrimination to background and cross laser-pattern; this affects the accuracy of the segmentation threshold. In order to avoid this problem, the image acquisition system uses a band-pass filter film matching with the laser frequency and dust shield to form a darkroom, preventing the affects of stray light.
3.3. Cross Laser-Pattern Separation
The X and Y axis separation of cross laser is the premise to realize the center extraction and attitude positioning of the cross laser-pattern, and the foundation is to complete the extraction of the edge line of the cross laser-pattern. However, the traditional straight line detection algorithm, such as the Hough transformation method, takes a long time and has poor real-time performance, which does not meet the requirements of this project. With the characteristics of the project, the angle of the cross spot in the image coordinate system is less than ±5°, and the cross laser intersects the boundary of the field of view as shown in
Figure 4a. Here the rising and falling edges of the image is defined firstly.
As shown in the
Figure 7, the gray value curve of the image in the horizontal pixel direction is presented, here the segmentation threshold is the one that obtained by the maximum inter-class variance method mentioned above. In order to eliminate noise interference, a hysteresis is set on the basis of segmentation threshold. When the gray value of the searched pixel is greater than or equal to “ideal threshold plus hysteresis” and the gray value of the previous pixel is less than that pixel, the point is designated as the rising edge in that searching direction. When the gray value of the searched pixel is less than or equal to “ideal threshold minus hysteresis” and the gray value of the previous pixel is greater than that pixel, the point is designated as the falling edge in that searching direction.
Take the left edge straight line detection process of cross laser-pattern as an example, search each pixel line by line from left to right along horizontal direction, the algorithm is shown in
Figure 8.
is 1.2 times the cross-line width in pixel.
If the first searched edge is raising edge, then keep searching:
- ①
If the falling edge is searched, then stop searching:
If , then store the raising edge coordinates into the feature data set;
If , then return null.
- ②
If there is no falling edge in the searching direction, then return null;
If the first searched edge is falling edge, then keep searching:
- ①
If the raising edge is searched, then stop searching, and store the raising edge coordinates into the feature data set;
- ②
If there is no raising edge in the searching direction, then return null;
If there is no raising edge nor falling edge in the searching direction, then return null.
So far, the feature data set containing the pixel coordinates of the left edge of the cross spot could be obtained.
Least square method is a mathematical method to seek the best function matching of data, and its standard is the minimum sum of squares of errors. In this paper, the left edge feature data set was used as the sample to fit the most suitable edge line, realizing the left edge line extraction. For other cross laser-pattern edges in right, upper and lower direction, edge line extraction algorithm was similar to the left one, the difference is seen in the searching directions. Therefore, the cross-laser edge lines extraction was finished, and the result is shown in
Figure 9.
On this basis, the separation of X and Y axis line of cross laser-pattern was conducted, the algorithm is introduced as follow.
Taking the Y axis separation as an example, set the left side pixels’ gray value of left reference line, which forms by shifting the left edge line a certain distance left-side, to be zero, and set the right-side pixels’ gray value of right reference line, which forms by shifting the right edge line a certain distance to the right-side, to be zero. X axis separation is similar. In order to eliminate the influence of the overlapping part of the cross laser on the Gaussian fitting, the corresponding overlapping area on the X and Y axis was removed. The final separation result is shown in
Figure 10.
3.4. Gaussian Fitting
As shown in
Figure 11, there are two fitting sections. Fitting
Section 1 is perpendicular to the light strip, fitting
Section 2 is the sampling direction along y axis of image coordinate. The gray value distribution in each fitting section accords with Gaussian distribution [
24]. However, the section points are not located in integer pixel in fitting
Section 1, the gray value of the section points need to be determined by interpolation method, and the interpolation error is introduced. While the section points are all located in integer pixel in fitting
Section 2, there is no interpolation error and can significantly improve processing speed, so that fitting
Section 2 was used in this paper.
Taking the cross section of Y axis laser line of cross laser-pattern as an example as shown in the
Figure 12a, the gray distribution accords with Gaussian model as shown in
Figure 12b.
Therefore, it can be used to describe with Gaussian function model:
where
is the gray value of the pixel point of the cross section of Y axis laser line of cross laser-pattern in the image, and
is the y pixel value of Gaussian center of the cross section,
is the half width of the section. The Gaussian function model is used to fit the gray distribution of the cross section, and the control parameters
are solved to obtain the coordinate of the section.
The center points of all sections are used as the feature data set to fit the central line, and thus the central line of the laser line can be obtained.
3.5. Central Line Detection for Laser Line
To obtain the central line of the laser line, the proposed algorithm removes outlying points [
25] based on traditional line fitting method as shown in
Figure 13, the relevant algorithms are as follows:
Depending on the pixel radius, a subset of data is selected from the feature data set: the pixel radius is used to determine the effective pixel, which refers to the maximum distance between the effective pixel and the straight line. At the beginning of line fitting, the algorithm randomly makes a straight line at two points, and selects pixels in the radius range of the line to form a data subset;
Based on the data subset, a straight line is fitted and its Mean Square Distance (MSD) is calculated. The smaller the MSD value is, the closer the pixel is to the fitted line with higher quality;
A subset of the last fitted data is removed and the line is re-fitted based on the remaining data, and MSD is calculated at the same time;
Repeat the above procedure until all data in all feature data sets are fitted and then select the line with smallest MSD as the candidate line;
Optimize the candidate line and continuously remove the farthest outlying point, and re-fit the line based on the remaining point, and calculate the Line Fit Score (LFS):
where
PR is pixel radius. When the
LFS reaches the required minimum score, the current fitting line is returned.
Therefore, the equations of the central lines of X and Y axis line of the cross laser can be obtained separately. The coordinate of the intersection point of the two center lines is the coordinate of the center point of the cross laser-pattern. Besides, with the slopes of the two center lines, the angles of X and Y axis laser lines of cross laser-pattern in camera image coordinate can be obtained, namely the attitude information of the cross laser can be determined.
4. Experiments and Results
4.1. Principle Verification Experiment on Cross Center Positioning Accuracy of Cross Laser-Pattern
Since the center coordinates in theory of the cross laser-pattern cannot be obtained directly, the horizontal displacement measurement experiment was conducted to verify the positioning accuracy of the cross center indirectly. The image acquisition system was placed on a PI micro translation platform, and the accuracy of the translation platform is ±1 μm. The experimental schematic diagram and the experimental process diagram are shown in
Figure 14.
The experiment data are shown in
Table 1.
From the table, the conversion coefficient is 0.0359, that is, one pixel is equivalent to 0.0359 mm in the world coordinate system. Then the horizontal displacement measurement experiment was conducted. Before the measurement, the image coordinate system X axis was adjusted to be parallel to the shifting axis of PI micro translation platform by rotating the image coordinate system, that is, when the image acquisition system moved horizontally with the PI micro translation platform, the vertical coordinates of the cross laser-pattern in the image coordinate system remained constant.
After the calibration of conversion coefficient, the image acquisition system was ready to conduct displacement measurement experiment to verify cross center positioning accuracy. During the experiment, the cross laser was fixed as the measurement datum, and the PI micro translation stage provided displacement reference value to the image acquisition system, and with the measurement algorithm and conversion coefficient, the related displacement can be measured. The relationship between measurement error and displacement value is shown in
Figure 15:
After compensating the measured data according to the error relation curve shown in the figure, the results are shown in
Figure 16:
According to the experiment result, the accuracy of horizontal displacement measurement is better than ±3 μm, relative to the conversion coefficient of 0.0359, the center positioning accuracy is better than 0.2 pixels.
4.2. Principle Verification Experiment on the Attitude Positioning Accuracy of Cross Laser-Pattern
The attitude of cross laser refers to the angles of X or Y axis of cross laser line in the image coordinates. Since the theoretical angle value of X or Y axis laser line in image coordinates cannot be obtained directly, the attitude positioning accuracy was indirectly verified by a rolling angle measurement experiment.
The experimental schematic diagram and the experimental process is shown in
Figure 17:
Before the experiment, the cross laser is fixed to a high precision turntable with adapting part, the accuracy of the turntable is ±3”, and to ensure the laser projection axis was coaxial with the turntable axis, the laser position is adjusted. That is, the center of cross laser image does not change in the image coordinate when rotating the turntable. The measurement principle is shown in
Figure 18.
In order to express conveniently, the cross laser only draws the X axis laser line. Here,
is angle of the laser line at the initial moment in the image coordinate system and
is the angle of laser line in the image coordinate system after rotation.
represents the rotation angle measured by the image acquisition system and
represents reference value of the rotation angle obtained from the turntable system. Since the projection axis of cross laser cannot be guaranteed to be perpendicular to the receiving screen of the image acquisition system, the projection error will be introduced into the measurement [
26], and
represents the measurement error. The correlation is shown in
Table 2:
The repeatability experiment error curves are shown in
Figure 19:
Based on the repeatability error curve, the error average value is obtained, and the error model is established by using linear fitting method. The related models is shown in
Figure 20 and results is shown in
Figure 21:
According to the results, after compensation, the system angle measurement accuracy is better than ±10” and the repeatability accuracy is better than ±10”.
4.3. Verification Experiment under Simulated Smoke and Water Mist Environment
In order to verify the robustness of the proposed method under smoke and water mist environment, the following experiments were conducted.
4.3.1. Verification Experiment on Cross Center Positioning Accuracy of Cross Laser-Pattern
The schematic diagram of this experiment is shown as
Figure 22, the image acquisition system was placed on a PI micro translation platform, that was fixed on a tripod. A smoke generator and an ultrasonic atomizer were used to generate smoke and water mist, an acrylic tube was used to collect the smoke and water mist in the light path of the cross laser-pattern.
During the experiment, there was smoke and water mist in the light path of the cross laser-pattern. The cross laser was fixed as the measurement datum, and the PI micro translation platform moved at an interval of 5 mm as the reference displacement value. With the proposed measurement algorithm and the calibrated conversion coefficient, the related displacement can be measured. The relationship between measurement error and displacement value is shown as follows:
After compensating the measured data according to the error relation curve shown in
Figure 23, the compensation results are shown in
Figure 24:
According to the results, the proposed method still works under the environment of smoke and water mist. The accuracy of horizontal displacement measurement is better than ±10 μm, relative to the conversion coefficient of 0.0359, the center positioning accuracy is better than 0.6 pixels under the simulated smoke and water mist environment.
4.3.2. Verification Experiment on Attitude Positioning Accuracy of Cross Laser-Pattern
The experimental schematic diagram is shown in
Figure 25a, and the experiment procedure is shown
Figure 25b:
In this experiment, the image acquisition system was placed on an electrical turntable with an accuracy of ±4″. The cross laser-pattern was fixed as the measurement datum. The image acquisition system was rotated by the electrical turntable along the projection direction of the cross laser. With the proposed method, the measured rolling angles were obtained under the smoke and water mist environment, and the reference rolling angle values were obtained from the electrical turntable controlling software.
The repeatability experiment error curves under smoke and water mist environment are shown in
Figure 26:
Based on the repeatability error curve under smoke and water mist environment, the error average value was obtained, and the error model was established by using linear fitting method. The related models and results are shown in
Figure 27:
The related linear error model was used to determine error compensation; the compensated result is shown in
Figure 28:
According to the result, the system angle measurement accuracy, under smoke and water mist environment, is better than ±15” and the repeatability accuracy is better than ±15”.
5. Discussions and Conclusions
In this paper, cross laser-pattern is used as a cooperative marker. A method is proposed to detect the center point and attitude of a cross-laser image based on the combination of Gaussian fitting and least square fitting. In the principal verification experiment without smoke and water mist in the light path of the cross laser-pattern, the center positioning accuracy is better than 0.2 pixels, the angle detection accuracy is better than ±10”, and the processing speed is better than 0.1 s.
In the verification experiment under smoke and water mist environment, the proposed method still works, indicating that the method is robust, the center positioning accuracy is better than 0.6 pixels, the angle detection accuracy is better than ±15”, and the processing speed is still better than 0.1 s, which meets the requirements of real-time and precision of the project. Besides, according to the results, under a smoke and water mist environment, the proposed method still works while some other methods failed to process the digital images with poor contrast, low signal-to-noise ratio and uneven energy distribution, indicating the robustness of the method. However, it affects the accuracy of the proposed method, therefore, in order to further improve the accuracy of the proposed method under smoke and water mist environment. Environment compensation study needs to be conducted in the future research.


