Article

Antibacterial Fluorinated Diamond-like Carbon Coating Promotes Osteogenesis—Comparison with Titanium Alloy

1
Department of Orthopedic Surgery, Kanazawa Medical University, 1-1 Daigaku, Uchinada, Kahoku 920-0293, Japan
2
Department of Mechanical Engineering, Kanazawa Institute of Technology, 7-1 Ohgigaoka, Nonoichi 921-8501, Japan
*
Author to whom correspondence should be addressed.
Appl. Sci. 2021, 11(20), 9451; https://doi.org/10.3390/app11209451
Submission received: 13 September 2021 / Revised: 4 October 2021 / Accepted: 6 October 2021 / Published: 12 October 2021
(This article belongs to the Special Issue Recent Advances in Application of Coatings and Films)

Abstract

:

Featured Application

The authors investigated the effects of F-DLC-coated implants on bone union in dogs. Results have implications for the effect of implants on bone formation in human patients.

Abstract

Fluorinated diamond-like carbon (F-DLC) coating is biologically safe, provides superior antibacterial properties, and shows promise in preventing postoperative peri-implant infections. However, potential negative effects of this coating on in vivo bone formation and resorption have not been studied. The authors investigated the effects of F-DLC coatings on bone union in beagle dogs. Seventy-two solid columns of titanium alloy were prepared with equally spaced slits. Half of these columns were coated with F-DLC (Group F), and the others were left uncoated as controls (Group C). Columns were implanted in the femurs of beagle dogs, and in vivo bone formation and resorption were assessed 4, 8, and 12 weeks after implantation. In comparison to Group C, Group F showed significantly greater bone volume and trabecular thickness at Week 8 (p < 0.05) and Week 12 (p < 0.005) and significantly lower bone resorption activity, measured by the ratio of osteoclasts to bone surface and of eroded surface to bone surface, at Week 12 (p < 0.05). The F-DLC coating encouraged bone formation in vivo more effectively than uncoated titanium alloy, suggesting that F-DLC will prove to be a useful coating material for antibacterial intraosseous implants.

1. Introduction

Recently, orthopedic implant surgeries have become increasingly routine, including artificial joint replacement, spinal instrumentation, and fracture repair. Such procedures can do much to improve the patient’s quality of life, but they are accompanied by the risk of complications. One of the most serious of these is postoperative peri-implant infection, which can occur regardless of patient age. The incidence rate of peri-implant infection is reported at 2.6% to 11.9% for spinal instrumentation surgery [1,2] and 0.2% to 8.5% for implant arthroplasty [3,4,5,6,7,8]. Methods have also been investigated for applying coatings containing silver, gold, iodine, or antibiotics such as gentamycin or vancomycin to the metal surface of an implant, with the aim of preventing peri-implant infection [9,10,11,12,13,14,15,16,17,18].
Diamond-like carbon (DLC) is a general term for carbon thin films that have diamond-like properties, such as high hardness, electrical insulation, and infrared transmission [19]. F-DLC coating with added fluorine has an anticoagulant effect. It is now being used in clinical settings and is expected to have applications in artificial blood vessels and indwelling stents within blood vessels [20]. Yonezawa et al. reported the use of F-DLC coating on the most common titanium alloy in orthopedic implants, for the purpose of suppressing infection around the implant, and noted that this coating provided excellent antibacterial properties and safety levels [21].
Effects on osteogenesis are also a concern. The osteogenesis-inducing effects of DLC coating [22,23,24] are attributable in part to its highly hydrophilic properties. No studies have yet been performed on the effects of the F-DLC coating, which is highly hydrophobic, on either osteogenesis or bone resorption. If the F-DLC coating inhibits bone union, its use in intraosseous implants will be problematic. Therefore, to obtain a better understanding of the risks and benefits of such use, the authors investigated the effects of F-DLC coating on osteogenesis in vivo compared to uncoated titanium alloy.
In addition to these effects on osteogenesis, the slow release of F ions from the F-DLC coating was measured over time. This supplemental experiment was performed to address the potential negative effects of F ions in vivo during long-term use, since fluorine can elicit both direct cytotoxicity and metabolic toxicity and could potentially bond with calcium or magnesium in the body to cause hypocalcemia or hypomagnesemia.

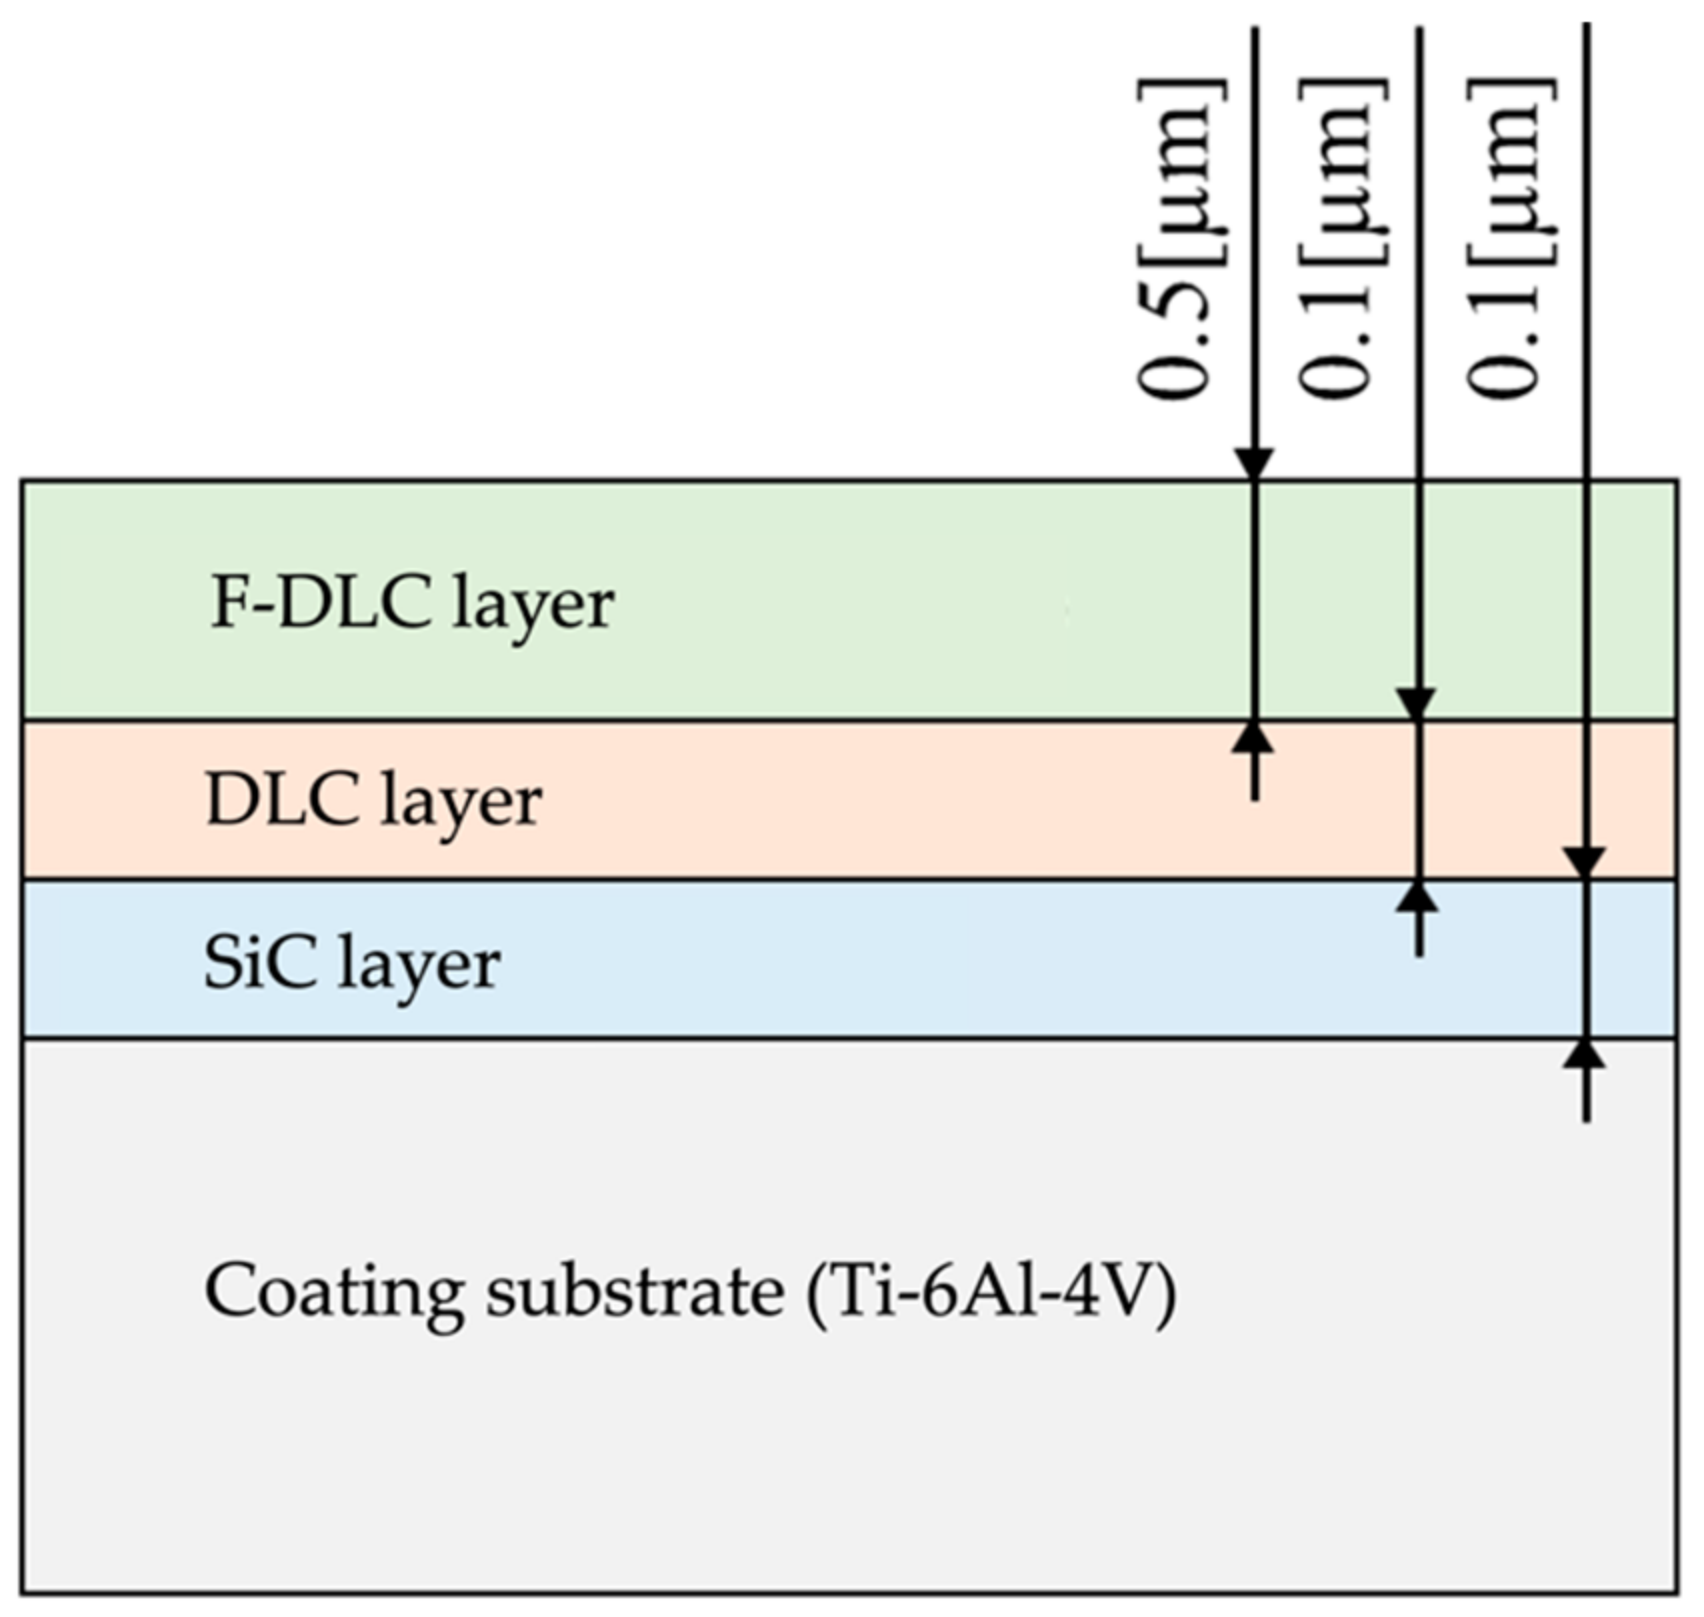
2. Materials and Methods

This study was designed to investigate the effects of F-DLC coated titanium alloy on in vivo osteogenesis and was conducted with the approval of the Animal Research Ethics Review Board at the authors’ institution (Approval No. 2017-65). Twelve beagle dogs (females, 10 months of age, body weight 10 kg) were used. This experiment focused on local bone response rather than systemic response. The experiment used both femurs of each dog to minimize the number of animals used, out of consideration for animal welfare.
Test specimens were of Ti-6Al-4V metal alloy, consisting of 90% titanium, 6% aluminum, and 4% vanadium by mass fraction. The alloy is widely used in bone anchoring implants because of its high bio-affinity. The coating method was as reported by Yonezawa [21]. In this study, the coating was applied in three layers sequentially, using a radiofrequency inductively coupled plasma chemical vapor deposition (CVD) technique. The first layer of silicon carbide (SiC) coating was applied over the metal alloy and was followed by a second layer of DLC coating (a-C:H structure), and a third layer of F-DLC coating (23 at.%F+a-C:H:F structure). Coating thickness was 0.1 µm for SiC, 0.1 µm for DLC, and 0.5 µm for F-DLC (Figure 1).
The test pieces were shaped into solid columns 5 mm in diameter and 20 mm in length. Parallel slits 0.5 mm wide and 2 mm deep were made in each column along the short axis in 12 locations at 1mm intervals. The test pieces were divided into the group with F-DLC coating (Group F, Figure 2a) and the control group with no coating (Group C, Figure 2b).
For surgery, the dogs were placed under general anesthesia with vecuronium (0.3 mg/kg), midazolam (0.1 mg/kg), and propofol (5 mg/kg/h). The antibiotic cefazolin sodium (50 mg/kg) was administered preoperatively. Both hind legs were shaved, the hind legs and area around the tail were disinfected with isodine, and the skin was anesthesized with 0.5% lidocaine hydrochloride. A 10 cm skin incision was made in the anterior lateral margin of the femur, from the greater trochanter towards the patella level. The initial cut was made between the tensor fascia lata muscle and the quadriceps femoris muscle. The diaphysis was exposed by placing forward traction on the quadriceps femoris muscle. A ϕ5.0 mm drill was used to create holes at 3 sites along the long axis in the diaphysis region of the femur (the center of the diaphysis, 2 cm proximal to the center, and 2 cm distal to the center). The diameter of each hole was then enlarged using a ϕ5.1 mm reamer. During this process, the drill and reamer were cooled continuously to minimize irritation to the bone. After the holes were completed, they were washed with saline solution to remove residual tissue. Three implants from Group F or Group C were inserted into the three holes in each femur, one implant per hole, from the outside inward. In total, 6 implants were placed in each animal.
At 4, 8, or 12 weeks after implantation, the dogs were placed under general anesthesia in the same manner as described for implantation. Animals were then sacrificed by intravenous injection of KCL, and femoral specimens were collected (Figure 3).
At each time point (4, 8, and 12 weeks), 8 femur specimens were collected. In preparation for double staining of the bones, tetracycline had been injected subcutaneously for yellow fluorescence labeling 6 days and 2 days prior to implantation, and calcein had been injected subcutaneously for green fluorescence labeling 6 days and 2 days prior to the collection of bone specimens. Under fluorescence microscopy, it was thus possible to differentiate between bone calcified before and after implantation. Immediately after collection of the femur specimens, each bone was fixed with 70% ethanol and cut into 3 pieces, so that each piece contained one implant. Each piece was polished and stained with Villanueva Osteochrome Bone Stain to create cross-sectional femoral specimens. A total of 72 specimens were created—24 specimens for each collection week.
Bone union is considered to be most affected by cortical bone. In this study, the surfaces of slits that were in contact with cortical bone (Figure 4) were examined under natural light, polarized light, and fluorescent light to evaluate the maturity of newly formed tissue.
Bone histomorphometry was then applied to measure eight parameters. The first was bone mass (%), the percentage of area inside the slit that was covered by bone. The second was trabecular thickness (µm), the mean width of bone inside the slit. The third was osteoclast number (N/mm), the number of osteoclasts per bone surface length. The fourth was bone resorption area (%), the percentage of resorption area in relation to bone surface perimeter. The fifth was osteoblast number (N/mm), the number of osteoblasts per bone surface length. The sixth was osteoid area (%), the percentage of osteoid area in relation to bone surface perimeter. The seventh was calcification rate (µm/day), the increase in distance between double-labeled cells/day. The eighth was the annual rate of bone formation (µm/year).
To confirm F ions elution from the F-DLC coated titanium alloy, the authors used test pieces that were solid round columns of 25 mm diameter and 5 mm thickness, polished to a mirror finish (Ra = 0.1 µm). Testing was performed by lanthanum–alizarin complexone absorption spectrometry in accordance with the methods specified in the JIS K0102 Testing Methods for Industrial Wastewater, Japanese Industrial Standards (JIS) [25].
The coating was applied as described above. To replicate in vivo conditions, immersion was conducted in a dark room protected from ultraviolet rays. The ambient temperature was set at 37 °C ± 0.2 °C to simulate body temperature. Test pieces were left to stand in normal saline solution within a desiccator, which was kept in a thermostatic chamber for a specified time. That soaking solution was then used as the test solution. The pieces were soaked for 2 weeks, 4 weeks, and 8 weeks. Each solution was tested 3 times.
For statistical analysis, Student’s t-test was used to compare Group F and Group C at Weeks 4, 8, and 12 for bone union and at 2, 4, and 8 weeks for F ions elution. All data were shown as mean values for each group ± standard deviation. The significance level was set at p < 0.05. Results were graphed with standard deviations.

3. Results

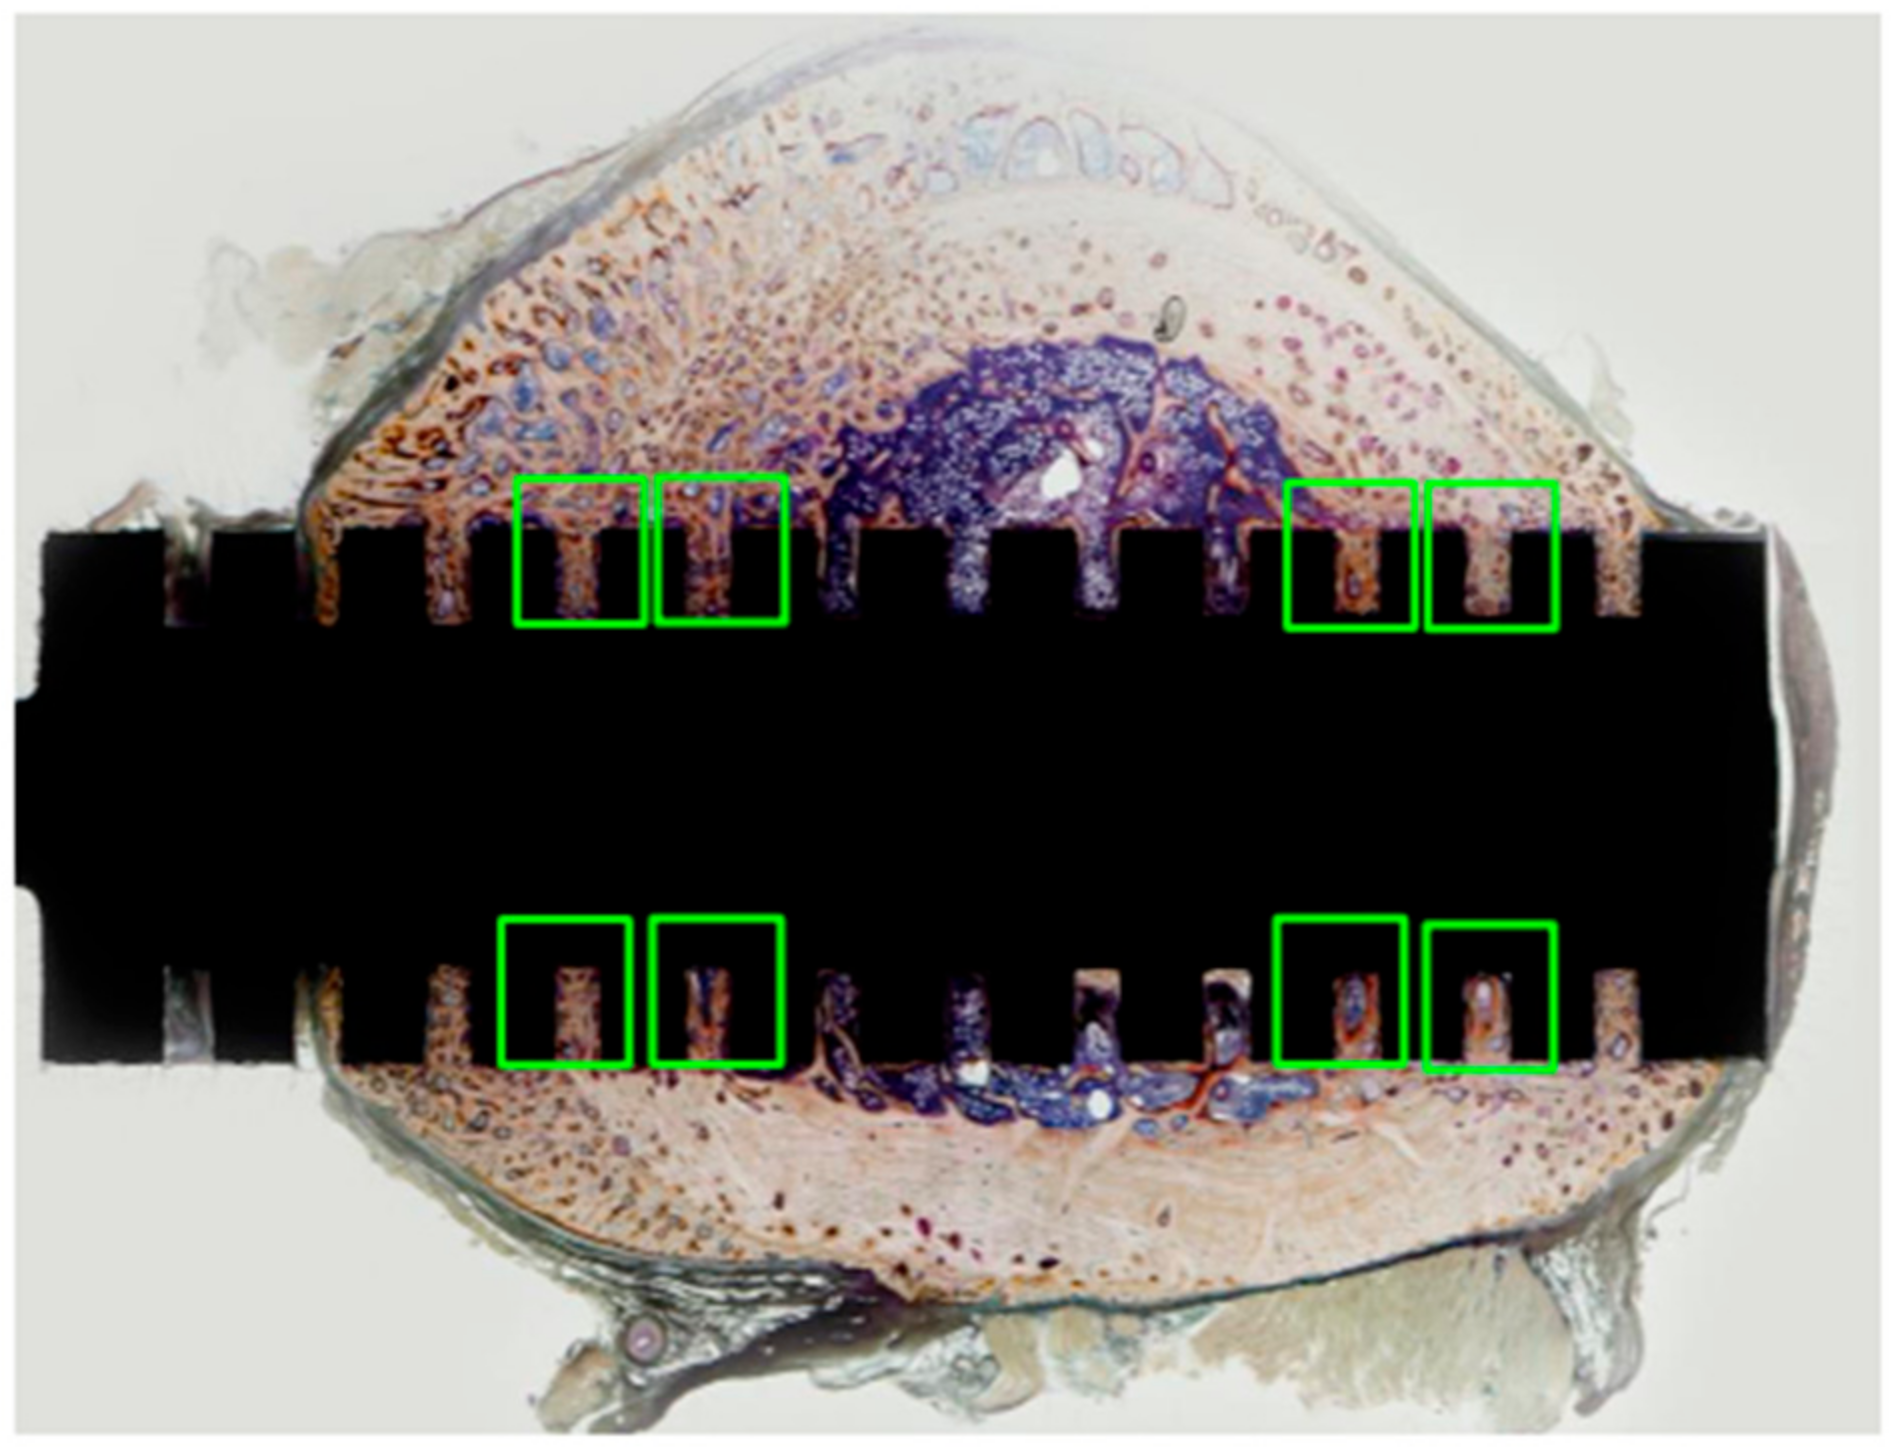
3.1. Assessing the Maturity of Newly Formed Tissue under Natural Light, Polarized Light and Fluorescent Light

3.1.1. Observations under Natural Light

The observations under Natural Light of the specimen is shown in Figure 5. At Week 4, the presence of immature fibroblasts and fibrous osteoids confirmed the formation of fibrous bone tissue in both groups. At Week 8, fibroblasts and fibrous osteoids were visible in Group C, while in Group F, trabeculae were forming deep in the slits and no immature cells were visible. At Week 12, trabeculae were forming deep in the slits in Group C as well, but immature cells such as fibroblasts and fibrous osteoids were still visible. Trabeculae were denser in Group F than in Group C.
Top row from left to right: Group C at Week 4, Week 8, and Week 12. Bottom row from left to right: Group F at Week 4, Week 8, and Week 12. At Week 4, the presence of immature fibroblasts and fibrous osteoids confirmed the formation of fibrous bone tissue in both groups. At Week 8, fibroblast and fibrous osteoids were visible in Group C, while in Group F, trabeculae were forming deep in the slits and no immature cells were visible. At Week 12, trabeculae were forming deep in the slits in Group C, but immature cells such as fibroblasts and fibrous osteoids were still visible. Trabeculae were denser in Group F than in Group C.

3.1.2. Observations under Polarized Light

The observations under polarized light of the specimen is shown in Figure 6. Lamellar bone was clearly visible under polarized light. Lamellar bone and osteons were visible in Group F at Week 8, while not yet visible in Group C. At Week 12, Group F showed more lamellar bone and more osteons than Group C.

3.1.3. Observations under Fluorescent Light

The observations under fluorescent light of the specimen is shown in Figure 7. Newly formed bone tissue was identified with calcein-green labeling under fluorescent light. In both Group F and Group C, calcein-labeled areas increased over time from Week 8 to Week 12, indicating large areas of new bone formation. At Week 12, double labeling of specimens was noted in Group F, indicating more extensive bone formation than in Group C.

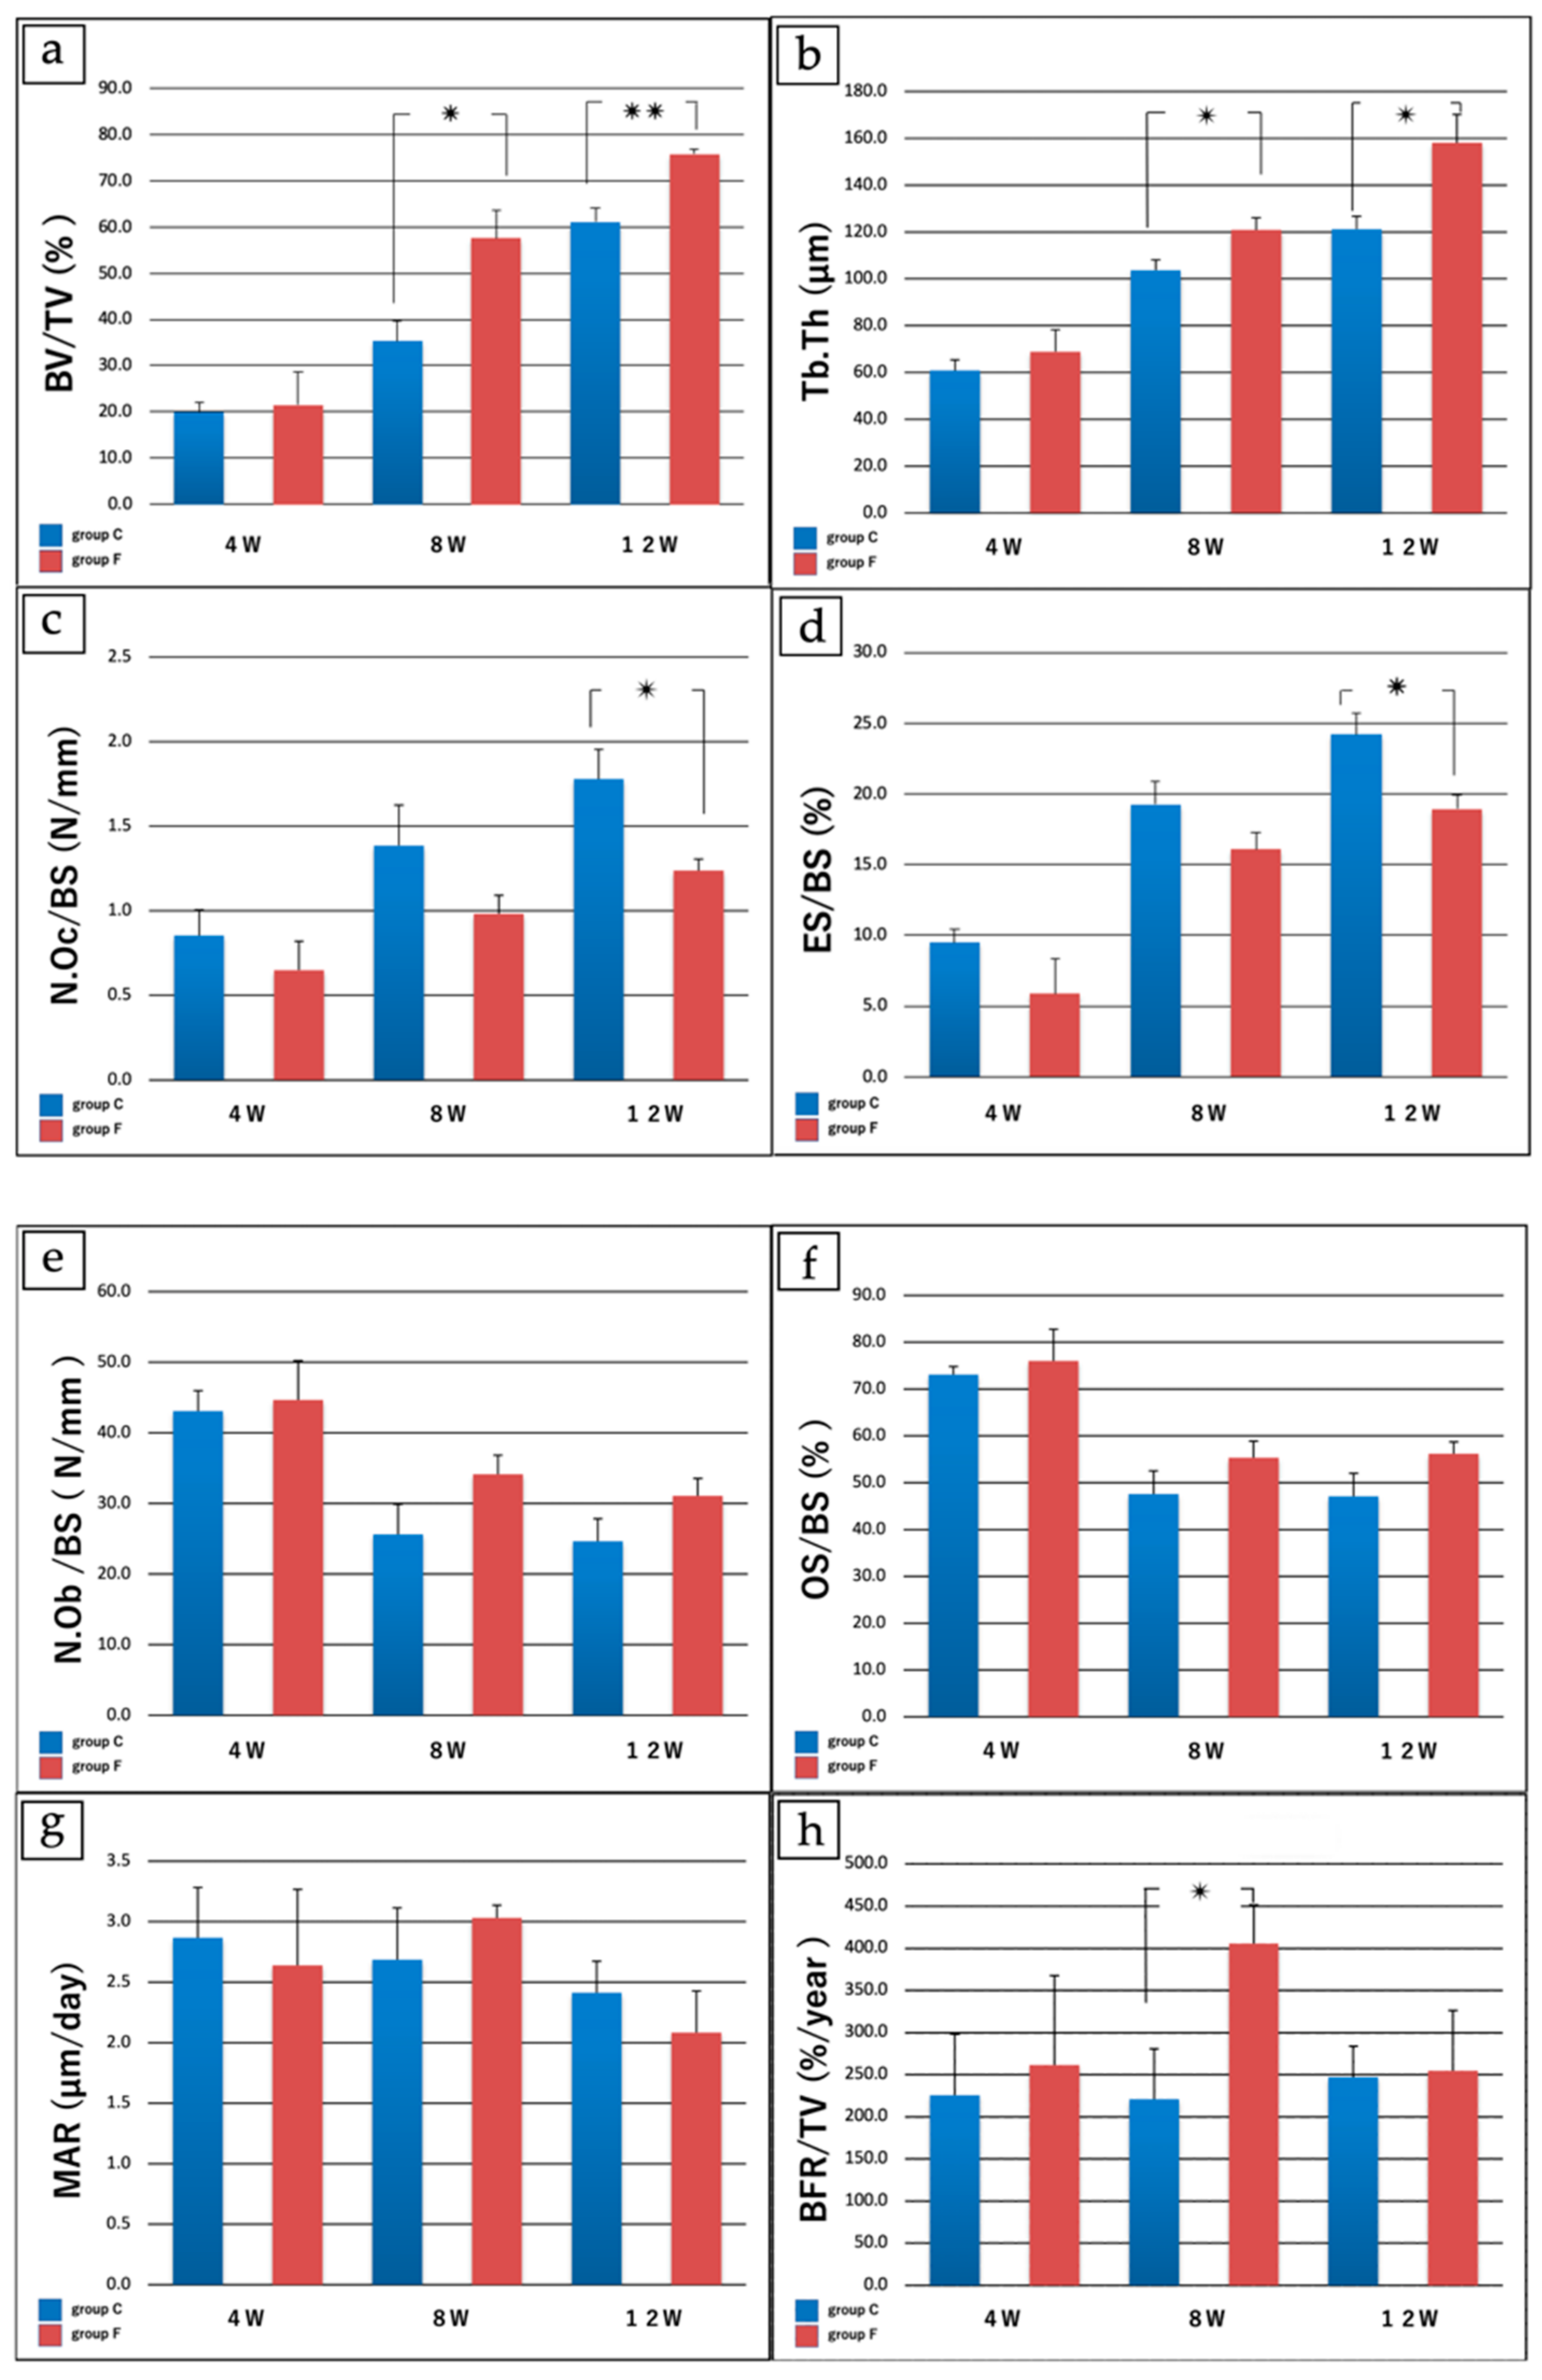
3.2. Results of Bone Histomorphometry

The results of bone tissue morphometry are shown in Figure 8a–h and Table 1.

3.2.1. Bone Volume/Tissue Volume (%)

Mean bone volume/tissue volume ± SD at Week 8 was 35.37 ± 8.70% in Group C vs. 57.53 ± 12.4% in Group F (p < 0.05) and at Week 12 was 61.17 ± 2.12% in Group C vs. 75.77 ± 5.88% in Group F (p < 0.005), with a significantly greater increase in Group F.

3.2.2. Trabecular Thickness (µm)

Mean trabecular thickness ± SD at Week 8 was 103.71 ± 8.81 µm in Group C vs. 120.87 ± 10.5 µm in Group F (p < 0.05), and at Week 12 was 121.19 ± 11.1 µm in Group C vs. 158.11 ± 24.2 µm in Group F (p < 0.05), with a significantly greater increase in Group F.

3.2.3. Number of Osteoclasts/Bone Surface Length (N/mm)

Mean number of osteoclasts per bone surface ± SD at Week 12 was 1.78 ± 0.35/mm2 in Group C vs. 1.28 ± 0.13/mm2 in Group F (p < 0.05), with a significantly greater decrease in Group F.

3.2.4. Eroded Surface/Bone Surface (%)

Mean eroded surface/bone surface ±SD (%) at Week 12 was 24.19 ± 3.03% in Group C vs. 18.94 ± 1.98% in Group F (p < 0.05), with a significantly greater decrease in Group F.

3.2.5. Number of Osteoblasts/Bone Surface Length (N/mm), Osteoid Surface/Bone Surface (%), Mineral Apposition Rate (µm/day), and Bone Formation Rate/Tissue Volume (%/year)

For Figure 8e–g, no significant differences were noted between the two groups at any time point. For Figure 8h, at 8 weeks the ratio of bone formation rate/tissue volume was significantly greater in Group F (220.1 ± 119.08%/year in Group C vs. 405.47 ± 92.29%/year in Group F (p < 0.05)).

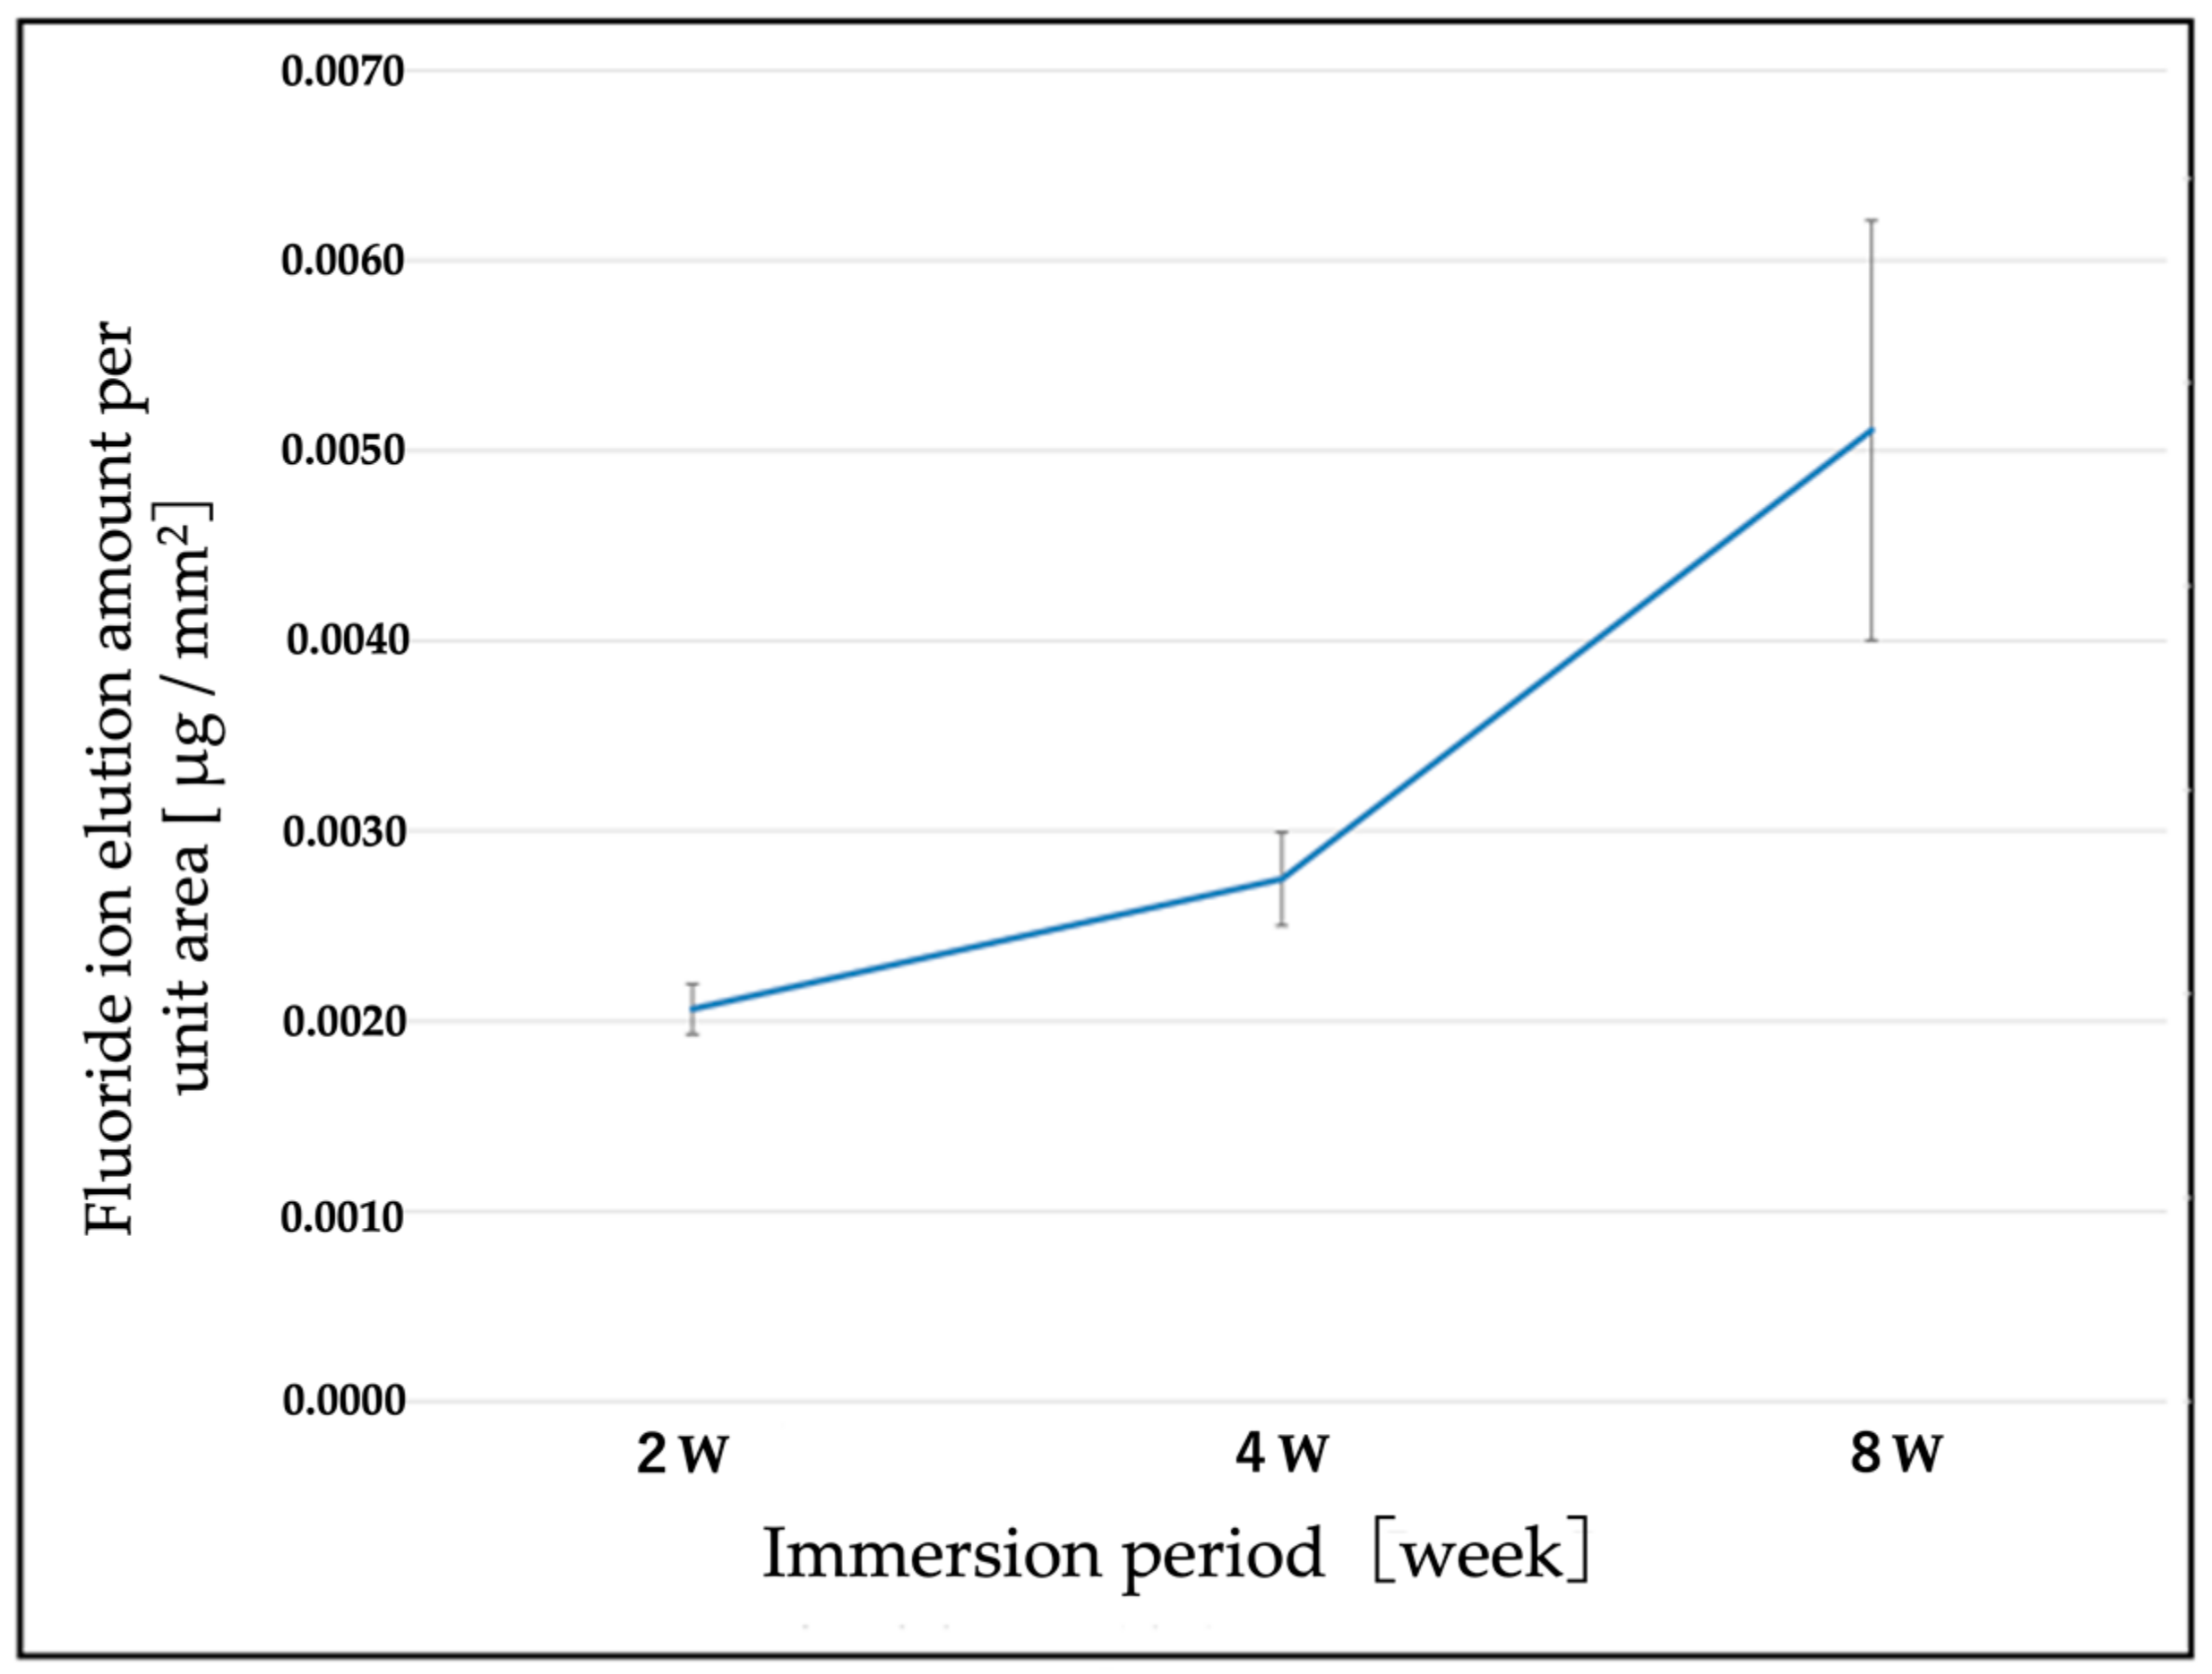
3.3. Elution of F Ions from the F-DLC Coated Titanium Alloy

Mean fluoride elution volume was 0.00822 ± 0.00053 µg/mm2 (range: 0.00749–0.00844) after 2 weeks of immersion, 0.0109 ± 0.001 µg/mm2 (range: 0.01–0.0123) after 4 weeks, and 0.0204 ± 0.0044 µg/mm2 (range: 0.0145–0.0251) after 8 weeks. The immersion period (weeks) for test pieces and fluoride ion elution volume per unit area are shown in Figure 9. The amount of fluoride ions increased over time.

4. Discussion

This study compared conventional titanium alloy implants with F-DLC-coated titanium alloy implants to investigate the effects of F-DLC coating on bone formation in vivo. At Week 12, the specimens in Group F were in the process of uncoupling bone formation and resorption. Osteoclasts and bone resorption surface were being reduced, and bone formation was outpacing resorption. Specimens in Group C had not yet reached uncoupling. Lamellar bone, which is formed only in the remodeling phase of bone union, was generated in greater amounts in Group F than in Group C. Immature cells such as fibroblasts and fibrous osteoids were observed in Group C but not in Group F, suggesting that the remodeling phase started earlier in Group F. These findings, which suggest that bone union was more accelerated with F-DLC coated implants than with non-coated titanium alloy implants, are supported by the data showing that bone formation rate/tissue volume increase was more significant in Group F than in Group C.
DLC coating without fluorine has been reported to promote bone union [22,23,24], and the bone union-promoting action of F-DLC in the present study may have been affected by the DLC in the coating as well as by the fluorine portion. Kawaguchi et al. have speculated that bone union could be accelerated because the DLC coating is more hydrophilic than titanium coating [26], but that reasoning is inconsistent with the highly hydrophobic properties of the F-DLC coating. The accelerated osteogenesis seen in Group F may instead be attributable to F ions eluted from the F-DLC-coating.
Supplemental experiment 2 confirmed elution of F ions from the F-DLC-coating over time. Fluorine reacts with substances such as hydroxyapatite or calcium carbonate to form fluorides such as fluorinated apatite, fluorinated calcium, and sodium fluoride. Farley et al., Khokher et al. and Wergedal et al. have reported that fluoride promotes bone formation by directly stimulating osteoblasts and alkaline phosphatase (ALP) activity [27,28,29,30,31]. In this regard, Messer et al. and McCann et al. have reported that fluorinated apatite and fluorinated calcium inhibited bone resorption because of the resistance to acidic conditions produced by osteoclasts [32,33]. Liu et al. have reported that fluorine-containing hydroxyapatite inhibited osteoclast proliferation and promoted apoptosis of osteoclasts [34]. Varughese and Moreno have described the effects of fluoride on the crystal growth of calcium apatites as dependent on fluoride concentration [35,36,37,38,39], and Bhawal et al. have reported that low-level sodium fluoride promoted osteogenesis [40], suggesting that fluoride affected bone formation in a variety of ways. This study showed a decrease in osteoclasts at Week 12, potentially attributable to slow elution of F ions from the implanted F-DLC coated titanium alloy. After reaching a concentration sufficient to affect the osteoclasts, the F ions may have formed fluoride compounds and inhibited bone resorption.
Sodium fluoride has been reported by Bhawal et al., Brown et al. and Lee et al. to demonstrate anti-inflammatory action [40,41,42]. During the process of bone repair after a fracture, excessive or prolonged inflammation was associated with extended cell and callus proliferation, leading to excessive callus formation and delaying the remodeling phase. These findings suggested that eluted F ions formed sodium fluoride, and that the resulting anti-inflammatory action shortened the duration of inflammation during early bone union. The shortening of the cell and callus proliferation phases may have accelerated progression to the remodeling phase in Group F.
Fluorine is a biological trace element and exists in the body at a level of 0.0037%. Fluorine is reported to elicit direct cytotoxicity as well as metabolic toxicity and can bond with either calcium or magnesium to cause hypocalcemia or hypomagnesemia. In this study, to assess the biological toxicity of eluted fluorine, the elution volume was calculated for F-DLC coating applied to the implants to be used.
The expected elution volume was calculated using the example of a plate having maximum surface area (100 mm × 30 mm × 7 mm). Calculations indicated that the eluted volume would be much lower than the reported toxic dose of fluoride (≥0.1 mg/kg/day [43]), suggesting a low level of biological toxicity for the implant.
This study had limitations. First, although the F ions elution volume was much lower than the biotoxicity threshold value, implants were assessed for only 8 weeks. Long-term measurement of F ions elution from the F-DLC coating is needed. Second, this study was performed in beagle dogs. Human studies will also be required. However, even with these limitations, study findings confirmed that the F-DLC coating possessed excellent antibacterial properties and safety profile and had fewer negative effects than titanium alloy coating in categories such as inhibition or abnormal acceleration of bone union.

5. Conclusions

This study showed that titanium alloy with F-DLC coating promoted bone growth and was eluted at a level far below the reported toxic dose of fluoride. Based on its antibacterial and bone union-promoting properties, F-DLC shows promise as a coating material for bone implants.

6. Patents

Masahito Kawaguchi, Patent No.: US 10,695,467B2.

Author Contributions

Conceptualization, M.K.; methodology, M.K. and K.S.; validation, T.S. and A.Y.; formal analysis, M.K., T.I. and A.K.; investigation, T.S., K.Y. and A.Y.; resources, T.S.; data curation, T.S. and A.Y.; writing—original draft preparation, T.S., A.Y. and M.K.; writing—review and editing, T.S., M.K., T.I. and A.K.; visualization, T.S. and A.Y.; supervision, N.K. and K.S.; project administration, N.K.; funding acquisition, M.K. and K.S. All authors have read and agreed to the published version of the manuscript.

Funding

This research was supported by AMED under Grant Number JP18lm0203005 (number A54).

Institutional Review Board Statement

The study was conducted according to the guidelines of the Declaration of Helsinki and approved by the Ethics Committee of Kanazawa Medical University (Approval No. 2017-65).

Informed Consent Statement

Not applicable.

Data Availability Statement

Not applicable.

Conflicts of Interest

The authors declare no conflict of interest.

References

  1. Davne, S.H.; Myers, D.L. Complications of lumbar spinal fusion with transpedicular instrumentation. Spine 1992, 17 (Suppl. 6), S184–S189. [Google Scholar] [CrossRef] [PubMed]
  2. Sponseller, P.D.; LaPorte, D.M.; Hungerford, M.W.; Eck, K.; Bridwell, K.H.; Lenke, L.G. Deep wound infections after neuromuscular scoliosis surgery: A multicenter study of risk factors and treatment outcomes. Spine 2000, 25, 2461–2466. [Google Scholar] [CrossRef] [PubMed]
  3. Sperling, J.W.; Kozak, T.K.; Hanssen, A.D.; Cofield, R.H. Infection after shoulder arthroplasty. Clin. Orthop. Relat. Res. 2001, 382, 206–216. [Google Scholar] [CrossRef] [PubMed]
  4. Minnema, B.; Vearncombe, M.; Augustin, A.; Gollish, J.; Simor, A.E. Risk factors for surgical-site infection following primary total knee arthroplasty. Infect. Control Hosp. Epidemiol. 2004, 25, 477–480. [Google Scholar] [CrossRef]
  5. Bengtson, S.; Knutson, K. The infected knee arthroplasty. A 6-year follow-up of 357 cases. Acta Orthop. Scand. 1991, 62, 301–311. [Google Scholar] [CrossRef] [Green Version]
  6. Hill, G.E.; Droller, D.G. Acute and subacute deep infection after uncemented total hip replacement using antibacterial prophylaxis. Orthop. Rev. 1989, 18, 617–623. [Google Scholar]
  7. Wymenga, A.B.; van Horn, J.R.; Theeuwes, A.; Muytjens, H.L.; Slooff, T.G. Perioperative factors associated with septic arthritis after arthroplasty. Prospective multicenter study of 362 knee and 2,651 hip operations. Acta Orthop. Scand. 1992, 63, 665–671. [Google Scholar]
  8. Phillips, C.B.; Barrett, J.A.; Losina, E.; Mahomed, N.N.; Lingard, E.A.; Gaudagnoli, E.; Baron, J.A.; Harris, W.H.; Poss, R.; Katz, J. Incidence rates of dislocation, pulmonary embolism, and deep infection during the first six months after elective total hip replacement. J. Bone Joint Surg. Am. 2003, 85, 20–26. [Google Scholar] [CrossRef]
  9. Lucke, M.; Schmidmaier, G.; Sadoni, S.; Wildemann, B.; Schiller, R.; Haas, N.P.; Raschke, M. Gentamicin coating of metallic implants reduces implant-related osteomyelitis in rats. Bone 2003, 32, 521–531. [Google Scholar] [CrossRef]
  10. Antoci, V., Jr.; Adams, C.S.; Hickok, N.J.; Shapiro, I.M.; Parvizi, J. Vancomycin bound to Ti rods reduces periprosthetic infection: Preliminary study. Clin. Orthop. Relat. Res. 2007, 461, 88–95. [Google Scholar] [CrossRef]
  11. Neut, D.A.; Dijkstra, R.J.; Thompson, J.I.; Kavanagh, C.; van der Mei, H.C.; Busscher, H.J. Biodegradable gentamicin-hydroxyapatite-coating for infection prophylaxis in cementless hip prostheses. Eur. Cell Mater. 2015, 2, 42–55. [Google Scholar] [CrossRef]
  12. Noda, I.; Miyaji, F.; Ando, Y.; Miyamoto, H.; Shimazaki, T.; Yonekura, Y.; Miyazaki, M.; Mawatari, M.; Hotokebuchi, T. Development of novel thermal sprayed antibacterial coating and evaluation of release properties of silver ions. J. Biomed. Mater. Res. Part B 2009, 89B, 456–465. [Google Scholar] [CrossRef]
  13. Funao, H.; Nagai, S.; Sasaki, A.; Hoshikawa, T.; Tsuji, T.; Okada, Y.; Koyasu, S.; Toyama, Y.; Nakamura, M.; Aizawa, M.; et al. A novel hydroxyapatite film coated with ionic silver via inositol hexaphosphate chelation prevents implant-associated infection. Sci. Rep. 2016, 6, 23238. [Google Scholar] [CrossRef] [Green Version]
  14. Ando, Y.; Miyamoto, H.; Noda, I.; Sakurai, N.; Akiyama, T.; Yonekura, Y.; Shimazaki, T.; Miyazaki, M.; Mawatari, M.; Hotokebuchi, T. Calcium phosphate coating containing silver shows high antibacterial activity and low cytotoxicity and inhibits bacterial adhesion. Mater Sci. Eng. C 2010, 30, 175–180. [Google Scholar] [CrossRef]
  15. Zainali, K.; Danscher, G.; Jakobsen, T.; Jakobsen, S.S.; Baas, J.; Møller, P.; Bechtold, J.E.; Soballe, K. Effects of gold coating on experimental implant fixation. J. Biomed. Mater. Res. A 2009, 88, 274–280. [Google Scholar] [CrossRef] [Green Version]
  16. Shirai, T.; Shimizu, T.; Ohtani, K.; Zen, Y.; Takaya, M.; Tsuchiya, H. Antibacterial iodine-supported titanium implants. Acta Biomater. 2011, 7, 1928–1933. [Google Scholar] [CrossRef] [Green Version]
  17. Stuart, B.W.; Stan, G.E.; Popa, A.C.; Carrington, M.J.; Zgura, I.; Necsulescu, M.; Grant, D.M. New solutions for combatting implant bacterial infection based on silver nano-dispersed and gallium incorporated phosphate bioactive glass sputtered films: A preliminary study. Bioact. Mater. 2021, 8, 325–340. [Google Scholar] [CrossRef]
  18. Bee, S.-L.; Bustami, Y.; Hamid, A.U.; Lim, K.; Hamid, Z.A.A. Synthesis of silver nanoparticle-decorated hydroxyapatite nanocomposite with combined bioactivity and antibacterial properties. J. Mater. Sci. Mater. Med. 2021, 32, 106. [Google Scholar] [CrossRef]
  19. Aisenberg, S.; Chabot, R. Ion-beam deposition of thin films of diamondlike carbon. J. Appl. Phys. 1971, 42, 2953. [Google Scholar] [CrossRef]
  20. Saito, T.; Hasebe, T.; Yohena, S.; Matsuoka, Y.; Kamijo, A.; Takahashi, K.; Suzuki, T. Antithrombogenicity of fluorinated diamond-like carbon films. Diam. Relat. Mat. 2005, 14, 1116–1119. [Google Scholar] [CrossRef]
  21. Yonezawa, K.; Kawaguchi, M.; Kawahara, N. Evaluation of antibacterial and cytotoxic properties of a fluorinated diamond-like carbon coating for the development of antibacterial medical implants. Antibiotics 2020, 9, 495. [Google Scholar] [CrossRef]
  22. Mine, Y.; Nakatani, T.; Okamoto, K.; Hara, S.; Takagi, K.; Nikawa, H. Impact of biomimetic diamond-like carbon coated titanium on osteoblast and osteoclast differentiation in vitro. J. Photopolym. Sci. Technol. 2014, 27, 373–378. [Google Scholar] [CrossRef] [Green Version]
  23. Mine, Y.; Nakatani, T.; Okamoto, K. Biomimetic diamond-like carbon coated titanium inhibits RANKL-dependent osteoclast differentiation in vitro. J. Photopolym. Sci. Technol. 2012, 25, 523–528. [Google Scholar] [CrossRef]
  24. Shuto, T.; Nakatani, T.; Okamoto, K.; Saizaki, N.; Mimura, S.; Kunitsugu, S.; Nikawa, H. Differentiation of osteoblast and osteoclast cells on hydrogenated-tetrahedral amorphous carbon coated titanium. J. Photopolym. Sci. Technol. 2016, 29, 413–418. [Google Scholar] [CrossRef] [Green Version]
  25. Japanese Industrial Standard: JIS K 0102:2016. Testing Methods for Industrial Wastewater; General Incorporated Association Industrial Environment Management Association; Japanese Standards Association: Tokyo, Japan, 2016; pp. 108–114. [Google Scholar]
  26. Kawaguchi, M.; Shintani, K.; Kawahara, N. Bone formation at Ti-6Al-7Nb scaffolds consisting of 3D honeycomb frame and diamond-like carbon coating implanted into the femur of beagles. J. Biomed. Mater. Res. B Appl. Biomater. 2021, 109, 1283–1291. [Google Scholar] [CrossRef]
  27. Farley, J.R.; Wergedal, J.E.; Baylink, D.J. Fluoride directly stimulates proliferation and alkaline phosphatase activity of bone-forming cells. Science 1983, 222, 330–332. [Google Scholar] [CrossRef]
  28. Marie, P.J.; De Vernejoul, M.C.; Lomri, A. Stimulation of bone formation in osteoporosis patients treated with fluoride associated with increased DNA synthesis by osteoblastic cells in vitro. J. Bone Min. Res. 1992, 7, 103–113. [Google Scholar] [CrossRef]
  29. Khokher, M.A.; Dandona, P. Fluoride stimulates [3H]thymidine incorporation and alkaline phosphatase production by human osteoblasts. Metabolism 1990, 39, 1118–1121. [Google Scholar] [CrossRef]
  30. Wergedal, J.E.; Lau, K.H.W.; Baylink, D.J. Fluoride and bovine bone extract influence cell proliferation and phosphatase activities in human bone cell cultures. Clin. Orthop. 1988, 233, 274–282. [Google Scholar] [CrossRef]
  31. Taves, D.R. New approach to the treatment of bone disease with fluoride. Fed. Proc. 1970, 29, 1185–1187. [Google Scholar] [PubMed]
  32. Messer, H.H.; Armstrong, W.D.; Singer, L. Fluoride, parathyroid hormone and calcitonin: Effects on metabolic processes involved in bone resorption. Calc. Tiss. Res. 1973, 13, 227–233. [Google Scholar] [CrossRef]
  33. McCann, H.G. Reaction of fluoride ion with hydroxyapatite. J. Biol. Chem. 1953, 201, 247–259. [Google Scholar] [CrossRef]
  34. Liu, S.; Zhou, H.; Liu, H.; Ji, H.; Fei, W.; Luo, E. Fluorine-contained hydroxyapatite suppresses bone resorption through inhibiting osteoclasts differentiation and function in vitro and in vivo. Cell Prolif. 2019, 52, e12613. [Google Scholar] [CrossRef]
  35. Rich, C.; Feist, E. The Action of Fluoride on Bone. In Fluoride in Medicine; Vischer, T., Ed.; Hans Huber Pub.: Bern, Switzerland, 1970; pp. 70–87. [Google Scholar]
  36. Hedlund, L.R.; Gallagher, J.C. Increased incidence of hip fracture in osteoporotic women treated with sodium fluoride. J. Bone Miner. Res. 1989, 4, 223–225. [Google Scholar] [CrossRef]
  37. Varughese, K.; Moreno, E.C. Crystal growth of calcium apatites in dilute solutions containing fluoride. Calif. Tiss. Int. 1981, 33, 431–439. [Google Scholar] [CrossRef]
  38. Eanes, E.D.; Reddi, A.H. The effect of fluoride on bone mineral apatite. Metab. Bone Dis. Relat. Res. 1979, 2, 3–10. [Google Scholar] [CrossRef]
  39. Moreno, E.C.; Kresak, M.; Zahradnik, R.T. Physicochemical aspects of fluoride-apatite systems relevant to the study of dental caries. Caries Res. 1977, 11, 142–171. [Google Scholar] [CrossRef]
  40. Bhawal, K.U.; Li, X.; Suzuki, M.; Taguchi, C.; Oka, S.; Arikawa, K.; Tewari, N.; Liu, Y. Treatment with low-level sodium fluoride on wound healing and the osteogenic differentiation of bone marrow mesenchymal stem cells. Dent. Traumatol. 2020, 36, 278–284. [Google Scholar] [CrossRef]
  41. Brown, J.H.; Pollock, S.H.; Taylor, J.L. Anti-inflammatory Activity of Sodium Fluoride. Arch. Int. Pharmacodyn. 1972, 195, 361–371. [Google Scholar]
  42. Lee, H.J.; Choi, C.H. Anti-inflammatory effects of bamboo salt and sodium fluoride in human gingival fibroblasts—An in vitro study. Kaohsiung J. Med. Sci. 2015, 31, 303–308. [Google Scholar] [CrossRef]
  43. Institute of Medicine (US) Standing Committee on the Scientific Evaluation of Dietary Reference Intakes. Dietary Reference Intakes for Calcium, Phosphorus, Magnesium, Vitamin D, and Fluoride; National Academies Press: Washington, DC, USA, 1997; pp. 288–313. [Google Scholar]
Figure 1. Coating thickness and structure.
Applsci 11 09451 g001
Figure 2. (a) Implant coated with fluorinated diamond-like carbon (F-DLC); (b) Control implant without F-DLC coating.
Applsci 11 09451 g002
Figure 3. (a) Collected femur; (b) Radiograph of femoral bone.
Applsci 11 09451 g003
Figure 4. Cross-section of polished non-demineralized femur specimen (whole specimen). Pathological examination and bone histomorphometric assessment were focused on in the green-boxed areas, where the cortical bone contacted the slit portion of the implant, because bone formation was expected to be more active in those areas.
Applsci 11 09451 g004
Figure 5. Microscopic images of inner surfaces of the slits under natural light. Yellow arrows indicate fibrous osteoids, blue arrows are fibrous bones, red arrows are fibroblasts, and greenish-yellow arrows indicate lamellar bones.
Applsci 11 09451 g005
Figure 6. Microscopic images of inner surfaces of slits under polarized light. Greenish-yellow arrows indicate lamellar bone, and pink arrows indicate osteons. Lamellar bone and osteons were visible in Group F at Week 8. At Week 12, Group F showed more lamellar bone and more osteons than Group C.
Applsci 11 09451 g006
Figure 7. Microscopic images of inner surfaces of slits under fluorescent light. Newly formed bone tissue is identified with calcein-green labeling. White arrows show regions of double labeling. At Week 12, more bone was formed in Group F than in Group C.
Applsci 11 09451 g007
Figure 8. Results of bone histomorphometry. (a) Bone volume/tissue volume (%). At Week 4 no significant differences were noted between groups. At Week 8 bone volume/tissue volume (%) was 35.37 ± 8.70 in Group C vs. 57.53 ± 12.4 in Group F (p < 0.05), and at Week 12 was 61.17 ± 2.12 in Group C vs. 75.77 ± 5.88 in Group F (p < 0.005), with a significantly greater increase in Group F. (b) Trabecular thickness (µm). At Week 4, no significant differences were noted between groups. At Week 8, trabecular thickness was 103.71 ± 8.8 µm in Group C vs. 120.87 ± 10.5 µm in Group F (p < 0.05), and at Week 12 was 121.19 ± 11.1 µm in Group C vs. 158.11 ± 24.2 µm in Group F (p < 0.05), with a significantly greater increase in Group F. (c) Number of osteoclasts/bone surface length (N/mm). At Week 4 and Week 8, no significant differences were noted between groups. The number of osteoclasts/bone surface length was 1.78 ± 0.35/mm in Group C vs. 1.28 ± 0.13 /mm in Group F (p < 0.05), with a significantly greater decrease in Group F. (d) Eroded surface/bone surface (%). At Week 4 and Week 8, no significant differences were noted between groups. At Week 12, eroded surface/bone surface (%) was 24.19 ± 3.03 in Group C vs. 18.94 ± 1.98 in Group F (p < 0.05), with a significantly greater decrease in Group F. (e) Number of osteoblasts/bone surface length (N/mm); (f) Osteoid surface/bone surface (%). (g) Mineral apposition rate (µm/day). (h) Bone formation rate/tissue volume (%/year). For (eg), no significant differences were found between Group C and Group F at any time point. For (h), the ratio of bone formation rate/tissue volume at 8 weeks was 220.1 ± 119.08 %/year in Group C vs. 405.47 ± 92.29 %/year in Group F (p < 0.05), with a significantly greater increase in Group F. * p < 0.05; ** p < 0.005 for (ad,h).
Applsci 11 09451 g008
Figure 9. Changes over time in the amount of fluorine elution per unit area. The concentration of F ions tended to increase over time.
Applsci 11 09451 g009
Table 1. Results of bone histomorphometry.
4 W (Groups
C vs. F)
8 W (Groups
C vs. F)
12 W (Groups
C vs. F)
a: Bone volume/Tissue volume (%)19.89 ± 4.51 vs. 21.51 ± 14.135.37 ± 8.70 vs.
57.53 ± 12.4 *
61.17 ± 2.12 vs. 75.77 ± 5.88 **
b: Trabecular thickness (μm)60.71 ± 9.10 vs. 68.92 ± 18.8103.71 ± 8.8 vs. 120.87 ± 10.5 * 121.19 ± 11.1
158.11 ± 24.2 *
c: No. osteoclasts/Bone surface (N/mm)0.85 ± 0.30 vs. 0.65 ± 0.341.39 ± 0.48 vs.
0.98 ± 0.22
1.78 ± 0.35 vs. 1.28 ± 0.13 *
d: Eroded surface/Bone surface (%)9.47 ± 1.87 vs. 5.88 ± 4.8919.27 ± 3.23 vs. 16.08 ± 2.3624.19 ± 3.03 vs. 18.94 ± 1.98 *
e: No. osteoblasts/Bone surface (N/mm)43.10 ± 5.78 vs. 44.68 ± 11.1125.62 ± 8.51 vs. 34.15 ± 5.3424.66 ± 6.35 vs.
31.08 ± 4.90
f: Osteoid surface/bone surface (%)73.10 ± 3.40 vs. 76.00 ± 13.5047.60 ± 9.84 vs. 55.31 ± 7.1447.10 ± 9.90 vs. 56.17 ± 5.14
g: Mineral apposition rate (μm/day)4.87 ± 0.83 vs. 2.64 ± 1.252.69 ± 0.86 vs.
3.03 ± 0.21
2.41 ± 0.52 vs. 2.08 ± 0.69
h: Bone formation rate/bone volume (%/year)225.50 ± 145.50 vs. 261.67 ± 211.94220.91 ± 119.08 vs. 405.47 ± 92.29 *247.09 ± 73.64 vs. 254.80 ± 142.83
* p < 0.05; ** p < 0.005.
Publisher’s Note: MDPI stays neutral with regard to jurisdictional claims in published maps and institutional affiliations.

