Article

Optimization Design of Extrusion Roller of RP1814 Roller Press Based on ANSYS Workbench

1
College of Mechanical and Electronic Engineering, Nanjing Forestry University, Nanjing 210037, China
2
Jiangsu Hengyuan International Engineering Co., Ltd., Yangzhou 225266, China
*
Author to whom correspondence should be addressed.
Appl. Sci. 2021, 11(20), 9584; https://doi.org/10.3390/app11209584
Submission received: 14 September 2021 / Revised: 12 October 2021 / Accepted: 12 October 2021 / Published: 14 October 2021
(This article belongs to the Section Mechanical Engineering)

Abstract

:
Firstly, the force of an extrusion roller under actual working condition was analyzed while the contact stress between the roller shaft and the roller sleeve and the extrusion force between the roller sleeve and the material were calculated. Secondly, static analysis of the extrusion roller was carried out using ANSYS software, and conclusively, the stress concentration appears at the roller sleeve’s inner ring step. Furthermore, an optimization scheme of the setting transition arc at the step of the contact surface between roller shaft and roller sleeve was proposed, and a simulation test was carried out., Finally, the maximum equivalent stress of the extrusion roller was set at the minimum value of the objective function; the extrusion roller was further optimized by using the direct optimization module in ANSYS Workbench. The results from optimization show that the maximum equivalent stress is reduced by 29% and the maximum deformation is decreased by 28%. It can be seen that the optimization scheme meets the strength and deformation requirements of the extrusion roller design. The optimization scheme can effectively improve the bearing capacity of the extrusion roller and reduce its production cost. This can provide a reference for the design of the roller press.

1. Introduction

As a high-efficiency and energy-saving grinding piece of equipment, a roller press is commonly used in the cement production industry because of its high output, low energy consumption, and stable production [1]. An extrusion roller is a key component in the working process of a roller press, including a fixed roller and a floating roller, mainly composed of the roller shaft and the roller sleeve. Due to the complex working conditions of the roller press, the extrusion roller often bears a large impact load. The bearing capacity of extrusion roller components are easily weakened, resulting in excessive wear and cracking of the extrusion roller sleeve and fracture of the roller shaft. Ensuring the expected production efficiency and service life becomes difficult. It is therefore necessary to analyze and optimize the extrusion roller to ensure the service life of the roller press and the grinding quality of materials are maintained.
Zhang et al. [2], combining the working conditions with the structural characteristics and load distribution of the roller, analyzed the causes of roller fracture failure by using the finite element method, and they concluded that the main cause of failure was the stress concentration caused by unreasonable structural design. This research mainly involves the analysis of the roller shaft and lacks a comprehensive study on the overall structure of the extrusion roller. Chang et al. [3] found a relationship between particle breakage and energy absorption by the BS extrusion crushing model, namely the smaller the size of the same power, the lower the breakage; the breakage diminishes with a decrease in the particle size ratio, and it tends to a small constant with smaller particle size ratios. Xi et al. [4] designed bionic pit structures with different depths, diameters, and axial spacings on the surface of the grinding roller, and they used the finite element method to locate the best wear resistance and fragmentation of the grinding roller. Most of the existing studies use direct finite element analysis after simplifying the structure. There is a lack of comparative research on various schemes for unreasonable structures, and a lack of verification and in-depth exploration of the rationality of the optimized structure. Zhang et al. [5] combined the selective assembly method and interference design method based on finite element analysis to provide an effective approach to achieve more reliable interference-fitted connection and more precise assembly with lower manufacturing cost. Muliadi et al. [6] studied and compared the relevant parameters of the two-dimensional finite element method and the one-dimensional Johanson model. The two approaches agree better when the material is more compressible, has a lower effective internal friction angle, and a larger roller-powder friction angle, and when the streamwise inlet normal stress decreases. In addition, the extrusion roller bears a large force, and the model is complexed. In order to speed up the efficiency of software solutions, the existing research simplifies the model too much, which is not in line with the actual production situation. Bao et al. [7] simulated the hot assembly process of the roller sleeve of a HFCG160 roller press by using the finite element software ANSYS and studied the variation laws of the temperature field. By comparing the simulated temperature with the test temperature, the results demonstrate that the simulated temperature is basically consistent with the test temperature. However, there is a slight deviation of individual temperature measurement points within a certain time. In the optimization and improvement of the extrusion roller, few articles involve optimization methods based on ANSYS software. However, the goal driven optimization module of finite element analysis software can quickly find the optimal solution by setting design variables, constraints, and objective functions so as to achieve the preset goal and to save time. Therefore, this article integrated the previous experience, and the model of the extrusion roller of the RP1814 roller press was reasonably simplified. The boundary conditions were set according to the actual working conditions, and the static analysis was carried out using ANSYS software. Based on the results of static analysis, the optimization scheme of setting the transition arc at the step where the extrusion roller shaft contacts the roller sleeve was adopted. Then, based on the initial optimization, the extrusion roller was further optimized by using the direct optimization module in ANSYS Workbench, and the optimal solution of the optimization scheme was achieved. The optimization scheme is expected to improve the bearing capacity and reduce the manufacturing cost of the extrusion roller. It also can provide an important reference for the production design of the roller press and other engineering equipment. The model description of the RP1814 roller press is shown in Figure 1. RP is the abbreviation of roller press; 1400 mm is the width of the extrusion roller, represented by B; and 1800 mm is the diameter of extrusion roller, represented by D.

2. Force Analysis of Extrusion Roller of RP1814 Roller Press

The extrusion roller of the RP1814 roller press adopts a split hot installed cylindrical structure, which can reduce the complexity of assembly and disassembly of the roller shaft and the roller sleeve [8]. Torque and axial force are transmitted between the roller shaft and the roller sleeve of each roller through interference fit. During operation, the position of the central axis of the fixed roller remains unchanged. The floating roller controls the roll gap through the pressure of the hydraulic press. The two rollers are driven by the motor to keep the same speed v and rotate in the opposite direction. After the material enters the roller press from the feeding bucket above the roller press, it accumulates above the working area where the two rollers rotate relative to each other to form a material column. The material column is compressed into the compression zone through the acceleration zone. As the roll gap becomes smaller, the forming pressure becomes larger, and the material begins to be broken by the extrusion roller. After the compressed material enters the rebound zone through the compression zone, the forming pressure decreases, and the material begins to rebound. The material no longer expands and rebounds when it drops a certain distance. Its working principle is shown in Figure 2.
According to the structural characteristics and working principle of the extrusion roller, the extrusion roller is mainly affected by two kinds of forces. One is the internal force in the form of contact stress during the interference connection, and the other is the extrusion force provided by the hydraulic cylinder when the material is crushed.

2.1. Interference Connection of Extrusion Roller

The 42CrMo and 34CrNiMoA materials were selected for the roller shaft and roller sleeve of the extrusion roller, respectively. They have the characteristics of high strength, high toughness, high hardenability, and small deformation during quenching. The material properties are shown in Table 1 [9].
When considering the contact pressure p of the roller shaft and roller sleeve during interference connection, the pressure p should not be too small to affect the torque power transmission, nor should the pressure p be too large to cause fatigue failure and cracking of the roller sleeve [10]. The minimum contact pressure pmin required for load transfer between the roller shaft and the roller sleeve is as follows [11]:
p min = 2 T π f B d 2
where B is the width of the extrusion roller; d is the inner diameter of the roller sleeve; f is the coefficient of friction; T is the torque transmitted by the extrusion roller, which is composed of the inertia moment EK of the roller shaft, the motor torque T1, and the inertia moment Tf generated by the material.
After calculation, T = 866598 N·m. At this time, f is taken as 0.1, B = 1400 mm, and d = 1200 mm. Therefore, the required minimum contact pressure pmin = 2.74 MPa.
The maximum contact pressure pmax that the extrusion roller can bear without plastic deformation is as follows [11]:
p max = 1 ( d D ) 2 / 3 + ( d D ) 4 σ s 2
where σs2 is the yield strength of the roller sleeve, σs2 = 835 MPa, D is the outer diameter of the roller sleeve, and D = 1800 mm; pmax = 259.42 MPa was obtained.
The relationship between the interference and the contact pressure between the roller shaft and the roller sleeve is as follows [11]:
δ = p d ( C 1 E 1 + C 2 E 2 )
where C 1 = [ d 2 + d 1 2 ] / [ d 2 d 1 2 ] μ 1 , C 2 = [ D 2 + d 2 ] / [ D 2 d 2 ] + μ 2 , and where δ is the interference, p is the contact pressure between the roller shaft and the roller sleeve, C1 is the rigidity coefficient of the roller shaft, C2 is the rigidity coefficient of the roller sleeve, E1 is the elastic modulus of the roller shaft, E2 is the elastic modulus of the roller sleeve, μ1 is the Poisson’s ratio of the roller shaft, μ2 is the Poisson’s ratio of the roller sleeve, and d1 is the inner diameter of the roller shaft; thus d1 = 200 mm.
The relationship between the maximum stress of the roller shaft σ1max, the maximum stress of the roller sleeve σ2max, and the contact pressure pf is as follows [8]:
σ 1 max = p f a
σ 2 max = p f c
where a and c are the roller shaft and roller sleeve coefficients, respectively. a = [ 1 ( d 1 d ) 2 ] / 2 = 0.49 , c = [ 1 ( d D ) 2 ] / 2 = 0.28 .
The interference between the roller shaft and the roller sleeve δ = 1.45 mm, obtain the corresponding contact pressure pf = 69.05 MPa, pminpfpmax, which meets the requirements of contact pressure. The maximum stress of the roller shaft σ1max = 140.92 MPa ≤ σs1 = 930 MPa, and the maximum stress of the roller sleeve σ2max = 246.61 MPa ≤ σs2 = 835 MPa. It can be seen that the interference δ = 1.45 mm meets the strength requirement.

2.2. Extrusion Force of Extrusion Roller

The extrusion force on the extrusion roller should be considered based on the law of material compression and rebound characteristics. After entering the compression zone, the material is extruded by the extrusion roller, and the extrusion force increases with the decrease of the pressure angle in a certain range. When the pressure angle is zero, the extrusion force reaches the maximum value. After the material enters the rebound zone at a certain angle, the extrusion force gradually decreases to zero. The horizontal stress equation at any point on the surface of the extrusion roller is as follows [8]:
p ( α , λ ) = p c ln 1 δ 0 1 δ α 1 n 1 2 λ m 0 α α 0 p c ln 1 δ 0 1 δ α 1 n ( δ α - δ γ δ s δ γ ) k 1 2 λ m γ α 0
where p(α,λ) is the horizontal stress at any point of the extrusion roller in MPa (α is the pressure angle, λ = Z/B, Z is the distance from a point on the roller surface to the vertical surface in the extrusion roller), α0 is the angle at the beginning of compression zone, D is the extrusion roller diameter in mm, pc is the specific pressure of material in MPa, δγ is the relative density at the end of the rebound zone, γ is the angle at the end of the rebound zone, δs is the relative density at the end of compression zone, and δ0 is the initial relative density. The calculation formula is δ0 = ρ0/ρ, where ρ0 is the initial density, ρ is compaction density of material in kg/m3, δα is the pressure angle α relative density of the corresponding material layer, n is the compression curve factor, and m is the axial distribution coefficient of pressure, where m ≥ 1.
The material used was silica sand in this article. The material parameters are as follows [12]: pc = 133.44 MPa, n = 0.53, δ0 = 0.5, m = 1.35. p(α,λ) can be divided into normal stress pγ(α,λ) and tangential stress p𝜏(α,λ). In the solution results, when α = 0° and λ = 0, the maximum normal stress pγ(α,λ) = 102.05 MPa. When α = 2° and λ = 0, the maximum tangential stress p(α,λ) = 2.31 MPa. The normal stress is larger than the tangential stress, so the stress of the normal stress on the extrusion roller is mainly analyzed in the finite element strength analysis.

3. Finite Element Analysis of Extrusion Roller

3.1. Establishment of Finite Element Model

In order to decrease the analysis workload, the model is reasonably simplified [13,14,15]. In this paper, features on the extrusion roller that had little impact on the analysis results, such as threaded holes, chamfers, and keyways, were appropriately removed. The simplified model is shown in Figure 3.
The extrusion roller model simplified by SolidWorks was imported into ANSYS. According to the actual assembly form and stress of the extrusion roller shaft and roller sleeve, the surface constraint is imposed on the bearing action area of the extrusion roller model. Full constraint at one end limits the degrees of freedom in X, Y, and Z directions. The other end limits the degrees of freedom in the Y and Z directions, and the X direction is set to free. Symmetrical constraints are implemented in two symmetrical planes in which the roller sleeve is set as the target surface, and the roller shaft is set as the contact surface. There is friction between the roller shaft and the contact surface of the roller sleeve, and the friction coefficient is taken as 0.1. The interference offset value is set at 1.45 mm. According to the compression rebound characteristics, the surface of the extrusion roller is only subjected to force in the compression zone and rebound zone. Thus, the extrusion force is mainly loaded into the arc area with a pressure angle of −2°–6° [8]. The whole roller shaft and roller sleeve are automatically meshed, and the mesh on the contact surface is refined. In order to ensure that the simulation results are not affected by the mesh size, we selected 604,190, 841,427, 986,356, 1,392,606, 1,633,032, and 2,017,119 meshes, respectively, to verify the mesh convergence. The results are shown in Figure 4. It can be seen from the figure that after the number of meshes reached 1,392,606, the equivalent stress results were kept within a certain error range, and the change of equivalent stress was little affected by the mesh. At the same time, considering the influence of the number of meshes on the calculation cost, it was decided to divide the mesh according to the number of meshes. The meshing results are shown in Figure 5. At this time, the mesh size was 50 mm, and the mesh type adopted a second-order tetrahedron. There were 1,392,606 units in total, including 217,579 units for the roller shaft, and 1,175,027 units for the roller sleeve. Figure 6 is a cross-sectional view of the roller sleeve mesh, which can clearly express the mesh distribution of the inner ring of the roller sleeve. Figure 7 shows the quality of the mesh element of the extrusion roller. Most of the mesh quality was above 0.75, which is close to 0.88, indicating that the division effect was better, and higher simulation accuracy could be achieved.

3.2. Static Analysis of Extrusion Roller

According to the stress condition of the extrusion roller, the static analysis of the extrusion roller model was carried out using ANSYS software. The static analysis results are shown in Figure 8, Figure 9 and Figure 10. It can be observed in Figure 8a that the contact stress was mainly concentrated at the step where the roller sleeve contacted the roller shaft, and its value was 345.61 MPa. The average contact stress was 2.74 MPa greater than the minimum stress required to provide torque, which met the minimum stress requirements for torque transmission. As can be observed in Figure 8b, the contact sliding distance of the extrusion roller was 1.315 mm. The stress formed by the extrusion force is transmitted to the roller shaft through the roller sleeve. As showed in Figure 9a, the maximum equivalent stress was concentrated at the step of the inner ring of the roller sleeve, and the stress value was 651.03 MPa. The maximum stress of the roller sleeve was close to the yield limit of the material. The maximum deformation occurred at the non-stepped end of the inner ring of the roller sleeve. As showed in Figure 9b, the maximum deformation of the roller sleeve was 1.379 mm.
In the static analysis, the maximum stress concentration position could easily become the weak point of the structure. At this time, the maximum equivalent stress at the contact position of the roller sleeve was the main reason for the cracking of the extrusion roller. Therefore, it was necessary to optimize the design of the extrusion roller to obtain the extrusion roller structure with better performance.

4. Initial Optimization Design of Extrusion Roller

4.1. Initial Optimization Scheme

The optimal design has been widely used in all aspects of engineering design, such as size (thickness), shape, size of transition fillet, manufacturing cost, material characteristics, etc. The parameters of the structure which should be optimized in specific designs need to be considered in more detail [16,17].
The results from the static analysis shown in the previous pages reveal that the edge of the inner ring step of the squeeze roller is a dangerous position, which can easily crack the roller sleeve and cause the eventual scrapping of the roller sleeve. This paper adopted the method of size optimization in order to reduce the stress concentration of the roller sleeve and reduce the cracking of the extrusion roller. An optimization scheme of setting the transition arc at the contact position between the convex step of the outer ring of the roller shaft and the concave step of the inner ring of the roller sleeve was proposed. The transition arc size of the roller shaft and the transition arc size of the roller sleeve were consistent at this time. The sections of the optimization model are shown in Figure 11 and Figure 12, respectively. Because the length and radius of the transition arc needed to obtain the preliminary parameter values through experimental simulation within a certain range, 7 groups of data were set for finite element simulation testing to observe the variation range of the maximum equivalent stress and deformation. In the 7 groups of finite element simulation test data, the transition arc lengths L were 25 mm, 35 mm, 45 mm, 55 mm, 65 mm, 75 mm, and 85 mm; and the corresponding transition arc radii R were 25 mm, 37 mm, 53 mm, 73 mm, 97 mm, 125 mm, and 157 mm. The parameter settings are shown in Figure 13; 25 mm was the height of the original step.

4.2. Analysis of Results of Initial Optimization

The results of the seven groups of simulation tests are presented in Table 2. R increased with the increase of L, and the maximum stress value now decreased with the increase of L. With L increasing from 25 mm to 85 mm and R increasing from 25 mm to 157 mm, the maximum equivalent stress decreased from 579.87 MPa to 477.12 MPa, which is a decrease of 112.75 MPa. The simulation results where L = 85 mm and R = 157 mm are shown in Figure 14. The optimization results were as follows: The contact stress value after optimization was reduced from 345.61 MPa to 289.52 MPa, which is a reduction of 16%. The contact sliding distance decreased from 1.315 mm to 0.256 mm, which is a decrease of 81%. The maximum equivalent stress decreased from 651.03 MPa to 477.12 MPa, a decrease of 26%. The maximum deformation was reduced from 1.379 mm to 1.102 mm, which is a reduction of 20%. The yield limit of the roller sleeve material was 835 MPa, and the optimized stress met the strength requirements of the extrusion roller. The optimized contact stress and maximum equivalent stress became smaller, and the stress concentration still occurred in the transition arc area. However, with the increase of the area of stress concentration area, the arc transition was smoother, which made the roller sleeve less prone to cracking. It can be seen that the predetermined optimization scheme was effective.
The optimization scheme increased the contact area between the roller shaft and the roller sleeve by setting the transition arc so as to increase the strength of the extrusion roller and reduce the deformation. With the increase of the transition arc, the change in the trend of the contact surface between the roller shaft and the roller sleeve in the width direction of the extrusion roller decreased slowly. The stress reduction trend was also slower. The simulation test results showed that the optimization scheme was feasible. However, due to the large interval between the length and radius of the transition arc, the maximum stress was in a continual downward trend. It was therefore necessary to further refine the optimization scheme of the extrusion roller to find the optimal structural parameter values.

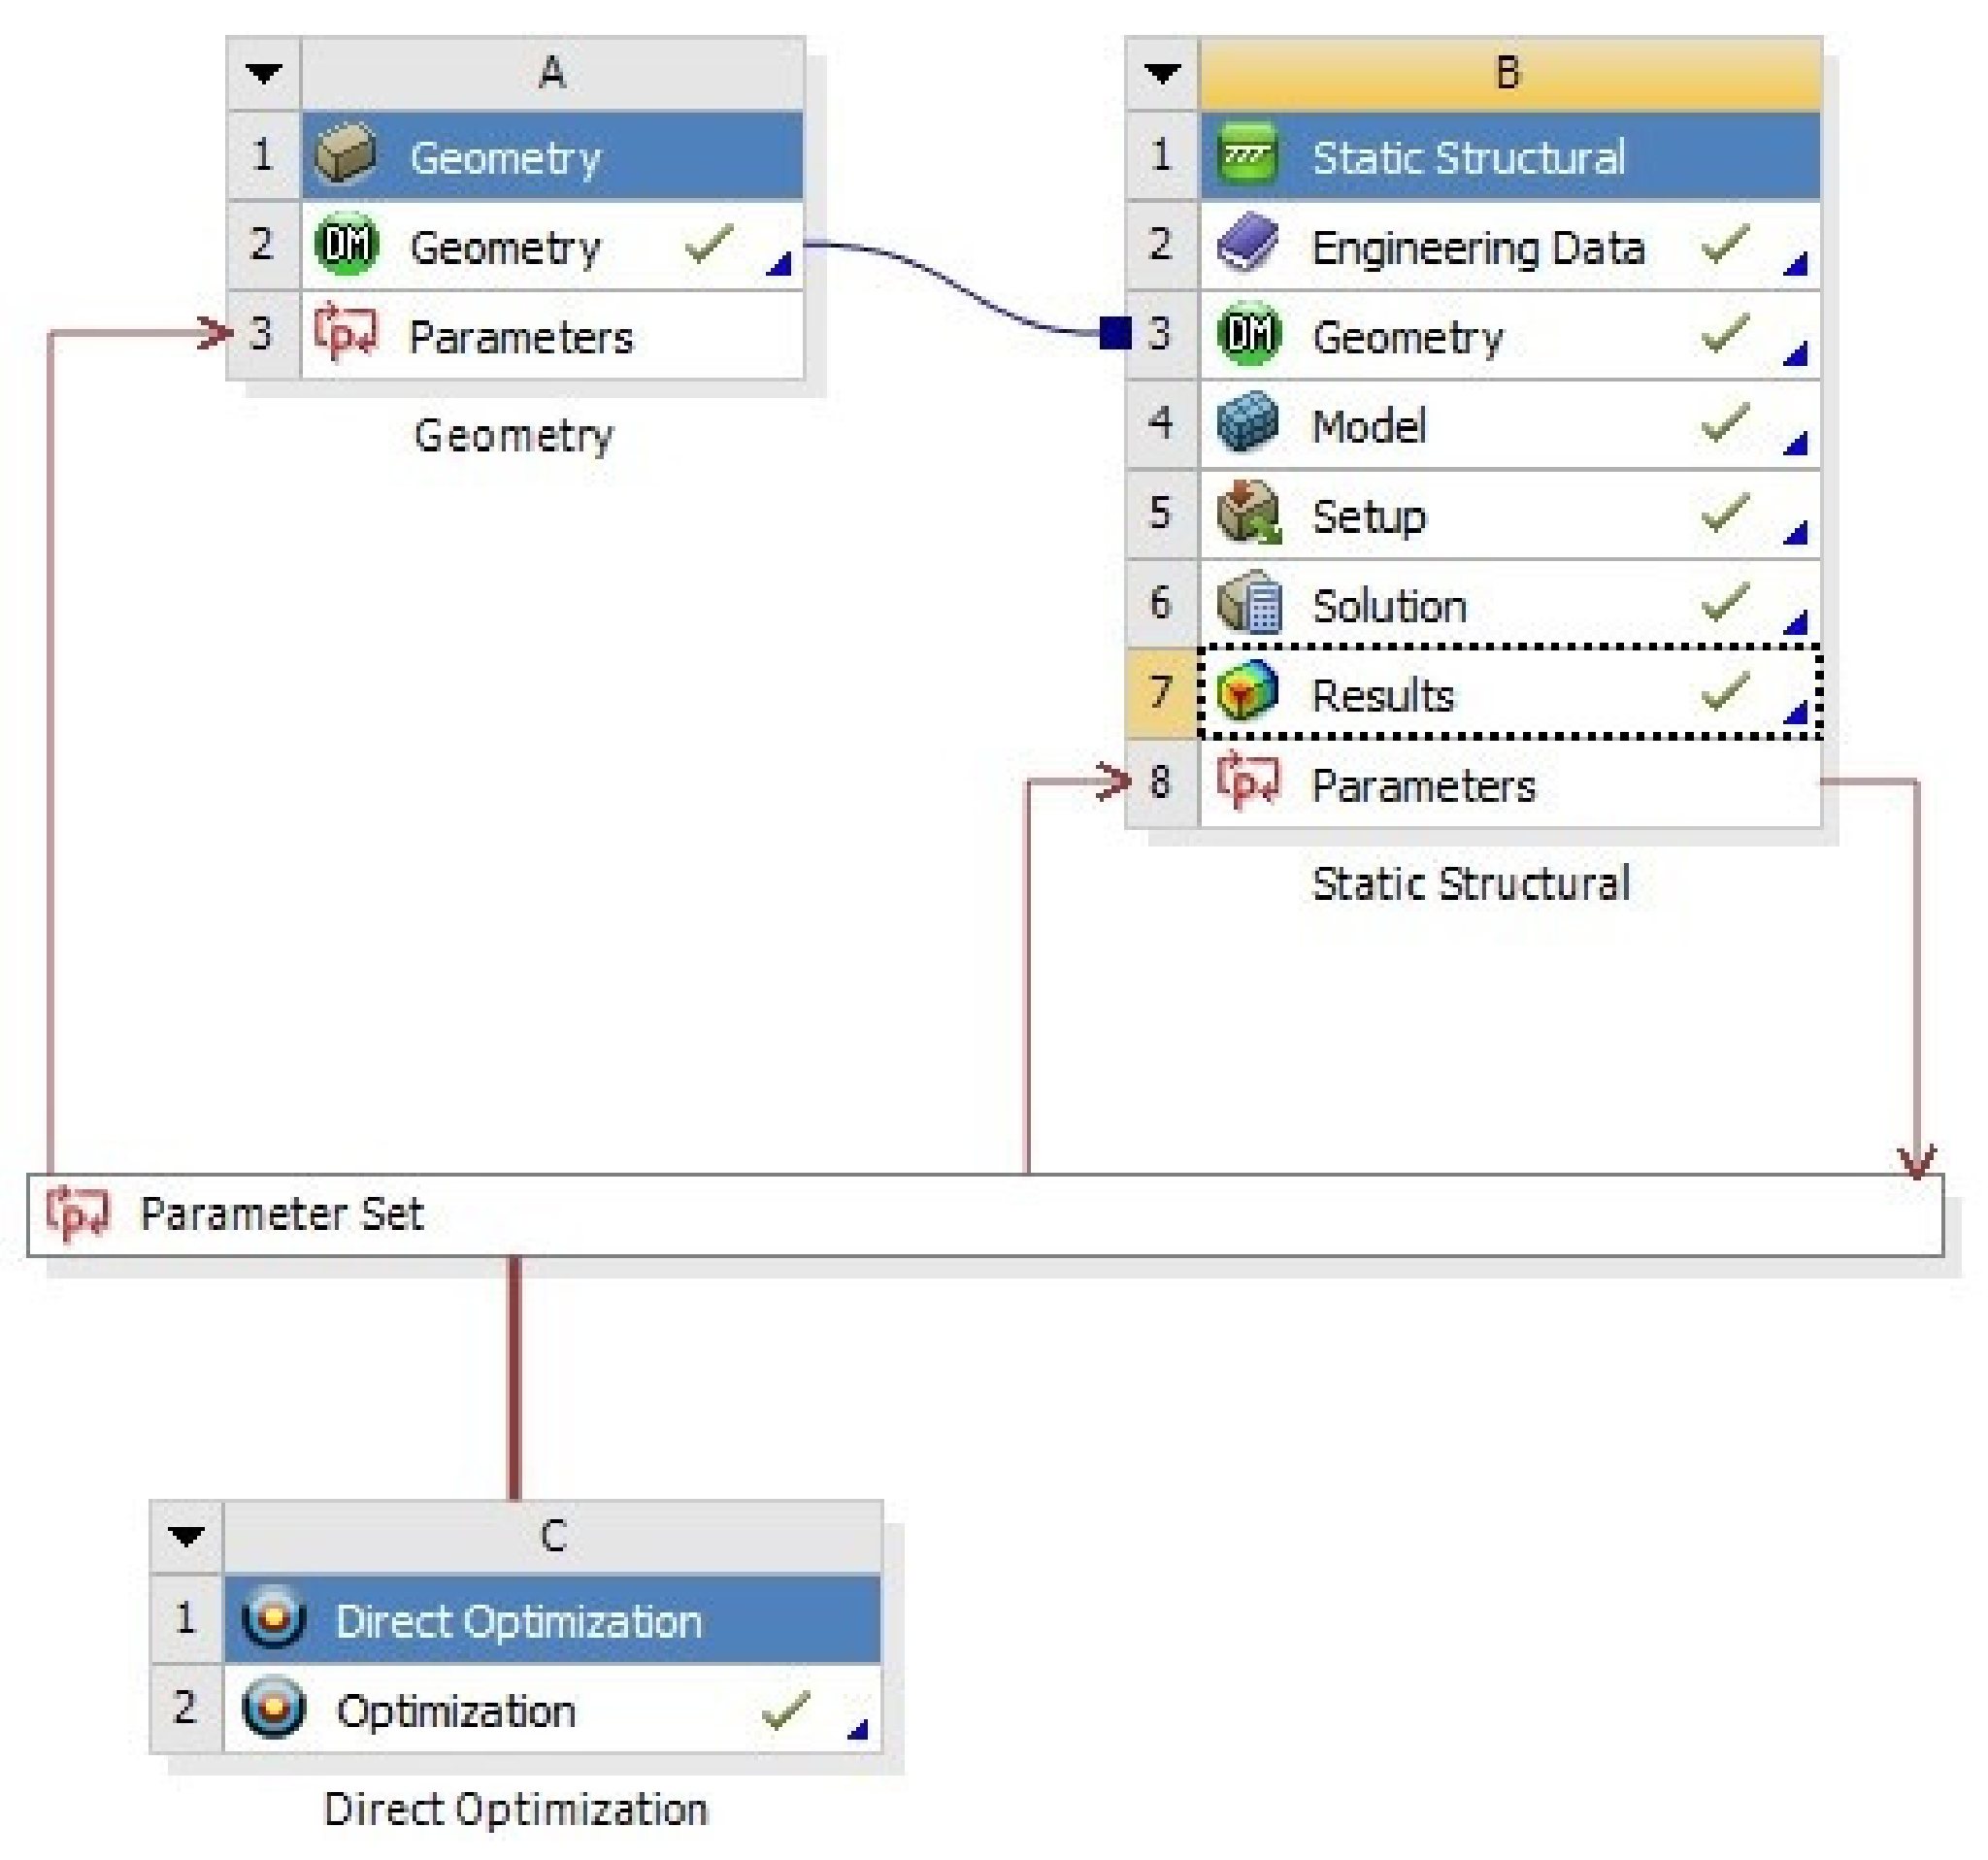
5. Further Optimization Based on Direct Optimization Module

5.1. Design Parameters of Extrusion Roller

Direct optimization is a goal driven optimization method in ANSYS Workbench. It is analyzed with the multi-objective genetic algorithm (MOGA) so as to obtain the specific parameters of the optimization goal and obtain the optimal solution [18]. When using the direct optimization module to optimize the extrusion roller, the design parameters mainly include the following parts:
(1)
Design variable: The design variables of extrusion roller optimization design are x1 and x2.
x1: Length of transition arc at contact step between roller shaft and roller sleeve; the initial value is 85 mm.
x2: Transition arc radius at the contact step between roller shaft and roller sleeve; the initial value is 157 mm.
Constrain the size range of each design variable: 85 mm ≤ x1 ≤ 95 mm, 157 mm ≤ x2 ≤ 193 mm.
After selecting the design variables of direct optimization design of extrusion roller and constraining each design variable, the design variables can be expressed as vectors:
x = ( x 1 , x 2 ) T
(2)
Optimization objectives: Under the premise of meeting the structural strength, the maximum equivalent stress of the roller sleeve is set at the minimum value of the objective function. Therefore, when optimizing the length and radius of the transition arc, the maximum equivalent stress is taken as the objective function of the direct optimization design of the extrusion roller. The objective function is expressed by the size parameters as follows:
f ( x ) = f ( x 1 )
(3)
Constraint conditions: When setting the optimal design constraint conditions, the strength of the extrusion roller must meet the stress constraint conditions. The maximum equivalent stress of the optimized extrusion roller must not exceed the allowable stress of the material. Therefore, the strength constraints to be met are as follows:
g 1 ( X ) = σ max [ σ ] 0
(4)
Set candidate points: Select the best result of candidate points as the current point and substitute it into the model for calculation. Finally, the feasibility of the model is confirmed.
The analysis interface of the extrusion roller in this paper is shown in Figure 15.

5.2. Analysis of the Further Optimization Results

Through the analysis results of the Direct Optimization module in Workbench, the optimization objectives corresponding to 30 groups of different design variables were obtained [19]. Thirty groups of test points and the corresponding maximum stress results were drawn into a line chart of maximum stress change, as shown in Figure 16.
According to the set optimization objectives and candidate points, the candidate point of “minimum” maximum equivalent stress was selected as the design point from 30 groups of test data. The results are shown in Figure 17. When the transition arc length L was 92.83 mm and the transition arc radius R was 187.76 mm, the maximum equivalent stress was the smallest, and its value was 465.69 MPa.
Rounding the data in Figure 17, L was 93 mm and R was 188 mm. Taking this result as the current point of the ANSYS simulation verification program, the results are shown in Figure 18, Figure 19 and Figure 20. The optimization results are as follows: The contact stress was reduced from 345.61 MPa to 288.3 MPa, which is a reduction of 17%. The contact sliding distance decreased from 1.315 mm to 0.23 mm, which is a decrease of 83%. The maximum equivalent stress still occurred in the transition arc area of the inner ring of the roller sleeve, and the stress value decreased from 651.03 MPa to 464.49 MPa, a decrease of 29%, meeting the strength requirements of the extrusion roller. The maximum deformation occurred at the end of the inner ring of the roller sleeve without the transition arc. The deformation was 0.997 mm, which is 0.382 mm lower than that without optimization, with a decrease of 28%, meeting the deformation requirements of the extrusion roller. The maximum equivalent stress decreased with the increase of the area of the stress concentration area, and the stress distribution on the roller surface was more uniform. It can be seen that this scheme is expected to prevent the cracking of the extrusion roller and improve the service life of the extrusion roller.

6. Conclusions

(1)
Under actual working conditions, the extrusion roller is mainly affected by the contact stress between the roller shaft and the roller sleeve, and the extrusion force between the roller sleeve and the material. Based on the compression and rebound characteristics of the material, the extrusion pressure on the surface of the extrusion roller is calculated, and the normal direction stress pγ(α,λ) = 102.05 MPa and the tangential stress p𝜏(α,λ) = 2.31 MPa.
(2)
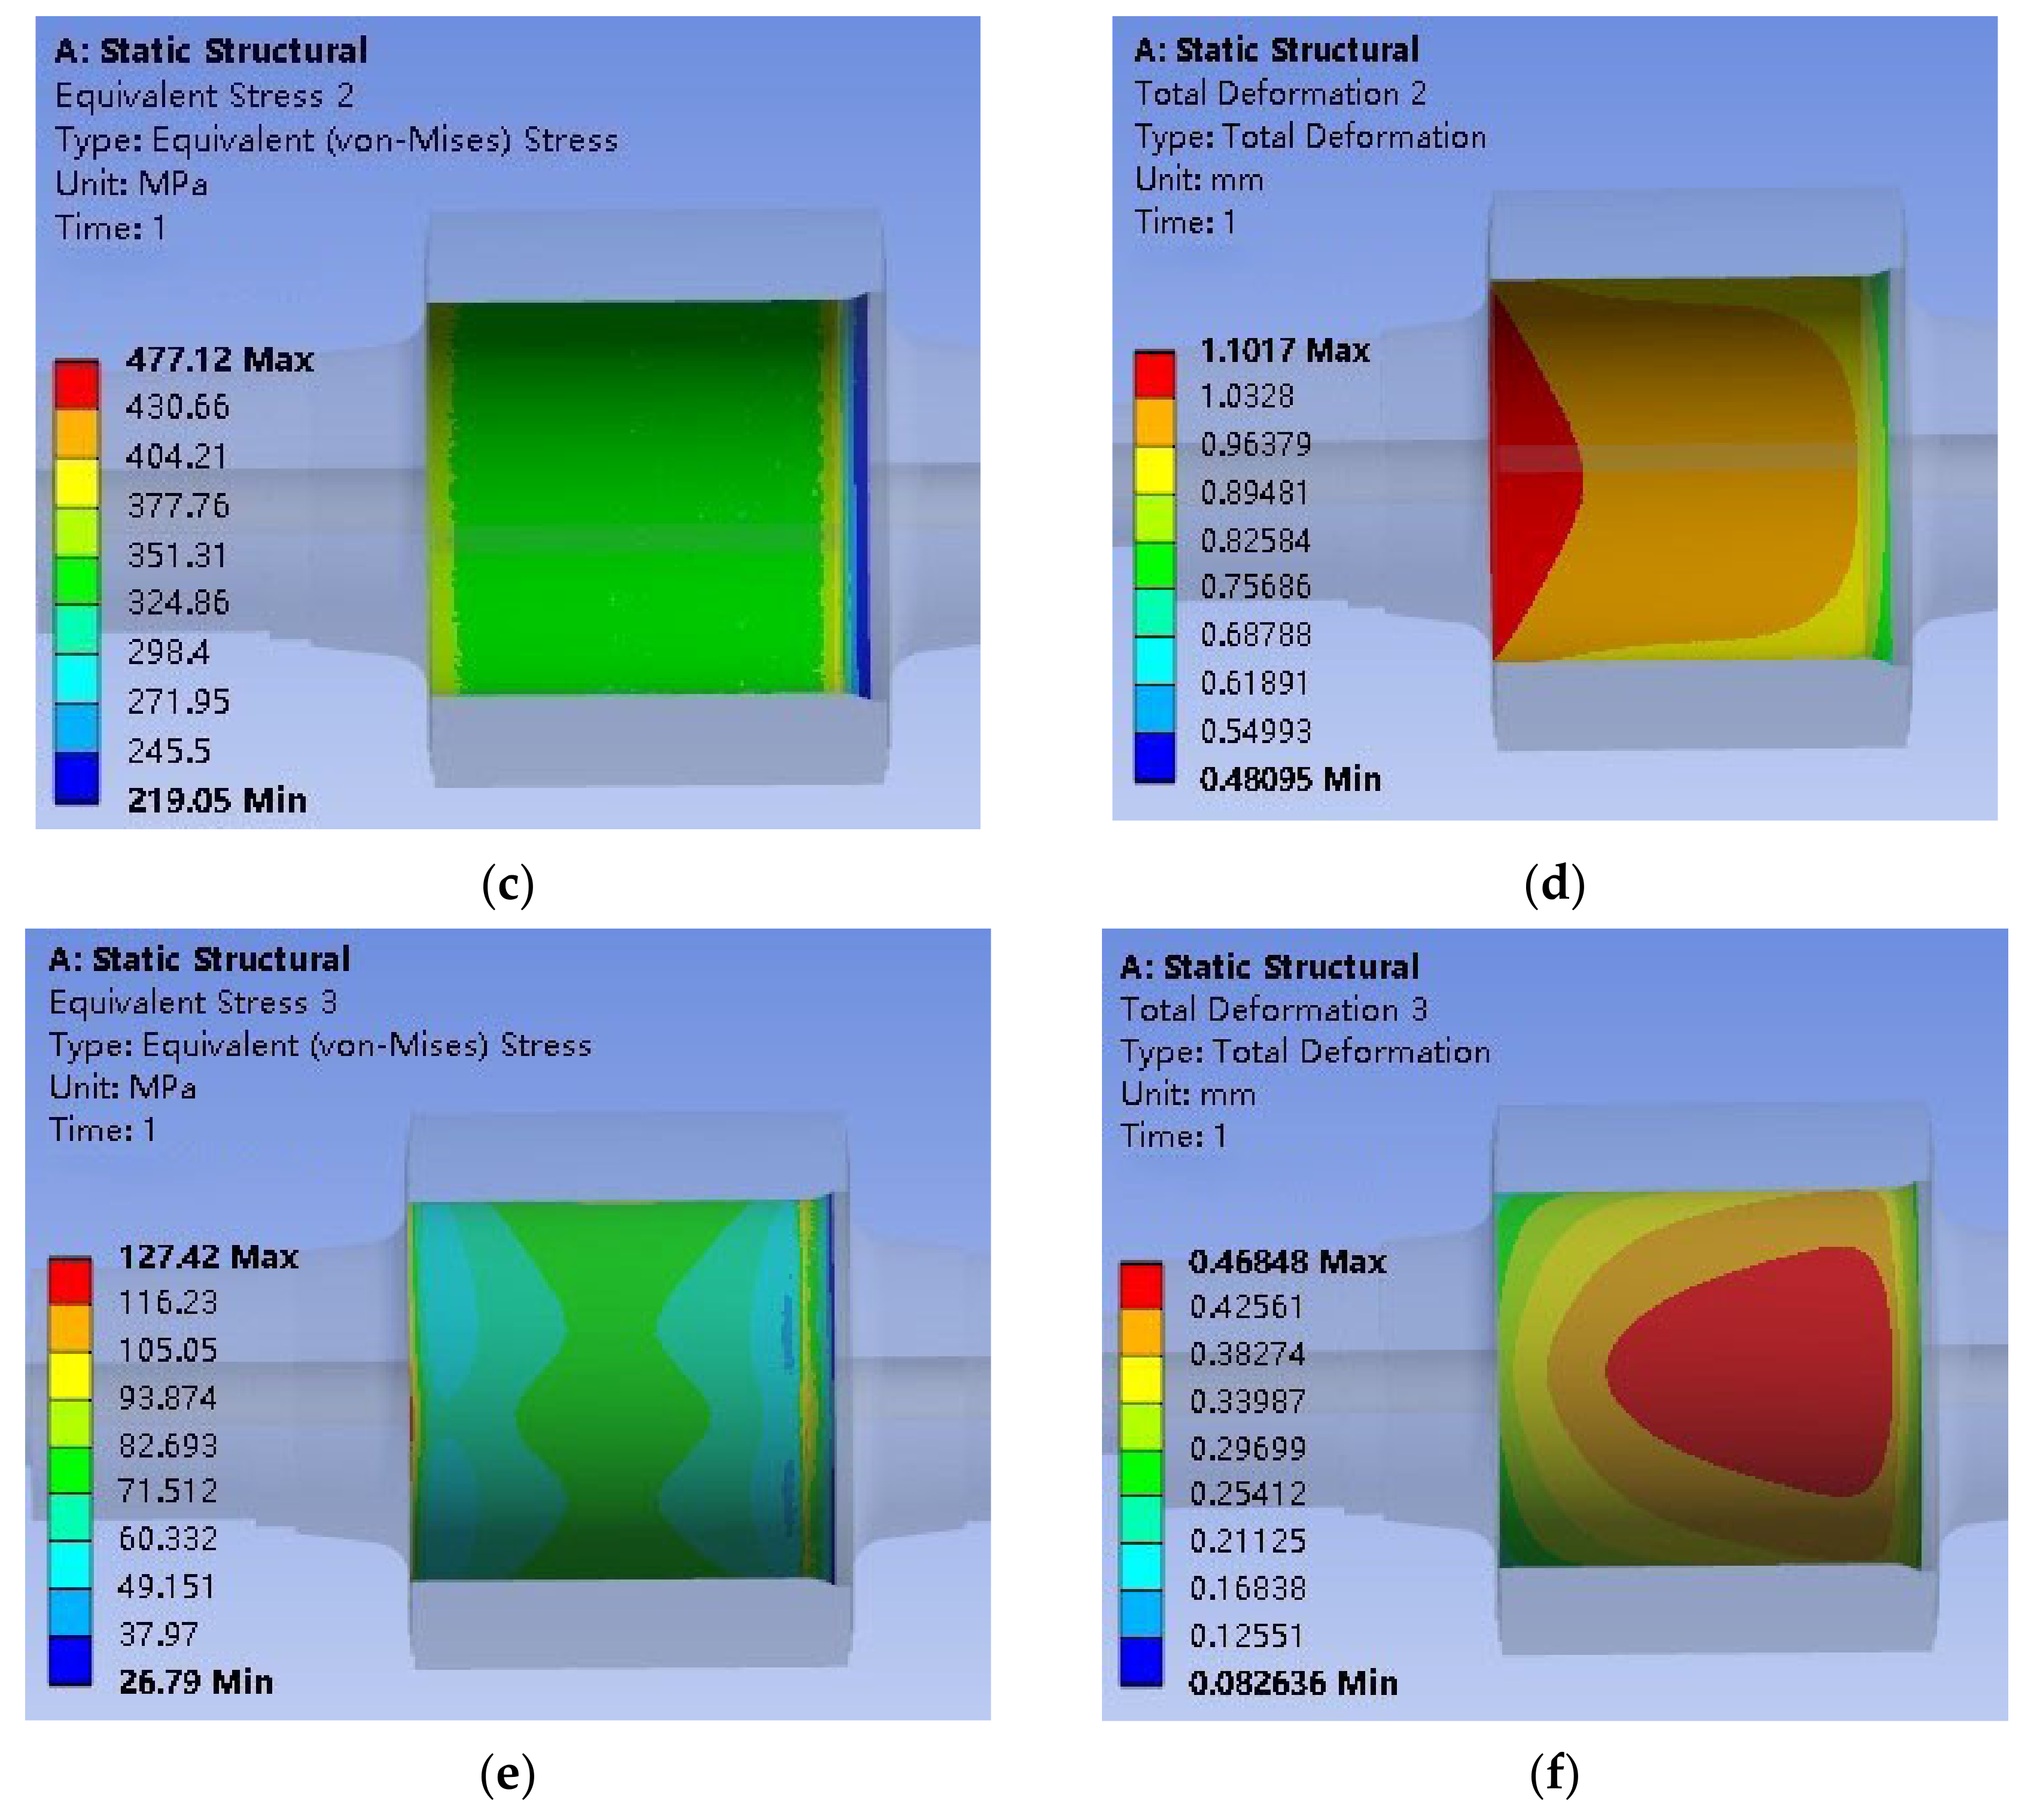
According to the finite element analysis results of the extrusion roller, the maximum deformation of the extrusion roller occurs at the non-stepped end of the inner ring of the roller sleeve, and the value is 1.379 mm. The maximum equivalent stress of the extrusion roller is located at the step of the contact surface between the roller sleeve and the roller shaft, and the value is 651.03 MPa. The maximum stress is on the brink of the allowable yield strength of the roller sleeve, so it is necessary to optimize the design.
(3)
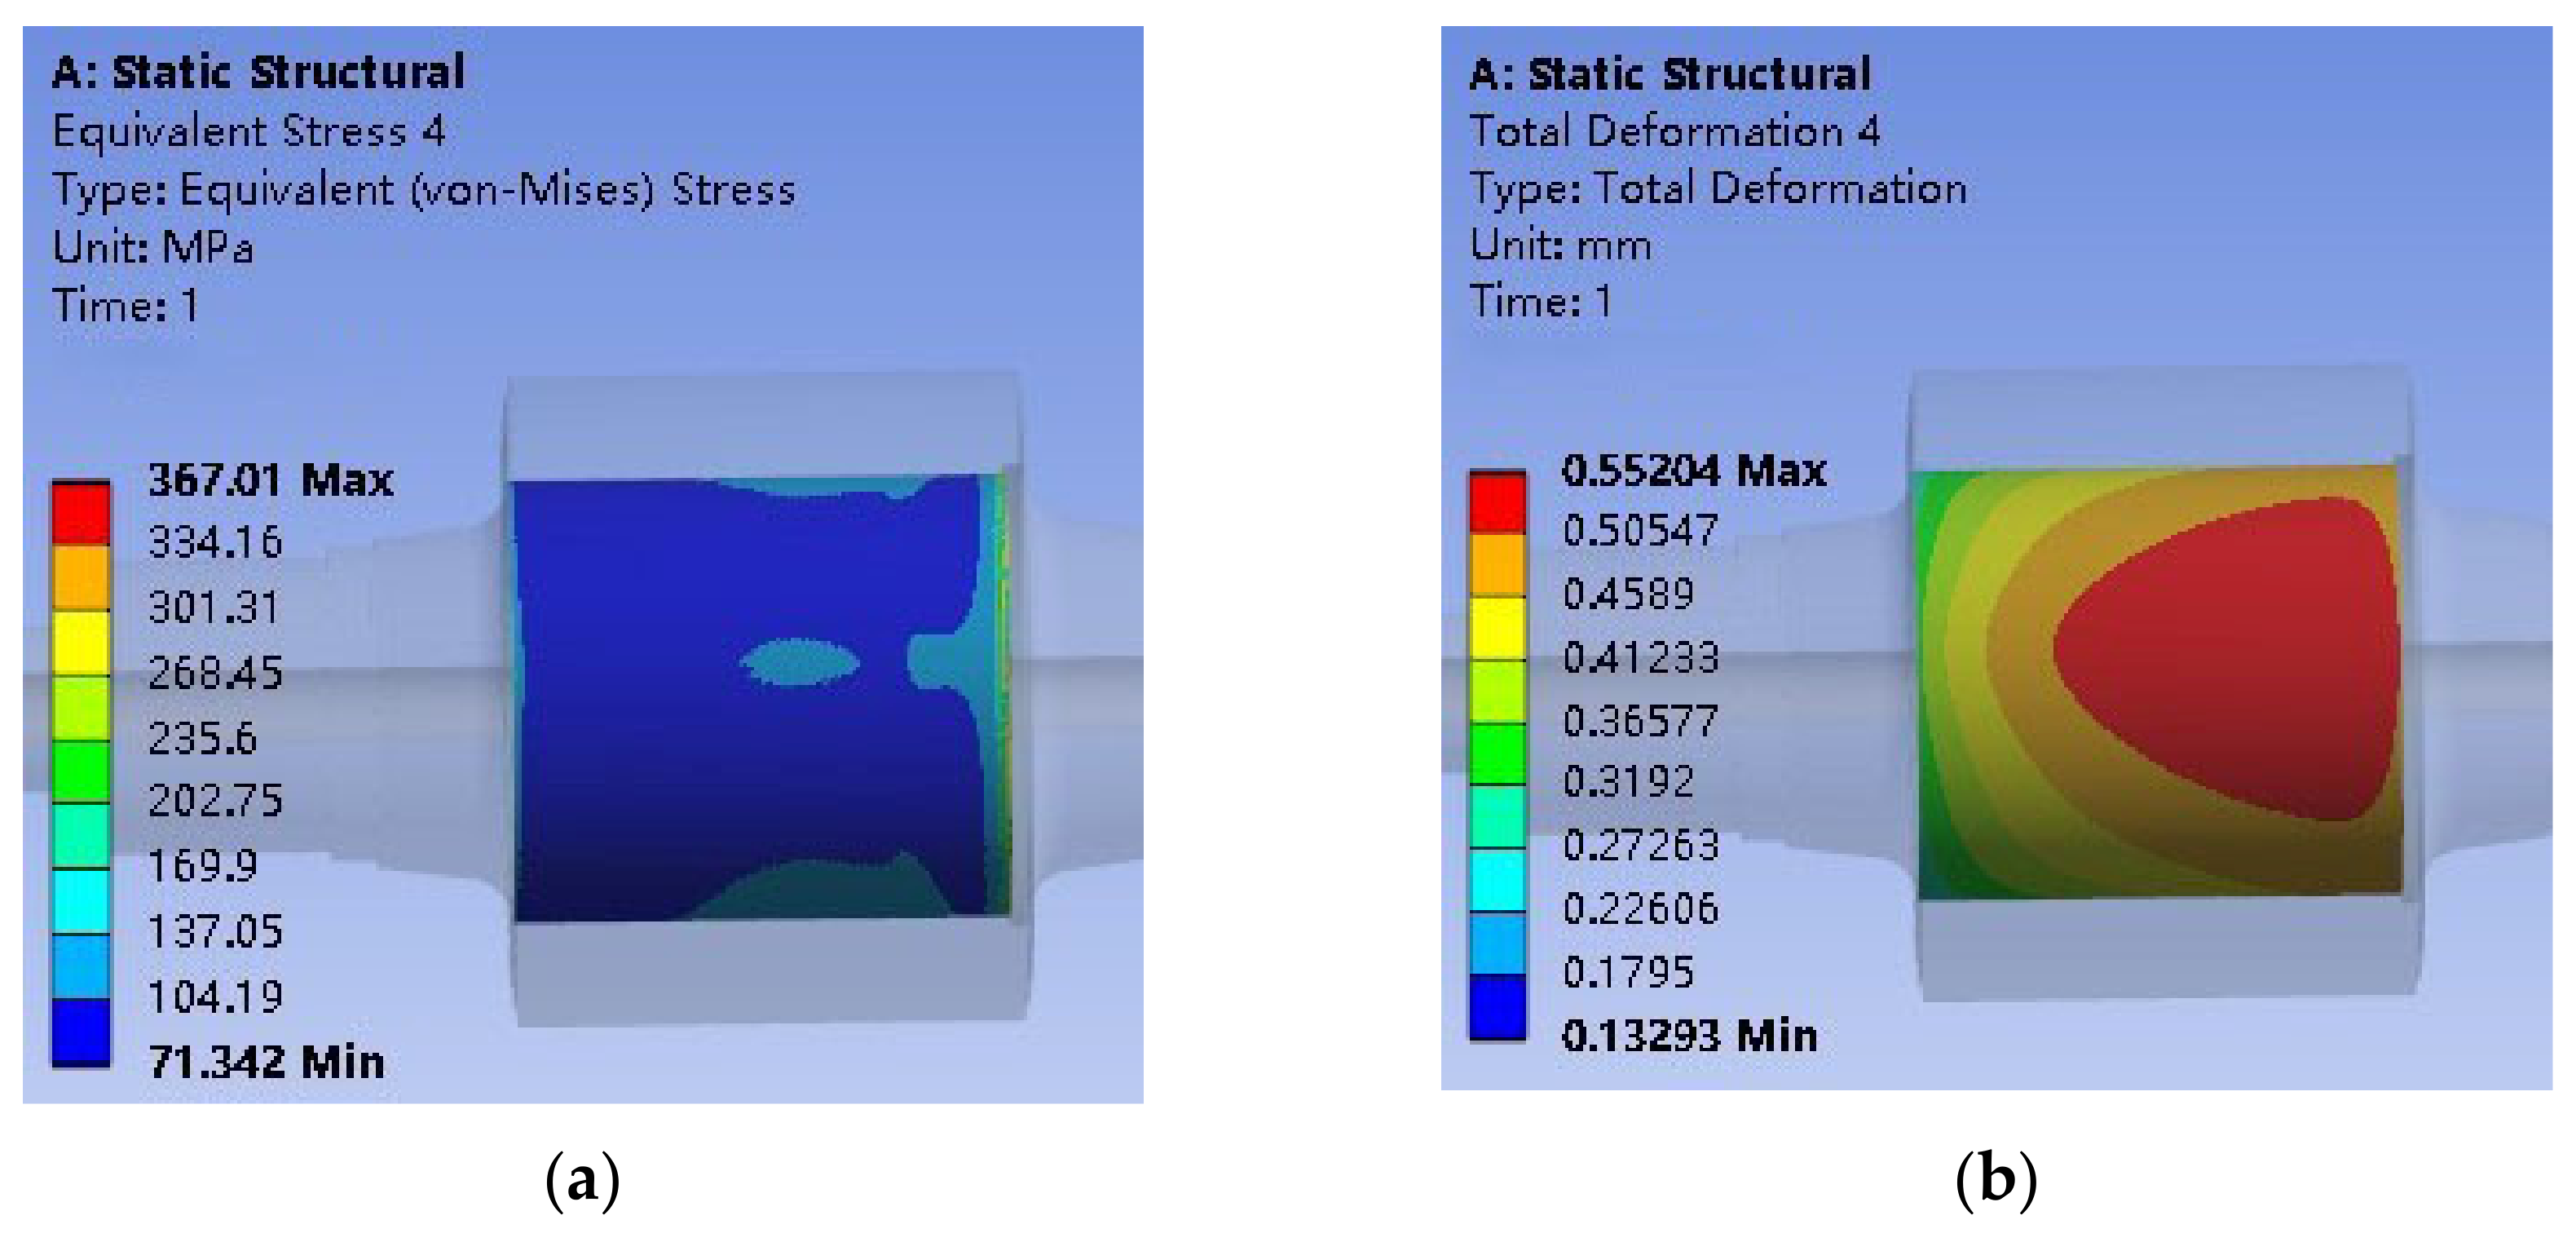
The initial optimization of the extrusion roller structure is carried out by the method of size optimization, and the scheme of setting the transition arc at the step of the contact surface between the roller shaft and the roller sleeve is proposed. The simulation results show that the maximum equivalent stress is reduced by 26%, and the maximum deformation is decreased by 20%, which initially achieves the purpose of improving the structural strength and reducing the deformation. However, the decreasing trend of the maximum equivalent stress in the optimization scheme did not stop, and the transition arc parameters can still be refined and optimized further.
(4)
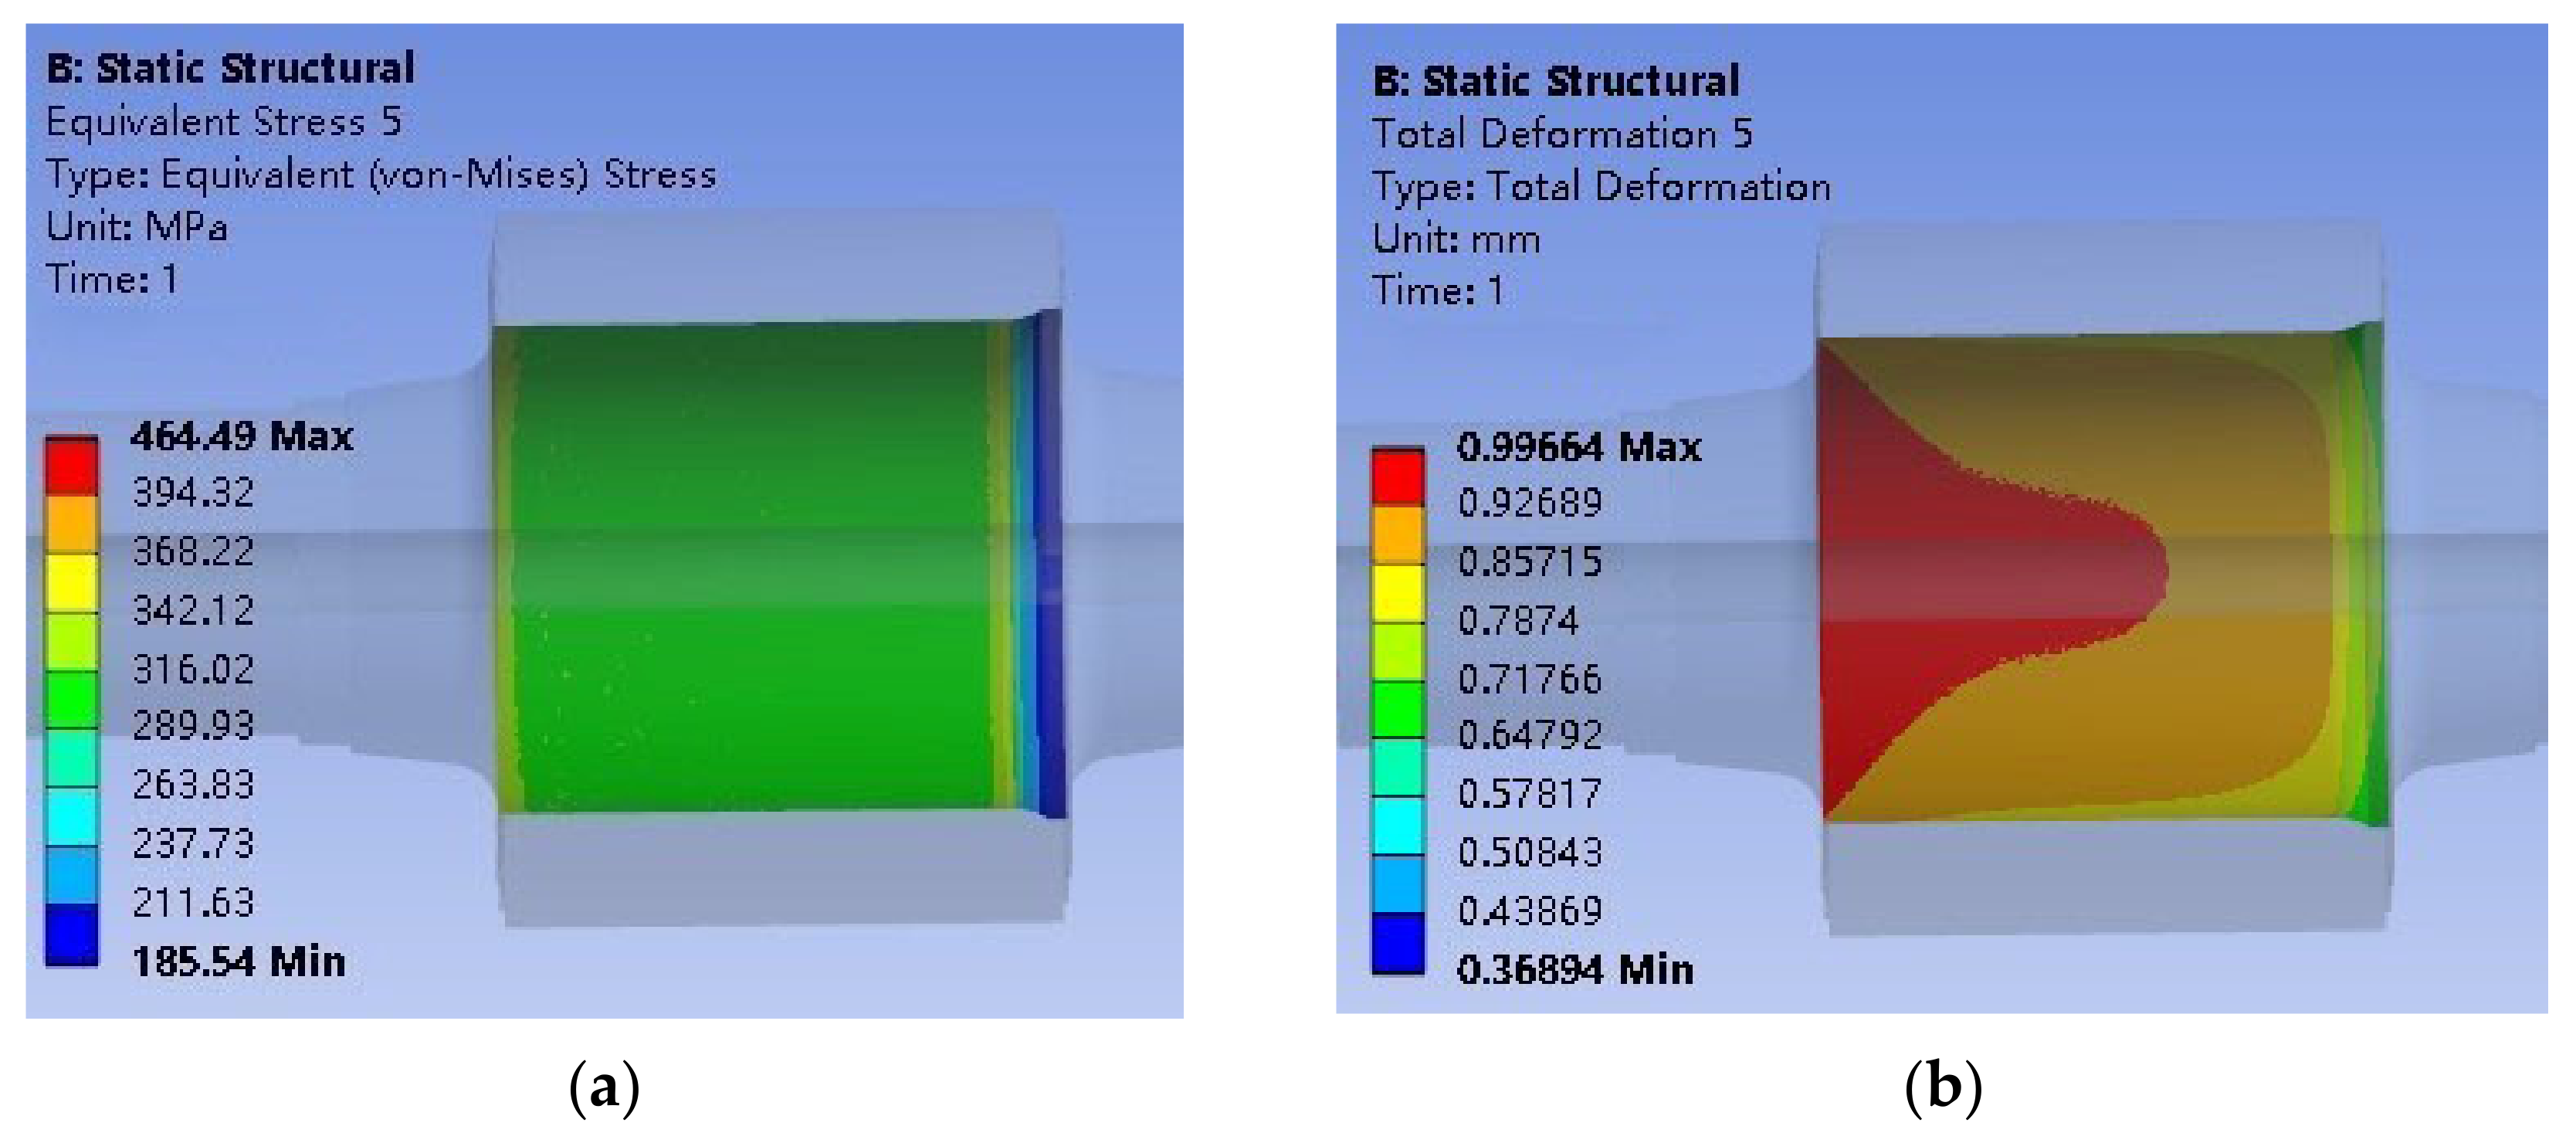
The extrusion roller is further optimized by using the Direct Optimization module of ANSYS Workbench to obtain the optimal solution of the transition arc. By comparing the data before and after optimization, the contact stress of extrusion roller is reduced by 17%, the contact sliding distance is decreased by 83%, the maximum equivalent stress is reduced by 29%, and the maximum deformation is decreased by 28%. This scheme is expected to improve the bearing capacity of the extrusion roller, reduce the production cost of the roller press, and provide a reference basis for the design of the extrusion roller.

Author Contributions

Conceptualization, W.W. and F.P.; methodology, W.W. and Y.L.; software, F.P. and Y.L.; validation, B.C. and Y.X.; formal analysis, Y.X.; investigation, F.P. and W.W.; resources, Y.W.; data curation, Y.L.; writing—original draft preparation, F.P., Y.L. and W.W.; writing—review and editing, W.W.; visualization, B.C.; supervision, W.W.; project administration, W.W. and Y.W.; funding acquisition, W.W. All authors have read and agreed to the published version of the manuscript.

Funding

This research was financially supported by the Jiangsu Key Laboratory of Precision and Micro-Manufacturing Technology (2019), Jiangsu “Six Talent Peak” Project (JXQC-022), and the Jiangsu University Students’ Practice Innovative Training Project (202010298054Z).

Institutional Review Board Statement

Not applicable.

Informed Consent Statement

Not applicable.

Data Availability Statement

The data presented in this study are available on request from the corresponding author.

Conflicts of Interest

The authors declare no conflict of interest.

References

  1. Esnault, V.; Michrafy, A.; Heitzmann, D.; Michrafy, M.; Oulahna, D. Processing fine powders by roll press. Powder Technol. 2015, 270, 484–489. [Google Scholar] [CrossRef] [Green Version]
  2. Zhang, J.; Zhang, Z.; Yang, H.; Wang, S. Fatigue and fracture failure analysis of a twin-roll press. Eng. Fail. Anal. 2018, 90, 585–596. [Google Scholar] [CrossRef]
  3. Cheng, X.; Liu, J.; Ding, Q.; Song, L.; Wang, Z. Simulation on Extrusion Comminution Model of Roller Press. In Advanced Materials Research, Proceedings of the 2010 International Conference on Advances in Materials and Manufacturing Processes, ICAMMP 2010, Shenzhen, China, 6–8 November 2010; Trans Tech Publications: Shenzhen, China, 2011; pp. 1702–1707. [Google Scholar] [CrossRef]
  4. Xi, P.; Cong, Q.; Teng, F.; Guo, H. Design and experiment of bionics pit shape grinding roller for improving wear resistance and crushability. Nongye Gongcheng Xuebao/Trans. Chin. Soc. Agric. Eng. 2018, 34, 55–61. [Google Scholar] [CrossRef]
  5. Zhang, Y.; McClain, B.; Fang, X.D. Design of interference fits via finite element method. Int. J. Mech. Sci. 2000, 42, 1835–1850. [Google Scholar] [CrossRef]
  6. Muliadi, A.R.; Litster, J.D.; Wassgren, C.R. Modeling the powder roll compaction process: Comparison of 2-D finite element method and the rolling theory for granular solids (Johanson’s model). Powder Technol. 2012, 221, 90–100. [Google Scholar] [CrossRef]
  7. Bao, J.-H.; Wang, Y.; Cai, J. The Temperature Field Analysis about the Thermal Assembly Process of the Roller Sleeve of HFCG160 Roller Press. In Applied Mechanics and Materials, Proceedings of the 2014 4th International Conference on Mechanical Science and Engineering, ICMSE 2014, Sanya, Hainan Island, China, 2–4 January 2014; Trans Tech Publications Ltd.: Sanya, China, 2014; pp. 131–135. [Google Scholar] [CrossRef]
  8. Liu, Y.; Chen, G.; Xue, Y.; Li, J. Finite Element Simulation and Analysis to Strength of Roller of Roller Mill. Min. Process. Equip. 2007, 35, 100–102. (In Chinese) [Google Scholar]
  9. Peral, L.B.; Zafra, A.; Belzunce, J.; Rodriguez, C. Effects of hydrogen on the fracture toughness of CrMo and CrMoV steels quenched and tempered at different temperatures. Int. J. Hydrog. Energy 2019, 44, 3953–3965. [Google Scholar] [CrossRef]
  10. Jiang, J.F.; Bi, Y.B. An Elastic-Plastic Analysis of Interference Fit Connection. In IOP Conference Series: Materials Science and Engineering, Proceedings of the 2nd International Workshop on Materials Science and Mechanical Engineering, IWMSME 2018, Qingdao, China, 26–28 October 2018; IOP Publishing Ltd: Qingdao, China, 2019; p. 012071. [Google Scholar] [CrossRef]
  11. Yu, J.; Teng, Y.; Chu, X. Stress Analysis of Interference Fit of Roller for Roller Press Based on ANSYS Workbench. Cem. Technol. 2015, 1, 38–40. (In Chinese) [Google Scholar] [CrossRef]
  12. Hyodo, M.; Wu, Y.; Aramaki, N.; Nakata, Y. Undrained monotonic and cyclic shear response and particle crushing of silica sand at low and high pressures. Can. Geotech. J. 2017, 54, 207–218. [Google Scholar] [CrossRef]
  13. Wei, W.; Peng, Y.; Du, L.; Cai, Y. Design and mechanical behavior analysis of two-stall cement rotary kiln cylinder. Int. J. Perform. Eng. 2020, 16, 883–895. [Google Scholar] [CrossRef]
  14. Frohlich, B.; Gade, J.; Geiger, F.; Bischoff, M.; Eberhard, P. Geometric element parameterization and parametric model order reduction in finite element based shape optimization. Comput. Mech. 2019, 63, 853–868. [Google Scholar] [CrossRef]
  15. Chen, J.; Fu, Y.; Qian, N.; Ching, C.Y.; Ewing, D.; He, Q. A study on thermal performance of revolving heat pipe grinding wheel. Appl. Therm. Eng. 2021, 182, 116065. [Google Scholar] [CrossRef]
  16. Jensen, W.A. Open problems and issues in optimal design. Qual. Eng. 2018, 30, 583–593. [Google Scholar] [CrossRef]
  17. Zheng, W.; Sun, J.; Niu, T.; Ma, C.; Yu, Q.; Zhang, Y. Structural Optimization and Heat Transfer Performance Analysis of a Cone-Column Combined Heat Sink. J. Heat Transf. 2020, 142, 004504. [Google Scholar] [CrossRef]
  18. Shi, L.; Chen, Y. A Multi-Objective Genetic Algorithm Based on Objective-Layered to Solve Network Optimization Design. In International Conference on Information Science and Control Engineering, Proceedings of the 4th International Conference on Information Science and Control Engineering, ICISCE 2017, Changsha, Hunan, China, 21–23 July 2017; Institute of Electrical and Electronics Engineers Inc.: Changsha, China, 2017; pp. 55–59. [Google Scholar] [CrossRef]
  19. Zhao, J.; Ma, C.; Hu, L. Lightening Structure Optimization of Turbine Wheel of Vehicular Turbocharger. Chin. Intern. Combust. Engine Eng. 2008, 29, 48–51. [Google Scholar] [CrossRef]
Figure 1. Model description of RP1814 roller press.
Applsci 11 09584 g001
Figure 2. Working principle diagram.
Applsci 11 09584 g002
Figure 3. Three dimensional model of extrusion roller.
Applsci 11 09584 g003
Figure 4. Mesh convergence verification.
Applsci 11 09584 g004
Figure 5. Finite element model of extrusion roller.
Applsci 11 09584 g005
Figure 6. Sectional view of mesh of roller sleeve.
Applsci 11 09584 g006
Figure 7. Mesh element quality.
Applsci 11 09584 g007
Figure 8. Interference contact nephograms: (a) contact stress nephogram; (b) sliding distance nephogram.
Applsci 11 09584 g008
Figure 9. Simulation nephograms of roller sleeve: (a) equivalent stress nephogram; (b) total deformation nephogram.
Applsci 11 09584 g009
Figure 10. Simulation nephograms of roller shaft: (a) equivalent stress nephogram; (b) total deformation nephogram.
Applsci 11 09584 g010
Figure 11. The section of optimization model of roller shaft.
Applsci 11 09584 g011
Figure 12. The section of optimization model of roller sleeve.
Applsci 11 09584 g012
Figure 13. Parameters of transition arc.
Applsci 11 09584 g013
Figure 14. Simulation results of the improved structure: (a) contact stress nephogram; (b) sliding distance nephogram; (c) equivalent stress nephogram of roller sleeve; (d) deformation nephogram of roller sleeve; (e) equivalent stress nephogram of roller shaft; (f) deformation nephogram of roller shaft.
Applsci 11 09584 g014aApplsci 11 09584 g014b
Figure 15. Direct optimization flow chart.
Applsci 11 09584 g015
Figure 16. Maximum stress curve of 30 groups.
Applsci 11 09584 g016
Figure 17. The stress value P3 corresponding to P1 and P2.
Applsci 11 09584 g017
Figure 18. Interference contact nephograms after optimization: (a) contact stress nephogram; (b) sliding distance nephogram.
Applsci 11 09584 g018
Figure 19. Simulation nephograms of optimized roller sleeve: (a) equivalent stress nephogram; (b) deformation nephogram.
Applsci 11 09584 g019
Figure 20. Simulation nephograms of optimized roller shaft: (a) equivalent stress nephogram; (b) deformation nephogram.
Applsci 11 09584 g020
Table 1. Material properties of extrusion roller.
MaterialDensity ρ (kg/m3)Elastic Modulus E (Pa)Poisson’s Ratio μYield Strength σs (MPa)
42CrMo78502.12 e110.280930
34CrNiMoA78502.10 e110.275835
Table 2. Stress values of different transition arc parameters.
Group1234567
L (mm)25354555657585
R (mm)2537537397125157
σmax (MPa)579.87585.32589.87565.32518.71490.59477.12
Publisher’s Note: MDPI stays neutral with regard to jurisdictional claims in published maps and institutional affiliations.

