
Applying Wearable Technology and a Deep Learning Model to Predict Occupational Physical Activities

 , and
, and
Abstract
1. Introduction
2. Materials and Methods
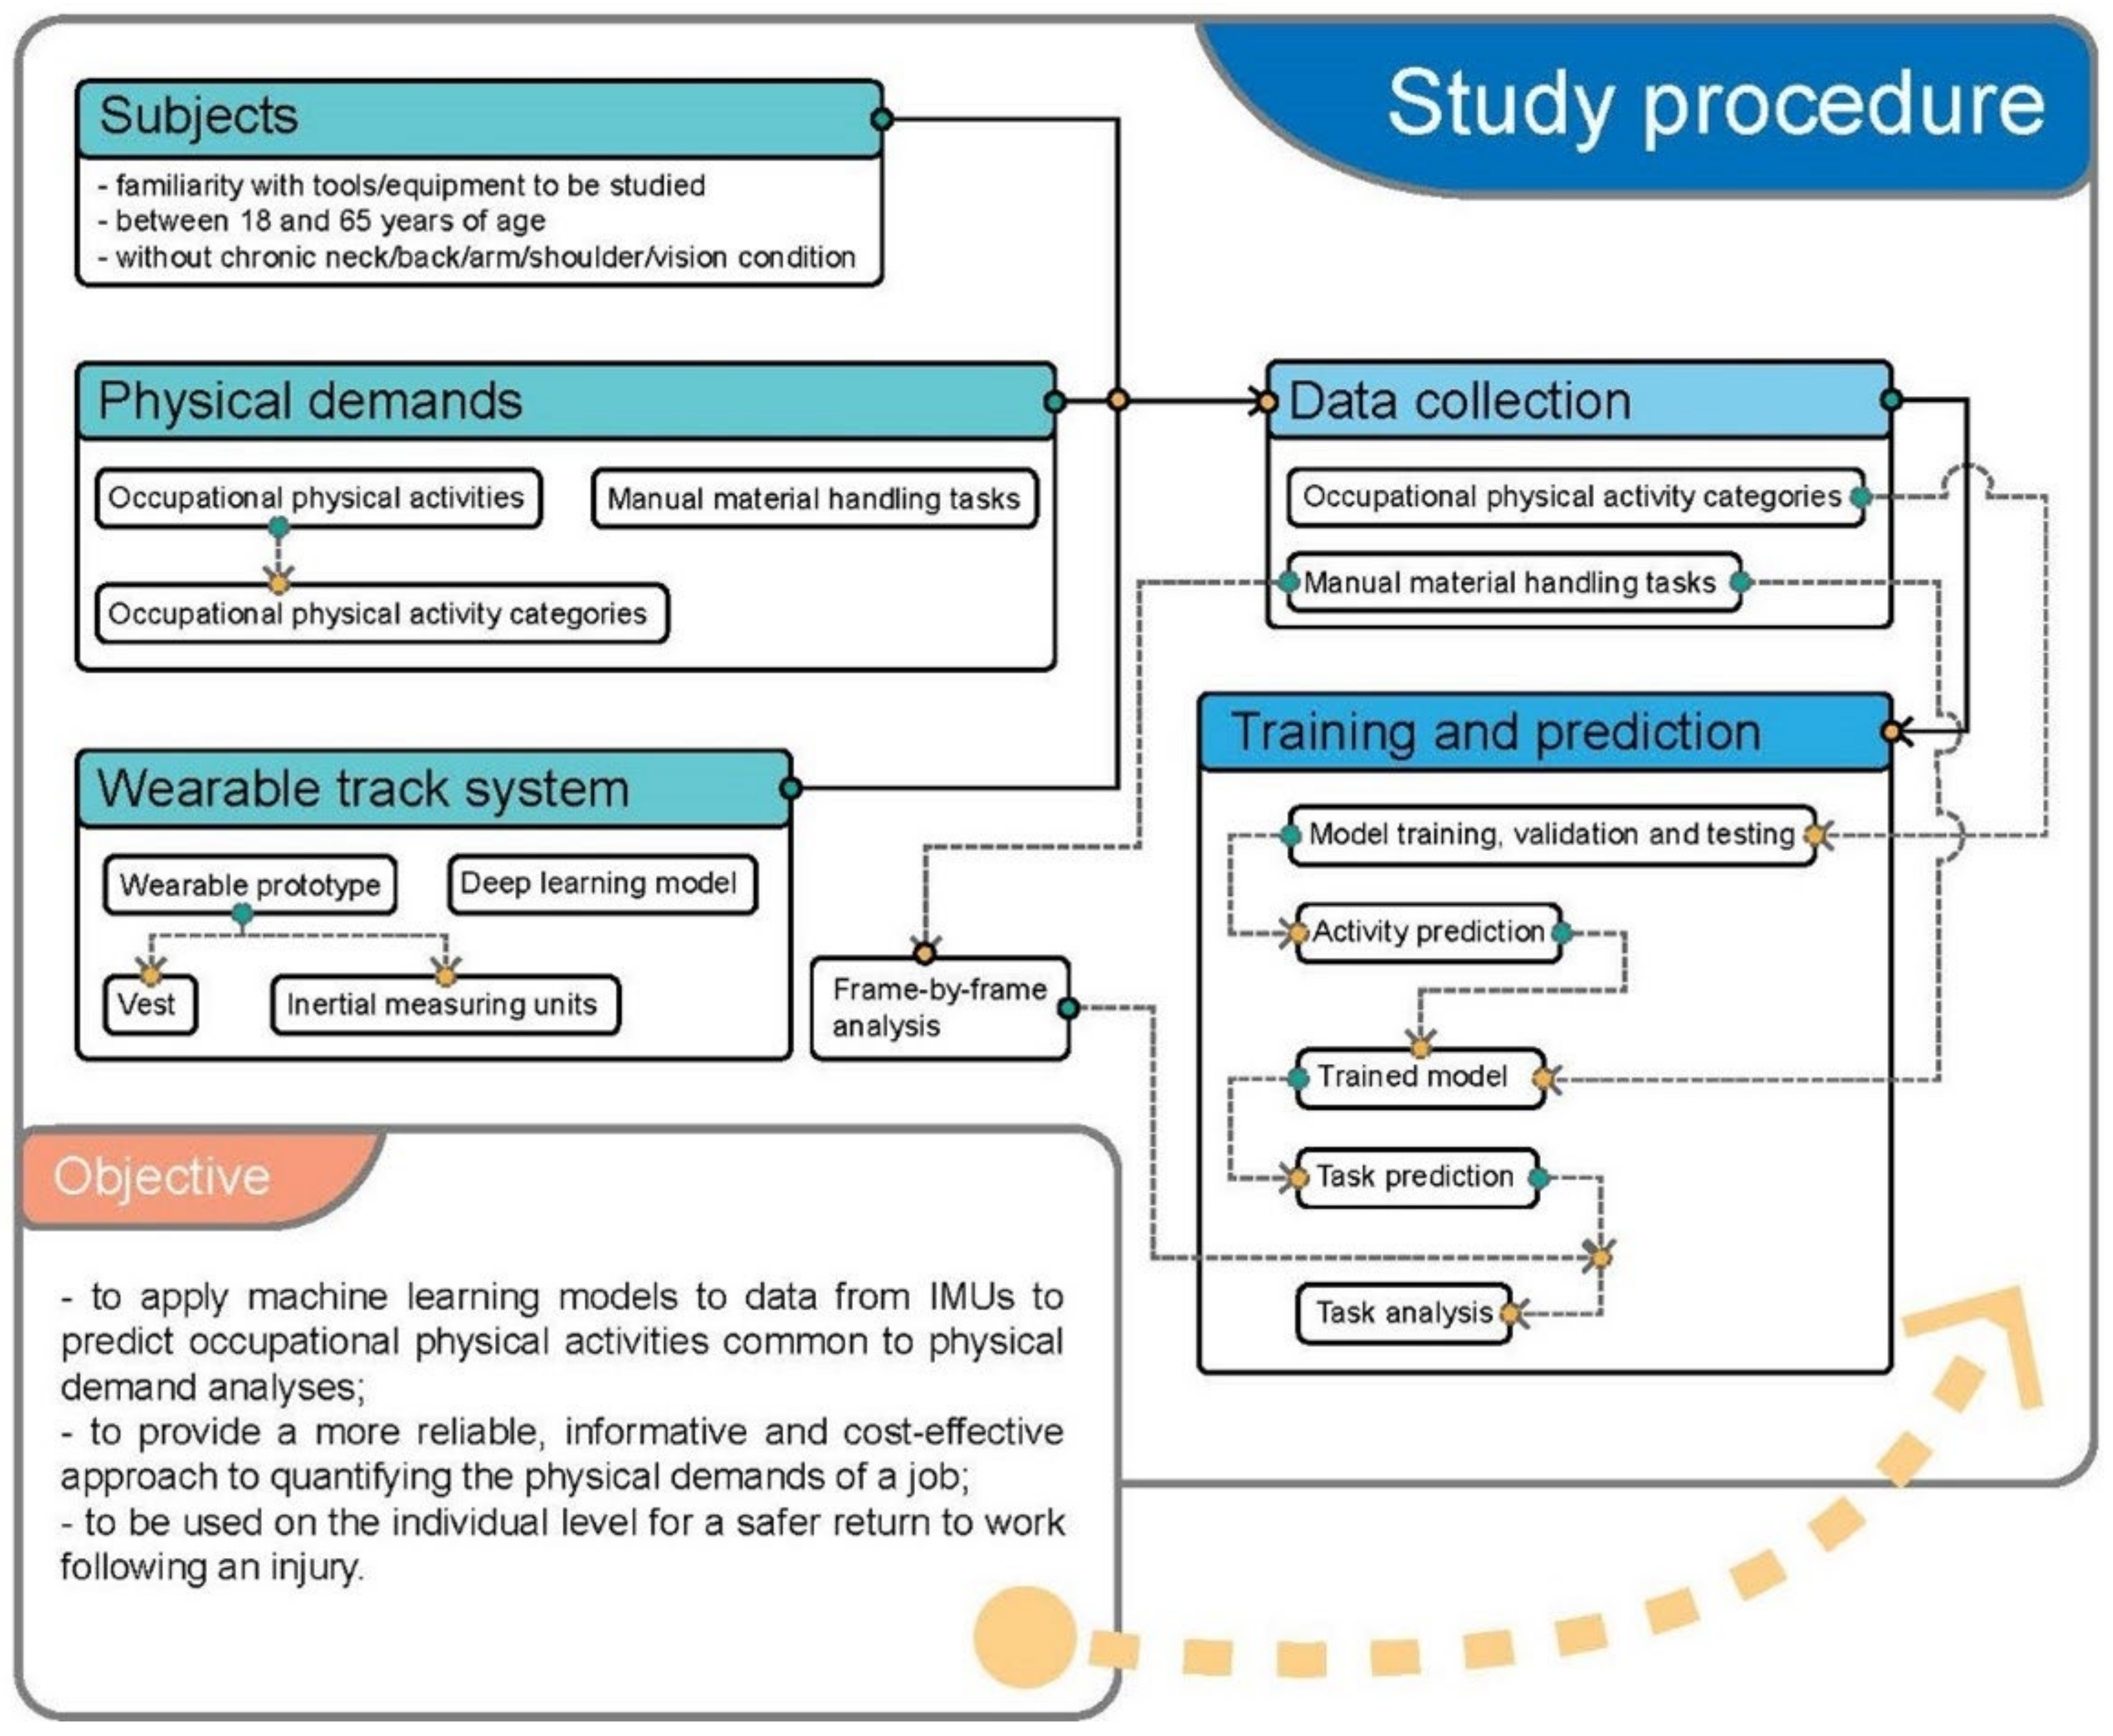
2.1. Study Procedure
2.2. Participants
2.3. Occupational Physical Activities and Manual Material Handling Tasks
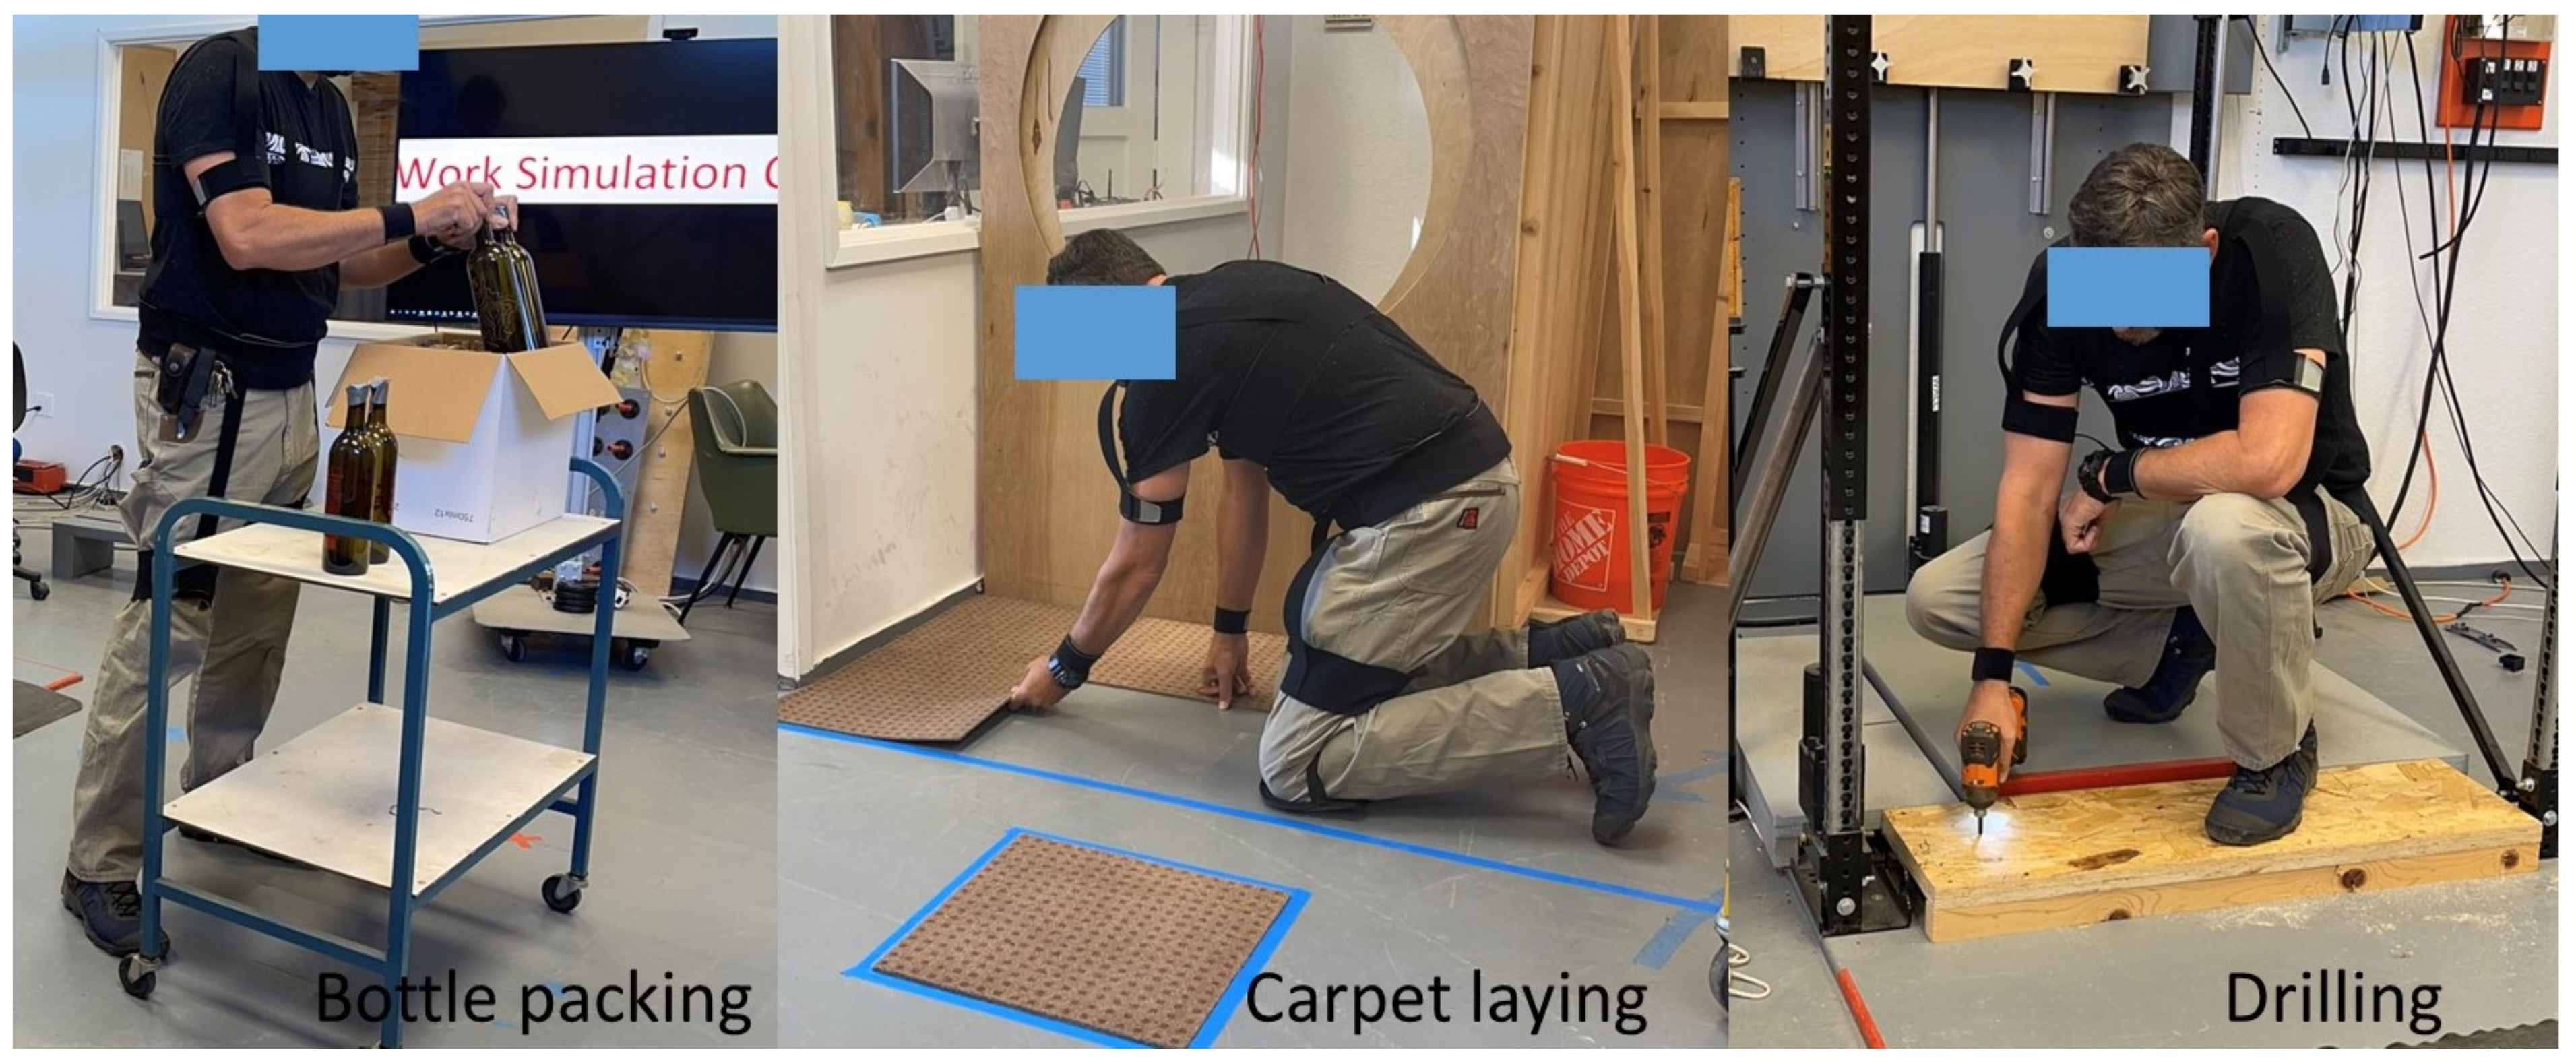
- Bottle packing started with opening the box and putting 12 bottles into the box, which contained three rows (close, intermediate, and extended distances) and four bottles in each row. After placing the bottles in the box, the box was closed. The horizontal distances between the bottles and the body were <30 cm, 30–40 cm, and >40 cm. Next, the box was carried about two meters and placed on shelves of fixed heights ranging from floor height, waist height and shoulder height.
- The carpet laying task was performed by lifting carpet from a shelf (floor, waist and shoulder height) onto a cart. The cart was then pushed or pulled to a distance of approximately two meters. After placing the carpet on the floor, subjects were asked to lay the carpet in a pre-defined rectangle.
- The drilling task involved picking up a drill, or paint roller with one hand, walking to the designated area about two meters away and drilling overhead or on the ground. Afterwards the tool was returned to the original spot.
2.4. Wearable Track Device with Inertial Measuring Units
2.5. Data Collection
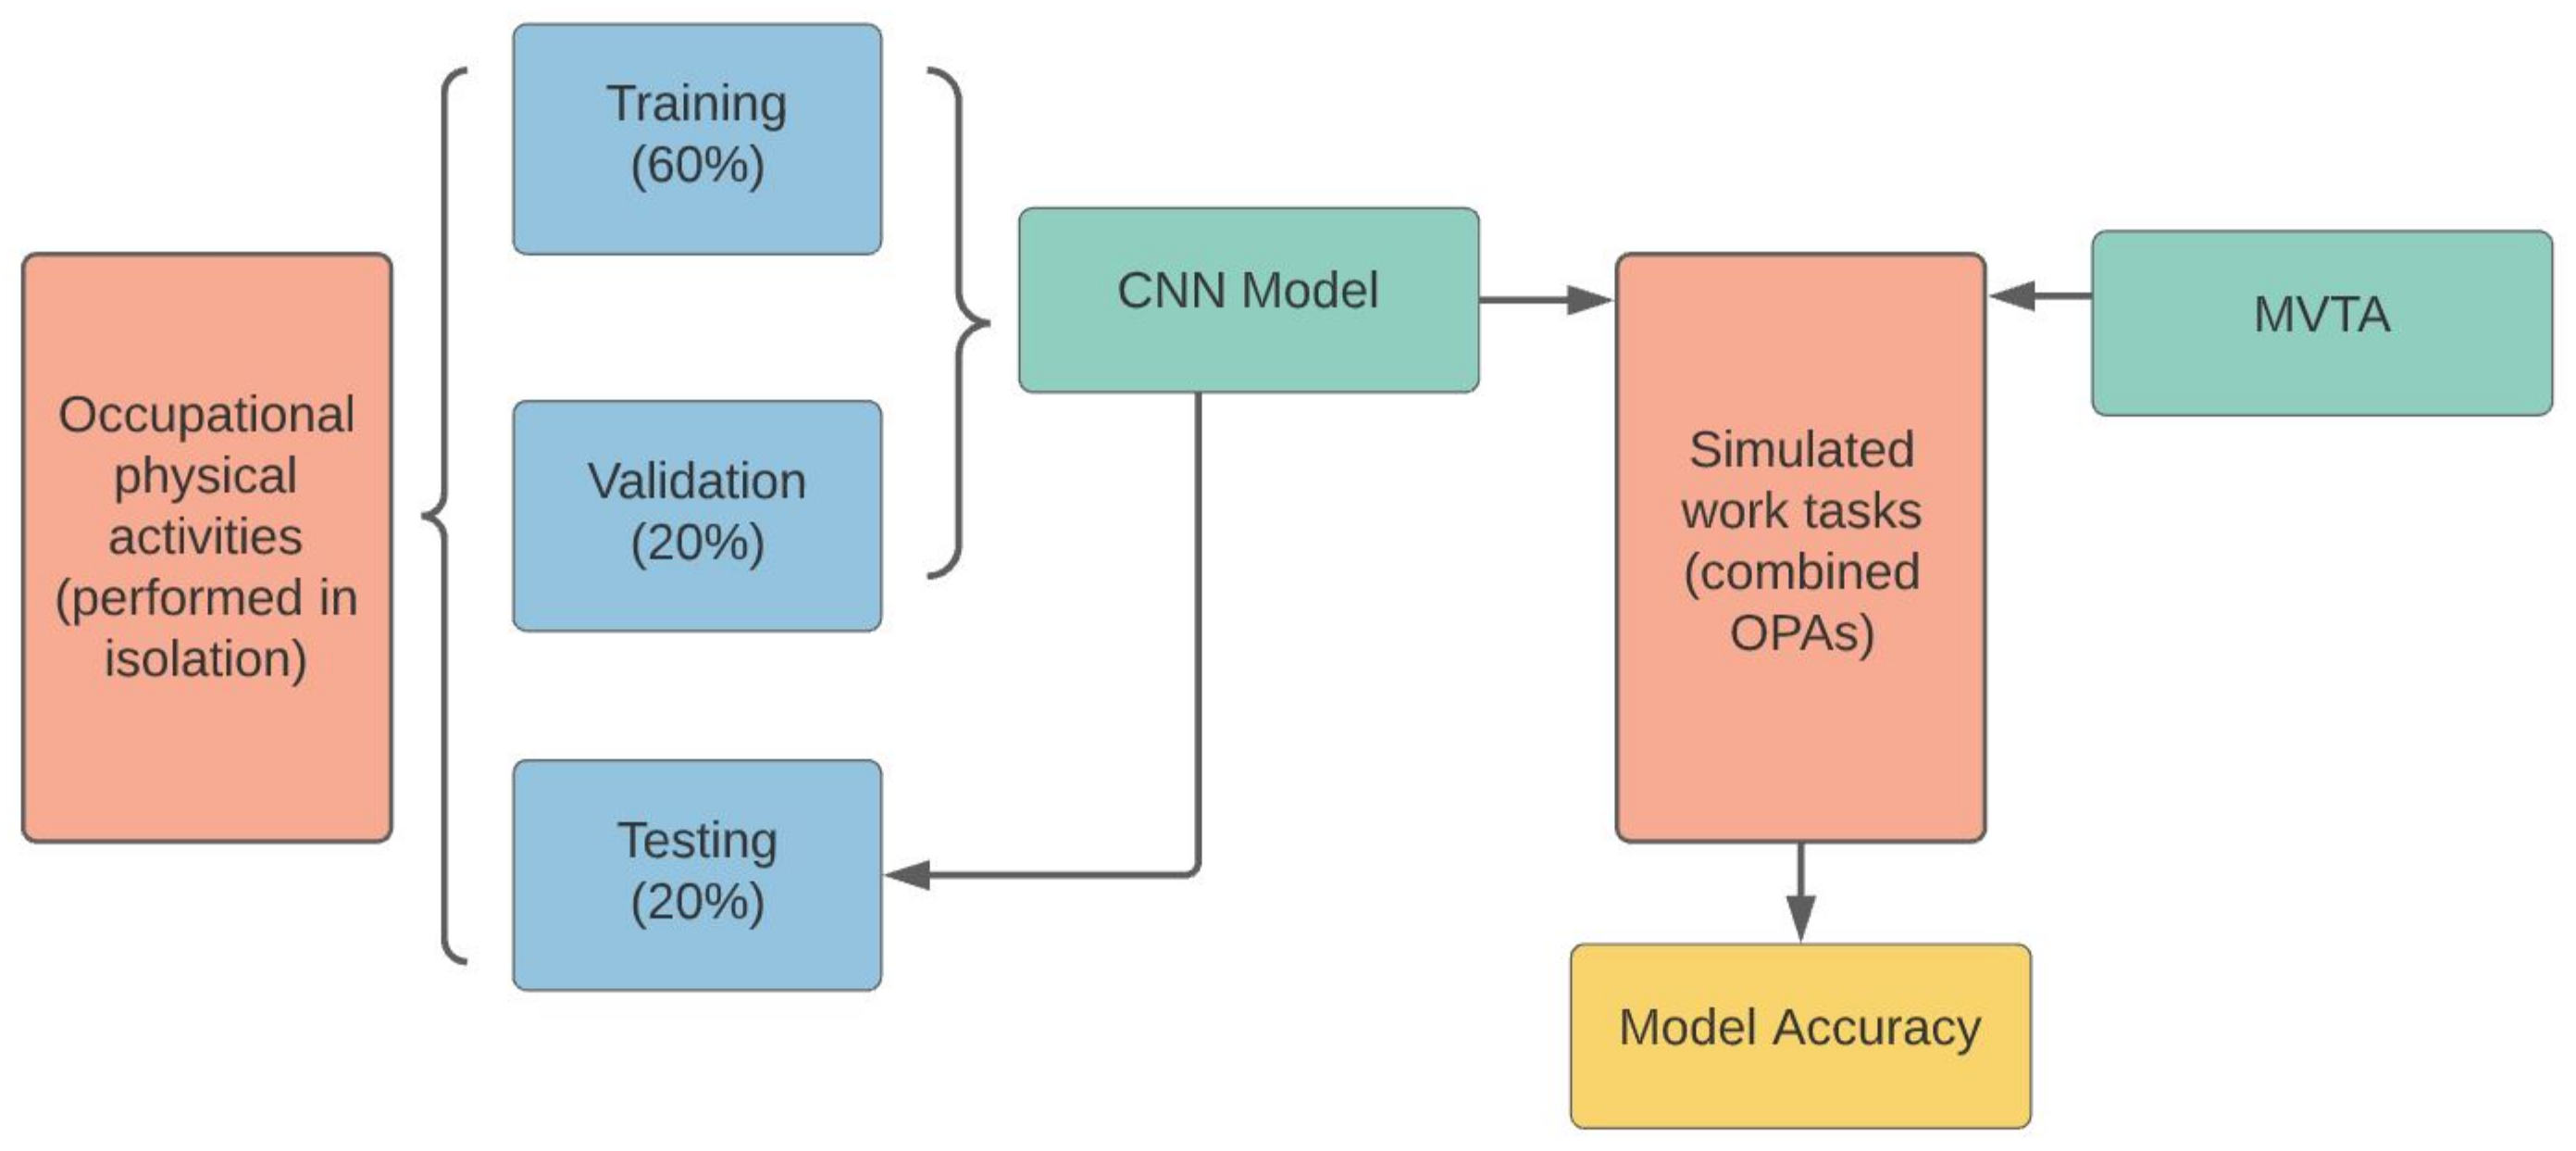
2.6. Model Training
2.7. Tasks Prediction and Validation
2.8. Post Hoc Analysis
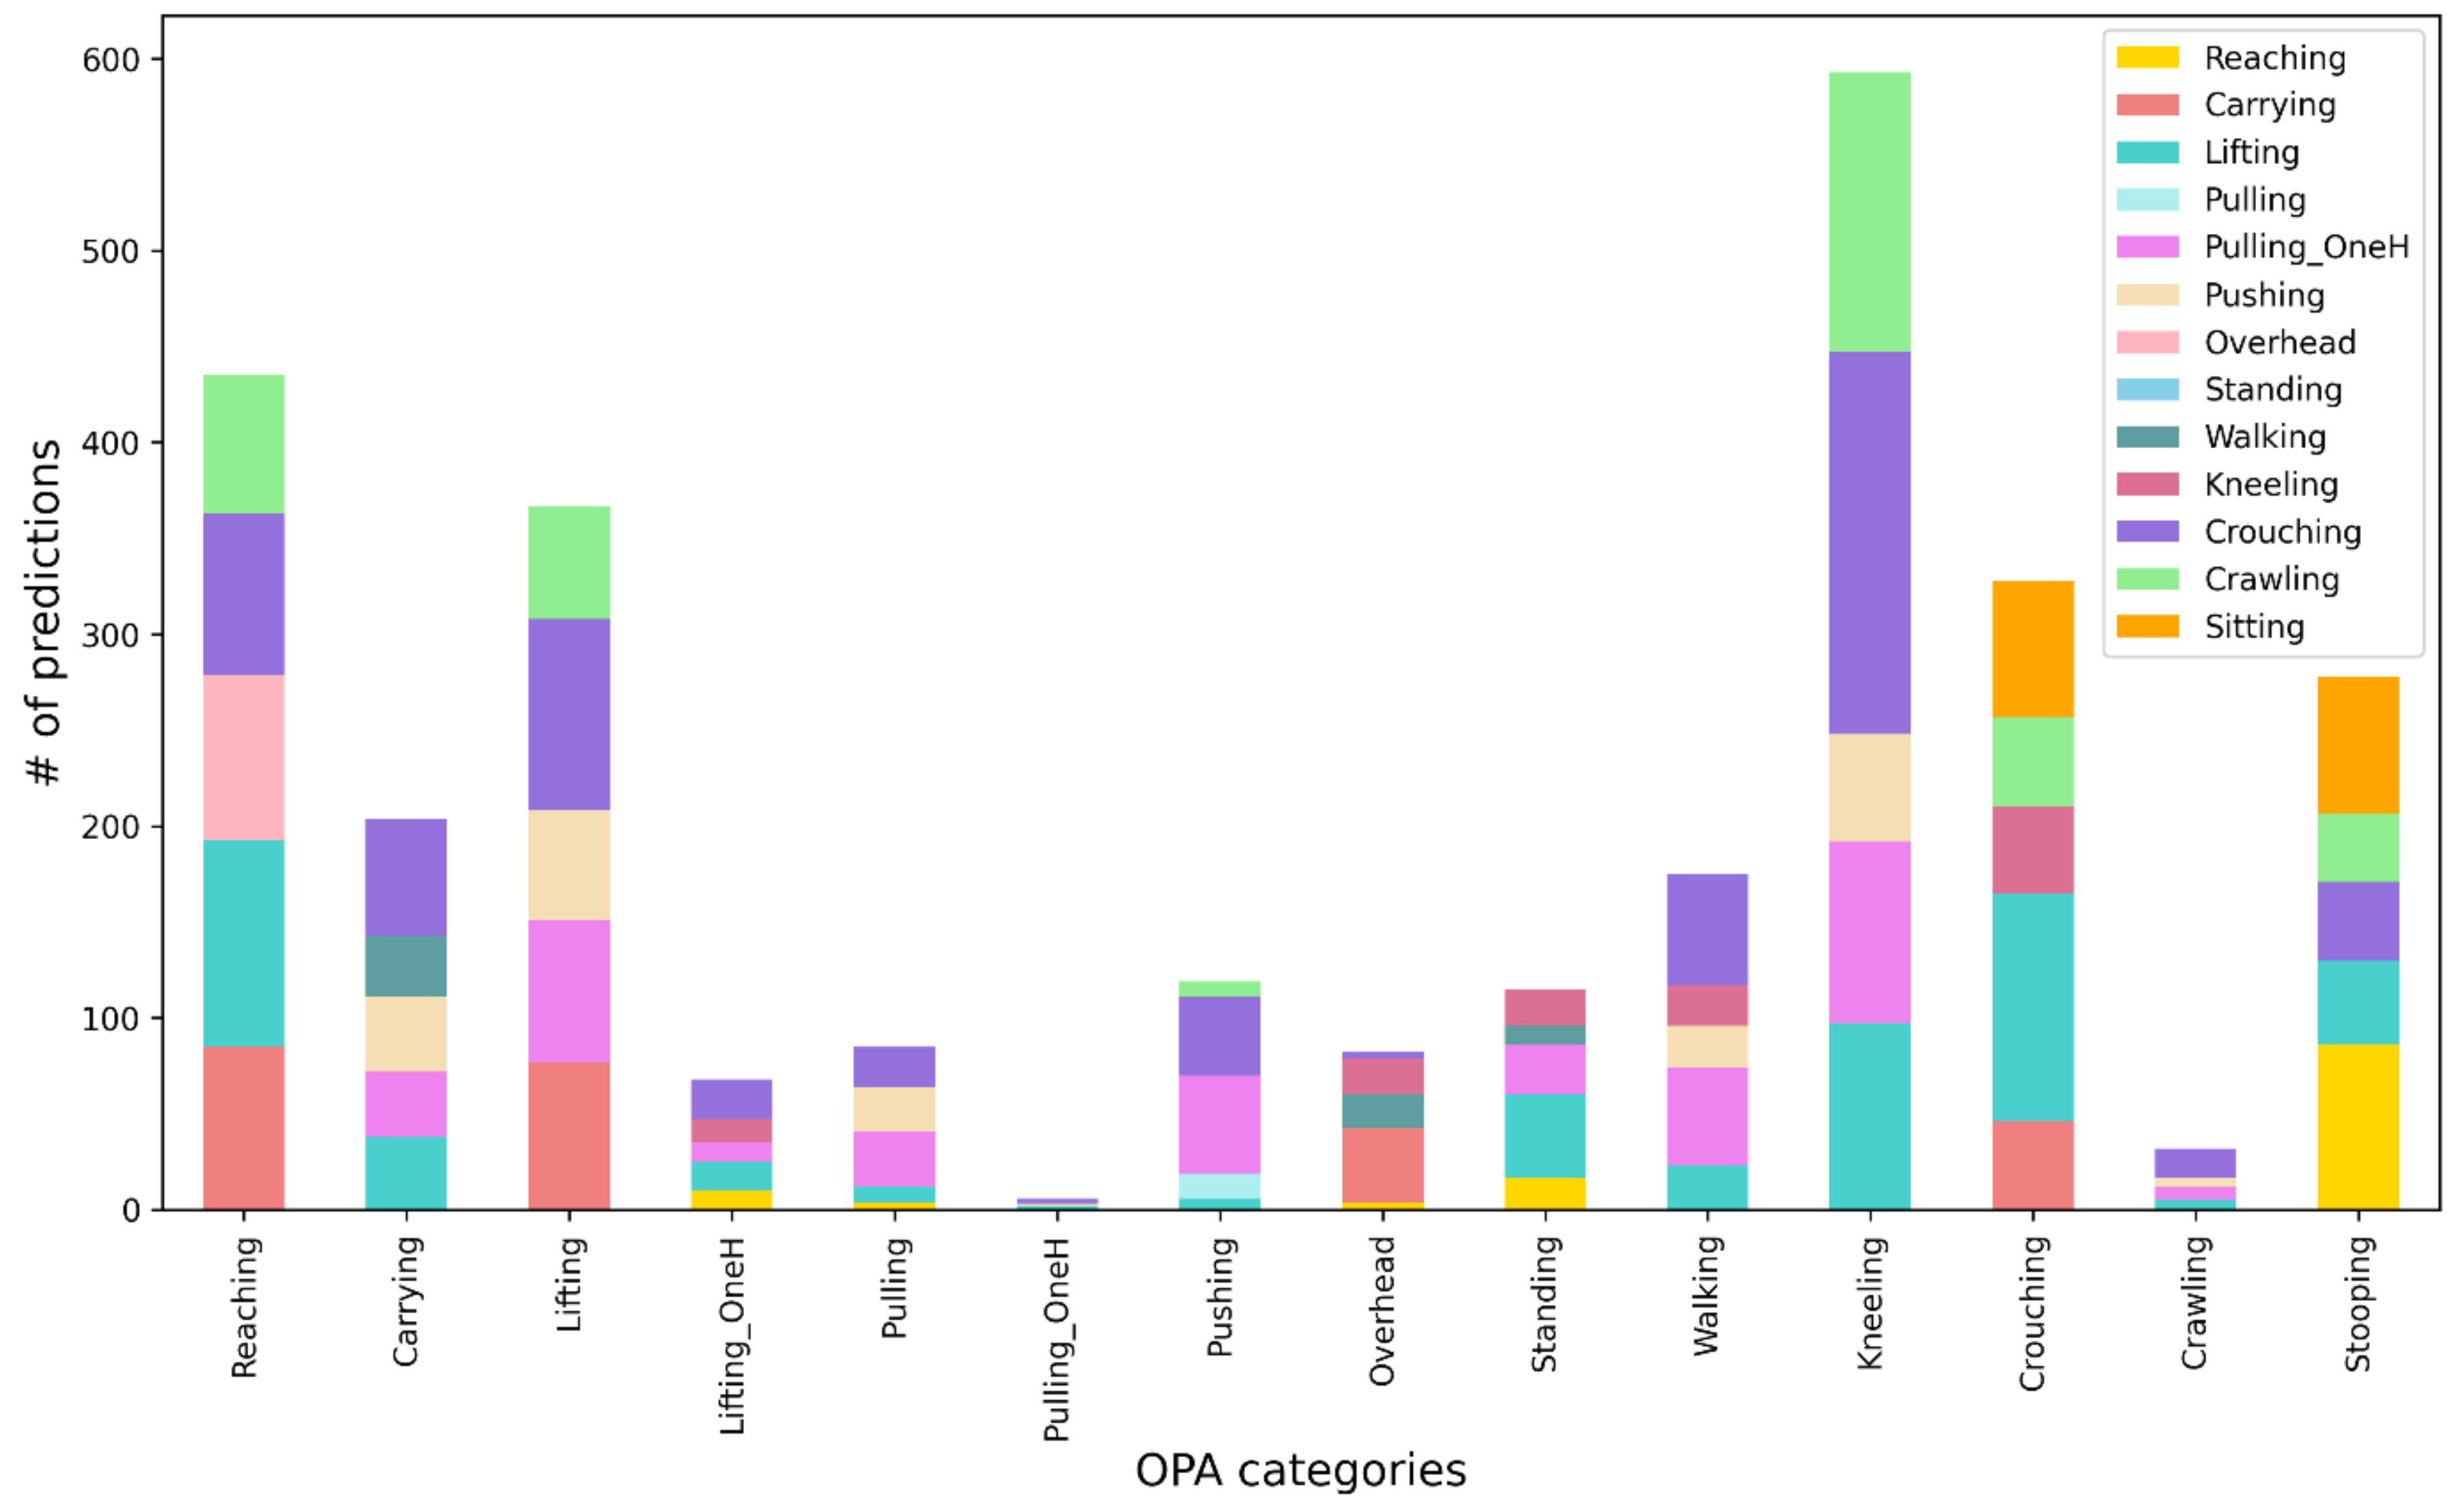
3. Results
4. Discussion
5. Limitations
6. Conclusions
Author Contributions
Funding
Institutional Review Board Statement
Informed Consent Statement
Data Availability Statement
Acknowledgments
Conflicts of Interest
References
- Bernard, B.P.; Putz-Anderson, V. Musculoskeletal Disorders and Workplace Factors. A Critical Review of Epidemiologic Evidence for Work-Related Musculoskeletal Disorders of the Neck, Upper Extremity, and Low Back. U.S. Department of Health and Human Services, 1997. Available online: https://www.cdc.gov/niosh/docs/97-141/pdfs/97-141.pdf?id=10.26616/NIOSHPUB97141 (accessed on 7 July 2021).
- Occupational Safety and Health Administration. Ergonomics—Overview. Available online: https://www.osha.gov/ergonomics (accessed on 16 June 2021).
- Waters, T.R. National Efforts to Identify Research Issues Related to Prevention of Work-Related Musculoskeletal Disorders. J. Electromyogr. Kinesiol. 2004, 14, 7–12. [Google Scholar] [CrossRef]
- Occupational Safety and Health Administration. Prevention of Work-Related Musculoskeletal Disorders. Available online: https://www.osha.gov/redirect?p_table=UNIFIED_AGENDA&p_id=4481%20 (accessed on 11 June 2021).
- Esfahani, M.I.M.; Nussbaum, M.A.; Kong, Z. Using a Smart Textile System for Classifying Occupational Manual Material Handling Tasks: Evidence from Lab-Based Simulations. Ergonomics 2019, 62, 823–833. [Google Scholar] [CrossRef]
- Casazza, B.A. Diagnosis and Treatment of Acute Low Back Pain. AFP 2012, 85, 343–350. [Google Scholar]
- Hwang, B.; Shan, M.; Supa’at, N.N.B. Green Commercial Building Projects in Singapore: Critical Risk Factors and Mitigation Measures. Sustain. Cities Soc. 2017, 30, 237–247. [Google Scholar] [CrossRef]
- David, G.C. Ergonomic Methods for Assessing Exposure to Risk Factors for Work-Related Musculoskeletal Disorders. Occup. Med. 2005, 55, 190–199. [Google Scholar] [CrossRef]
- Schall, M.C.; Fethke, N.B.; Chen, H. Working Postures and Physical Activity among Registered Nurses. Appl. Ergon. 2016, 54, 243–250. [Google Scholar] [CrossRef] [PubMed]
- Chen, H.; Lin, K.; Liing, R.; Wu, C.; Chen, C. Kinematic Measures of Arm-Trunk Movements during Unilateral and Bilateral Reaching Predict Clinically Important Change in Perceived Arm Use in Daily Activities after Intensive Stroke Rehabilitation. J. Neuroeng. Rehabil. 2015, 12, 84. [Google Scholar] [CrossRef][Green Version]
- Song, J.; Qu, X. Effects of Age and Its Interaction with Task Parameters on Lifting Biomechanics. Ergonomics 2014, 57, 653–668. [Google Scholar] [CrossRef] [PubMed]
- Song, J.; Qu, X. Age-Related Biomechanical Differences during Asymmetric Lifting. Int. J. Ind. Ergon. 2014, 44, 629–635. [Google Scholar] [CrossRef]
- Harris-Adamson, C.; Eisen, E.A.; Kapellusch, J.; Garg, A.; Hegmann, K.T.; Thiese, M.S.; Dale, A.M.; Evanoff, B.; Burt, S.; Bao, S.; et al. Biomechanical Risk Factors for Carpal Tunnel Syndrome: A Pooled Study of 2474 Workers. Occup. Environ. Med. 2015, 72, 33–41. [Google Scholar] [CrossRef] [PubMed]
- Tammana, A.; McKay, C.; Cain, S.M.; Davidson, S.P.; Vitali, R.V.; Ojeda, L.; Stirling, L.; Perkins, N.C. Load-Embedded Inertial Measurement Unit Reveals Lifting Performance. Appl. Ergon. 2018, 70, 68–76. [Google Scholar] [CrossRef] [PubMed]
- Cuesta-Vargas, A.I.; Galán-Mercant, A.; Williams, J.M. The Use of Inertial Sensors System for Human Motion Analysis. Phys. Ther. Rev. 2010, 15, 462–473. [Google Scholar] [CrossRef] [PubMed]
- Daponte, P.; De Vito, L.; Sementa, C. A Wireless-Based Home Rehabilitation System for Monitoring 3D Movements. In Proceedings of the 2013 IEEE International Symposium on Medical Measurements and Applications (MeMeA), Gatineau, QC, Canada, 4–5 May 2013; pp. 282–287. [Google Scholar]
- Yang, P.; Xie, L.; Wang, C.; Lu, S. IMU-Kinect: A Motion Sensor-Based Gait Monitoring System for Intelligent Healthcare. In Proceedings of the Adjunct Proceedings of the 2019 ACM International Joint Conference on Pervasive and Ubiquitous Computing and Proceedings of the 2019 ACM International Symposium on Wearable Computers, London, UK, 9 September 2019; Association for Computing Machinery: New York, NY, USA, 2019; pp. 350–353. [Google Scholar]
- Yeh, S.C.; Chang, S.M.; Hwang, W.Y.; Liu, W.K.; Huang, T.C. Virtual Reality Applications IMU Wireless Sensors in the Lower Limbs Rehabilitation Training. Appl. Mech. Mater. 2013, 278, 1889–1892. [Google Scholar] [CrossRef]
- Groh, B.H.; Kautz, T.; Schuldhaus, D.; Eskofier, B.M. IMU-Based Trick Classification in Skateboarding. Appl. Ergon. 2016, 52, 104–111. [Google Scholar]
- Tessendorf, B.; Gravenhorst, F.; Arnrich, B.; Tröster, G. An IMU-Based Sensor Network to Continuously Monitor Rowing Technique on the Water. In Proceedings of the 2011 Seventh International Conference on Intelligent Sensors, Sensor Networks and Information Processing, Adelaide, SA, Australia, 6–9 December 2011; pp. 253–258. [Google Scholar]
- Wang, Q.; De Baets, L.; Timmermans, A.; Chen, W.; Giacolini, L.; Matheve, T.; Markopoulos, P. Motor Control Training for the Shoulder with Smart Garments. Sensors 2017, 17, 1687. [Google Scholar] [CrossRef] [PubMed]
- Marras, W.S. Occupational Low Back Disorder Causation and Control. Ergonomics 2000, 43, 880–902. [Google Scholar] [CrossRef] [PubMed]
- Gallagher, S. Physical Limitations and Musculoskeletal Complaints Associated with Work in Unusual or Restricted Postures: A Literature Review. J. Saf. Res. 2005, 36, 51–61. [Google Scholar] [CrossRef] [PubMed]
- Kim, S.; Nussbaum, M.A. Performance Evaluation of a Wearable Inertial Motion Capture System for Capturing Physical Exposures during Manual Material Handling Tasks. Ergonomics 2013, 56, 314–326. [Google Scholar] [CrossRef]
- Bastani, K.; Kim, S.; Kong, Z.; Nussbaum, M.A.; Huang, W. Online Classification and Sensor Selection Optimization with Applications to Human Material Handling Tasks Using Wearable Sensing Technologies. IEEE Trans. Hum. Mach. Syst. 2016, 46, 485–497. [Google Scholar] [CrossRef]
- Nonfatal Occupational Injuries and Illnesses Requiring Days Away from Work. Available online: https://www.bls.gov/news.release/osh2.toc.htm (accessed on 11 June 2021).
- Kelsey, J.L.; Githens, P.B.; White, A.A.; Holford, T.R.; Walter, S.D.; O’Connor, T.; Ostfeld, A.M.; Weil, U.; Southwick, W.O.; Calogero, J.A. An Epidemiologic Study of Lifting and Twisting on the Job and Risk for Acute Prolapsed Lumbar Intervertebral Disc. J. Orthop. Res. 1984, 2, 61–66. [Google Scholar] [CrossRef]
- Granata, K.P.; Marras, W.S. Relation between Spinal Load Factors and the High-Risk Probability of Occupational Low-Back Disorder. Ergonomics 1999, 42, 1187–1199. [Google Scholar] [CrossRef] [PubMed]
- Hoogendoorn, W.E.; van Poppel, M.N.; Bongers, P.M.; Koes, B.W.; Bouter, L.M. Physical Load during Work and Leisure Time as Risk Factors for Back Pain. Scand. J. Work. Environ. Health 1999, 25, 387–403. [Google Scholar] [CrossRef] [PubMed]
- Strine, T.W.; Hootman, J.M. US National Prevalence and Correlates of Low Back and Neck Pain among Adults. Arthritis Care Res. 2007, 57, 656–665. [Google Scholar] [CrossRef] [PubMed]
- Gallagher, S.; Marras, W.S. Tolerance of the Lumbar Spine to Shear: A Review and Recommended Exposure Limits. Clin. Biomech. 2012, 27, 973–978. [Google Scholar] [CrossRef] [PubMed]
- Harris-Adamson, C.; Eisen, E.A.; Dale, A.M.; Evanoff, B.; Hegmann, K.T.; Thiese, M.S.; Kapellusch, J.M.; Garg, A.; Burt, S.; Bao, S.; et al. Personal and Workplace Psychosocial Risk Factors for Carpal Tunnel Syndrome: A Pooled Study Cohort. Occup. Environ. Med. 2013, 70, 529–537. [Google Scholar] [CrossRef] [PubMed]
- Agarwal, S.; Steinmaus, C.; Harris-Adamson, C. Sit-Stand Workstations and Impact on Low Back Discomfort: A Systematic Review and Meta-Analysis. Ergonomics 2018, 61, 538–552. [Google Scholar] [CrossRef] [PubMed]
- Harris-Adamson, C.; Mielke, A.; Xu, X.; Lin, J.-H. Ergonomic Evaluation of Standard and Alternative Pallet Jack Handless. Int. J. Ind. Ergon. 2016, 54, 113–119. [Google Scholar] [CrossRef]
- Keester, D.L.; Sommerich, C.M. Investigation of Musculoskeletal Discomfort, Work Postures, and Muscle Activation among Practicing Tattoo Artists. Appl. Ergon. 2017, 58, 137–143. [Google Scholar] [CrossRef] [PubMed]
- Antwi-Afari, M.F.; Li, H.; Yu, Y.; Kong, L. Wearable Insole Pressure System for Automated Detection and Classification of Awkward Working Postures in Construction Workers. Autom. Constr. 2018, 96, 433–441. [Google Scholar] [CrossRef]
- Blanco, J.L. A Tutorial on SE (3) Transformation Parameterizations and On-Manifold Optimization; Technical Report; University of Malaga: Malaga, Spain, 2013; Volume 3, p. 6. [Google Scholar]
- Sangari, A.; Sethares, W. Convergence Analysis of Two Loss Functions in Soft-Max Regression. IEEE Trans. Signal. Process. 2016, 64, 1280–1288. [Google Scholar] [CrossRef]
- He, K.; Zhang, X.; Ren, S.; Sun, J. Deep Residual Learning for Image Recognition. In Proceedings of the IEEE Conference on Computer Vision and Pattern Recognition (CVPR), Las Vegas, NV, USA, 27–30 June 2016; pp. 770–778. [Google Scholar]
- Yen, T.Y.; Radwin, R.G. A Video-Based System for Acquiring Biomechanical Data Synchronized with Arbitrary Events and Activities. IEEE Trans. Biomed. Eng. 1995, 42, 944–948. [Google Scholar] [CrossRef] [PubMed]
- Wang, M.; Zhao, C.; Barr, A.; Yu, S.; Kapellusch, J.; Harris Adamson, C. Hand Posture and Force Estimation Using Surface Electromyography and an Artificial Neural Network. Proc. Hum. Factors Ergon. Soc. Annu. Meet. 2020, 64, 1247–1248. [Google Scholar] [CrossRef]
- Fawaz, H.I.; Forestier, G.; Weber, J.; Idoumghar, L.; Muller, P.-A. Deep Learning for Time Series Classification: A Review. Data Min. Knowl. Discov. 2019, 33, 917–963. [Google Scholar] [CrossRef]


| OPA Category | Activity | Load | Duration/Repetition | Repetition | ||
|---|---|---|---|---|---|---|
| 1 | Lifting/Lowering | 1 | Lifting from floor to shoulder level | 4.5 kg (box) | 15 s | 2 |
| 2 | Lifting from floor to waist level | 4.5 kg (box) | 15 s | 2 | ||
| 3 | Lifting from shoulder to waist level with twist | 4.5 kg (box) | 15 s | 2 | ||
| 4 | Lifting from shoulder to waist level without twist | 4.5 kg (box) | 15 s | 2 | ||
| 5 | Stooped lifting from floor to waist level | 4.5 kg (box) | 15 s | 2 | ||
| 6 | Lifting from floor to 1.5 m level | 4.5 kg (box) | 15 s | 2 | ||
| 2 | One-handed lifting/lowering | 7 | Right-handed lifting from floor to waist level | 4.5 kg (box) | 15 s | 2 |
| 8 | Left-handed lifting from floor to waist level | 4.5 kg (box) | 15 s | 2 | ||
| 3 | Pushing | 9 | Pushing clockwise | 136 kg (cart) | 60 s | 1 |
| 10 | Pushing counterclockwise | 136 kg (cart) | 60 s | 1 | ||
| 4 | Pulling | 11 | Pulling clockwise | 136 kg (cart) | 60 s | 1 |
| 5 | One-handed pulling | 12 | Right-handed pulling | 136 kg (cart) | 60 s | 1 |
| 13 | Left-handed pulling | 136 kg (cart) | 60 s | 1 | ||
| 6 | Standing | 14 | Standing | 0 kg | 60 s | 1 |
| 7 | Sitting | 15 | Sitting | 0 kg | 60 s | 1 |
| 8 | Kneeling | 16 | Kneeling | 0 kg | 60 s | 1 |
| 9 | Static stooping | 17 | Static stooping | 0 kg | 60 s | 1 |
| 10 | Walking | 18 | Walking | 0 kg | 60 s | 1 |
| 11 | Crouching | 19 | Crouching | 0 kg | 60 s | 1 |
| 12 | Crawling | 20 | Crawling | 0 kg | 60 s | 1 |
| 13 | Carrying | 21 | Carrying | 4.5 kg (box) | 60 s | 1 |
| 14 | Reaching | 22 | Reaching (standing) close to body (shoulder elevation angle: 30°) | 0 kg | 60 s | 1 |
| 23 | Reaching (standing) far from body (shoulder elevation angle: 60°) | 0 kg | 60 s | 1 | ||
| 24 | Reaching (standing) high and far from body (shoulder elevation angle: 135°) | 0 kg | 60 s | 1 | ||
| 15 | Overhead work | 25 | Static overhead work | 0 kg | 60 s | 1 |
| 26 | Dynamic overhead work | 0 kg | 60 s | 1 | ||
| MMH Task | N | Duration/Repetition | OPA Category Covered |
|---|---|---|---|
| Bottle packing | 6 | Within 5 min | Standing, reaching, lifting/lowering, walking and carrying |
| Carpet laying | 4 | Within 5 min | Walking, lifting/lowering, one-handed lifting/lowering, pushing, pulling, one-handed pulling, crouching, stooping, crawling, kneeling and standing |
| Drilling | 4 | 15 s | Walking, lifting/lowering, carrying, stooping, overhead work and standing |
| Gender | N | Age | Height | Weight | BMI | Lower Leg | UPPER LEG | Lower Arm | Upper Arm | |
|---|---|---|---|---|---|---|---|---|---|---|
| (yrs) | (cm) | (kg) | (kg/m2) | (cm) | (cm) | (cm) | (cm) | |||
| Male | 9 | Mean | 31 | 177 | 76.10 | 24.30 | 57.44 | 92.00 | 37.67 | 38.89 |
| SD | 15.43 | 12.13 | 15.43 | 4.30 | 3.68 | 6.54 | 2.87 | 3.26 | ||
| Female | 7 | Mean | 33 | 165 | 61.16 | 22.45 | 52.17 | 85.67 | 33.33 | 34.33 |
| SD | 15.79 | 4.40 | 7.11 | 1.75 | 2.64 | 2.42 | 1.97 | 2.34 | ||
| OPA Category | N of Correct Samples (Windows) | Accuracy |
|---|---|---|
| Overhead work | 194/194 | 100% |
| Sitting | 97/97 | 100% |
| Crawling | 78/79 | 98% |
| Standing | 103/103 | 100% |
| Carrying | 271/271 | 100% |
| Walking | 101/106 | 95% |
| Pushing | 170/180 | 94% |
| Reaching | 279/279 | 100% |
| Static stooping | 84/84 | 100% |
| Kneeling | 84/85 | 98% |
| Crouching | 85/96 | 88% |
| Lifting/Lowering | 1028/1064 | 96% |
| One-handed lifting/lowering | 273/327 | 83% |
| Pulling | 80/94 | 85% |
| One-handed pulling | 194/207 | 93% |
| Overall | 3121/3266 | 95% |
| OPA Category | Upper Body Kinematics | Whole Body Kinematics | Total (Frame) | Accuracy | |||||||||||||
|---|---|---|---|---|---|---|---|---|---|---|---|---|---|---|---|---|---|
| Reaching | Carrying | Lifting | Lifting Onehanded | Pulling | Pulling Onehanded | Pushing | Overhead Work | Standing | Walking | Kneeling | Crouching | Crawling | Stooping | Sitting | |||
| Reaching | 31 | 23 | 47 | 1 | 14 | 1 | 50 | 5 | 7 | 26 | 28 | 1 | 9 | 243 | 13% | ||
| Carrying | 1 | 36 | 9 | 8 | 11 | 3 | 11 | 1 | 24 | 5 | 5 | 1 | 115 | 31% | |||
| Lifting | 6 | 32 | 28 | 29 | 16 | 12 | 15 | 8 | 39 | 21 | 3 | 209 | 13% | ||||
| Lifting onehanded | 2 | 5 | 0 | 7 | 1 | 1 | 3 | 4 | 8 | 3 | 1 | 35 | 0% | ||||
| Pulling | 1 | 13 | 13 | 6 | 2 | 4 | 39 | 33% | |||||||||
| Pulling onehanded | 1 | 0 | 1 | 1 | 3 | 0% | |||||||||||
| Pushing | 3 | 2 | 29 | 23 | 2 | 59 | 39% | ||||||||||
| Overhead work | 0 | 0 | 40 | 1 | 1 | 42 | 95% | ||||||||||
| Standing | 5 | 21 | 4 | 7 | 1 | 17 | 4 | 4 | 3 | 1 | 2 | 69 | 25% | ||||
| Walking | 2 | 8 | 13 | 2 | 14 | 2 | 21 | 3 | 25 | 4 | 2 | 96 | 22% | ||||
| Kneeling | 1 | 1 | 25 | 2 | 35 | 16 | 1 | 1 | 2 | 89 | 60 | 4 | 237 | 1% | |||
| Crouching | 7 | 3 | 85 | 1 | 5 | 1 | 7 | 24 | 13 | 12 | 22 | 180 | 13% | ||||
| Crawling | 2 | 2 | 1 | 5 | 7 | 17 | 41% | ||||||||||
| Stooping | 5 | 2 | 33 | 7 | 5 | 9 | 5 | 90 | 3 | 159 | 57% | ||||||
| Sitting | 0 | 0 | N/A | ||||||||||||||
| Total | 58 | 107 | 273 | 0 | 24 | 166 | 88 | 108 | 17 | 60 | 36 | 261 | 149 | 109 | 47 | 1503 | 22% |
| OPA Category | Upper Body Kinematics | Whole Body Kinematics | Total (Frames) | Accuracy | |||||||||||||
|---|---|---|---|---|---|---|---|---|---|---|---|---|---|---|---|---|---|
| Reaching | Carrying | Lifting | Lifting Onehanded | Pulling | Pulling Onehanded | Pushing | Overhead Work | Standing | Walking | Kneeling | Crouching | Crawling | Stooping | Sitting | |||
| Reaching | 103 | 20 | 28 | 1 | 14 | 1 | 30 | 4 | 4 | 23 | 9 | 1 | 5 | 243 | 42% | ||
| Carrying | 1 | 66 | 1 | 6 | 8 | 6 | 1 | 19 | 4 | 2 | 1 | 115 | 57% | ||||
| Lifting | 3 | 14 | 106 | 22 | 11 | 1 | 12 | 4 | 23 | 12 | 1 | 209 | 51% | ||||
| Lifting onehanded | 2 | 5 | 0 | 7 | 1 | 1 | 3 | 4 | 8 | 3 | 1 | 35 | 0% | ||||
| Pulling | 1 | 21 | 7 | 4 | 2 | 4 | 39 | 54% | |||||||||
| Pulling onehanded | 3 | 3 | 100% | ||||||||||||||
| Pushing | 1 | 6 | 52 | 59 | 88% | ||||||||||||
| Overhead work | 41 | 1 | 42 | 98% | |||||||||||||
| Standing | 1 | 11 | 3 | 5 | 1 | 39 | 1 | 4 | 3 | 1 | 69 | 57% | |||||
| Walking | 2 | 4 | 12 | 2 | 6 | 1 | 40 | 3 | 20 | 4 | 2 | 96 | 42% | ||||
| Kneeling | 1 | 1 | 23 | 2 | 35 | 16 | 1 | 1 | 16 | 87 | 51 | 3 | 237 | 7% | |||
| Crouching | 7 | 1 | 50 | 4 | 1 | 4 | 71 | 9 | 12 | 21 | 180 | 39% | |||||
| Crawling | 1 | 1 | 3 | 12 | 17 | 71% | |||||||||||
| Stooping | 2 | 33 | 7 | 4 | 9 | 3 | 99 | 2 | 159 | 62% | |||||||
| Sitting | 0 | 0 | N/A | ||||||||||||||
| Total | 118 | 110 | 272 | 0 | 29 | 118 | 103 | 75 | 39 | 70 | 37 | 271 | 110 | 115 | 36 | 1503 | 45% |
Publisher’s Note: MDPI stays neutral with regard to jurisdictional claims in published maps and institutional affiliations. |
© 2021 by the authors. Licensee MDPI, Basel, Switzerland. This article is an open access article distributed under the terms and conditions of the Creative Commons Attribution (CC BY) license (https://creativecommons.org/licenses/by/4.0/).
Share and Cite
Yan, Y.; Fan, H.; Li, Y.; Hoeglinger, E.; Wiesinger, A.; Barr, A.; O’Connell, G.D.; Harris-Adamson, C. Applying Wearable Technology and a Deep Learning Model to Predict Occupational Physical Activities. Appl. Sci. 2021, 11, 9636. https://doi.org/10.3390/app11209636
Yan Y, Fan H, Li Y, Hoeglinger E, Wiesinger A, Barr A, O’Connell GD, Harris-Adamson C. Applying Wearable Technology and a Deep Learning Model to Predict Occupational Physical Activities. Applied Sciences. 2021; 11(20):9636. https://doi.org/10.3390/app11209636
Chicago/Turabian StyleYan, Yishu, Hao Fan, Yibin Li, Elias Hoeglinger, Alexander Wiesinger, Alan Barr, Grace D. O’Connell, and Carisa Harris-Adamson. 2021. "Applying Wearable Technology and a Deep Learning Model to Predict Occupational Physical Activities" Applied Sciences 11, no. 20: 9636. https://doi.org/10.3390/app11209636
APA StyleYan, Y., Fan, H., Li, Y., Hoeglinger, E., Wiesinger, A., Barr, A., O’Connell, G. D., & Harris-Adamson, C. (2021). Applying Wearable Technology and a Deep Learning Model to Predict Occupational Physical Activities. Applied Sciences, 11(20), 9636. https://doi.org/10.3390/app11209636