Abstract
Recently, as non-face-to-face work has become more common, the development of streaming services has become a significant issue. As these services are applied in increasingly diverse fields, various problems are caused by the overloading of systems when users try to transmit high-quality images. In this paper, SRGAN (Super Resolution Generative Adversarial Network) and DAIN (Depth-Aware Video Frame Interpolation) deep learning were used to reduce the overload that occurs during real-time video transmission. Images were divided into a FoV (Field of view) region and a non-FoV (Non-Field of view) region, and SRGAN was applied to the former, DAIN to the latter. Through this process, image quality was improved and system load was reduced.
1. Introduction
Recently, various fields and services, including cloud computing, have been growing at a greater rate than expected, and related systems are being developed. The live streaming industry, especially, is growing faster than ever. High-performance portable devices are popular for watching video content anytime, anywhere through a network, such as a Wi-Fi or 5g network [1]. However, when using real-time streaming, the simultaneous use of platforms, networks, and streaming formats can cause various problems for users and viewers. For example, connection delays due to network congestion or limits to server capacity due to excessive user access may result in great inconvenience. This paper proposes a new method, focusing on reducing the amounts of data transmitted and improving video quality as a solution to various problems with real-time streaming services [2].
In this paper, we propose the following method, considering that the solution to various problems in real-time streaming services is to maintain and improve video quality and reduce the amount of data transmitted. First, the problem is solved by using the characteristics of the non-FoV region existing in the image apart from the viewing region. During streaming or learning through a network, the video transmitted to the user shows all areas of the image; therefore, more time is taken up and unnecessary data consumption occurs in transmission, which causes problems such as high traffic. To avoid this, we used screen division to maintain image quality without compromising QoE (Quality of Experience). Through this, we tried to reduce the overall traffic of the network by fixing the quality of FoV and lowering the quality of the non-FoV area. Second, system load was reduced by varying the learning method according to the viewing area. The reason for dividing into an FoV region and a non-FoV region is to apply deep learning to each image. Previously, a method was used to reduce system load by only guaranteeing the quality of the FoV region through segmentation and treating the non-FoV region as background. However, this only reduced the load on the system and could not maintain the quality for the entire area. When the change in viewpoint was applied, the viewer had no choice but to check that the quality of the image changed slowly. We therefore applied this technique to maintain the minimum frame and quality even outside the viewing area. The viewing area transmits high-quality images and the non-FoV area uses low-quality images to which DAIN (Depth-Aware Video Frame In-interpolation) is applied, thereby reducing network load and transmission. Third, the user does not continuously transmit the area that the viewer first saw, but selectively transmits the image as FoV information is received. This allows for real-time transmission while maintaining image quality, since the viewing area can change continuously. Finally, SRGAN (Super Resolution Generative Advisory Networks) is applied to the FoV area to maintain and improve image quality, and DAIN and SST are applied to the non-FoV area to adjust the image. The image that is the result this process is designed to be a selective output determined by the viewpoint of the viewer.
2. Related Work
2.1. SSAS (Sptial Segmented Adptive Streaming)
SSAS, which uses an adaptive streaming method to reduce network traffic, is set up as an FoV that transmits the user’s viewing area to the center. The FoV area viewed by the user transmits the original image quality, the original image quality is transmitted to the center of the FoV, and the lower the quality of the FoV video, the less network traffic is transmitted [3].
Figure 1 shows the user screen treated according to the SSAS method. The brightest part means highest quality; the darker the color, the lower the quality of the video.
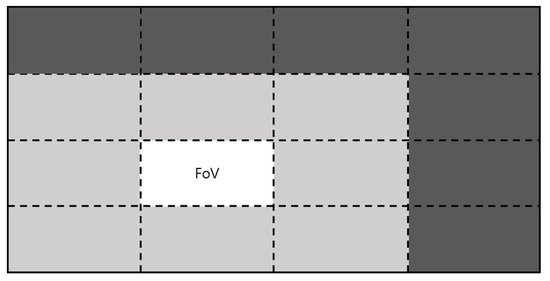
Figure 1.
User screen for FoV.
2.2. 360° Video
In general, video is recorded in a single direction or in the direction of a viewpoint, so only the recorded video or the played view can be outputted. However, in the case of 360° or VR∙AR, all areas may be affected or only specific areas depending on the recording device used. The above method can produce contents using multiple cameras. It can also create and express camera objects by using a program. Typical programs are Unity, Unreal Engine, and 3D Capture. Otherwise, 360° videos can be created, as shown in Figure 2.
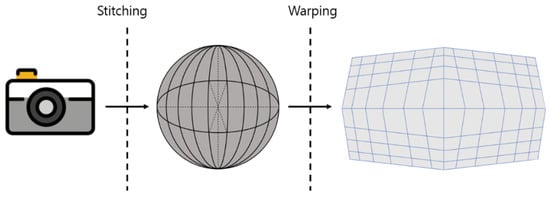
Figure 2.
Stitching and warping for 360-degree videos.
This method can be easily manufactured using a camera equipped with a 180° fisheye lens. This is a feature of the 360° camera [4]. Stitching that uses multiple cameras to shoot an object in multiple directions and then turns each image into a single image represents the final image in a spherical shape, so this image must be converted into a standard 2D image. In order to represent a spherical image as a 2D image, a process called warping is performed, and distortion occurs in the process. The 2D images derived from 360° images by means of this process are displayed as inverse warping [5,6].
Figure 3 shows a 360° image (a) and an inverse warping image (b). It is difficult to see the entire 360° image on one screen. Warping of the 3D image is performed in order to produce a 2D image which is easier to see. It is very difficult to remap 360° images to a 3D form in the way described above. However, this can be easily done with a program. Video games that use 360° video require a high FPS (Frames Per Second). Therefore, we propose a method that can adjust FPS using the minimum amount of video.
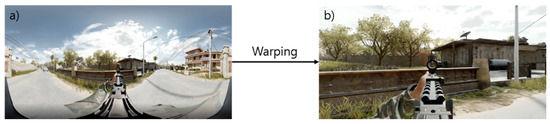
Figure 3.
Example of 360-degee video warping. (a) 360-degee video. (b) Warped video.
2.3. DAIN (Depth Aware Video Frame Interpolation)
The DAIN network is a method that can have many different applications, such as slow-motion creation, new view compositing, and frame recovery [7,8]. The high frame rate is a very attractive form of video streaming for viewers and users. However, problems such as network delay or motion blur which can be caused by high frame rates can affect system load [9]. Even if you try to use a network, such as a CNN, to solve the problem, the effect is not significant. Therefore, high-quality frame problems for video are still difficult to solve with basic networks. There are several approaches to handling large motions, such as fine-tuning strategies or adjusting architecture by means of flow estimation.
Among these approaches, PWC-Net can be used to estimate accurate flow [10]. Another approach is to estimate the mask through the pixel method. There is also a learning method that adapts the space changes and neighboring pixels that have been recently discussed. This method produces effective results by extracting and synthesizing specific frames through a pre-trained classification network. However, these methods may not be efficient as they are highly dependent on the model data that is required for training. Using the DAIN network, an estimated image is synthesized by calculating the intermediate frame between two existing images. This network is a highly effective means of achieving optical flow estimation, depth estimation, content extraction, amongst other things. In particular, it is excellent for estimating flow and depth in both directions for two input frames. It contributes to the intermediate flow by adopting a projection layer through the input frame. Since multiple flow vectors can meet at the same location, the contribution of each flow vector is calculated based on depth value. The proposed approach creates a flow with clearer motion boundaries due to the influence of depth, not just flow. Figure 4 shows a model of DAIN.
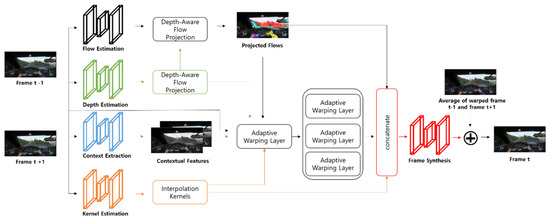
Figure 4.
Architecture of the DAIN model.
The details of the depth perception proposed are shown in the following figure.
Figure 5 is a representation of flow projection. Flow projection produces an average flow vector (green arrow). For a depth-aware flow projection layer, the projected flow will point to pixels with a smaller depth value (red arrow). On the other hand, the flow vector does not pass through these pixels, and so it can be that there are voids in the intermediate flow. The empty space created here can be compensated by calculating the average flow between neighbors. With the following formula, we can see the content of the depth.
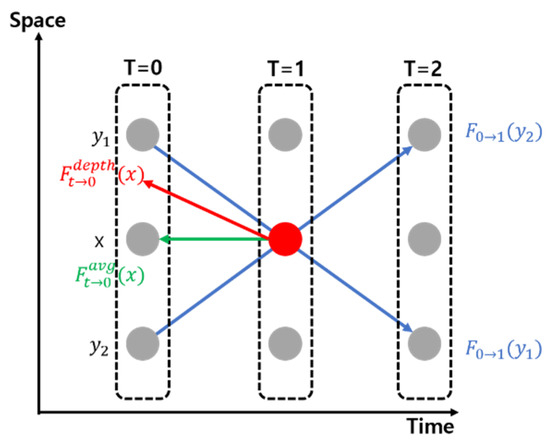
Figure 5.
DAIN flow projection.
The projected flow Ft→0 is defined by:
The flow F0→1 (y) passes through x at time t. One can approximate Ft→0(x) by −t F0→1(y). Similarly, we approximate Ft→1(x) by −(1−t) F1→0(y).
Where the weight w0 is the reciprocal of depth:
D0 is the depth map of the input frame. The flow in the empty space position is computed by averaging the available flows from its neighbors:
where N (x) = {x’: |S(x’)| > 0} is the 4-neighbors of x. From (1) and (3), we obtain the dense intermediate flow fields Ft→0 and Ft→1 for warping the input frames. If the above method is used, we can get many complements by learning the hierarchical features that extract information from most networks and contents [11].
2.4. SRGAN (Super Resolution Generative Advisory Networks)
When a low-resolution image is input, SRGAN regenerates it into a high-resolution image to further enhance the textural detail. Figure 6, below, shows the process of SRGAN [12].
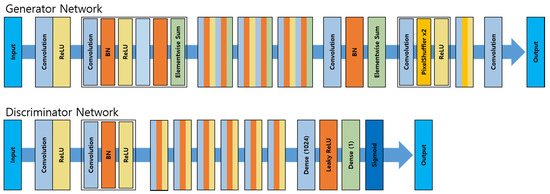
Figure 6.
Diagram of the Generator and Discriminator Networks of SRGAN.
The network process applies input data and analyzes inputted images pixel by pixel through convolution in order to extract the features of highly related pixels and apply them through the network. BN (Batch Normalization) enables learning in artificial neural networks by means of backpropagation. As the depth of the layer included in the artificial neural network increases, the gradient value transmitted by back propagation converges to 0 or diverges to achieve gradient vanishing or gradient exploding. Therefore, to improve overall learning speed, we used BN, a technique for reducing the frequency of occurrence of the problem by regularizing the values inputted to each layer, for SRGAN. Using the ReLU function, this was supplemented to prevent the loss of the gradient of the Deep Neural Network. By means of the method described, SRGAN learns one network with two networks connected. In the generator network, learning is carried out by comparing and analyzing the original image and the generated image. Additionally, this method removes the sigmoid from the network structure and calculates the loss function. After that, the final loss value is calculated using the calculated adversarial loss value and the content loss value. “Dense layer” refers to a layer that is combined with all neurons of the previous layer in the artificial neural network. Leaky ReLU is a modification of the ReLU function, and is a function that takes a negative number and reduces the value by 1/10. The following equation is the formula for the constructor (2) and the identifier (3) of SRGAN.
- G = Constructor that creates a super-resolution image result when loss resolution is inputted;
- D = A delimiter to distinguish whether the generated image is an original or a generated image;
- = G parameter;
- = D parameter;
- = The loss function value determined by comparing it with the original image (HR).
2.5. SRCNN (Image Super Resolution Using Deep Convolutional Networks)
SRCNN is a technology for converting a low resolution (LR) image into a high resolution (HR) image or for improving the quality of an image. It is mainly applied in supervised learning and provides a low-resolution and ground-truth (GT) image as a model. It is a model that learns to reduce the difference between HR and GT results [13]. The overall structure is as follows.
Figure 7 show that SRCNN receives a low-resolution image as input, goes through a series of processes, and outputs a high-resolution image. It can be expressed by the following process and formula.
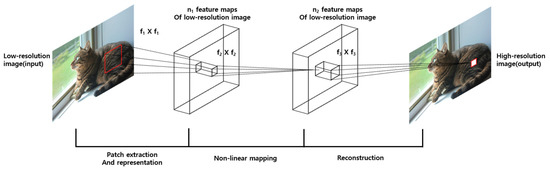
Figure 7.
SRCNN structure.
- (1)
- Bicubic interpolation
By using bicubic interpolation—a traditional upscaling method—the size of LR is the same as that of HR. Bicubic interpolation is a method of estimating the value of a new pixel as the pixel is increased by using the values of 16 adjacent pixels and weights according to distance.
- (2)
- Patch extraction and representation
The image is divided by the specified patch size and the feature map of the corresponding patch is extracted through a convolution operation. In this case, the patch size is arbitrarily designated. Afterwards, only meaningful values of the feature map are left through the activation function (ReLU).
Y stands for input low-resolution image, F(Y) stands for reconstructed output high-resolution image, Wi stands for filter, Bi stands for bias, and * stands for the convolution operation and ReLU(max(0, x)) function.
- (3)
- Non-linear mapping
Create another feature map by applying the convolution operation to the feature map delivered in (1).
Through this process, a nonlinear relationship between interpolated LR (ILR) and HR is estimated.
That is, the feature map created through this process becomes a value representing the feature of the corresponding patch area of the HR image.
- (4)
- Reconstruction
In order to combine the feature maps created in this way into one image, there will be overlapping areas. Finally, a feature value corresponding to one pixel is created by applying a convolution operation to them. This is applied to all HR pixels to create a new HR image.
In summary, this is a process of dividing the LR in which bicubic interpolation is applied in patches to obtain an estimated value through a convolution operation for each of the divided features, and where the combined HR is reconstructed by applying the convolution operation again. This structure is represented in Figure 8.
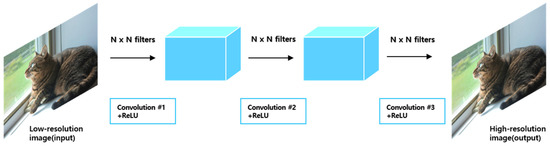
Figure 8.
Convolutional Neural Networks with three layers.
Mean Squared Error (MSE) is used as the loss function for learning the mapping function F.
2.6. RTSP (Real Time Streaming Protocol)
RTSP is a network protocol designed for communication systems to control streaming media servers. Figure 9 shows a media server and client architecture using RTSP. Such a network protocol is used for a system that streams media in real time to a client with video or audio functions and is used to remotely control a media server. Commands are similar to VCR operation methods, such as PLAY and PAUSE, and access the server based on time information. It can operate on a variety of transport layer protocols, including TCP and UDP, and forwards packets after establishing an RTP/RTCP channel using a trusted connected TCP for sending control messages.
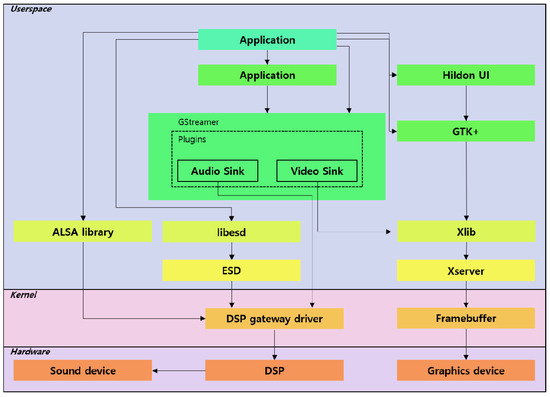
Figure 9.
A multimedia architecture with RTSP.
3. System Model or Proposal Method
3.1. Front on the Backward Frame
Based on the PIP (Picture in Picture) method, we propose the FBF (Front on the Backward Frame) method to reduce system load without deteriorating QoE. First, a low-resolution image is transmitted in the background. After that, the FoV area is transmitted in high resolution to maintain the quality. In general, 360° video streams video with different resolutions according to the influence of network traffic, while the proposed method streams video to different areas depending on the FoV. Figure 10 shows the FBF algorithm configuration diagram.
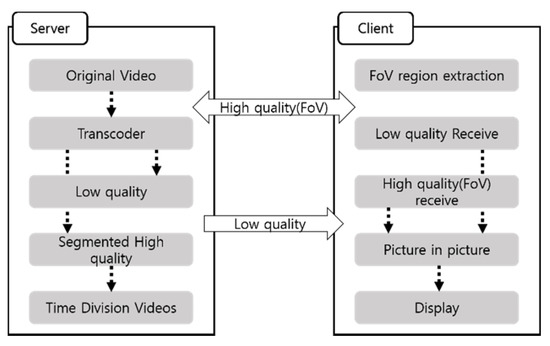
Figure 10.
FBF network configuration diagram.
The server serves a low-quality background image to the client and the client receiving the FoV area outputs the high-definition area created by the transcoder using the conversion event. It is difficult to handle multiple clients at the same time, the reason being that a problem occurs in the conversion delay. Therefore, we solved the problem by pre-processing before streaming. Figure 11 shows the preprocessing of the FBF algorithm.
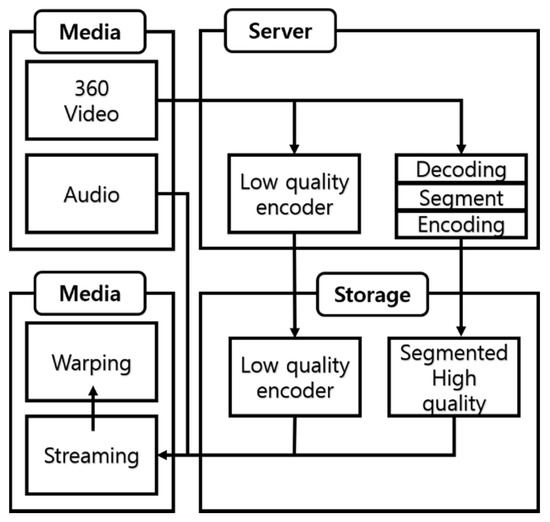
Figure 11.
Media pre-processing for the FBF algorithm.
Streaming using the FBF algorithm requires two preprocessing steps. The first step is to create a video streaming background. The background is outputted as a low-quality video. The second step requires region-division encoding because we have to stream FoV regions individually. The original video is segmented according to the number of target segmentation segments. The server receives the system information and then selects the video, so it creates a file containing the time information. Videos of different qualities generated by preprocessing are stored on the server and they are streamed in ways that are chosen by the client.
Figure 12 shows the process of an FoV switching event as experienced by the client. The FoV transition event depends on the user’s point of view. When viewing a 360° video in a PC environment, an event occurs through the mouse sensor, but in the case of a mobile device, it is operated through a gyroscope sensor. The FoV area changed by the environment according to the user’s FoV is downloaded in the next buffering and is displayed as an image overlaid on the background image. In order to produce a video according to the proposed method, a transcoding process is needed.
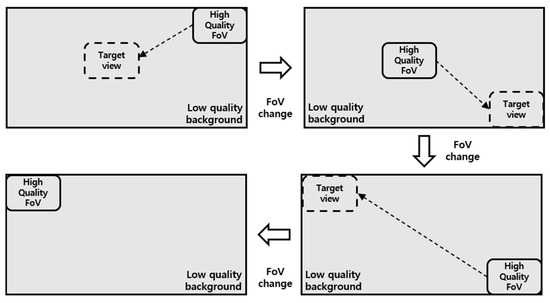
Figure 12.
FoV transition event.
The transcoder converts the original image into three types of quality: low, medium, and high. The next step is to divide the number of divisions for the FoV area and store them according to the key frame. Thus, the user receives the background video while being presented with an image of the right quality for their viewing area. This method allows the video to be streamed to the viewing area including the FBF algorithm with real-time characteristics.
3.2. SST (Spatial Segmented Transform)
The SST method involves a network that performs conversion after setting an area for a designated object or other object. Since it is a format that learns not only the salient objects in the image but also background features through deep learning, the information about the areas other than the designated area is converted. This can compensate for the problems of underfitting and overfitting [14]. Finally, the undesignated part is converted around the FoV area. The SST method was produced based on spatial transformer networks technology. The proposed method divides the image by region and the image quality is transformed through deep learning to compensate for loss of image quality. When the image is artificially divided into individual areas and passed through a network, quality conversion occurs, so SST is used to prevent data loss in whatever conditions obtain without changing the shape of the image. Figure 13 shows the basic structure of SST.
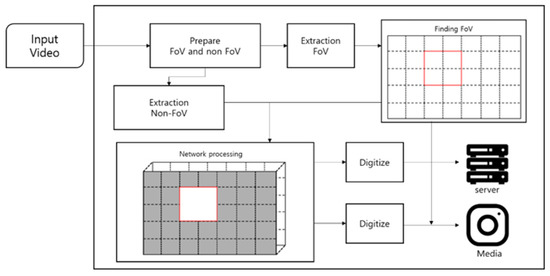
Figure 13.
SST network model.
Figure 14 shows how the network handles the rest of the original image except for the RoI (Region of interest). In order to determine the RoI at an early stage, a method of using a designated area or target is employed, though information can also be extracted using a network such as CAM Shift. In the last step, non-RoI is extracted and converted into a new frame after the conversion process. This represents the process of outputting as video. The method is used to reduce system load.
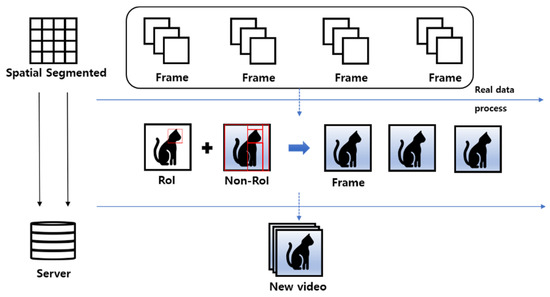
Figure 14.
SST network processing.
3.3. Segmentation
The FBF algorithm is a method of converting a high-quality area according to a user’s area. At the initial stage, quality was lowered and the frame was set to 30 frames to reduce the transition delay of the high-quality area. The segmentation process was designed according to the generic HLS protocol. Also, unlike the basic structure, classification according to quality was added. A transcoder module and a segment module were implemented in the server to reduce system load on mobile phones and PCs. The information for each area of the content is stored separately, and a packet to be played back can be selected. We designed a protocol to classify chunk files in order to properly select them according to FoV. The m3u8 in each layer stores information about whether or not the program was viewed and the path to the file. The next layer stores the route of the TS segment divided by time and conforms to the HLS standard. The proposed server uses a split transmission method, so no RTSP or RTMP server is required. Preprocessing and TS-packetized modules were installed on the Apache web server. The preprocessing module re-encodes the content uploaded to the server by area and quality. The TS-packetized module divides each video into area and quality and reconstructs them into MPEG-2 TS packets. This will create an m3u8 file listing the HLS Segmenter in shown Figure 15.
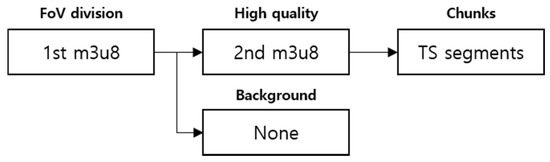
Figure 15.
Hierarchy of m3u8.
3.4. Investigation of Loss Comparison
We decided to use mean opinion score (MOS) testing to determine the super-resolution network to be applied to FoV.
Figure 16 shows the ability of SRGAN according to MOS testing. The MOS test is the evaluation of 12 versions of each image on the BSD100. The networks used for evaluation were nearset, bicubic, SRCNN, SelfExSR [15], DRCN [16], ESPCN [17], SRResNet, and SRGAN. Based on this, SRGAN was selected, and SRCNN, which is used in many environments, was applied to the experiment to compare the proposed architecture.
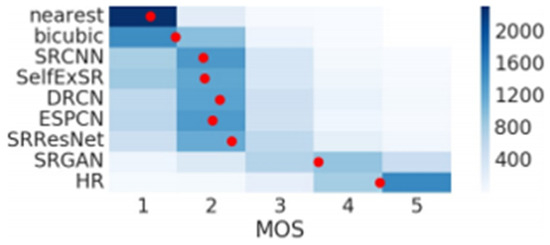
Figure 16.
Color-coded distribution of MOS scores on BSD100. For each method 2600 samples (100 images × 26 raters) were assessed. The mean is shown by the red markers, where the bins are centered around value i (4× upscaling).
First of all, SRCNN has the advantage of having a very simple structure and a high level of accuracy. Its speed is fast, even if only the CPU is used. In addition, it can make the model bigger and deeper, and better performance can be expected as the data set is diversified. It also has the advantage of processing three RGB channels and obtaining high-resolution images at the same time, so it can be used in many places. SRGAN’s strength, meanwhile, is that it handles texture well and has a fast speed. By actively utilizing ResNet and skip-connection in the generator network, it shows good performance in saving time and memory. The following Table 1 shows the performance.

Table 1.
Quantitative measures with Ch. 1–3.
After learning using the DIV2K data set [18], we performed standard quantitative measurements using PSNR and SSIM. The focus of this work was the perceptual quality of super-resolution images.
4. Simulations
4.1. Simulations Environment Architecture
Figure 17 shows the overall system structure and how it is that the original video is outputted in the server. In order to change the resolution of the image, the image is divided and the resolution is then adjusted. These images are merged and transmitted by the server. Segmentation, recognition, transformation, and networks are used in this process.
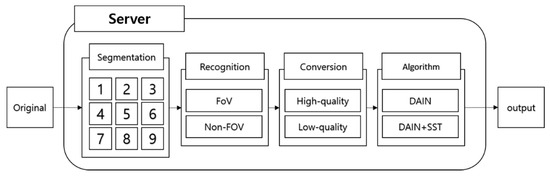
Figure 17.
Simulation Process.
4.2. System Configuration
In this section, we show the proposed model. The experimental method in Figure 18 shows an example of image segmentation. When dividing the image, the image is adjusted to the absolute size, so the area can be divided according to the location of the FoV. This method is a flexible and objective method that can change the viewpoint by extracting a box-shaped image in units of regions. Algorithms and computational methods of networks are configured according to each domain.
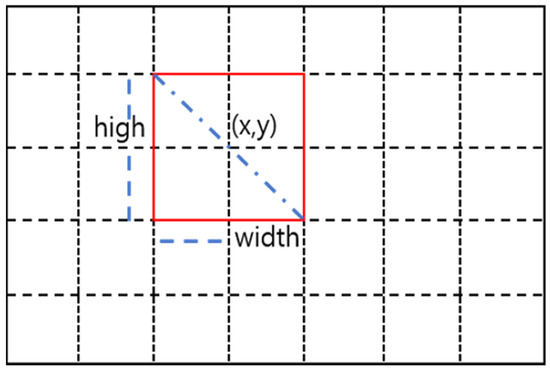
Figure 18.
Location calculation by area.
Figure 19 and Figure 20 show the results of applying the image segmentation method to 360° video and general video. Since the image is scaled and segmented based on its absolute size, the area can be segmented according to the position of the FoV. As shown in Figure 18, this method can be easily and quickly applied to visual viewpoint transformation because it is extracted in the shape of a box. Therefore, flexible calculations are possible when applying networks and algorithms.
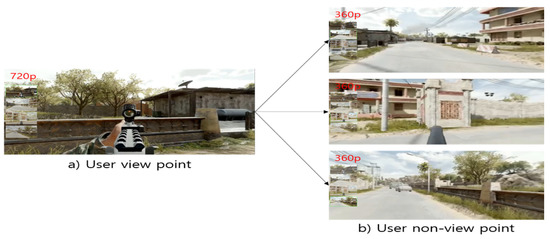
Figure 19.
(a) Game user viewpoint (360 degrees). (b) User non-viewpoint screen.
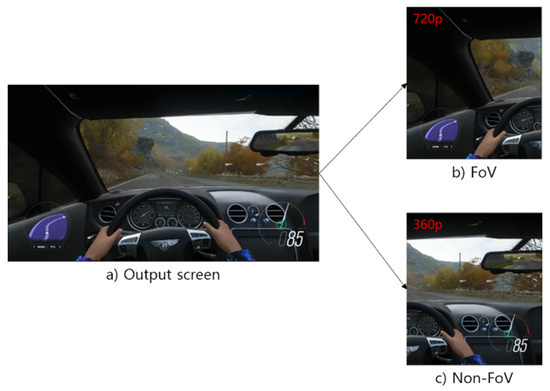
Figure 20.
(a) 2D game split into (b) FoV and (c) non-FoV.
Figure 21 shows how the client and server behave according to user requests.
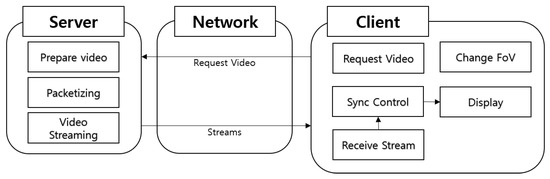
Figure 21.
Client system configuration.
The server prepares video for output through preprocessing.
When the user’s request is confirmed, the requested video is sent. Whenever the user’s field of view is switched, the client sends an event to the server and requests the video it needs. When the server receives the video, each network works to output the video.
Figure 22 shows how video is handled by the network depending on the user’s point of view. In this simulation, the image was segmented into nine parts and divided into FoV and non-FoV areas according to the user’s point of view. It shows how the image is outputted after SRGAN is applied to the FoV area and DAIN and SST algorithms are applied to the non-FoV area.
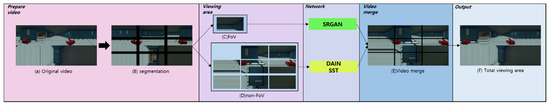
Figure 22.
Model processing.
4.3. Evaluation
We performed several tests on the system using various images. The data for each video was measured via live streaming. Figure 23 shows the image used for the simulation.
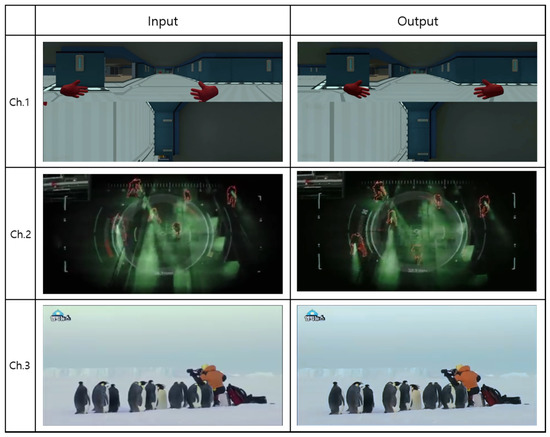
Figure 23.
I/O comparison of the proposed method.
The used video displays information about each video in the form of a Channel (Ch.). The 360° real-time game screen, the 2D game screen, and broadcast screen were used in Ch. 1–3. For comparison, the results of applying the entire area, including the original, and the network after segmentation, including SRGAN and SRCNN, are shown in each diagram.
Table 2 and Table 3 correspond to Ch. 1 in Figure 23. As a result of the simulation, it can be seen that bitrate differs by 5.8 times compared to SRCNN (scaling) based on FoV (by one scaling) value, and SRGAN (scaling) differs by 2.9 times. Latency values showed a high difference of 16 times for SRCNN and 9 times for SRGAN. And it can be seen that the difference in Network Bandwidth is about 5.8 to 2.9 times. The overall bitrate and data rate by one scaling are shown in Table 3, and in the FoV area, 4K or higher quality is transmitted. The video bitrate range of 4K or higher requires about 13,000–51,000 kbps, but the bitrate in the FoV area was reduced to 3651 kbps.
Table 2.
Compare each network of the 360° video.
Table 3.
Bitrate and size comparison for each of the 360° videos.
Table 4 and Table 5 corresponds to Ch. 2. As a result of the simulation, it can be seen that the FoV (by one scaling) of the bitrate differs by 13 times in SRCNN (scaling) and 6.5 times in SRGAN (scaling). Latency showed a high difference of 4.4 times in SRCNN and 9 times in SRGAN. And it can be seen that network bandwidth differs by about 5 to 2.8 times. Table 5 shows the overall bitrate and data rate of one scaling. In the FoV area, HD level quality is transmitted. In HD quality, the video bitrate range needs about 1500–6000 kbps, but the FoV area was able to check it at 854 kbps.
Table 4.
Compare each network of game streaming video.
Table 5.
Bitrate and size comparison for each game streaming video.
Table 6 and Table 7 correspond to Ch. 3. As a result of the simulation, it can be seen that the FoV (by one scaling) of the bitrate differs by about 13 times in SRCNN (scaling) and 6.5 times in SRGAN (scaling). Latency values also showed a high difference of 4.4 times for SRCNN and 9 times for SRGAN. It can be seen that network bandwidth differs from about 5.8 to 2.9 times. For Ch. 3, it is the same size as Ch. 2. However, since Ch. 2 is in the form of a game, more load is inevitably added, so Ch. 3 shows a lower value than Ch. 2. In the case of Ch. 3, as with Ch. 2, HD quality is transmitted, and a bitrate of about 159 kbps was confirmed. When the video is transmitted by applying the proposed method, it shows a low bitrate value even though it is a high-resolution video. It can be seen that the overall value decreased by about 40–60%.
Table 6.
Compare each network of broadcast streaming video.
Table 7.
Bitrate and size comparison for each streaming video broadcast.
5. Conclusions
The ideal in video streaming today is high-quality, persistent video. However, image quality may deteriorate depending on the user’s system and the network environment, and a system with a higher specification may be required. In addition, it is thought that bandwidths currently used are insufficient to cover the streaming market in the future, as more broadcasts are showing real-time motion through VR or 360-degree video. In particular, videos with resolutions over 4K may have insufficient bandwidth depending on the streaming environment.
In this paper, we have proposed a method to reduce system and network load according to the video viewing area. We aimed to reduce the bitrate by at least 30–40% and derived a bitrate reduction of about 40–60% using the proposed method. According to this method, after segmenting the image, SRGAN is applied to the FoV region to transmit an image of higher quality than the original image, and the DAIN + SST algorithm is applied to the non-FoV region to adjust FPS. In this way, we were able to solve the phenomenon of quality degradation that can be observed depending on the streaming environment. In addition, in order to reduce the burden on viewers due to the switching delay that occurs during region conversion using this method, streaming is enabled using the video region of the preprocessing part of the server.
In conclusion, using the above method, the user can transmit a high-quality image using a small capacity, and the viewer can watch the high-quality image. However, the use of various networks and algorithms requires a high-spec server. Therefore, in future research, instead of reducing the load on the network by reducing preprocessing as much as possible, we plan to conduct research to increase the FoV area, improve QoE, and reduce the load on the server.
Author Contributions
Conceptualization, S.-Y.C.; methodology, S.-Y.C.; software, S.-Y.C., D.-Y.K. and S.-Y.O.; validation, S.-Y.C., D.-Y.K. and S.-Y.O.; formal analysis, S.-Y.C., D.-Y.K. and S.-Y.O.; investigation, S.-Y.C., D.-Y.K. and S.-Y.O.; resources, S.-Y.C.; data curation, S.-Y.C.; writing—original draft preparation, S.-Y.C.; writing—review and editing, S.-Y.C., D.-Y.K., S.-Y.O. and C.-B.S.; visualization, S.-Y.C.; supervision, C.-B.S.; project administration, C.-B.S. All authors have read and agreed to the published version of the manuscript.
Funding
This research was supported by the MSIT (Ministry of Science and ICT), Korea, under the ITRC (Information Technology Research Center) support program (IITP-2021-2016-0-00288) supervised by the IITP (Institute for Information & Communications Technology Planning & Evaluation).
Data Availability Statement
Not applicable.
Acknowledgments
The present research has been conducted by the Research Grant of Kwangwoon University in 2021.
Conflicts of Interest
The authors declare no conflict of interest.
References
- Neto, P. Demystifying cloud computing. Proc. Dr. Symp. Inform. Eng. 2011, 24, 16–21. [Google Scholar]
- Sorial, H.Z.; Lynch, W.E.; Vincent, A. Joint transcoding of multiple MPEG video bitstreams. In Proceedings of the 1999 IEEE International Symposium on Circuits and Systems (ISCAS), Orlando, FL, USA, 30 May–2 June 1999; IEEE: Piscataway, NJ, USA, 1999; Volume 4, pp. 251–254. [Google Scholar]
- Kim, H.S.; Nam, S.B.; Choi, S.G.; Kim, C.H.; Sung, T.T.K.; Sohn, C.B. HLS-based 360 VR using spatial segmented adaptive streaming. In Proceedings of the 2018 IEEE International Conference on Consumer Electronics (ICCE), Las Vegas, NV, USA, 12–14 January 2018; IEEE: Piscataway, NJ, USA, 2018; pp. 1–4. [Google Scholar]
- Jeong, J.; Jun, K. High resolution 360 degree video generation system using multiple cameras. J. Korea Multimed. Soc. 2016, 19, 1329–1336. [Google Scholar] [CrossRef][Green Version]
- Hosseini, M.; Swaminathan, V. Adaptive 360 VR video streaming based on MPEG-DASH SRD. In Proceedings of the 2016 IEEE International Symposium on Multimedia (ISM), San Jose, CA, USA, 11–13 December 2016; IEEE: Piscataway, NJ, USA, 2016; pp. 407–408. [Google Scholar]
- Corbillon, X.; Simon, G.; Devlic, A.; Chakareski, J. Viewport-adaptive navigable 360-degree video delivery. In Proceedings of the 2017 IEEE International Conference on Communications (ICC), Paris, France, 21–25 May 2017; IEEE: Piscataway, NJ, USA, 2017; pp. 1–7. [Google Scholar]
- Bao, W.; Zhang, X.; Chen, L.; Ding, L.; Gao, Z. High-order model and dynamic filtering for frame rate up-conversion. IEEE Trans. Image Process. 2018, 27, 3813–3826. [Google Scholar] [CrossRef] [PubMed]
- Castagno, R.; Haavisto, P.; Ramponi, G. A method for motion adaptive frame rate up-conversion. IEEE Trans. Circuits Sys. Video Technol. 1996, 6, 436–446. [Google Scholar] [CrossRef]
- Wu, J.; Yuen, C.; Cheung, N.M.; Chen, J.; Chen, C.W. Modeling and optimization of high frame rate video transmission over wireless networks. IEEE Trans. Wirel. Commun. 2015, 15, 2713–2726. [Google Scholar] [CrossRef]
- Bao, W.; Lai, W.S.; Zhang, X.; Gao, Z.; Yang, M.H. Memc-net: Motion estimation and motion compensation driven neural network for video interpolation and enhancement. IEEE Trans. Pattern Anal. Mach. Intell. 2019, 43, 933–948. [Google Scholar] [CrossRef] [PubMed]
- Bao, W.; Lai, W.S.; Ma, C.; Zhang, X.; Gao, Z.; Yang, M.H. Depth-aware video frame interpolation. In Proceedings of the IEEE/CVF Conference on Computer Vision and Pattern Recognition, Long Beach, CA, USA, 15–20 June 2019; pp. 3703–3712. [Google Scholar]
- Ledig, C.; Theis, L.; Huszár, F.; Caballero, J.; Cunningham, A.; Acosta, A.; Shi, W. Photo-realistic single image super-resolution using a generative adversarial network. In Proceedings of the IEEE Conference on Computer Vision and Pattern Recognition, Honolulu, HI, USA, 21–26 July 2017; pp. 4681–4690. [Google Scholar]
- Dong, C.; Loy, C.C.; He, K.; Tang, X. Image super-resolution using deep convolutional networks. IEEE Trans. Pattern Anal. Mach. Intell. 2015, 38, 295–307. [Google Scholar] [CrossRef] [PubMed]
- Van der Aalst, W.M.; Rubin, V.; Verbeek, H.M.W.; van Dongen, B.F.; Kindler, E.; Günther, C.W. Process mining: A two-step approach to balance between underfitting and overfitting. Softw. Syst. Modeling 2010, 9, 87–111. [Google Scholar] [CrossRef]
- Huang, J.B.; Singh, A.; Ahuja, N. Single image super-resolution from transformed self-exemplars. In Proceedings of the IEEE Conference on Computer Vision and Pattern Recognition, Boston, MA, USA, 7–12 June 2015; pp. 5197–5206. [Google Scholar]
- Kim, J.; Lee, J.K.; Lee, K.M. Deeply-recursive convolutional network for image super-resolution. In Proceedings of the IEEE Conference on Computer Vision and Pattern Recognition, Las Vegas, NV, USA, 27–30 June 2016; pp. 1637–1645. [Google Scholar]
- Shi, W.; Caballero, J.; Huszár, F.; Totz, J.; Aitken, A.P.; Bishop, R.; Wang, Z. Real-time single image and video super-resolution using an efficient sub-pixel convolutional neural network. In Proceedings of the IEEE Conference on Computer Vision and Pattern Recognition, Las Vegas, NV, USA, 27–30 June 2016; pp. 1874–1883. [Google Scholar]
- Agustsson, E.; Timofte, R. Ntire 2017 challenge on single image super-resolution: Dataset and study. In Proceedings of the IEEE Conference on Computer Vision and Pattern Recognition Workshops, Honolulu, HI, USA, 21–26 July 2017; pp. 126–135. [Google Scholar]


Publisher’s Note: MDPI stays neutral with regard to jurisdictional claims in published maps and institutional affiliations. |
© 2021 by the authors. Licensee MDPI, Basel, Switzerland. This article is an open access article distributed under the terms and conditions of the Creative Commons Attribution (CC BY) license (https://creativecommons.org/licenses/by/4.0/).