
Evaluating the Intertwined Relationships of the Drivers for University Technology Transfer


Department of International Business, Tamkang University, New Taipei City 251301, Taiwan
Appl. Sci. 2021, 11(20), 9668; https://doi.org/10.3390/app11209668
Submission received: 10 September 2021
/
Revised: 8 October 2021
/
Accepted: 14 October 2021
/
Published: 16 October 2021
Abstract
:Universities are the best places to gather knowledge and innovation, but the basis of technological development lies in talented R&D personnel who provide services to enterprise R&D activities, research institutions, and universities. Universities also gather many elites who cultivate talent for the country. However, universities do not have adequate technology transfer experience and do not network in industrial circles, which results in a huge gap between the concept and the practical result. This research determined the critical success factors and explored the causal relationships influencing the technology transfer from universities. We found that the main impact of the key factors was the technology market dimension. University technology transfer activities had to be classified as top priority. Technology industrial applicability was the main key evaluation factor, along with inventor attitude. In the organizational culture dimension, the attitude and ability of top management were the main evaluation factors. We attempted to draw upon our analysis results to make recommendations related to technology transfer to assist universities in successfully transferring their research results.
1. Introduction
Research partnerships between indigenous elders and university academics are an adaptive wildcard in a complex, emerging, and uncertain world. How entrepreneurs seize new opportunities and take risks increases the range of options available to the world as it navigates to a greener and fairer society. Today’s generation was built by a highly knowledge-based economy. Because of the relative restriction of resources, whether knowledge can be fully utilized has become a critical issue. The research and development results from universities are more forward-looking, belonging to the early technology development stage [1,2,3]. Generating research benefits for the market takes a long time. Universities are the best places to gather knowledge and innovation, but the basis of technological development lies in talented R&D personnel who provide services to enterprise R&D activities, research institutions, and universities [4,5]. Universities also gather many elites who cultivate talent for the country [6,7,8]. University R&D fees are 12% of the whole country’s R&D fees, which shows that universities accept responsibility for both national education and academic research. University expertise in developing vaccines and tests and the knowledge of epidemiologists, infectious disease scientists, and public health researchers who model global pandemics are essential to returning the world to work. However, it is the full range of academic expertise that will be useful in resetting the world after the virus is defeated. Historians can teach us the lessons of past pandemics; economists, sociologists, political scientists, ethicists, and others can inform us how to rebuild a better society; and scholars in the humanities can help to interpret and explain how the world has changed. University engineers will redesign safe transportation systems and workplaces, while psychologists will help to deal with the mental health consequences of self-isolation, to create new and safer behaviors, and to rebuild trust between governments and citizens, employers, and employees. Independent advice from universities will guide the ethical use of personal data for tracking and tracing people with this and future viruses.
However, universities do not have adequate technology transfer experience and do not network in industrial circles, leading to a huge gap between the concept and the practical result. Industrial circles are more likely to have the willingness for technology transfer, which the R&D personnel at universities do not. This is one of the reasons why it is difficult for universities to effectively transfer their R&D results [9,10]. Given the fact that the funds for research, including basic research, applied research, and technological development, have decreased, universities must take clear control of their resource input and output. The key point in distributing resources effectively is good output utilization.
Hence, in this research, we used DEMATEL to discuss the key factors for successful research result transfer and the connections between these two aspects [11,12]. We focused on the key factors influencing universities’ technology transfers and provide universities with effective solutions and suggestions to achieve effective research resource allocation and promote the transfer of R&D results to industrial circles. To increase the university technology transfer success rate, we have to understand the key factors and connections between every aspect of the university technology transfer process. This will enable professors’ R&D results to be popularized and utilized effectively.
2. Conceptual Background
Universities are the source of knowledge generation and the place for gathering knowledge and innovation [13,14,15], and with the rich output of academic research and development, the sources of Taiwan’s industrial technology transfer expand to every university in Taiwan. The primary purpose of technology transfer is to let the technology be allocated to the right places and make it bring the most beneficial result [16,17,18,19]. If a university’s R&D results can be effectively transformed into technology that industries need, society will benefit considerably [20,21]. Thus, the entity will bring forth new products and new services and new industries that create great benefits for society by stimulating economic activity. Universities play a role in the research and innovation on new technology development. The core issue in this study was to discuss how universities could make effective use of limited resources and complete academic R&D effectively [22,23,24,25].
Osabutey and Jin [18] defined technology transfer as a process derived from the transfer of academic research or franchised intellectual property to profit organizations for commercialization. Broad technology transfer differs according to the receivers and the purpose for which the receivers utilize technology skills to increase their productivity [26,27]. Thus, technology transfer encompasses a wide range of meaning and scope. Technology transfer enables the technology owner (supplier) and the technology demander (recipient) to mutually benefit. By signing technology transfer contracts or other types of contracts, technology owners provide technology recipients with skills, equipment, technical information, process information, or other information and services based on the contracts [28,29]. This enables the technology recipients to complete their skills to increase industry development and create profits [30,31,32]. Through technology transfer, technology recipients can decrease their investment in labor, material, and financial resources and, subsequently, save development time and avoid the loss of business opportunities [16,33]. Moreover, technology recipients are able to improve their technology skills and thus increase competitiveness and productivity. Suppliers receive authority and shoulder the associated fees and cost recovery through the technology transfer process. The commercialization process promotes and popularizes the development result and encourages suppliers to develop the new technology [34,35,36]. Hence, the actual benefits that universities gain from the technology transfer are not merely for society and the universities themselves but also for stimulating the industry and the universities to collaborate and further inspire more invention and creation [37,38,39]. This paper will discuss the factors that affect the technology transfer from the universities’ point of view. The following aspects will be discussed one by one.
2.1. Organizational Culture Aspect
Organizational culture is a type of belief, expectation, and value accumulated and formed through communication, sharing, and delivery among the organization members. Culture is also the norm accepted by all the members of the organization, including both employers and employees. Matinaro and Liu [40] mentioned that the key factor for successful R&D results is a relatively open organizational culture. Erhardt et al. [41] mentioned that universities encourage professors to start their own businesses and become entrepreneurs by investing resources. This is a new model and trend in technology transfer that is quite popular in foreign universities with a liberal culture [39,42,43]. Organizational culture will be discussed using the following three points: “top manager’s attitude and capacity”, “school identity and image”, and “entrepreneurship encouragement”.
- (1)
- Top Manager’s Attitude and Capacity
Top managers are the most valuable resources in an organization and a critical factor in organizational culture. Within any business and organization, an effective manager must also be a leader who can influence the dedication of the members in the organization to achieve the organizational goals. The greater their influence is, the better is their leadership effectiveness [44,45,46,47,48]. As senior managers are primary determinants of structure strategies and operations, the resources and the leadership behavior they present has a critical impact on overall operational performance [27]. Top managers can influence, lead, and motivate the members’ behavior by choosing different leadership styles with formal and informal structures. The attitude of top managers in universities is very important. The so-called attitude influences how other people feel about the behavior and meaning of it [49,50,51,52,53]. Thus, top managers should strengthen their management and decision-making efficiency to improve the scientific decision-making standard. Therefore, when allocating resources, they can share resources with everyone but prevent resources from being repeatedly input. This is the most effective way for universities to increase efficiency and decrease costs.
- (2)
- School Characteristics and Image
School characteristics include the educational style, educational behavior, and educational achievement recognized as unique and remarkable by society [54,55,56]. The school image is the objective comprehensive impression and evaluation from the public. It comes from the school’s interactions with society through the media [57,58,59]. The university image is not only a reflection of their organizational behavior (including every aspect, element, and condition) but also a projection of their academic level and educational quality [60,61]. A good university image is intangible wealth that can bring excellent reputation, enormous resources, and support from society.
- (3)
- Entrepreneurship Encouragement
Startups have become a way of describing the application of capitalists, maximizing capital, labor, and resources to generate economic value and balance supply and demand. They are a means to maintain the economic system and stimulate the economy through new business and technology. Malen and Marcus [62] mentioned that one of the important adjustments for university scientific R&D management is encouraging professors to engage in entrepreneurial activities related to scientific innovation [63,64,65]. Ruskovaara et al. [66] also mentioned that the university should encourage professors to have their own startups by investing in resources and introducing a professional reward system. In addition, Honjo [67] mentioned that universities should encourage professors and students to start businesses through technology transfers. If a university attaches importance to scientific innovation and entrepreneurship, the school’s effectiveness in technology development and transfer will increase [8,68]. “Academic capitalism” is now popular among the US academia. Scholars are engaging in business activities including setting up businesses and working as consultants [69]. Both domestically and abroad, professors are encouraged to have their own startups. However, compared with foreign countries, Taiwan is still in the early stages of this trend.
2.2. Organizational Structure and System Aspect
To increase effectiveness in response to the decrease in government resources, the university focuses on management efficiency and adopts privatization and commercialization strategies to determine the funding for higher education management, research, and teaching using market competition [8,70,71,72]. Through the implementation of these strategies, the corporate executive structure is motivated to pursue effectiveness and maximum output by rebuilding the organizational structure. The university system is the general term referring to the relations between the university and the external environment. It mainly includes the external system and the university’s own system. The external system involves the relations between the university, government, and society through a series of regulations, laws, and operational systems applied to maintain the university’s relationship with the external entities. The internal system involves internal management system regulations, operational systems, and organizational behavior. Zhang [73] mentioned that with organizational systems such as rewards and support from management, the university can succeed in granting R&D patents. Therefore, we will discuss the following points individually: “degree of academic freedom”, “internal incentive system”, and “connection with industry”.
- (1)
- Degree of Academic Freedom
Academic freedom means that scholars can perform academic research on the basis of their own willingness and without any restrictions. Academic freedom protects scholars from any unreasonable disturbance and limitation from both inside and outside the university. Academic freedom guarantees the individual’s fundamental rights and the university’s academic freedom [72,73]. The core of academic freedom is to ensure the freedom of academic activities including research activities, teaching, learning, academic speech, and academic action. The development of academic freedom helps academic exchange and generates new R&D by exchanging and integrating ideas from scholars from different research fields.
- (2)
- Internal Incentive System
Kopytova [74] believed that incentives are an intrinsic or extrinsic force that gives people enthusiasm to take actions to achieve a specific goal. However, Lee et al. [50] believed that incentives make employees in an organization work harder, inspire their inner power and willingness, and attempt to satisfy employees’ needs. Fang et al. [75] mentioned that technology developers are producers of intellectual property rights. In order to compel technology developers to acquire intellectual property rights for the organization, the organization should have a reward system to incentivize technology developers to create intellectual property rights. The most ideal motivations for university professors to participate in school affairs are their inner needs and inspiration. Therefore, a good use of the reward system or the incentive system would attract and incentivize university professors to attend to school affairs and further encourage the delivery of professional activities. Thus, for professors engaged in technology R&D or any associate who is dedicated to technology transfer of R&D results, the university should have an effective incentive system [27,76] that provides the motivation and incentive to increase university R&D transfers.
- (3)
- Connection with Industry
Industry–university cooperation is one of the most critical technology policies in many countries. Xiao et al. [77] mentioned that industry–university cooperation is a typical strategy for applying academic R&D results and patents. Industry–university cooperation has been studied in foreign countries for a long time already. Both the university and the industry can obtain huge benefits by cooperating with each other [39,78]. Industry–university cooperation is the combination of using the university’s existing equipment and research personnel and the industry’s needs to enable basic research and applied research to complement each other and accordingly generate economic benefits and increase the domestic R&D level. Industry–university cooperation also means that when the industry and the university cooperate with each other, academics are helped to implement leading, practical technology research. In contrast, enterprises are encouraged to participate in academic applied research [79].
2.3. Technology Inventor Aspect
People are the most significant resources in the organization. University professors have become a major and necessary part in the university’s internal organization, and they have the most authority over final decisions in university affairs. University professors are instructors, researchers, and inventors [80,81]. In the university organization, technology and the inventor have a close relationship. Technology or inventions are used mainly for teaching, technology R&D, and service. Lubango [82] mentioned that most researchers say that inventors tend to commercialize R&D results on the basis of their viewpoint, background, and experience. We will discuss the following points: “attitude of inventor”, “knowledge of inventor”, and “experience of inventor”.
- (1)
- Attitude of Inventor
Attitude is how other people feel about the behavior, and the meaning of the attitude shows a like or dislike for something. Positive or negative behavior towards the environment reflects a person’s subjective sense towards their surroundings. Besides the educational background, attitude is the overall expression of personality and experience. University professors are required to be highly self-disciplined and independent when working [53,65]. They must also have a strong sense of responsibility and duty towards academic development. To successfully apply R&D results, Breschi and Catalini [83] mentioned that inventors must pay considerable attention to the result conversion rate. Lubango [82] mentioned that those who are trained in the positive value of technology transfer are more likely to attend to commercialization activities. This reveals the importance of an individual’s thoughts, beliefs, and attitudes towards university R&D result transfer. Crilly [84] found that individual factors significantly affect the possibility of authorization, such as the inventor’s attitude towards the R&D results’ commercialization and the inventor’s willingness to patent and authorize commercial activities.
- (2)
- Knowledge of Inventor
Knowledge is a basic element of academic activities. Academic members’ common beliefs, values, and behavior are built on the pursuit of knowledge, and effectiveness in the pursuit of knowledge is the evaluation criterion for every academic activity [85,86]. In a university organization, professors are the owners, disseminators, and creators of knowledge. Professors are also the users of intellectual capital and the owners of the data required by the knowledge economy. University professors engage in specialized research fields, so besides the knowledge and ability relevant to their professions, they should have extensive industry knowledge [29]. For example, when contacting and cooperating with an industry, professors usually have problems with bargaining and dealing with enterprises [87,88,89]. To adapt to rapid technology development and the shorter renewal cycle of knowledge and technology, professors need to increase their knowledge and capability through continuous learning and be able to constantly renew the knowledge structure and overcome various challenges [90,91,92].
- (3)
- Inventor Experience
Experience is a complicated concept. It involves perception, emotion, and desire and is a key part of human activities. The personal experiences of people are their knowledge. The starting point of knowledge is the termination of knowledge at the same time [33]. Because of their experience, inventors are in contact with a large variety of people and things. They also have scruples and therefore limit themselves. The discussion in this study focused on inventors’ working experience (including industry), the experience of contacting industrial circles, and the experience of engaging in technology transfer. Koc and Bozdag [93] mentioned that what promotes university R&D result authorization is the different interactions between the inventor and the industry. Strumsky and Lobo [94] also mentioned that collaboration at the early stages of R&D between the professor and the industry facilitates the application and commercialization of the R&D results [51].
2.4. Essence of Technology Aspect
With the changes in industry, technology, and dissemination, the importance of intellectual property has increased. The protection of intellectual property rights has also become a critical issue for countries and international organizations. The patented R&D results help to generate effective technology transfer and to facilitate the operation and promotion of technology transfer [51]. Patent rights mean that inventors or creators can control the patents of objects on their own and have excludability [95]. Patent rights have to meet requirements in procedural standards and need to be examined by the Intellectual Property Office of the Ministry of Economic Affairs to check whether the patents meet the three essential requirements of “industrial applicability”, “novelty”, and “inventiveness”, which is also called “patentability”. After meeting the above requirements, the patents will finally receive approval through examination [16,96]. This study discussed the university R&D result applications for patents, i.e., whether the R&D results could meet the three requirements of patent law, receive protection through patent rights, and therefore facilitate technology transfer. This paper discusses the three points of “industrial applicability”, “novelty”, and “inventiveness”, which are the important elements of patents, according to the US patent guide.
- (1)
- Industrial Applicability
Industrial applicability, also known as utility and usefulness, is not expressly provided in patent law [97]. Padula et al. [95] mentioned that industrial applicability refers to inventions that can be utilized by the industry. The purpose of patent protection is to increase the technology level, and the protected patent must be available for industrial manufacturers and users. Hence, when the three essentials are under examination, industrial applicability is a priority over novelty and inventiveness. The authority in patent rights is not a reward for engaging in academic research but encouragement and protection for industrial technology research contributions. Consequently, any patent application for an invention should require the value that can be used by the industry and benefit industrial development [3,95].
- (2)
- Novelty
Lee et al. [24] mentioned that the simplest definition of novelty is something new that never existed before. The literal meaning of new is beginning or even the very beginning. Strumsky and Lobo [94] mentioned that novelty usually means to encourage inventors and creators to publicize their R&D results and not conceal them. Novelty depends on the overall comparison to prior art, and thus, the research completeness of prior art (Stand der Technik, SdT) would affect the novelty judgment, including the display or use of domestic and international patents, publications, and inventions or creations. Novelty is the core of the patent system and ensures that the patent system facilitates the generation of new works and improves upon existing works. The United States Supreme Court further stated, “It is necessary that novelty be based on the requirement of ‘promoting the practical skills’ from constitution”. If the inventors or creations do not have novelty, i.e., the public can simply use the inventors or creations, then there is no reason or necessity to provide inventors or creations with patent protections.
- (3)
- Inventiveness
Inventiveness was defined in the updated Art. 103 of US patent law in 1956 as well as Art. 22.2 of the Taiwan patent law as follows: “inventions cannot be patented if inventions in that specific field can be easily constructed by persons having ordinary skill with prior art” [95,96,97]. Prior art means all of the information known by the public without the restrictions of place, language, and form, such as written, digital, internet, or verbal form. Being easily accomplished means that a person having ordinary skill or creative ability can apply the patent with adaptation, replacement, alteration, or a combination of prior art and ordinary skill from the document citation [39]. The overall invention or creation that is obvious should be regarded as an easily accomplished invention or creation. Because of the monopolistic position and excludability of the patent rights in the market, people engaged in the industry related to the patent will be affected the most. Only those professions engaged in patent-associated occupations will clearly understand if the item meets the inventiveness requirement. Accordingly, the judgment standard for inventiveness should be set by persons having ordinary skill in the art.
Many scholars have engaged in extensive analysis and research on technology transfer. Some scholars apply mathematical software to analyze the efficiency of technology transfer and knowledge sharing. For example, Shafqat and Byun [14] and Shafqat et al. [13] respectively proposed the application of natural algorithms and deep learning methods to explore the efficiency of technology transfer. Shafqat and Byun [14] were to plan a dialect modeling-based neural network system utilized to foresee dialog patterns. Shafqat and Byun [14] recommended the integration of learning approaches with dialect modeling procedures and explored how arranging comments beside extending timelines can assist progress in forecast quality. Shafqat et al. [13] proposed a validity definition to extend proposals based on a cross-breed demonstration. Shafqat et al. [13] also proposed a model including four modules: project comments, a deep learning module, a credibility estimation module, and a recommendation module. The proposed approach employs LDA and LSTM as basic strategies for validity appraisal. Yeo et al. [50] proposed a layer-wise dense flow (LDF)-based knowledge transfer technique. Yeo et al. [50] attempted to apply a deep-learning innovation for information exchange that is vital to progress and optimizing effective information refining. Yeo [50] point to create a modern antagonistic optimization-based information exchange strategy including a layer-wise thick stream that is refined from a pre-trained, profound neural organization (DNN).
There are scholars who have used semi-structured interviews to understand the key factors of technology transfer. Abbas et al. [34] adopted semi-structured center interviews with college group pioneers and group individuals from three distinctive colleges: College of Science and Innovation of China (USTC), Anhui College (AHU), and Anhui Agrarian College (AHAU). Abbas et al. [34] conducted interviews of the colleges to inquire about groups who were chosen from the three colleges that had collaborated with the Chinese government to urge subsidizing and had effectively executed their investigative ventures. Abbas et al. [34] concluded that the college, as a center of information creation, must create superior college-based innovation exchange workplaces. The government can energize inquiries in colleges and districts by apportioning particular inquiries about awards for the era of modern information. Rey-Martí et al. [42] investigated the impact of these variables on trade estimates. Investigation utilizing fsQCA distinguished the variables that lead to work creation or a need thereof. The fsQCA strategy grasps complex causality. The examination of causal conditions uncovered a relationship between a social entrepreneur’s encounters and the receipt of money related to social undertakings because social ventures that receive budgetary support and have authors with social encounters create more occupations than those missing these qualities. These specialists in business enterprise approaches and support ought to advance and emphasize exercises and refinements that permit social business people to gain professional encounters instead of fair hypothetical or unique information. Hence, social business people can learn progressively and rapidly and proficiently utilize the information they pick up from working in their companies.
This research also reviewed past literature to understand the methods of case analysis and the skills and strategies of technology transfer and knowledge sharing. Franco and Pinho [37] distinguished shortcomings in participation between inquiries about centers and industry, and conceivable ways of tackling them. From the corporate point of view, the conditions set by analysts can be hypothetical and trivial when looking for markets and can be overcome if investigative centers’ groups incorporate firm representatives concerned more with refinements, to illuminate issues and distinguish advertising needs quickly. This closer relationship between colleges and industry would cure that shortcoming. Franco and Pinho (2019) recognized four measurements that impact participation between investigative centers. Both colleges and firms are generally consistent in recognizing the significance of information exchange, choice of collaborators, and financing to reap returns on participation. Philipson [37] proposed that the models behind the expanded complexity of technology transfer are: life cycles, lower coordinate generation costs, mental property, information exchange, and organized financial exchange.
It is understood from the above literature that technology transfer and knowledge sharing indeed play a very important and key role in the process of industrial upgrading and transformation. This research applies past research conclusions to summarize this research framework, and, through semi-structured interviews and the DEMATEL mathematical derivation model, to analyze the key factors of technology transfer. We hope that the integration of past research results and the conclusions of this research can improve the efficiency and performance of technology transfer. Because university R&D technology transfers involve multi-criteria problems, this study tried to understand the factors driving the technology transfer and the relation between every objective to further identify the key factors.
3. Research Method
We used the DEMATEL information analysis method to effectively integrate the knowledge of experts [98,99,100]. DEMATEL helped to develop a strategy by directly comparing the interrelationships of the key factors with the problem. The relations and the strength of influence among the key factors were obtained from the complex problems [101]. DEMATEL transformed the relations among the criteria into a clear structural model and dealt with a series of interrelations among the criteria. This paper discusses the key university technology transfer factors. However, because of the high complexity and the interrelations in the numerous factors, we had to allocate limited resources to the most critical key factors. All of the above was in line with the DEMATEL characteristics. Therefore, we adopted this analysis method to achieve the goal of this study.
3.1. DEMATEL Analysis Steps
The DEMATEL analysis steps are based on the research of scholars Büyüközkan and Güleryüz [102], Uygun et al. [103], etc. DEMATEL divides the analysis process into eight steps. A brief introduction is given below.
- (1)
- Define the quality factor characteristics and establish an evaluation scale
List and define the quality factors that affect the complicated system. The quality factors can be obtained through literature review, brainstorming, and expert opinions. The evaluation scale for causal relations and a pair-wise comparison of the quality factors is then constructed. In this study, we referred to the scale designed by Uygun et al. [103] and adopted 0, 1, 2, 3, and 4 as the five levels of measurement.
- (2)
- Obtain interdependent data for all factors using the expert opinion method
We obtained the data on the degree of influence of all the key factors for building the matrix through the expert opinion method. These pair-wise comparisons between any two factors are denoted by and are given an integer score of 0–4, representing “No influence (0)”, “Low influence (1)”, “Medium influence (2)”, “High influence (3)”, and “Very high influence (4)”, respectively. The matrix is called the initial direct-relation matrix of expert
- (3)
- Calculate the arithmetic mean matrix
This is also called the initial average matrix, which utilizes data from the collected questionnaire to calculate the arithmetic mean matrix. By separately adding up all the interrelated factors for every aspect and then averaging their sum, we obtained the arithmetic mean matrix. Assume that the number of factors is n, and the value is from professionals who judge the factors based on the 0, 1, 2, 3, 4 five-level evaluation scale: and (i = 1, 2, 3, …, n; j = 1, 2, 3, …, n) represent the influence degree of factor to factor . Then, sum up and average all from experts. The calculation formula is given below to calculate the arithmetic mean matrix.
The above-mentioned theoretical models contributed to our understanding of user acceptance factors. These studies examine a set of potentially relevant factors that drive consumer acceptance of MFS. Moreover, a research gap is evident regarding multi-criteria analysis of mobile payment acceptance and the development of an understanding of the cause–effect relationship of complex social science problems in fuzzy environments. This research proposes a DEMATEL and fuzzy theory as the main analytical tool. Below, we discuss the research method, namely, fuzzy DEMATEL, in detail.
- (4)
- Calculate direct/indirect matrix
The direct/indirect relation matrix and the total-relation matrix illustrate the interrelated impact on each factor; the formula is as below. The linear scale transformation is used to transform the criteria scale into comparable scales. The normalized direct-relation matrix can be obtained as .
- (5)
- Utilize the direct/indirect matrix
Let be the quality of the given y factor for the direct/indirect matrix , and i, j = 1, 2, …, n. Sum up the columns and the rows of the direct/indirect matrix ; the formula is given below. Here, di is the sum of column I, which means the sum of the quality factors, i being the cause of the impact on the other quality factors. It includes the direct and the indirect impact, which is the degree of the direct or the indirect impact on the other factors. Furthermore, is the sum of row j, which means the sum of the quality factor j is the result of being impacted by the other aspects. It includes the direct and the indirect impact, which is the degree of the direct or the indirect impact by the other factors.
Once the normalized direct-relation is obtained, the total-relation matrix can be calculated; it should be ensured that the convergence of . The total-relation matrix is shown as Equations (2) and (3).
Then, define as Prominence, and the equation i = j = 1, 2, 3, …, n is summed by using the totals from every column and row representing the degree of the quality factors being impacted by and impacting each other, which is also the relevance intensity among the factors. A causal diagram includes two axes—the Prominence axis and the Relation axis. The Prominence axis expresses importance of factors while the Relation axis expresses influence of factors. The vector of the Prominence is made by adding to . The Relation vector is made by subtracting from . Its content allows division of the criteria into the cause group and the effect group. When is positive, the criterion belongs to the cause group. Otherwise, the criterion belongs to the effect group. Therefore, the causal diagram can be acquired by mapping the dataset of the . Its components express the importance the criteria have. This shows the core level of the quality factor m in the problematics; the larger the value is, the higher is the interrelation level between the quality factor and the whole assessment factor. Define as the Relation summed up by the difference between the totals in the columns and rows representing the degree of difference, which is the intensity of the quality factors being impacted by and impacting each other. It also shows all of the causal relation degrees of the factor m in the problematics. If value is positive, then the quality factor tends to be the cause, but if it is negative, then the quality factor tends to be the result [104,105].
- (6)
- Causal Diagram
The causal diagram is depicted in two-dimensional graphics, where the total is the horizontal axis and the difference is the vertical axis. This graphic can simplify the complex causal relation into an easily understandable visual structure and therefore allow us to facilely conceive the idea of solving the problems. Next, divide the causal diagram into four quadrants with the divided lines. The divided line of the horizontal axis is the average of and that of the vertical axis is = (0.000). When is positive and located above the x axis, the quality factor m belongs to the type of cause, but if is negative and located below the x axis, the quality factor belongs to the type of result. Decision makers can adopt the best strategy to solve the problems through the location of the quality factor that is according to the type of the quality factor (cause or result) and the degree of quality factor being impacted and impacting [106].
3.2. Data Collection
The data collection method used in this study involved delivering questionnaires to professionals in the related industry and academia to gather and survey the information. By adopting DEMATEL to analyze the causal relation of each factor in the decision making, we could clarify the interrelation of the assessment factors when conducting technology transfer. This research topic is a complex and multi-factor theme. Therefore, this research not only involved reading traditional literature reviews to understand the strategic alliance factors but also applied the expert interview method. The expert interview method and the literature discussion were integrated into a driver for a university technology transfer evaluation framework. Then we continued to apply the DEMATEL expert questionnaire method, which solved and analyzed complex expert ideas. The research method in this article will continue to apply the DEMATEL research method, and the expert’s ideas can be deduced by scientific methods and mathematical models to obtain highly valuable and constructive research conclusions.
3.3. Structure of the Study
According to the discussion and the literature summary, this study categorized the factors involved in conducting technology transfer into four main aspects: organizational culture aspect, organizational structure and system aspect, technology inventor aspect, and essence of technology aspect. The organizational culture aspect was further divided into three factors: “top manager’s attitude and capacity”, “school identity and image”, and “encouragement for entrepreneurship”. The organizational structure and system aspect was divided into three factors: “degree of academic freedom”, “internal incentive system”, and “connection with industry”. The technology inventor aspect was divided into three factors: “attitude of inventor”, “knowledge of inventor”, and “experience of inventor”. The essence of technology aspect was divided into three factors “industrial applicability”, “novelty”, and “inventiveness”. This is shown in Figure 1.
4. Empirical Research and Discussion
The purpose of this study was to discuss the key factors for facilitating university technology transfer success and the interrelated structure of each aspect. Hence, this study used DEMATEL, and the period of questionnaire distribution was from 29 October 2014 to 23 November 2014, for a total of 26 days. We expected the professionals from either academic circles or industrial circles to have related knowledge and experience to provide the university with key factor assessment model measurements and professional suggestions for technology transfer. Thirty copies of the questionnaires were issued, and 22 copies were retrieved. Four of these 22 copies were omitted because of incomplete responses. Thus, after screening the questionnaires, the effective return rate was 18 copies. The questionnaire statistics collected from the professionals are shown in Table 1. This research was extremely professional and complex. Therefore, this research invited highly professional and practically experienced persons to participate. After obtaining the raw data for this research, careful mathematical derivation and calculation were required to obtain the most accurate research results. A significant amount of time was required to obtain the research data and publish the research. The research data are absolutely credible and correct.
4.1. Research Data Validation and Robustness
We constructed the assessment model using the literature review and interviews with specialists. In order to determine the suitable dimensions and criteria for each dimension, this research interviewed experts to screen for the suitable dimensions and criteria based on our literature review. This research then summarized and constructed an evaluation model with four dimensions and twelve criteria that are most suitable. In the sections that follow, this paper describes the organizations where experts are working and the interview themes that provide basic information, summarizes the experts’ main opinions about all themes, and then classifies these opinions into four categories that can be adopted as the structural framework for the subsequent questionnaire. In addition to replying to the questionnaire in constructing this evaluation and selection model, the experts also provided their professional knowledge and expertise.
4.2. Analysis of Direct and Indirect Impact of Main Aspects on University Technology Transfer
The main aspect was designed to identify the impact and the interrelations between the four aspects of organizational culture, organizational structure and system, technology inventor and essence of technology, and university technology transfer success. Furthermore, we screened out the key aspects. The direct/indirect main aspect matrix is shown in Table 2.
Table 2 shows that “essence of technology” was the key aspect that had the most impact on the other aspects, followed by “technology inventor” and “organizational culture”. However, the negative value of “organizational structure and system” was the largest, so it was impacted by the other aspects, which were the relative impacted aspects. “Essence of technology” was the driving factor for solving the core problems, so it was the first aspect that had to be considered when conducting the technology transfer. Using the value provided by the direct/indirect matrix main aspect, we performed the interrelation analysis of the main aspects, which was the interrelation impact on every aspect. The coordinate points for the above qualities of each aspect were input into the graph to complete the DEMATEL causal diagram, as shown in Figure 2.
To facilitate technology transfer success, the “essence of technology aspect” was the key aspect. The net effects of the main aspects were input into the causal main aspects diagram. The interrelation analysis diagram was then completed, as shown in Figure 2. From the interrelation analysis diagram, we observed the direction and the level of the interrelation impact between the aspects.
In addition to the causal diagram prominence and relation analysis, the direction of the arrow on the interrelation analysis diagram revealed the important management implication. “Essence of technology” impacted “organizational structure and system” (0.037) and “technology inventor” (0.002), but the level of impact on “technology inventor” was relatively low. “Technology inventor” impacted “organizational structure and system” (0.033); “organizational culture” impacted “technology inventor” (0.024) and “essence of technology” (0.006), but the level of impact on “essence of technology” was relatively low; and “organizational structure and system” was more likely to be impacted. For the university, “organizational structure and system” impacted “organizational culture” (0.025). As mentioned by Baykasoğlu & Gölcük [96], the purpose of the technology transfer is to transfer university R&D results to industry and to make university R&D activities more meaningful and thriving and robust. The saving of human and capital resources can help achieve the goal of accelerating the transfer of technology results for commercial use and integrate the academic circles and industrial circles. Every aspect in the process of transferring R&D results to industry, including the university resources input and the result output, is connected to each other. Therefore, the decision maker should investigate all aspects of the transfer activity and not merely a single aspect.
4.3. Analysis of Direct and Indirect Impact of Sub-Aspects of Organizational Culture on University Technology Transfer
From the organizational culture aspect, we will discuss the impact and interrelation between the three factors “top manager’s attitude and capacity”, “the identity and the image of school”, and “encouragement of entrepreneurship”, and the successful technology transfer in order to screen out the key factors. The direct/indirect matrix of sub-aspects of the organizational culture is shown in Table 3.
Within the decision-making assessment for the successful technology transfer, “top manager’s attitude and capacity” was the critical factor impacting other factors, followed by “school identity and image” (0.010), which only impacted a few other aspects. “Encouragement of entrepreneurship” was the factor being impacted. This showed that from the organizational culture aspect, “top manager’s attitude and capacity” was the key factor for solving the core problem, which was the first factor that had to be considered. We used the value provided by the direct/indirect matrix of organizational culture sub-aspects for the interrelation analysis of the organizational culture sub-aspects, which represented the interrelation of the impact on every factor.
From the DEMATEL causal diagram of the organizational culture sub-aspects, we observed that “top manager’s attitude and capacity” (0.037) and “school identity and image” (0.010) were located in the second quadrant, which was the driving factor area. Furthermore, the features had low prominence and high relation, which impacted a few other aspects. These were also of second priority in terms of the management resources to be used, and the room for them to improve and adjust was large. However, “entrepreneurship encouragement” was located in the fourth quadrant, which was the affected factor area. Its features were high prominence and low relation, which made it the factor that needed to be managed urgently but not directly. It was also the lowest priority for the management resources. In general, the management and the improvement factor were located in the second quadrant for receiving serial improvements. Hence, in order to facilitate university technology transfer success, “top manager’s attitude and capacity” was the critical impact factor. The net effects of the sub-aspects were placed into the sub-aspects causal diagram. The interrelation analysis diagram was then complete. Using the interrelation analysis diagram, we determined the direction and the level of the interrelation impact between the factors.
Figure 3 shows that “top manager’s attitude and capacity” impacted “encouragement of entrepreneurship” and “school identity and image”, and the impact intensity was 0.026 and 0.011, respectively. “School identity and image” was the second most impactful factor on the others. Moreover, obviously, “encouragement of entrepreneurship” was the factor impacted by the other two factors. In this analysis, “top manager’s attitude and capacity” was the only factor that positively impacted the other factors. Accordingly, it showed that in the organizational culture sub-aspects, “top manager’s attitude and capacity” was the key factor that impacted the other factors the most.
4.4. Analysis of Direct and Indirect Impact Organizational Structure and System Sub-Aspects in University Technology Transfer
From the organizational structure and system aspect, we will discuss the impact and the interrelation between the three factors “degree of academic freedom”, “internal incentive system”, and “connection with industry” and successful technology transfer. The direct/indirect matrix of the sub-aspects of the organizational structure and system is shown in Table 4.
From the above result, we concluded that from the organizational structure and system aspect, “connection with industry” was the key factor in solving the core problems, which was the first factor to be considered. The interrelation analysis of the organizational structure and system sub-aspects represented the relative impact relations between the aspects. The “internal incentive system” and “degree of academic freedom”, from the direct/indirect matrix of sub-aspects of organizational structure and system, the total value (−0.181) of “internal incentive system” impacting on “degree of academic freedom” subtracts the total value (−0.208) of “degree of academic freedom” impacting on “internal incentive system”. Accordingly, the interrelation analysis of “internal incentive system” towards “degree of academic freedom” was 0.027, which implied that the impact intensity of “internal incentive system” on “degree of academic freedom” was 0.027. To facilitate successful university technology transfers, “connection with industry” in the organizational structure and system aspect was the key impact factor. Figure 4 shows that the impact intensity of “connection with industry” impacting on “internal incentive system” and “degree of academic freedom” was 0.02 and 0.007, respectively. “Internal incentive system” was the second factor that impacted the other factors. Moreover, we could obviously infer that “degree of academic freedom” was the factor impacted by the other two factors. In this analysis, “connection with industry” was the only factor that positively impacted the other factors, showing that among the organizational structure and system sub-aspects, it was the key factor that impacted the other factors the most.
4.5. Analysis of Direct and Indirect Impact of Sub-Aspects of Technology Inventor on University Technology Transfer
From the technology inventor aspect, we will discuss the impact and interrelation between the three factors “attitude of inventor”, “knowledge of inventor”, and “experience of inventor” and successful technology transfer. The direct/indirect matrix of the sub-aspects of “technology inventor” is shown in Table 5.
“Attitude of inventor” was the key factor impacting the other factors. “Knowledge of inventor” had the largest negative value, followed by “experience of inventor”. The other two factors impacted “attitude of inventor” and were the factors being impacted. This showed that from the technology inventor aspect, “attitude of inventor” was the key factor for solving the core problems and was the factor to be considered first. The causal diagram of the technology inventor sub-aspects is shown in Figure 5. In this analysis, “attitude of inventor” was the only factor impacting the other factors positively, which implied that “attitude of inventor” was the key factor impacting the other factors from the technology inventor aspect.
4.6. Analysis of Direct and Indirect Impact of Essence of Technology Sub-Aspects on University Technology Transfer
With respect to the essence of technology aspect, we will discuss the impact and interrelation between the three factors “industrial applicability”, “novelty”, and “inventiveness” and successful technology transfer. The direct/indirect matrix of essence of technology sub-aspects is shown in Table 6. “Industrial applicability” and “inventiveness” were the major key factors impacting the other factors, and “novelty” was the factor being impacted. The causal diagram of the essence of technology sub-aspects is shown in Figure 6. This showed that from the essence of technology aspect, “industrial applicability” was the factor impacting the other factors and was the factor to be considered first. Practically, the abovementioned three factors are interrelated.
5. Conclusions and Remarks
This paper employed the DEMATEL method to analyze the model and considered suggestions as the key influencing drivers for university technology transfer evaluation model. Through this well-constructed DEMATEL approach, our research results show that a proper operations strategy and management of both resource usage and task arrangement in accordance with policy making will accomplish university technology transfer pattern evaluation planning strategy results. The university technology transfer factor evaluation model enabled universities to allocate technology development resources to key impact factors. This increased the university technology transfer success rate and made professors better able to promote the R&D result for effective utilization and to decrease the wastage of technology research resources. Research on how universities spend technology R&D expenditures and resources on the most critical factors of R&D technology continues to attract attention. This paper demonstrates an integrated multiple criteria decision making (MCDM) technique that is more appropriate for a university technology transfer evaluation model for Taiwan’s universities. We employed the Decision Making Trial and Evaluation Laboratory (DEMATEL) method to clarify the intertwined sub-criteria interrelationships in the complex structural hierarchy of a technology transfer pattern evaluation model. This paper proposes a novel hybrid method to cope with the various interdependence and feedback problems in the technology transfer problem. This proposed hybrid method can provide a better understanding of the interrelationship among the evaluation and selection dimensions and solve a complex interacting technology transfer pattern evaluation model that can enhance decision making quality.
On the basis of the present research, we suggested that the largest proportion of resource input be the “essence of technology” aspect, which could successfully develop the other aspects positively and facilitate the university technology transfer. With respect to the other key evaluation factors derived from “essence of technology”, we suggested that universities allocate the major resources to the R&D result with “industrial applicability”, which would be valuable for industrial use. “Industrial applicability” was the key impact factor for solving university technology transfer activities. The other factors would have serial improvements if “industrial applicability” were well managed and improved.
Both “technology inventor” and “organizational culture” had the features of driving factors, which could impact the other factors slightly. From the point of view of the 80/20 rule (Pareto Principle), we suggest that the proportion of management resources input to “technology inventor” and “organizational culture” be up to 80%. “Technology inventor” is the key factor that should be considered first. Additionally, we suggest that a university allocate most of its technology research resources to “attitude of inventor”, which has core impact showing the consent or dissent of inventors. The inventors’ decision is the key impact factor affecting whether the university will be able to transfer the R&D result or not. With respect to “organizational culture”, we suggest that “top manager’s attitude and capacity” be the priority of the technology research resource input. The messages (attitude, capacity, etc.) delivered by top managers will shape or affect the belief and the behavior of professors toward the R&D result transfer. This consequence also matches the research from previous scholars, which shows that professors play important roles in the university technology transfer.
The interaction of “organizational structure and system” with the other key aspects is low, which makes it an independent factor; therefore, we suggest that this aspect be managed alone. With respect to this aspect, the factor “connection with industry” is the most significant one and is the key impact factor for conducting university technology transfer. This agrees with the research from previous scholars; hence, we suggest that the university focus on the technology transfer fault model, which is the gap between academia and industry. Therefore, a bridge must be built between both sides to increase technology transfer success through industry–university collaboration. The university can assist and encourage professors to apply for R&D result patents. By utilizing the unit’s expertise, it provides professors with advice, curriculum, and conferences on the R&D patents; therefore, professors will have more knowledge about patents and thus be more willing to apply for one. This will also shorten the patent application process.
Professors are the inventors of R&D achievements, so whether R&D results are transferred or applied or not is ultimately their decision. Hence, in order to facilitate R&D achievement transfers, both the university and the industry should have a relationship built on mutual trust with professors so that they have the possibility of further negotiation. Through continuous communication and interaction, professors will have the will for technology transfer. The university can also present the curriculum or conferences related to technology transfer to deliver positive technology transfer information to professors, further increasing the possibility for technology transfer. If universities or industry can clarify the professors’ thoughts, it may effectively help the utilization of R&D achievements or patents. Messages from a university’s top managers are regarded as a norm that affects the professors’ behavior and their perceptions and attitude. Because top university managers are major decision makers, the university should shape, influence, or guide the professors’ beliefs and behavior in conducting R&D achievement transfer, creating a suitable environment for the professors. The university should help professors improve their technology transfer know-how and capability and develop the professors’ new potential. Top managers should have high self-efficacy, a positive attitude towards technology transfer, and provide considerable support toward achieving the goal (the success of technology transfer), thereby generating better management effectiveness and innovation. The quality of technology research directly affects the final R&D result; therefore, top managers should have excellent management and R&D abilities to help to improve communication and interaction with the professors. Because of the different perceptions of R&D between the university and industrial circles, the possibility for R&D achievements being directly used is low. Thus, the establishment of an industry–university cooperation platform will create a medium for interaction and information exchange. Through this platform, we can integrate academic theory and practical experience, and diminish the difference between theory and practice. This enables professors’ R&D directions and achievements to meet the needs of industry development and society as a whole. The university can also publish and promote R&D achievements. The university can plan to assign professors to businesses for advanced studies during the summer or winter break. By doing so, professors will become familiar with the development direction of the industry, the problems they are facing, and their actual needs. Further, they will build relationships with industry leaders and reinforce industry–university research cooperation. Hence, through the establishment of an industry–university cooperation platform, the university and the industry will develop a close relationship, facilitating the transfer of technology.
The results demonstrated that the “attitude of inventor” measurement’s impact is one of the foremost critical concerns. Within the commercial union, one sees that for conducting university technology transfers, as this implies holding or procuring particular competencies, in this manner they maximize their capacity to adjust to their environment. University technology transfer has become an important trend for complementing the national industrial upgrading strategy. We should try to cultivate more skilled and specialized inventors. Universities adapt to a competitive environment by looking for particular information, which can be obtained through permitting agreements, or by gaining organizational or specialized information from key inventors. To maximize the success rate of a technology transfer, the selecting inventors must assess each target enterprise’s financial situation based on a rigorous examination of the potential target ventures. Meanwhile, the selecting inventor ought to thoroughly investigate the target enterprise’s sales philosophy and the essential factors that influence their decisions.
The school identity and image have recently become a point of significant interest for university technology transfer. The identity and the image of a school is a vital intangible resource that empowers universities to establish connections. A university’s reputation influences whether industries choose it or not. As a result, reputation is especially vital for companies with overwhelmingly intangible assets. A great reputation is broadly expected to lead to much better representative recruitment/retention, more favorable assessments by reviewers and the media, superior connections with controlling offices, effective bartering apparatus with source/vendor/partner/distributor systems, and a more saleable brand.
Furthermore, the findings demonstrated that industrial applicability is a key factor for university technology transfer. In order for a company to extend its chance of achieving industrial applicability, it should quickly deliver its innovation or item, and should promote the generation of complementary merchandise.
These findings will support future research, as a useful reference for analysts to build university technology transfer strategy models.
This study hopes to develop drivers for university technology transfer to enable Taiwan’s universities and industries to cooperate and build strategic alliances to enhance their competitiveness and competitive advantage. The conclusions of this research are in line with the suggestions of industry experts. This research will also provide the research results to Taiwan’s Ministry of Economic Affairs and the Ministry of National Development for reference. We hope that when formulating strategic policies, they can provide the most efficient and fastest way for university technology transfers. We will continue to apply the research conclusions in the future. This research will conduct detailed and careful expert interview methods. We will continue to apply the research conclusions for in-depth interviews and conduct interviews with more government representatives, industry representatives, and academic representatives to help upgrade and rebuild the university technology transfer system.
In every university in Taiwan, intermediary agencies play an important role. Intermediary agencies handle the planning and implementation of technology transfers but the functionality of these intermediary agencies in the university setting is weak, so the overall effectiveness of technology transfers is comparatively low. Accordingly, we suggest that universities establish or reform the platforms or intermediary agencies in order to achieve smoother technology transfers and increase their success.
Although the subjects of this study were professionals from academia, industry, and research units, most of the subjects were from the academia. In future studies, we may include professionals from new fields or personnel who have experienced technology transfers. We will also consider conducting interviews and using other qualitative methods for the research in order to improve the accuracy of our research findings. Thus, we will be able to learn more about the key factors of university technology transfers. We also suggest that future research build different evaluation models of the key factors on the basis of the qualities of schools. This work can be divided into the categories of public university, private university, public technical college, private technical college, etc. The factors that affect university technology transfers are not limited to the variables mentioned in this study; therefore, we suggest that future research involve more methods such as interviews and look for more variables that may affect university technology transfers.
Similarly to any experimental investigation, this study has limitations. First, the observational information was collected from only one country. Various countries have striking contrasts within the utility of versatile installments and administrations. They have significant differences in drivers for university technology transfers. Thus, the findings may vary across countries. Second, the methodology of this study, namely, the fuzzy DEMATEL, also presents limitations in terms of the small sample size. Hence, future research can be conducted to test the adoption factors presented in this study using different methods and larger sample sizes.
Furthermore, this paper will provide a step by step methodology to evaluate the selection of drivers for university technology transfer evaluations. This selection problem can be considered as a multi-criteria decision making problem (MCDM); we developed a computer-based group decision support system, an integrated Analytic Network Process (ANP) and Vlse Kriterijumska Optimizacija Kompromisno Resenje (VIKOR) based methodology along with a mechanism for determining the fuzzy linguistic value of each attribute. The conclusions obtained in this research were provided to the experts who completed the questionnaire in this research for reference. After this research process, an expert symposium will be held to discuss the conclusions of this research. In this expert symposium, the experts will not only confirm the correctness of their research conclusions, but also hope to provide its research conclusions to relevant government units, so that those units can carefully refer to these research conclusions when formulating policies.
Funding
This research received no external funding.
Institutional Review Board Statement
Not applicable.
Informed Consent Statement
Not applicable.
Data Availability Statement
Not applicable.
Conflicts of Interest
The author declares no conflict of interest.
References
- Hansen, K.; Kim, J.J.; Suffian, S.; Mehta, K. Leveraging informal lending mechanisms to facilitate technology transfer and microenterprise in developing countries. Technol. Soc. 2015, 41, 65–75. [Google Scholar] [CrossRef]
- Winkelbach, A.; Walter, A. Complex technological knowledge and value creation in science-to-industry technology transfer projects: The moderating effect of absorptive capacity. Ind. Mark. Manag. 2015, 47, 98–108. [Google Scholar] [CrossRef]
- Soliman, A.F. The effect of leadership empowerment on technology transfer effectiveness: A proposed model: An applied study on the telecommunication companies in one of the developing countries. J. High Technol. Manag. Res. 2020, 31, 100371. [Google Scholar] [CrossRef]
- Kalar, B.; Antoncic, B. The entrepreneurial university, academic activities and technology and knowledge transfer in four European countries. Technovation 2015, 36–37, 1–11. [Google Scholar] [CrossRef]
- Simons, A. How does technology transfer affect backward linkages? A motivating example theoretical analysis. Econ. Model. 2014, 42, 94–105. [Google Scholar] [CrossRef]
- Newman, C.; Rand, J.; Talbot, T.; Tarp, F. Technology transfers, foreign investment and productivity spillovers. Eur. Econ. Rev. 2015, 76, 168–187. [Google Scholar] [CrossRef] [Green Version]
- Bozeman, B.; Rimes, H.; Youtie, J. The evolving state-of-the-art in technology transfer research: Revisiting the contingent effectiveness model. Res. Policy 2015, 44, 34–49. [Google Scholar] [CrossRef]
- Soares, T.J.; Torkomian, A.L.V.; SeidoNagano, M. University regulations, regional development and technology transfer: The case of Brazil. Technol. Forecast. Soc. Chang. 2020, 158, 120129. [Google Scholar] [CrossRef]
- O’Kane, C.; Mangematin, V.; Geoghegan, W.; Fitzgerald, C. University technology transfer offices: The search for identity to build legitimacy. Res. Policy 2015, 44, 421–437. [Google Scholar] [CrossRef] [Green Version]
- Blohmke, J. Technology complexity, technology transfer mechanisms and sustainable development. Energy Sustain. Dev. 2014, 23, 237–246. [Google Scholar] [CrossRef]
- Chen, Z.; Ming, X.; Zhou, T.; Chang, Y. Sustainable supplier selection for smart supply chain considering internal and external uncertainty: An integrated rough-fuzzy approach. Appl. Soft Comput. 2020, 87, 106004. [Google Scholar] [CrossRef]
- Pan, X.; Wang, Y. Evaluation of renewable energy sources in China using an interval type-2 fuzzy large-scale group risk evaluation method. Appl. Soft Comput. 2021, 108, 107458. [Google Scholar] [CrossRef]
- Shafqat, W.; Byun, Y.C.; Park, N. Effectiveness of Machine Learning Approaches Towards Credibility Assessment of Crowdfunding Projects for Reliable Recommendations. Appl. Sci. 2020, 10, 9062. [Google Scholar] [CrossRef]
- Shafqat, W.; Byun, Y.C. Topic predictions and optimized recommendation mechanism based on integrated topic modeling and deep neural networks in crowdfunding platforms. Appl. Sci. 2019, 9, 5496. [Google Scholar] [CrossRef] [Green Version]
- Chen, W.K.; Nalluri, V.; Hung, H.C.; Chang, M.C.; Lin, C.T. Apply DEMATEL to Analyzing Key Barriers to Implementing the Circular Economy: An Application for the Textile Sector. Appl. Sci. 2021, 11, 3335. [Google Scholar] [CrossRef]
- Osabutey, E.L.C.; Croucher, R. Intermediate institutions and technology transfer in developing countries: The case of the construction industry in Ghana. Technol. Forecast. Soc. Chang. 2018, 128, 154–163. [Google Scholar] [CrossRef] [Green Version]
- Osabutey, E.L.C.; Jackson, T. The impact on development of technology and knowledge transfer in Chinese MNEs in sub-Saharan Africa: The Ghanaian case. Technol. Forecast. Soc. Chang. 2019, 148, 119725. [Google Scholar] [CrossRef]
- Osabutey, E.L.C.; Jin, Z. Factors influencing technology and knowledge transfer: Configurational recipes for Sub-Saharan Africa. J. Bus. Res. 2016, 69, 5390–5395. [Google Scholar] [CrossRef] [Green Version]
- Scuotto, V.; Beatrice, O.; Valentina, C.; Nicotra, M.; Gioia, L.D.; Briamonte, M.F. Uncovering the micro-foundations of knowledge sharing in open innovation partnerships: An intention-based perspective of technology transfer. Technol. Forecast. Soc. Chang. 2020, 152, 119906. [Google Scholar] [CrossRef]
- Good, M.; Knockaert, M.; Soppe, B.; Wright, M. The technology transfer ecosystem in academia. An organizational design perspective. Technovation 2019, 82–83, 35–50. [Google Scholar] [CrossRef]
- Chege, S.M.; Wang, D.; Suntu, S.L.; Bishoge, O.K. Influence of technology transfer on performance and sustainability of standard gauge railway in developing countries. Technol. Soc. 2019, 56, 79–92. [Google Scholar] [CrossRef]
- Santacreu-Vasut, E.; Teshima, K. Foreign employees as channel for technology transfer: Evidence from MNC’s subsidiaries in Mexico. J. Dev. Econ. 2016, 122, 92–112. [Google Scholar] [CrossRef]
- Oh, C.; Matsuoka, S. Complementary approaches to discursive contestation on the effects of the IPR regime on technology transfer in the face of climate change. J. Clean. Prod. 2016, 128, 168–177. [Google Scholar] [CrossRef]
- Lee, J.C.; Shiue, Y.C.; Chen, C.Y. Examining the impacts of organizational culture and top management support of knowledge sharing on the success of software process improvement. Comput. Hum. Behav. 2016, 54, 462–474. [Google Scholar] [CrossRef]
- Lee, M.S.; Evans, B.T.; Stern, A.D.; Hornstein, M.D. Economic implications of the Society for Assisted Reproductive Technology embryo transfer guidelines: Healthcare dollars saved by reducing iatrogenic triplets. Fertil. Steril. 2016, 106, 189–195. [Google Scholar] [CrossRef] [Green Version]
- Majid, M.A.; Baharuddin, A.; Chang, L.W. Preventing intangible technology transfer (ITT) on the Internet and telecommunications for bioterrorism through Malaysia’s Strategic Trade Act 2010 (STA 2010). Comput. Law Secur. Rev. 2016, 32, 495–512. [Google Scholar] [CrossRef]
- Moortel, K.D.; Crispeels, T. International university-university technology transfer: Strategic management framework. Technol. Forecast. Soc. Chang. 2018, 135, 145–155. [Google Scholar] [CrossRef]
- Son, H.; Chung, Y.; Hwang, H. Do technology entrepreneurship and external relationships always promote technology transfer? Evidence from Korean public research organizations. Technovation 2019, 82–83, 1–15. [Google Scholar] [CrossRef]
- Sobotka, A.; Linczowski, K.; Radziejowska, A. Substitution of Material Solutions in the Operating Phase of a Building. Appl. Sci. 2021, 11, 2812. [Google Scholar] [CrossRef]
- Jun, Y.; Ji, I. Demand-pull Technology Transfer and Needs-articulation of Users: A Preliminary Study. Procedia Comput. Sci. 2016, 91, 287–295. [Google Scholar] [CrossRef] [Green Version]
- Iwasaki, I.; Tokunaga, M. Technology transfer and spillovers from FDI in transition economies: A meta-analysis. J. Comp. Econ. 2016, 44, 1086–1114. [Google Scholar] [CrossRef]
- Ungureanu, M.; Pop, N.; Ungureanu, N. Innovation and Technology Transfer for Business Development. Procedia Eng. 2016, 149, 95–500. [Google Scholar] [CrossRef] [Green Version]
- Botchie, D.; Sarpong, D.; Bi, J. A comparative study of appropriateness and mechanisms of hard and soft technologies transfer. Technol. Forecast. Soc. Chang. 2018, 131, 214–226. [Google Scholar] [CrossRef] [Green Version]
- Abbas, A.; Avdic, A.; Xiaobao, P.; Hasan, M.M.; Ming, W. University-government collaboration for the generation and commercialization of new knowledge for use in industry. J. Innov. Knowl. 2019, 4, 23–31. [Google Scholar] [CrossRef]
- Urban, F.; Zhou, Y.; Nordensvard, J.; Narain, A. Firm-level technology transfer and technology cooperation for wind energy between Europe, China and India: From North–South to South–North cooperation. Energy Sustain. Dev. 2015, 28, 29–40. [Google Scholar] [CrossRef]
- Prudhomme, D.; Zedtwitz, M. Managing “forced” technology transfer in emerging markets: The case of China. J. Int. Manag. 2019, 25, 100670. [Google Scholar] [CrossRef]
- Franco, M.; Pinho, C. A case study about cooperation between University Research Centres: Knowledge transfer perspective. J. Innov. Knowl. 2019, 4, 62–69. [Google Scholar] [CrossRef]
- Kumar, S.; Luthra, S.; Haleem, A.; Mangla, S.K.; Garg, D. Identification and evaluation of critical factors to technology transfer using AHP approach. Int. Strateg. Manag. Rev. 2015, 3, 24–42. [Google Scholar] [CrossRef] [Green Version]
- Belitski, M.; Aginskaja, A.; Marozau, R. Commercializing university research in transition economies: Technology transfer offices or direct industrial funding. Res. Policy 2019, 48, 601–615. [Google Scholar] [CrossRef]
- Matinaro, V.; Liu, Y. Towards increased innovativeness and sustainability through organizational culture: A case study of a Finnish construction business. J. Clean. Prod. 2017, 142, 3184–3193. [Google Scholar] [CrossRef]
- Erhardt, N.; Martin-Rios, C.; Heckscher, C. Am i doing the right thing? Unpacking workplace rituals as mechanisms for strong organizational culture. Int. J. Hosp. Manag. 2016, 59, 31–41. [Google Scholar] [CrossRef] [Green Version]
- Rey-Martí, A.; Ribeiro-Soriano, D.; Sánchez-García, J.L. Giving back to society: Job creation through social entrepreneurship. J. Bus. Res. 2016, 69, 2067–2072. [Google Scholar] [CrossRef]
- An, Y.; Kang, J. Relationship between Organizational Culture and Workplace Bullying among Korean Nurses. Asian Nurs. Res. 2016, 10, 234–239. [Google Scholar] [CrossRef] [PubMed] [Green Version]
- Lee, M.T.; Raschke, R.L.; Louis, R.S. Exploiting organizational culture: Configurations for value through knowledge worker’s motivation. J. Bus. Res. 2016, 69, 5442–5447. [Google Scholar] [CrossRef]
- Yu, Y.; Choi, Y. Stakeholder pressure and CSR adoption: The mediating role of organizational culture for Chinese companies. Soc. Sci. J. 2016, 53, 226–235. [Google Scholar] [CrossRef]
- Lu, V.N.; Plewa, C.; Ho, J. Managing governmental business relationships: The impact of organisational culture difference and compatibility. Australas. Mark. J. 2016, 24, 93–100. [Google Scholar] [CrossRef]
- Philipson, S. Sources of innovation: Consequences for knowledge production and transfer. J. Innov. Knowl. 2020, 5, 50–58. [Google Scholar] [CrossRef]
- Chumg, H.F.; Seaton, J.; Cooke, L.; Ding, W.Y. Factors affecting employees’ knowledge-sharing behaviour in the virtual organisation from the perspectives of well-being and organisational behaviour. Comput. Hum. Behav. 2016, 64, 432–448. [Google Scholar] [CrossRef] [Green Version]
- Chatman, J.A.; O’Reilly, C.A. Paradigm lost: Reinvigorating the study of organizational culture. Res. Organ. Behav. 2016, 36, 199–224. [Google Scholar] [CrossRef] [Green Version]
- Yeo, D.; Kim, M.S.; Bae, J.H. Adversarial Optimization-Based Knowledge Transfer of Layer-Wise Dense Flow for Image Classification. Appl. Sci. 2021, 11, 3720. [Google Scholar] [CrossRef]
- Chen, K.H.; Yien, J.M.; Chiang, C.H.; Tsai, P.C.; Tsai, F.S. Identifying Key Sources of City Air Quality: A Hybrid MCDM Model and Improvement Strategies. Appl. Sci. 2019, 9, 1414. [Google Scholar] [CrossRef] [Green Version]
- Valmohammadi, C.; Roshanzamir, S. The guidelines of improvement: Relations among organizational culture, TQM and performance. Int. J. Prod. Econ. 2015, 164, 167–178. [Google Scholar] [CrossRef]
- García-Vega, M.; Vicente-Chirivella, Ó. Do university technology transfers increase firms’ innovation. Eur. Econ. Rev. 2020, 123, 103388. [Google Scholar] [CrossRef]
- Belasen, A.R.; Kutan, A.M.; Belasen, A.T. The impact of unsuccessful pirate attacks on financial markets: Evidence in support of Leeson’s reputation-building theory. Econ. Model. 2017, 60, 344–351. [Google Scholar] [CrossRef]
- Bortolotti, T.; Boscari, S.; Danese, P. Successful lean implementation: Organizational culture and soft lean practices. Int. J. Prod. Econ. 2015, 160, 182–201. [Google Scholar] [CrossRef] [Green Version]
- Hemsley-Brown, J.; Melewar, T.C.; Nguyen, B.; Wilson, E.J. Exploring brand identity, meaning, image, and reputation (BIMIR) in higher education: A special section. J. Bus. Res. 2016, 69, 3019–3022. [Google Scholar] [CrossRef]
- Zhou, T.; Ding, S.; Fan, W.; Wang, H. An improved public goods game model with reputation effect on the spatial lattices. Chaos Solitons Fractals 2016, 93, 130–135. [Google Scholar] [CrossRef]
- Woods, C.L. When more than reputation is at risk: How two hospitals responded to Ebola. Public Relat. Rev. 2016, 42, 893–902. [Google Scholar] [CrossRef]
- Foroudi, P.; Jin, Z.; Gupta, S.; Melewar, T.C.; Foroudi, M.M. Influence of innovation capability and customer experience on reputation and loyalty. J. Bus. Res. 2016, 69, 4882–4889. [Google Scholar] [CrossRef] [Green Version]
- Agostini, L.; Nosella, A. The central role of a company’s technological reputation in enhancing customer performance in the B2B context of SMEs. J. Eng. Technol. 2016, 42, 1–14. [Google Scholar] [CrossRef]
- Krishnan, C.N.V.; Partnoy, F.; Thomas, R.S. The second wave of hedge fund activism: The importance of reputation, clout, and expertise. J. Corp. Financ. 2016, 40, 296–314. [Google Scholar] [CrossRef]
- Malen, J.; Marcus, A.A. Promoting clean energy technology entrepreneurship: The role of external context. Energy Policy 2017, 102, 7–15. [Google Scholar] [CrossRef]
- Walter, S.G.; Block, J.H. Outcomes of entrepreneurship education: An institutional perspective. J. Bus. Ventur. 2016, 31, 216–233. [Google Scholar] [CrossRef] [Green Version]
- Ji, Y.; Qi, L.; Liu, Y.; Liu, X.; Li, H.X.; Li, Y. Assessing and Prioritising Delay Factors of Prefabricated Concrete Building Projects in China. Appl. Sci. 2018, 8, 2324. [Google Scholar] [CrossRef] [Green Version]
- Huh, S.M.; Kim, W.-J. The Derivation of Defect Priorities and Core Defects through Impact Relationship Analysis between Embedded Software Defects. Appl. Sci. 2020, 10, 6946. [Google Scholar] [CrossRef]
- Ruskovaara, E.; Hämäläinen, M.; Pihkala, T. HEAD teachers managing entrepreneurship education-Empirical evidence from general education. Teach. Teach. Educ. 2016, 55, 155–164. [Google Scholar] [CrossRef]
- Honjo, Y. Why are entrepreneurship levels so low in Japan. Jpn. World Econ. 2015, 36, 88–101. [Google Scholar] [CrossRef]
- Jolly, S.; Raven, R.P.J.M. Collective institutional entrepreneurship and contestations in wind energy in India. Renew. Sustain. Energy Rev. 2015, 42, 999–1011. [Google Scholar] [CrossRef] [Green Version]
- Zampetakis, L.A.; Lerakis, M.; Kafetsios, K.; Moustakis, V. Investigating the emotional impact of entrepreneurship programs. J. Bus. Ventur. Insights 2015, 4, 38–41. [Google Scholar] [CrossRef]
- Yuh, J.Y.; Cheng, C.M. Construction of a manipulator with six degrees of freedom and a rotary platform differentially pumped via retractable welded bellows. Vacuum 2015, 121, 283–288. [Google Scholar] [CrossRef]
- Xing, C.; Zhou, C. A singular planar element with rotational degree of freedom for fracture analysis. Theor. Appl. Fract. Mech. 2016, 86, 239–249. [Google Scholar] [CrossRef]
- Angulo-Guerrero, M.J.; Pérez-Moreno, S.; Abad-Guerrero, I.M. How economic freedom affects opportunity and necessity entrepreneurship in the OECD countries. J. Bus. Res. 2017, 73, 30–37. [Google Scholar] [CrossRef]
- Zhang, J.T. An approximate degrees of freedom test for heteroscedastic two-way ANOVA. J. Stat. Plan. Inference 2012, 142, 336–346. [Google Scholar] [CrossRef]
- Kopytova, A. Development of the Implementation Procedure for a Rational Incentive System. Procedia Eng. 2016, 165, 1132–1140. [Google Scholar] [CrossRef]
- Fang, D.; Holmén, M.; Kleinlercher, D.; Kirchler, M. How tournament incentives affect asset markets: A comparison between winner-take-all tournaments and elimination contests. J. Econ. Dyn. Control 2017, 75, 1–27. [Google Scholar] [CrossRef]
- Ibanez-Lopez, A.S.; Martinez-Val, J.M.; Moratilla-Soria, B.Y. A dynamic simulation model for assessing the overall impact of incentive policies on power system reliability, costs and environment. Energy Policy 2017, 102, 170–188. [Google Scholar] [CrossRef]
- Xiao, J.; Ding, T.; Zhang, Q. Structural behavior of a new moment-resisting DfD concrete connection. Eng. Struct. 2017, 132, 1–13. [Google Scholar] [CrossRef]
- Liu, Q.; Luo, J.; Tian, G.G. Managerial professional connections versus political connections: Evidence from firms’ access to informal financing resources. J. Corp. Financ. 2016, 41, 179–200. [Google Scholar] [CrossRef]
- Bao, X.; Johan, S.; Kutsuna, K. Do political connections matter in accessing capital markets? Evidence from China. Emerg. Mark. Rev. 2016, 29, 24–41. [Google Scholar] [CrossRef]
- Boyack, K.W.; Klavans, R. Measuring science-technology interaction using rare inventor-author names. J. Informetr. 2008, 2, 173–182. [Google Scholar] [CrossRef]
- Xue, X.; Ma, X.; Jiang, M.; Gao, Y.; Park, S.W. The Construction of an Intelligent Risk-Prevention System for Marine Silk Road. Appl. Sci. 2020, 10, 5044. [Google Scholar] [CrossRef]
- Lubango, L.M. The effect of co-inventors’ reputation and network ties on the diffusion of scientific and technical knowledge from academia to industry in South Africa. World Pat. Inf. 2015, 43, 5–11. [Google Scholar] [CrossRef]
- Breschi, S.; Catalini, C. Tracing the links between science and technology: An exploratory analysis of scientists’ and inventors’ networks. Res. Policy 2010, 39, 14–26. [Google Scholar] [CrossRef]
- Tsai, J.F.; Wang, C.P.; Lin, M.H.; Huang, S.-W. Analysis of Key Factors for Supplier Selection in Taiwan’s Thin-Film Transistor Liquid-Crystal Displays Industry. Mathematics 2021, 9, 396. [Google Scholar] [CrossRef]
- Kang, B.; Motohashi, K. Essential intellectual property rights and inventors’ involvement in standardization. Res. Policy 2015, 44, 483–492. [Google Scholar] [CrossRef]
- Xiang, X.Y.; Cai, H.; Lam, S.; Pei, Y.L. International knowledge spillover through co-inventors: An empirical study using Chinese assignees’ patent data. Technol. Forecast. Soc. Chang. 2013, 80, 161–174. [Google Scholar] [CrossRef]
- Crescenzi, R.; Nathan, M.; Rodríguez-Pose, A. Do inventors talk to strangers? On proximity and collaborative knowledge creation. Res. Policy 2016, 45, 177–194. [Google Scholar] [CrossRef]
- Melero, E.; Palomeras, N. The Renaissance Man is not dead! The role of generalists in teams of inventors. Res. Policy 2015, 44, 154–167. [Google Scholar] [CrossRef]
- Drivas, K.; Economidou, C.; Karkalakos, S.; Tsionas, E.G. Mobility of knowledge and local innovation activity. Eur. Econ. Rev. 2016, 85, 39–61. [Google Scholar] [CrossRef] [Green Version]
- Dornbusch, F.; Neuhäusler, P. Composition of inventor teams and technological progress- The role of collaboration between academia and industry. Res. Policy 2015, 44, 1360–1375. [Google Scholar] [CrossRef]
- Chen, W.-K.; Lin, C.-T. Interrelationship among CE Adoption Obstacles of Supply Chain in the Textile Sector: Based on the DEMATEL-ISM Approach. Mathematics 2021, 9, 1425. [Google Scholar] [CrossRef]
- Schettino, F.; Sterlacchini, A.; Venturini, F. Inventive productivity and patent quality: Evidence from Italian inventors. J. Policy Model. 2013, 35, 1043–1056. [Google Scholar] [CrossRef] [Green Version]
- Koc, T.; Bozdag, E. Measuring the degree of novelty of innovation based on Porter’s value chain approach. Eur. J. Oper. Res. 2017, 257, 559–567. [Google Scholar] [CrossRef]
- Strumsky, D.; Lobo, J. Identifying the sources of technological novelty in the process of invention. Res. Policy 2015, 44, 1445–1461. [Google Scholar] [CrossRef] [Green Version]
- Padula, G.; Novelli, E.; Conti, R. SMEs inventive performance and profitability in the markets for technology. Technovation 2015, 41–42, 38–50. [Google Scholar] [CrossRef] [Green Version]
- Baykasoğlu, A.; Gölcük, İ. Development of an interval type-2 fuzzy sets based hierarchical MADM model by combining DEMATEL and TOPSIS. Expert Syst. Appl. 2017, 70, 37–51. [Google Scholar] [CrossRef]
- Chinkatham, T.; Cavallucci, D. Early feasibility evaluation of Solution Concepts in an Inventive Design Method Framework: Approach and support tool. Comput. Ind. 2015, 67, 1–16. [Google Scholar] [CrossRef]
- Mansoor, M.; Mariun, N.; AbdulWahab, N.I. Innovating problem solving for sustainable green roofs: Potential usage of TRIZ -Theory of inventive problem solving. Ecol. Eng. 2017, 99, 209–221. [Google Scholar] [CrossRef]
- Li, H.; Wang, W.; Fan, L.; Li, Q.; Chen, X. A novel hybrid MCDM model for machine tool selection using fuzzy DEMATEL, entropy weighting and later defuzzification VIKOR. Appl. Soft Comput. 2020, 91, 106207. [Google Scholar] [CrossRef]
- Zhang, M.C.; Zhu, B.W.; Huang, C.M.; Tzeng, G.H. Systematic Evaluation Model for Developing Sustainable World-Class Universities: An East Asian Perspective. Mathematics 2021, 9, 837. [Google Scholar] [CrossRef]
- Jiang, S.; Shi, H.; Lin, W.; Liu, H.C. A large group linguistic Z-DEMATEL approach for identifying key performance indicators in hospital performance management. Appl. Soft Comput. 2020, 86, 105900. [Google Scholar] [CrossRef]
- Büyüközkan, G.; Güleryüz, S. An integrated DEMATEL-ANP approach for renewable energy resources selection in Turkey. Int. J. Prod. Econ. 2016, 182, 435–448. [Google Scholar] [CrossRef]
- Uygun, Ö.; Kaçamak, H.; Kahraman, Ü.A. An integrated DEMATEL and Fuzzy ANP techniques for evaluation and selection of outsourcing provider for a telecommunication company. Comput. Ind. Eng. 2015, 86, 137–146. [Google Scholar] [CrossRef]
- Gölcük, İ.; Baykasoğlu, A. An analysis of DEMATEL approaches for criteria interaction handling within ANP. Expert Syst. Appl. 2016, 46, 346–366. [Google Scholar] [CrossRef]
- Luthra, S.; Govindan, K.; Kharb, R.K.; Mangla, S.K. Evaluating the enablers in solar power developments in the current scenario using fuzzy DEMATEL: An Indian perspective. Renew. Sustain. Energy Rev. 2016, 63, 379–397. [Google Scholar] [CrossRef]
- Jeng, D.J.F. Generating a causal model of supply chain collaboration using the fuzzy DEMATEL technique. Comput. Ind. Eng. 2015, 87, 283–295. [Google Scholar] [CrossRef]
Figure 1.
Research Framework.
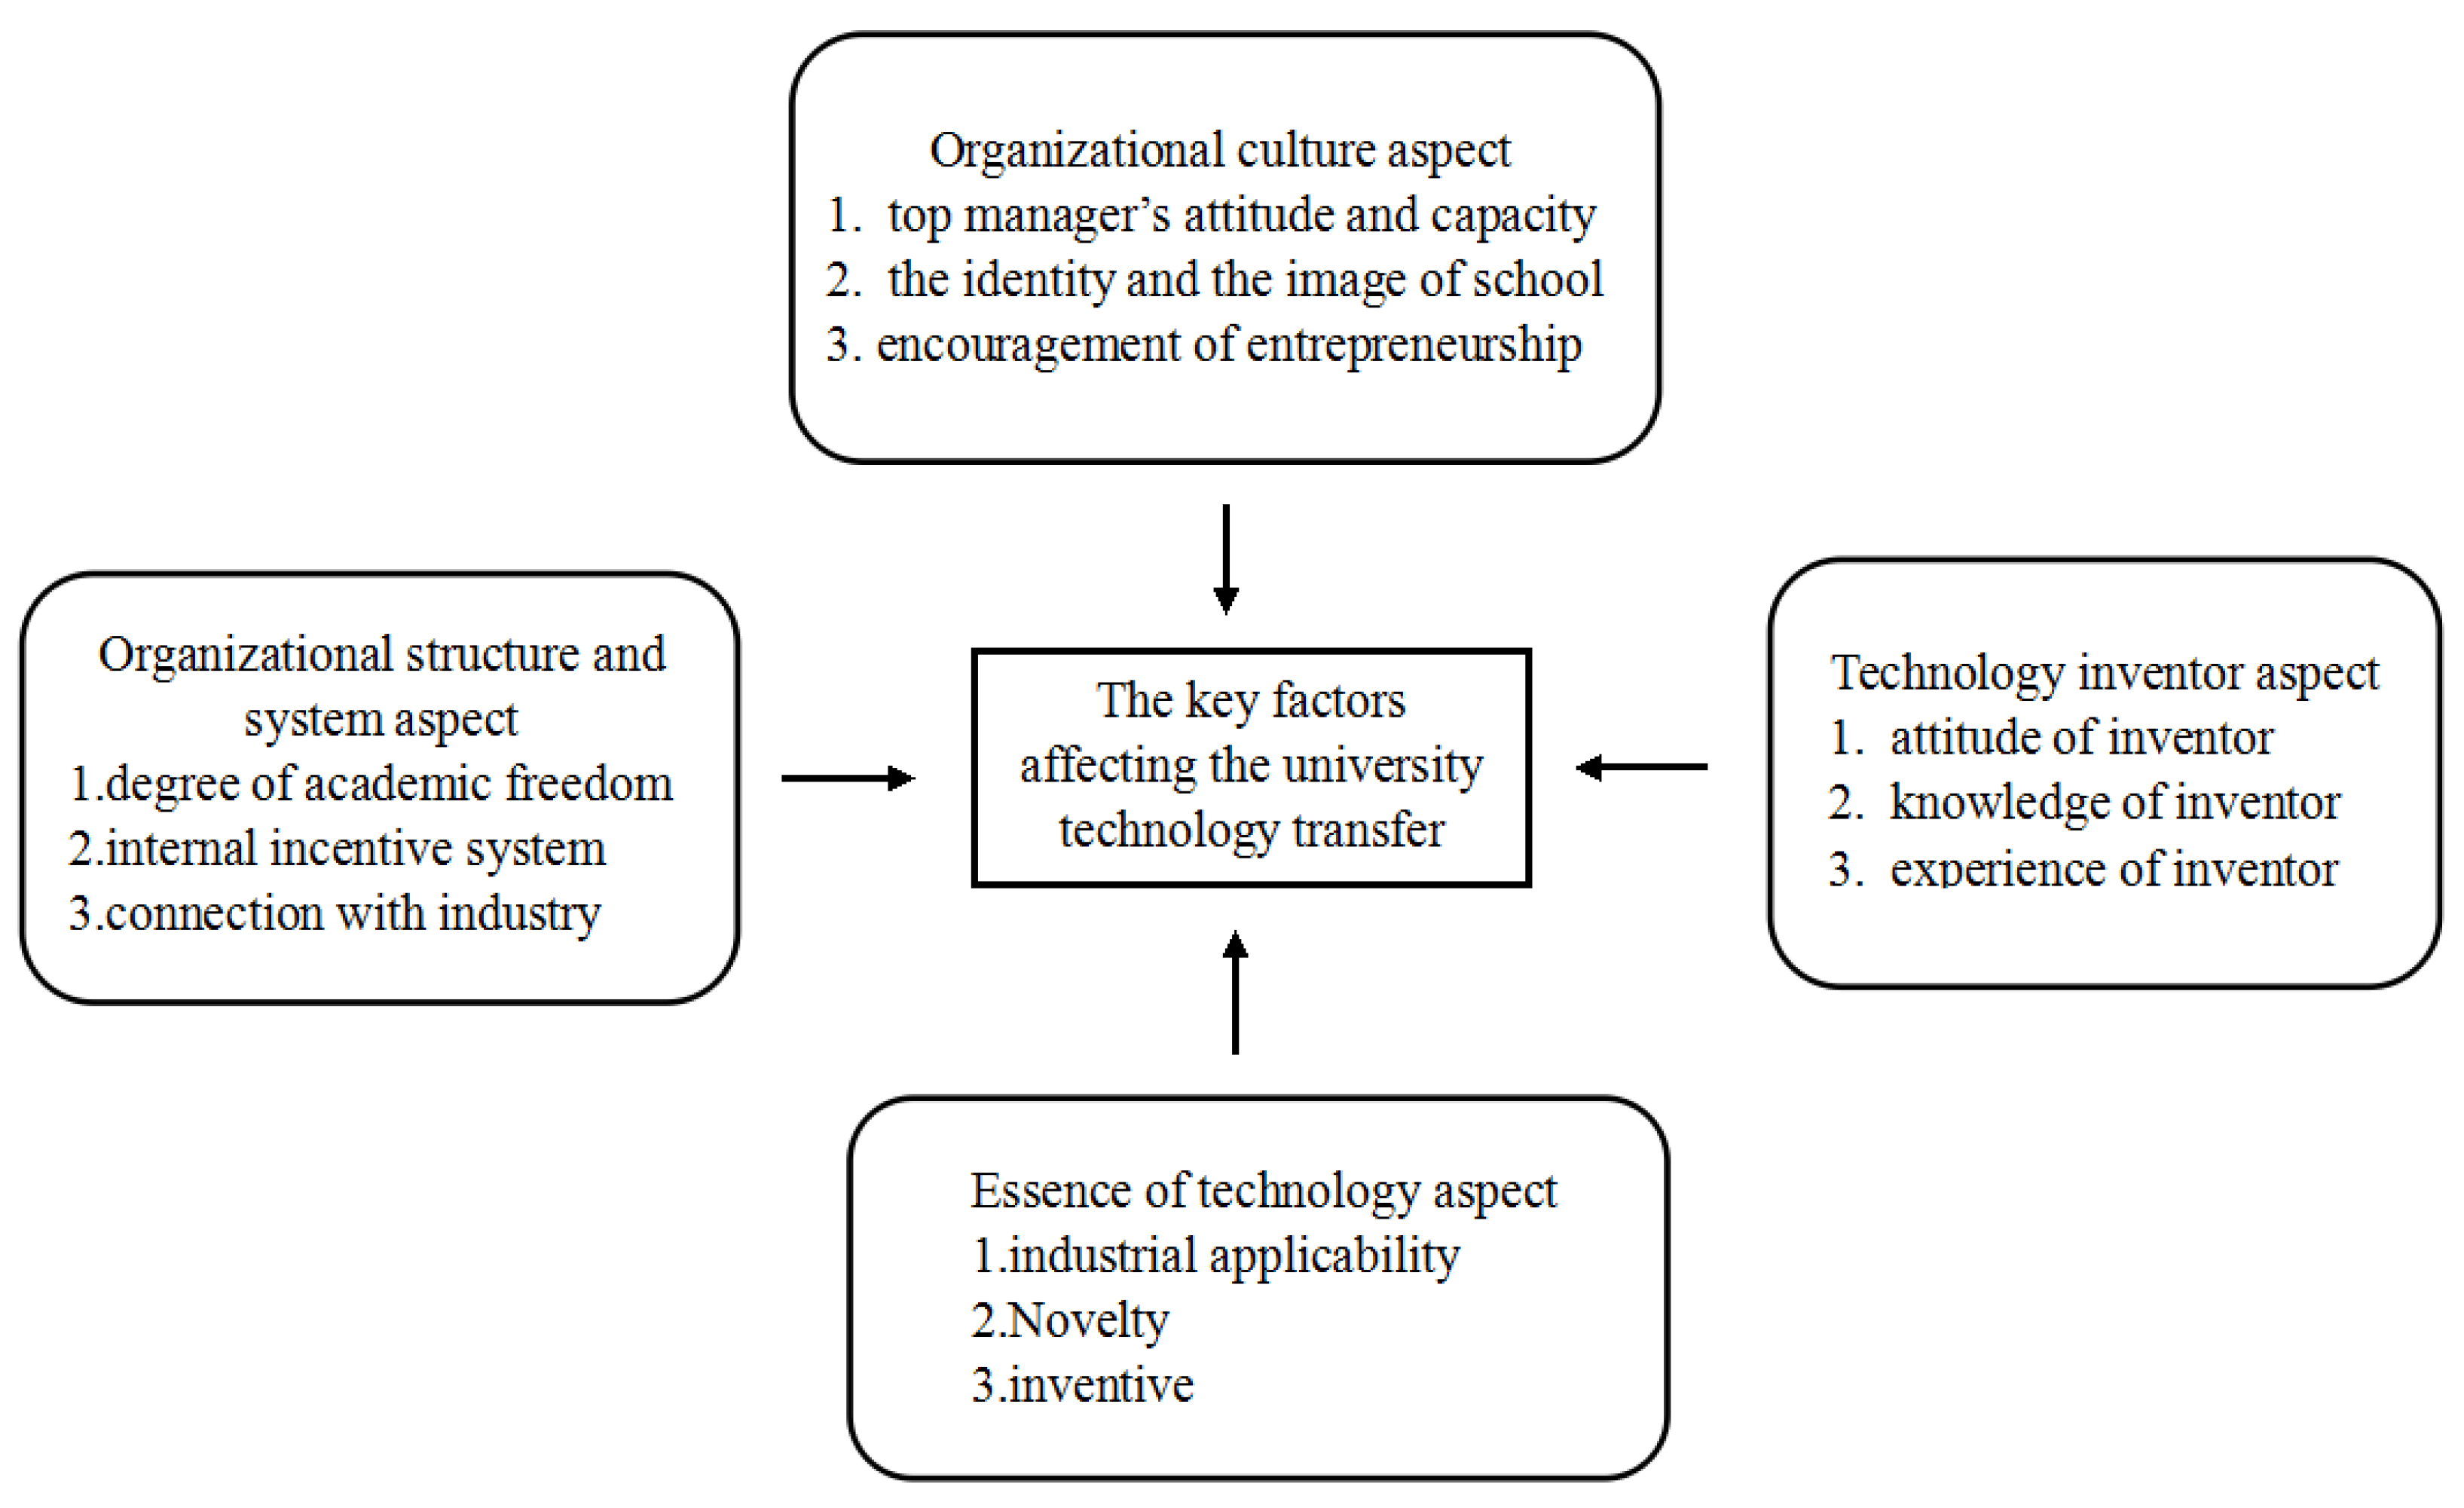
Figure 2.
Causal diagram of main aspects.
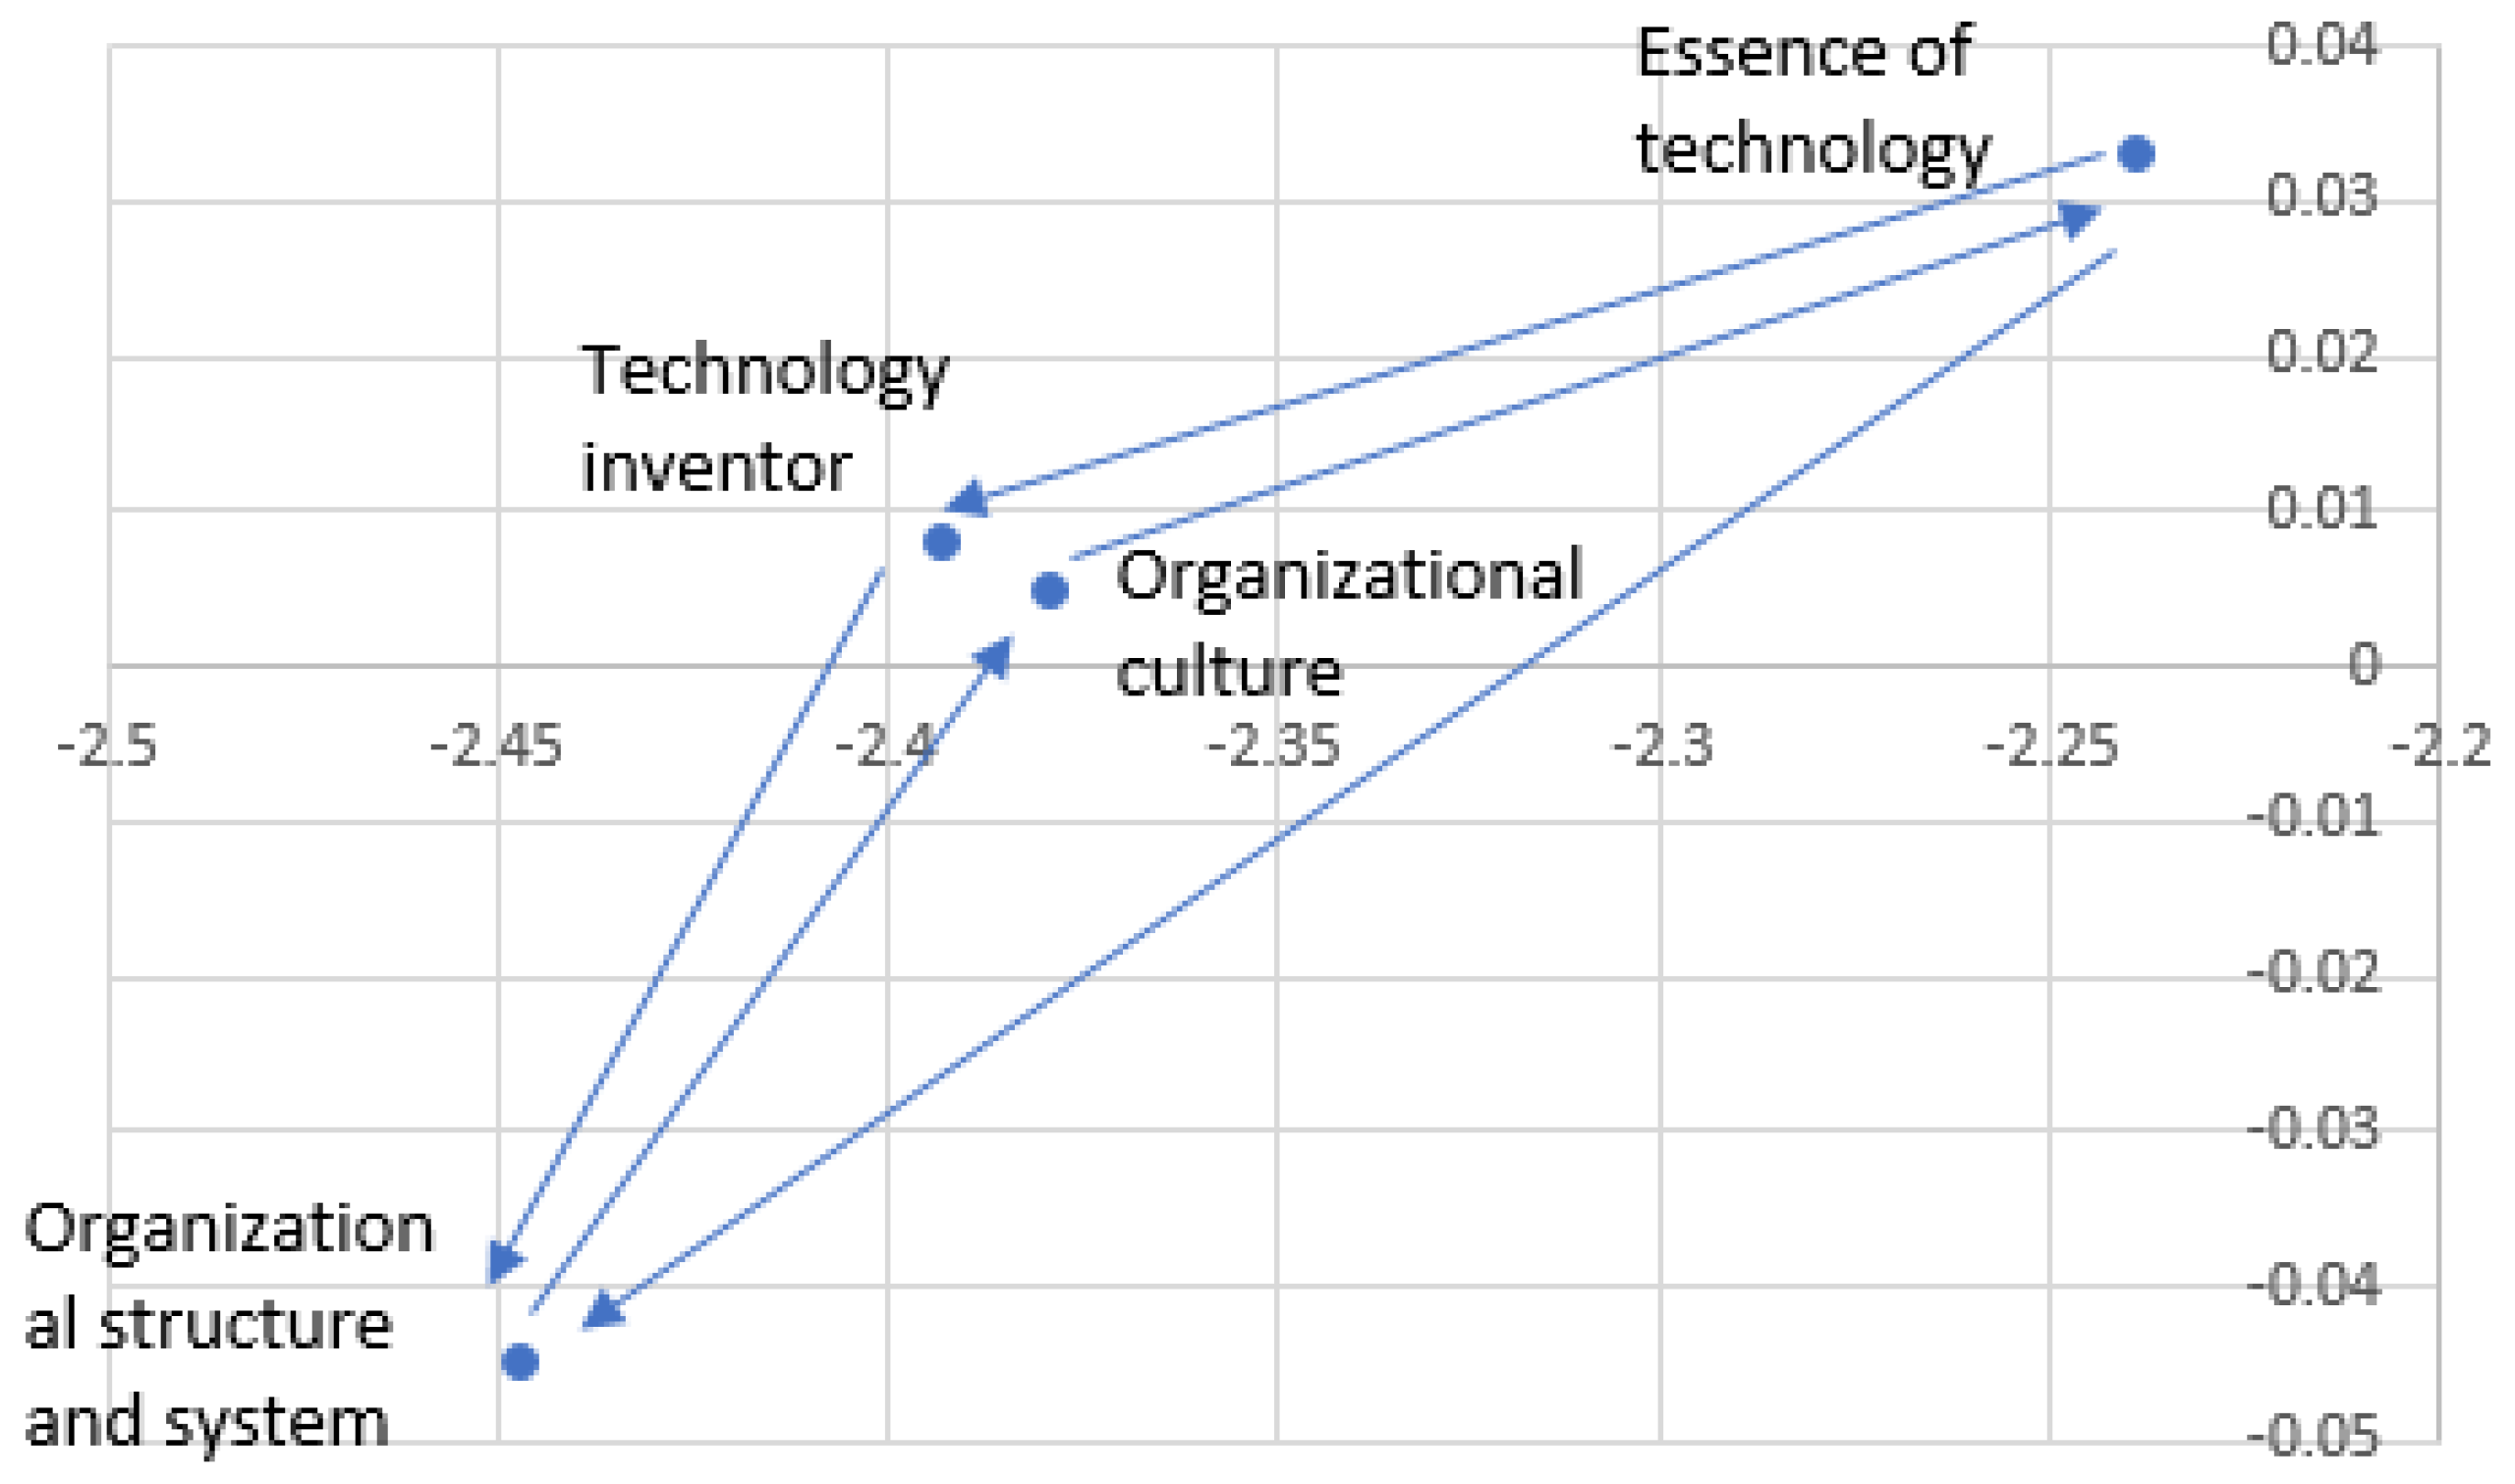
Figure 3.
Causal diagram of sub-aspects of organizational culture.

Figure 4.
Causal diagram of sub-aspects of organizational structure and system.
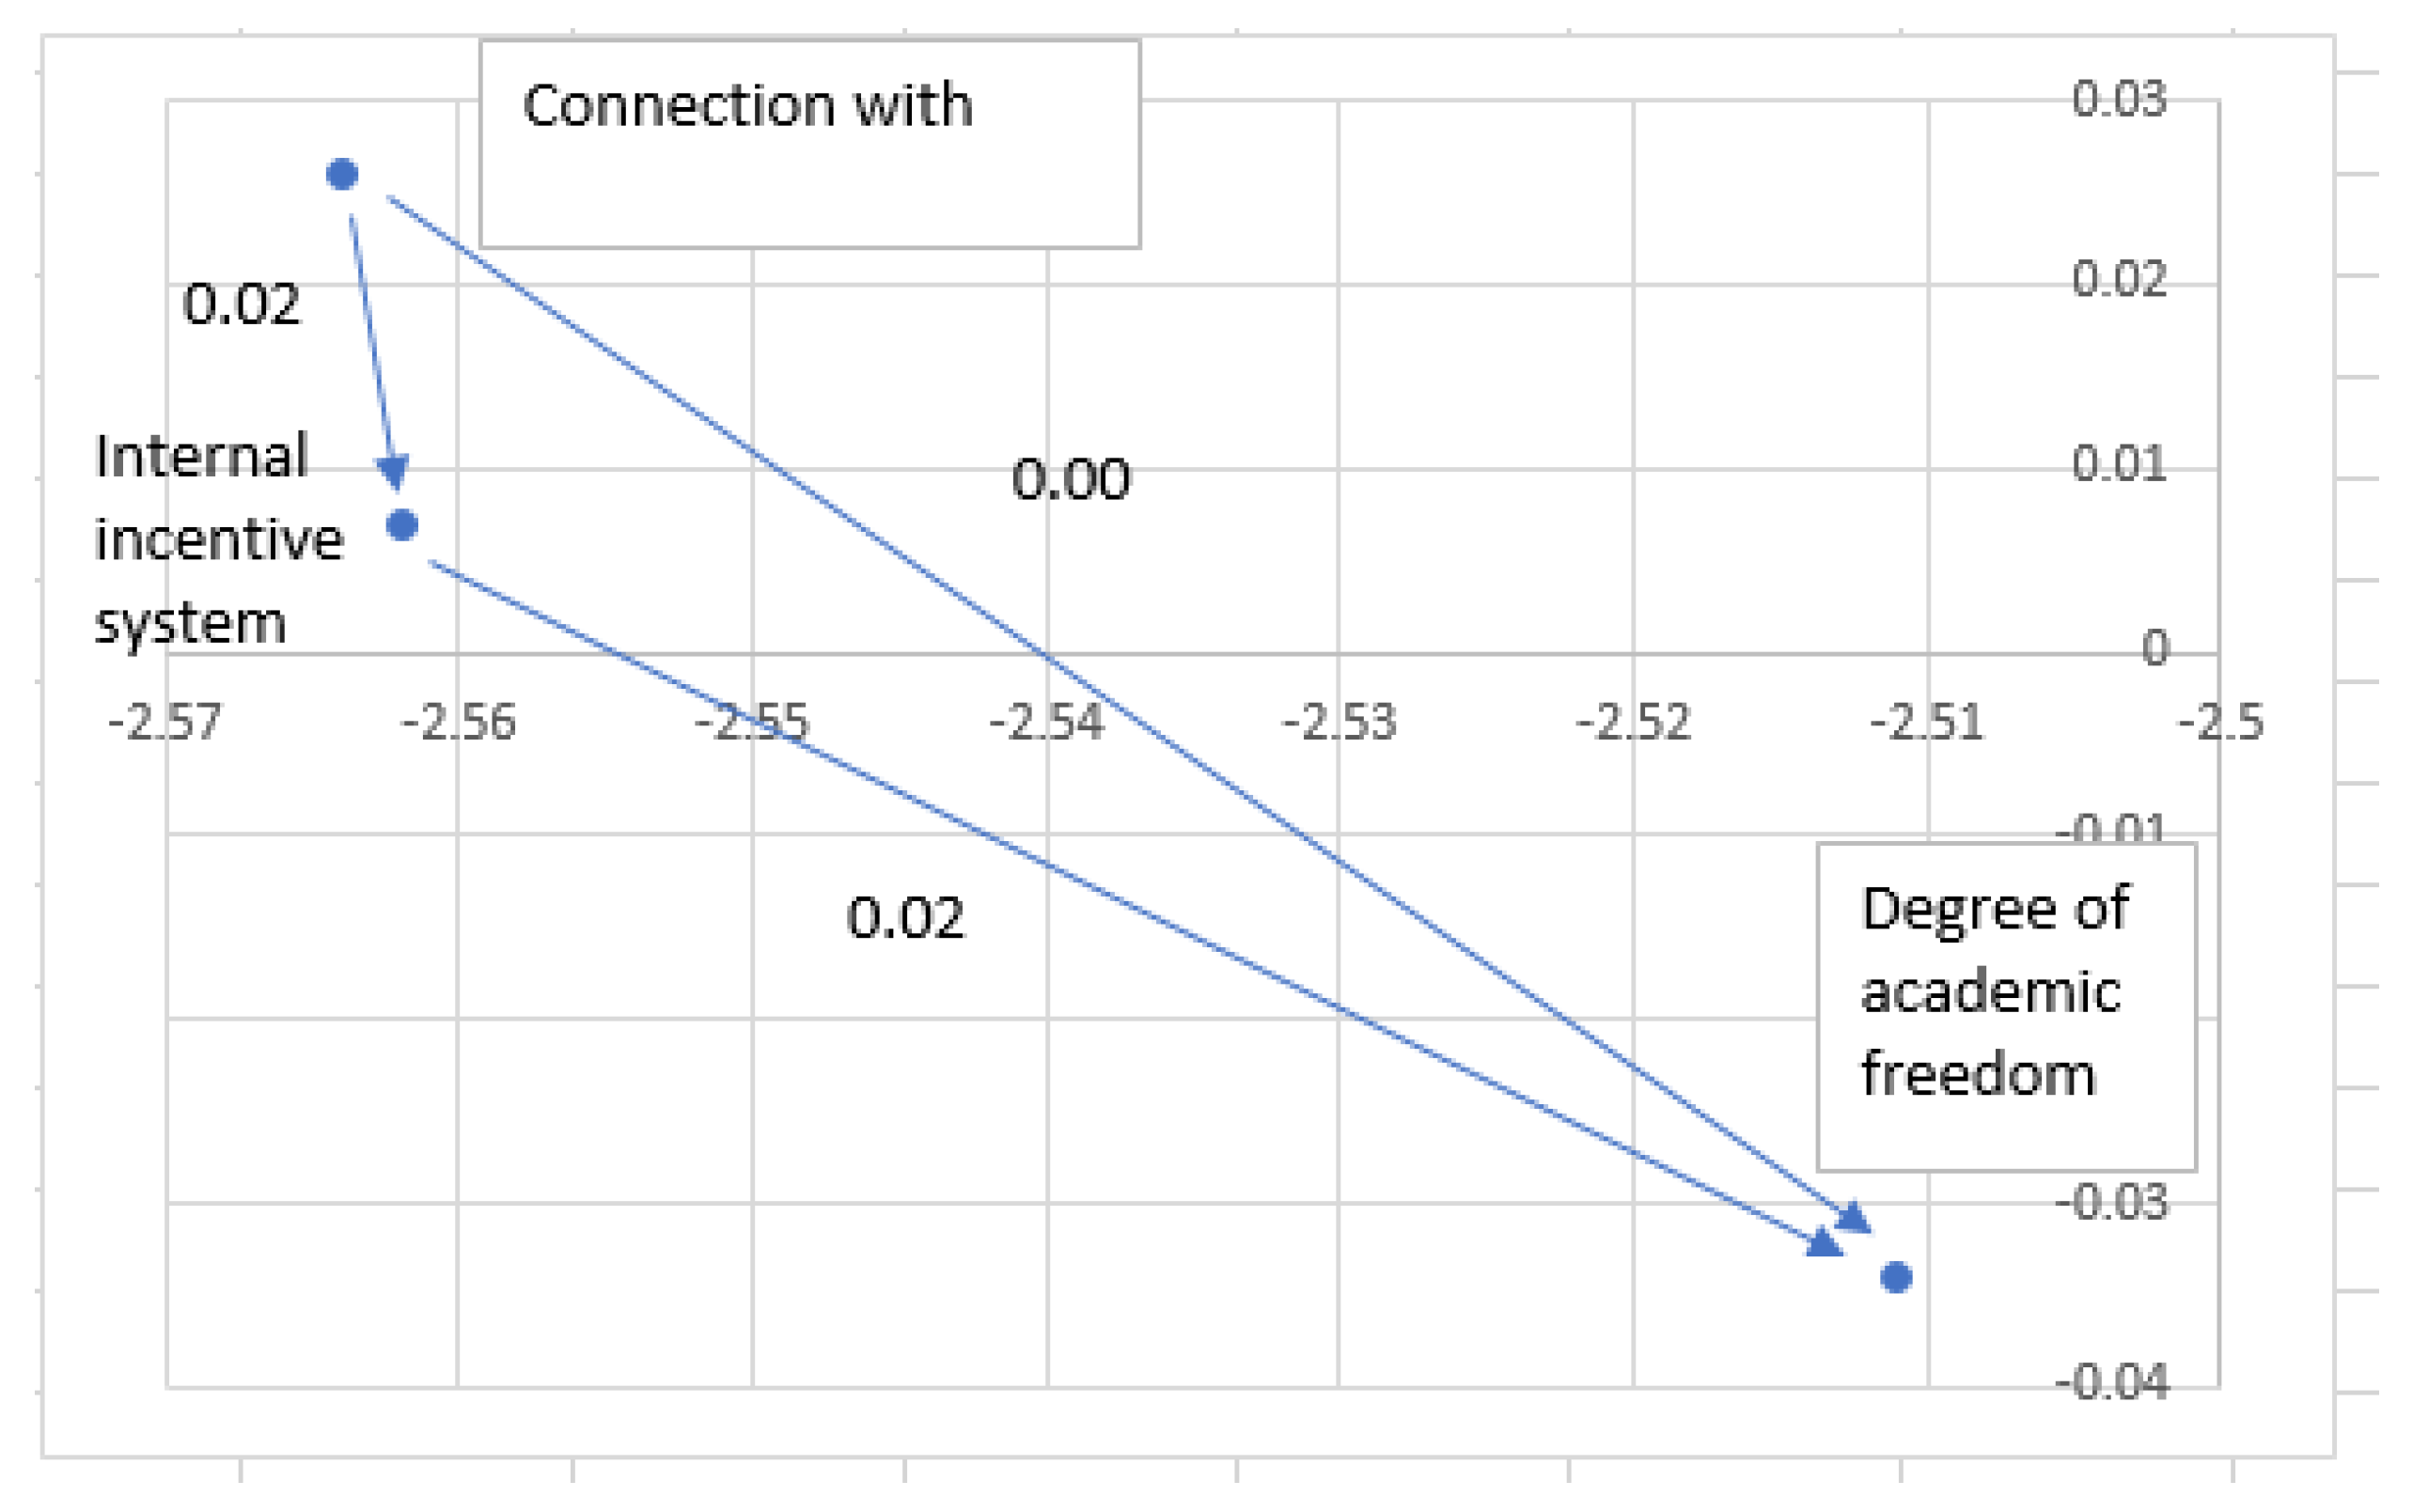
Figure 5.
Causal diagram of sub-aspects of technology inventor.
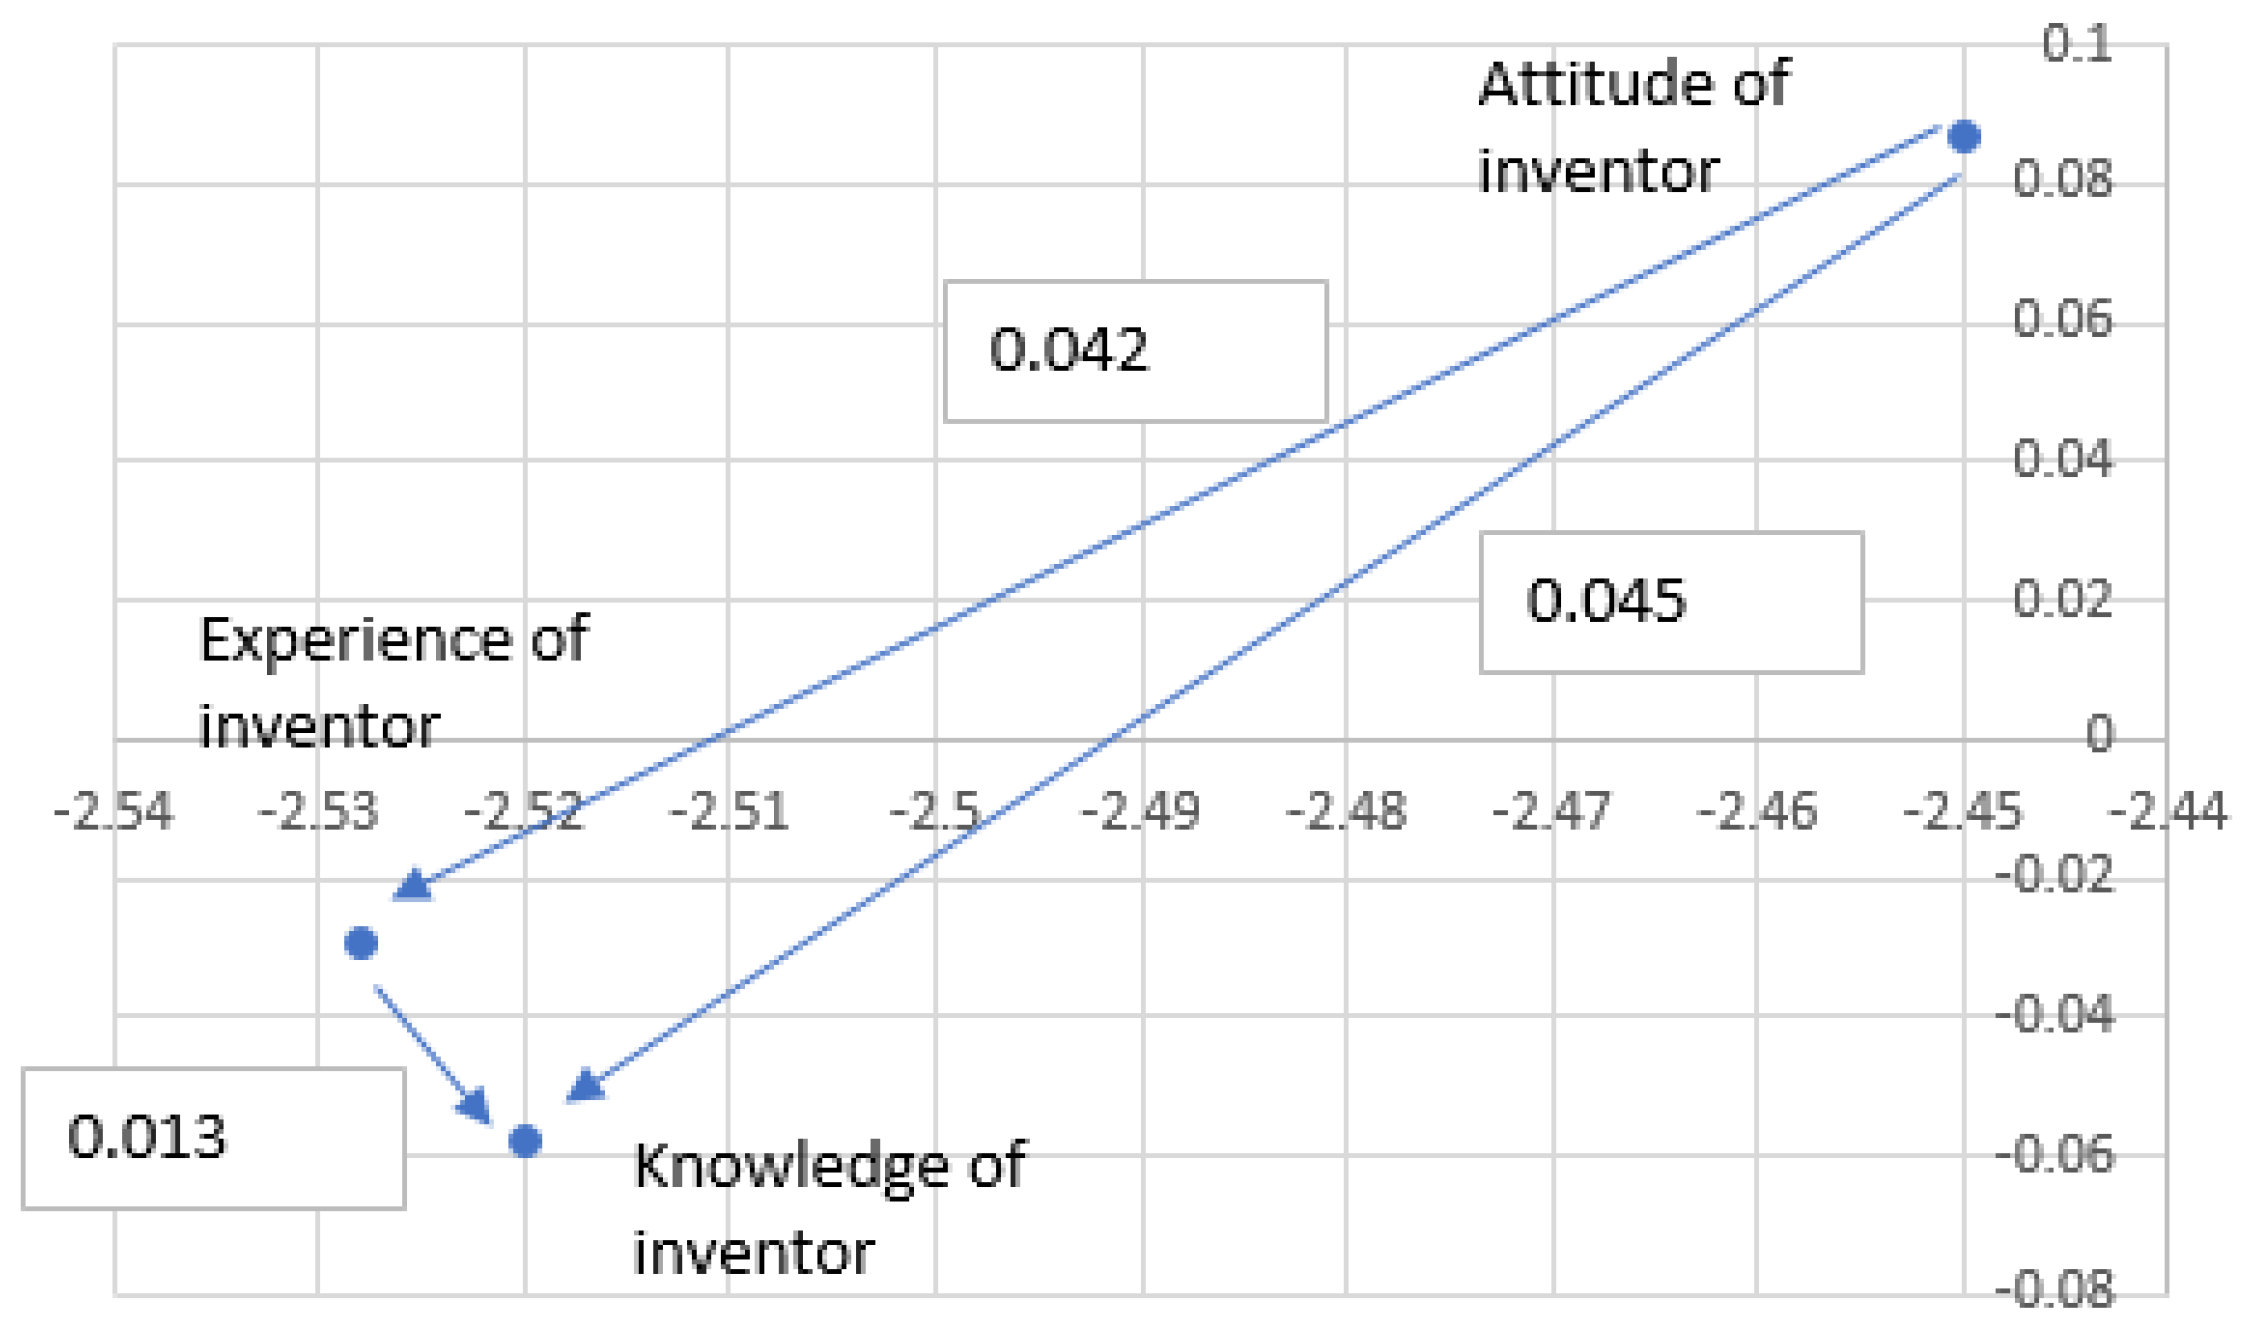
Figure 6.
Causal diagram of sub-aspects of essence of technology.
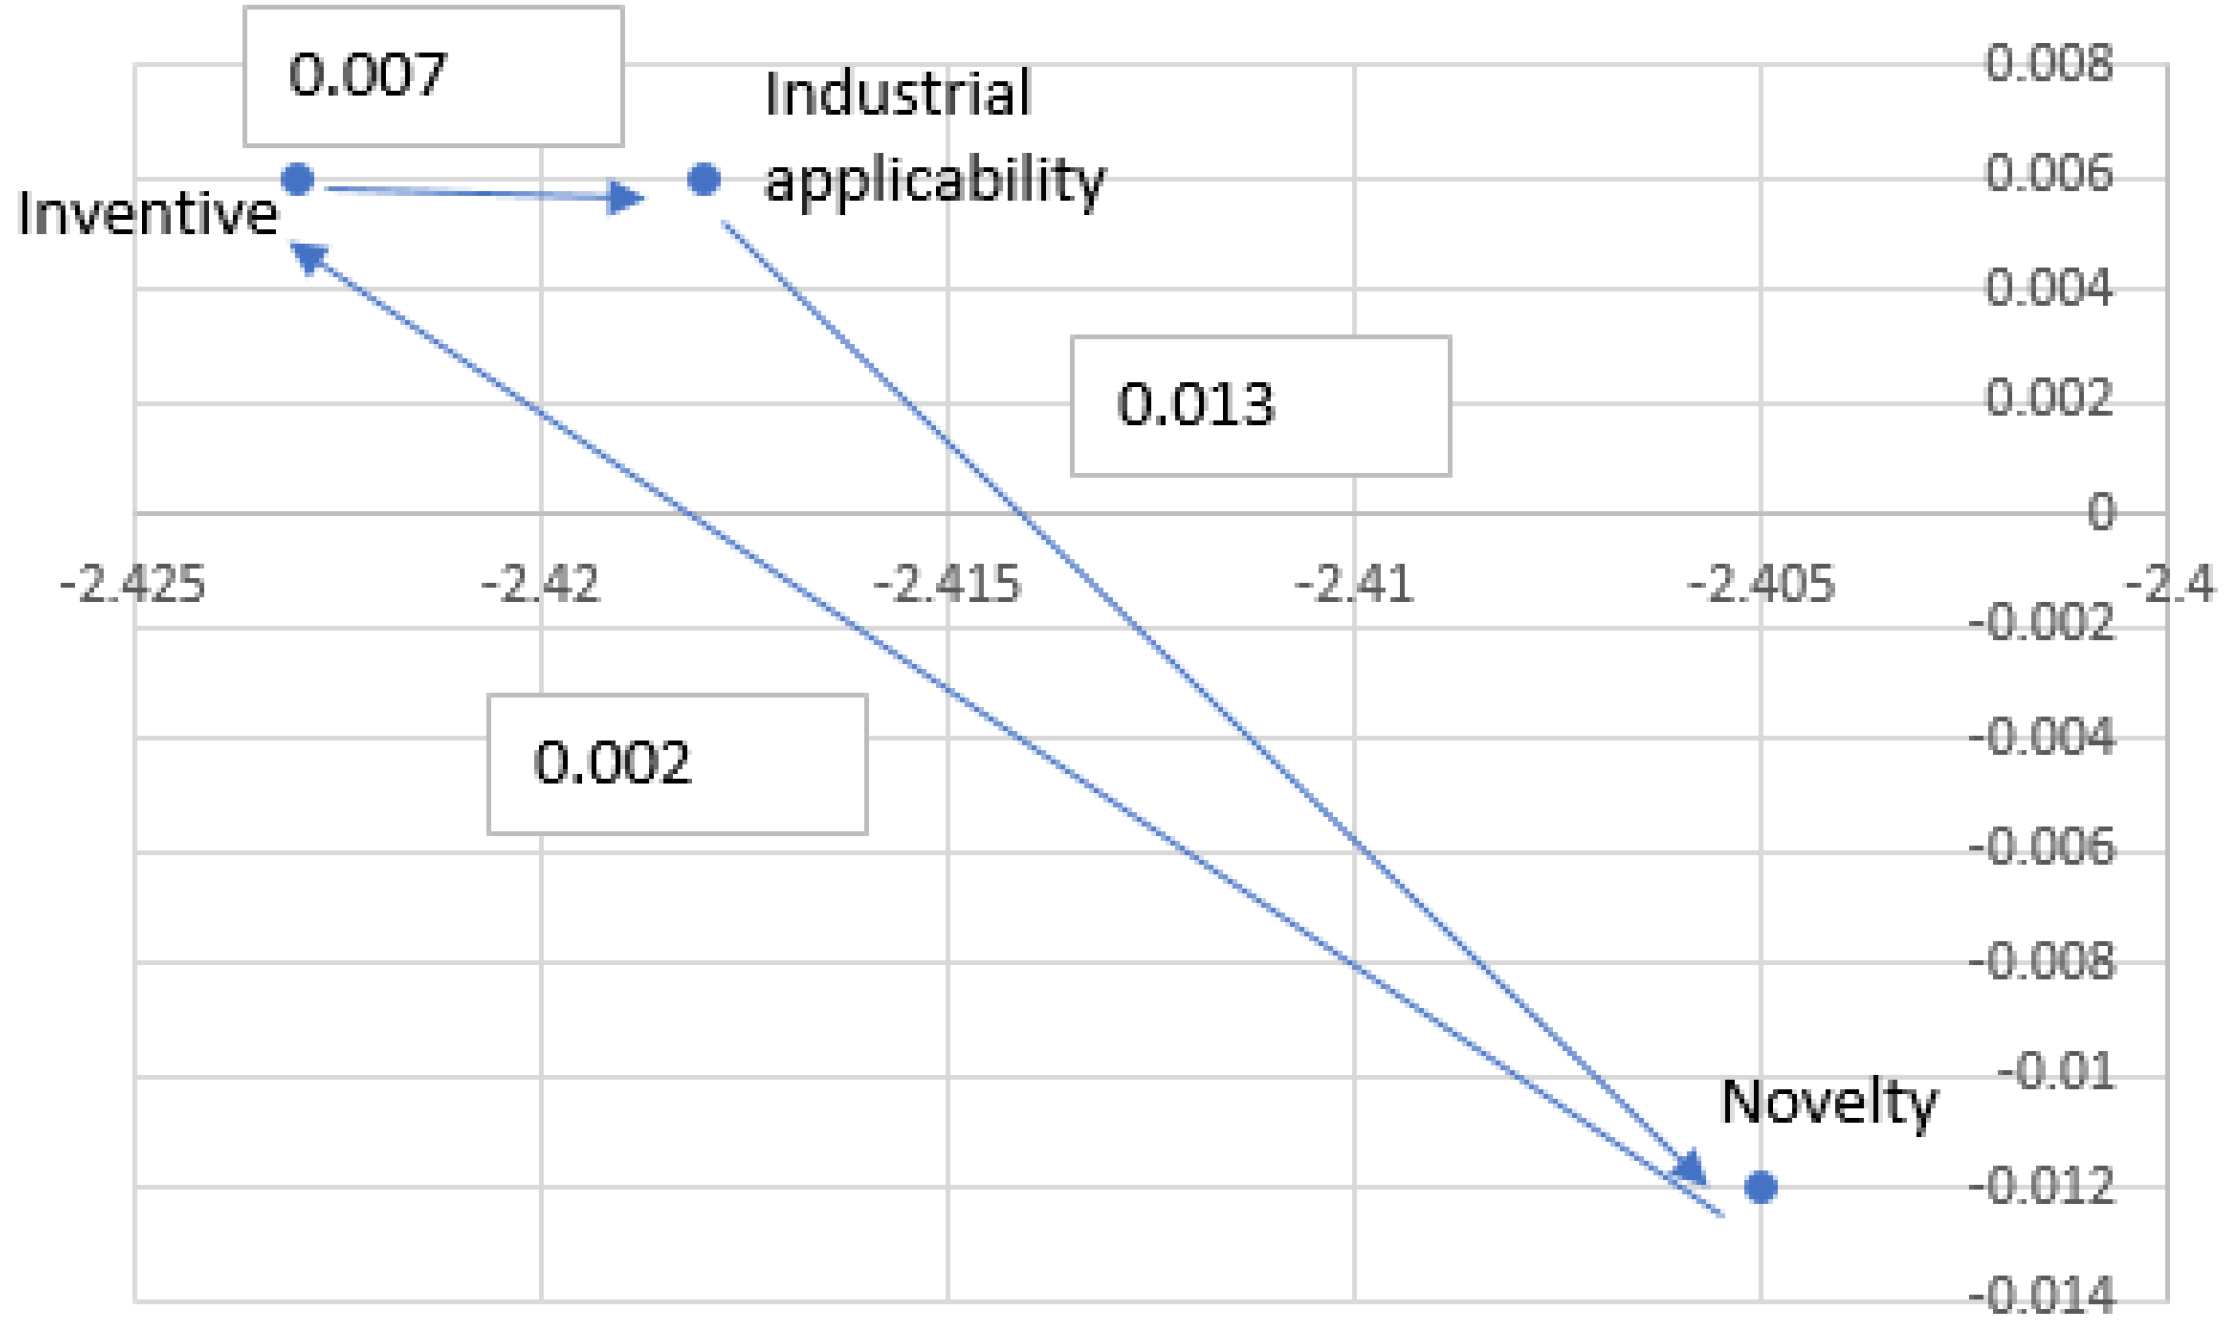

Table 1.
Backgrounds of professions.
| Field | Education Level | Department | Title | Experience (Years) |
|---|---|---|---|---|
| Academic circles | Ph.D. | Business Administration, Secretariat | Professor | Teaching: 14 Administration:7 |
| Ph.D. | Business Administration | Professor | 13 | |
| Ph.D. | Business School | Associate Professor | 7 | |
| Ph.D. | Financial Management | Associate Professor | 6 | |
| Ph.D. | Business Management | Associate Professor | 6 | |
| Ph.D. | Business Management | Associate Professor | 6 | |
| Ph.D. | Quality Control | Research Assistant | 5 | |
| Ph.D. | Information Management | Assistant Professor | 4 | |
| Ph.D. | Information Management | Assistant Professor | 2 | |
| Industry circles | Ph.D. | Project Office | Assistant Vice President | 19 |
| M.A. | General Manager Office | General Manager | 18 years | |
| Ph.D. | Customer Service | Project Manager | 15 | |
| M.A. | Marketing | Manager | 14 | |
| M.A. | Field Application Engineering | Technical Section Manager | 10 | |
| M.A. | Notebook Supply Chain | Product Planning Manager | HP: 7 Technology Industry: 13 | |
| M.A. | Marketing & Sales | Project Manager | 10 | |
| Research Institute | Ph.D. | Cross Research Group | Director | 20 |
| M.A. | Industry Economics Center | Manager | 12 |
Table 2.
The causal matrix of main aspect.
| Organizational Culture | Organizational Structure and System | Technology Inventor | Essence of Technology | Total | |
|---|---|---|---|---|---|
| organizational culture | −0.746 | −0.050 | −0.171 | −0.220 | −1.187 |
| organizational structure and system | −0.025 | −0.826 | −0.184 | −0.212 | −1.246 |
| technology inventor | −0.195 | −0.151 | −0.817 | −0.030 | −1.193 |
| essence of technology | −0.226 | −0.175 | −0.028 | −0.674 | −1.103 |
| total | −1.192 | −1.201 | −1.200 | −1.136 | |
| −2.379 | −2.447 | −2.393 | −2.239 | ||
| 0.005 | −0.045 | 0.008 | 0.033 |
Table 3.
The causal matrix of sub-aspects of organizational culture T.
| Top Manager’s Attitude and Capacity | The Identity and the Image of School | Encouragement of Entrepreneurship | Total | |
|---|---|---|---|---|
| top manager’s attitude and capacity | −0.899 | −0.165 | −0.172 | −1.237 |
| the identity and the image of school | −0.176 | −0.913 | −0.169 | −1.259 |
| encouragement of entrepreneurship | −0.198 | −0.191 | −0.863 | −1.252 |
| total | −1.274 | −1.269 | −1.205 | |
| −2.510 | −2.527 | −2.457 | ||
| 0.037 | 0.010 | −0.047 |
Table 4.
The casual matrix of sub-aspects of organizational structure and system.
| Degree of Academic Freedom | Internal Incentive System | Connection with Industry | Total | |
|---|---|---|---|---|
| degree of academic freedom | −0.867 | −0.208 | −0.197 | −1.273 |
| internal incentive system | −0.181 | −0.901 | −0.195 | −1.277 |
| connection with industry | −0.190 | −0.175 | −0.903 | −1.269 |
| total | −1.239 | −1.285 | −1.295 | |
| −2.511 | −2.562 | −2.564 | ||
| −0.034 | 0.007 | 0.026 |
Table 5.
The causal matrix of sub-aspects of technology inventor.
| Attitude of Inventor | Knowledge of Inventor | Experience of Inventor | Total | |
|---|---|---|---|---|
| attitude of inventor | −0.857 | −0.163 | −0.162 | −1.182 |
| knowledge of inventor | −0.208 | −0.905 | −0.176 | −1.289 |
| experience of inventor | −0.204 | −0.163 | −0.912 | −1.278 |
| total | −1.269 | −1.231 | −1.250 | |
| −2.450 | −2.520 | −2.528 | ||
| 0.087 | −0.058 | −0.029 |
Table 6.
The causal matrix of sub-aspects of essence of technology.
| Industrial Applicability | Inventiveness | Novelty | Total | |
|---|---|---|---|---|
| industrial applicability | −0.900 | −0.156 | −0.150 | −1.206 |
| inventiveness | −0.149 | −0.904 | −0.156 | −1.209 |
| novelty | −0.163 | −0.154 | −0.891 | −1.209 |
| total | −1.212 | −1.214 | −1.197 | |
| −2.418 | −2.423 | −2.405 | ||
| 0.006 | 0.006 | −0.012 |
Publisher’s Note: MDPI stays neutral with regard to jurisdictional claims in published maps and institutional affiliations. |
© 2021 by the author. Licensee MDPI, Basel, Switzerland. This article is an open access article distributed under the terms and conditions of the Creative Commons Attribution (CC BY) license (https://creativecommons.org/licenses/by/4.0/).
Share and Cite
MDPI and ACS Style
Sun, C.-C. Evaluating the Intertwined Relationships of the Drivers for University Technology Transfer. Appl. Sci. 2021, 11, 9668. https://doi.org/10.3390/app11209668
AMA Style
Sun C-C. Evaluating the Intertwined Relationships of the Drivers for University Technology Transfer. Applied Sciences. 2021; 11(20):9668. https://doi.org/10.3390/app11209668
Chicago/Turabian StyleSun, Chia-Chi. 2021. "Evaluating the Intertwined Relationships of the Drivers for University Technology Transfer" Applied Sciences 11, no. 20: 9668. https://doi.org/10.3390/app11209668
Note that from the first issue of 2016, this journal uses article numbers instead of page numbers. See further details here.