Article

Numerical Investigating on Representativeness of Tracers in PIV Model Test of Dredged Slurry Treated by Vacuum Preloading

1
College of Civil Engineering, Zhejiang University of Technology, Hangzhou 310014, China
2
Huadong Engineering Corporation Limited, Hangzhou 310014, China
*
Author to whom correspondence should be addressed.
Appl. Sci. 2021, 11(20), 9715; https://doi.org/10.3390/app11209715
Submission received: 26 August 2021 / Revised: 2 October 2021 / Accepted: 8 October 2021 / Published: 18 October 2021

Abstract

:
The vacuum preloading method is commonly adopted for improving the soft ground that the embankment of the railway line is laid on. The PIV (Particle Image Velocimetry) technique is a powerful tool in observing the formation of the soil column, a phenomenon that is unique to the dredged slurry when treated by vacuum preloading. However, it is not clear to what extent the motions of the slurry particles can be represented by the PIV tracers. In this paper, a mesoscopic model has been established by using the CFD-DEM method to reproduce the vacuum consolidation process of the slurry, in which the PVD (Prefabricated Vertical Drain) membrane, the slurry particles, and the tracers are described by the DEM, and the pore water is governed by the CFD method. Eight computational cases that can cover a broad range of material parameters governing the PIV model tests on the dredged slurry have been designed and studied by the established model. The representativeness of the PIV tracer is evaluated by comparing the statistic displacement of the tracer to that of the slurry particles. It is found that for the commonly used tracer, the carbon powder, can reliably represent the particle motions of the slurry since the difference in displacements of the tracer and the slurry particles is smaller than 6.5% if the diameter ratio between the tracer and the slurry particle is within 1.8.

1. Introduction

Land scarcity is an emerging problem in developed areas due to the fast-increasing population and economy. Tideland reclamation by dredging slurry into cofferdam is an effective and common way to create new lands and thus to alleviate the land shortage problem. There are several land reclamation sites distributed over the southeastern coastal areas of China. The dredged slurry is generally characterized by fine slurry particles (e.g., the average particle size d50 ≤ 5 μm), high water content (e.g., ≥1.5 times the liquid limit), and extremely low strength (e.g., <5 kPa) [1]. To improve the new land thus that it can be used by later-on constructions, the vacuum preloading method that involves installing PVDs (Prefabricated Vertical Drain) into the slurry and then connecting them to the vacuum pump is a common practice [2]. However, poor performance has often been observed for vacuum treatment of the dredged slurry, e.g., the rates of the drainage flux, the settlement, and the pore water pressure dissipation drop significantly even at the early stage of the designed treatment period [3,4]. As a result, the improvements on the stiffness and the strength of the soil are too limited to satisfy requirements on the bearing capacity and post-construction settlement post by the infrastructures.
Recently, it was realized that the so-called soil column phenomenon was the main reason of the observed deficiency in vacuum treatment of the dredged slurry [5,6]. Different from the natural soil that is of stable soil skeleton, the dredged slurry is of extremely high-water content, and thus the fine particles in the slurry are generally in the suspended or loose-contacting status. Under the vacuum gradient, the slurry particles would migrate towards and then accumulate onto the PVD membrane, which forms the soil column with the PVD along its axis [7,8]. The soil column that is densely packed by the vacuum gradient is of extremely low permeability and thus impedes the drainage of the surrounding slurry [9].
With the realization of the physical importance of particle movements in explaining the inefficiency problem, both numerical and model-test studies have been carried out in the literature to characterize the particle motion and packing driven by the vacuum gradient in the slurry. Since the slurry contains both the solid and liquid phases, the current numerical studies generally adopt the two-phase approaches, e.g., the PFC software and the CFD-DEM method, in which the slurry particle is described by the DEM (Discrete Element Method) and the pore water is governed by the CFD (Computational Fluid Dynamics). The dynamic interactions between the particle and the fluid phases can be readily taken into account through the coupled CFD-DEM solver [10]. Based on the method, the problems of upward seepage [11], the soil consolidation [12], the underwater sedimentation [13], and the pipe erosion [14] can be modeled. Recently, a CFD-DEM-based model was established by Shi et al. [8] for reproducing the soil-column forming process under different vacuum pressures. Moreover, more refined models were built by Sun et al. [15] and Xu et al. [16] for investigating the jamming problem of the orifice of PVD membrane by the slurry particles. The CFD-DEM method is superior in explicitly resolving the motions of each slurry particle, which can help to understand the soil column phenomenon from a microscopic-scale view. However, the method may be subjected to severe limitations when it is used for modeling a real engineering-scale problem since enormous particles would be involved, and then the computational cost would be too high.
Alternatively, the model test is a generally accepted method for investigating problems of practical-engineering scale. Combined with the PIV (Particle Image Velocimetry) technology that is originally developed in the field of experimental fluid mechanics [17], the microscopic kinematic information of the particles can be obtained directly, which can serve as an important supplement to the commonly-observed macroscopic quantities. The PIV technique that can measure the displacement/velocity field of the soil particles has been widely used in geotechnical problems, such as the pile-soil interaction [18], the ground deformation induced by tunneling [19], the interaction of foundation structure and soil [20], etc. As for the vacuum consolidation of dredged slurry, the PIV analysis has been recently adopted by Pan et al. [21] and by Cai. [22] to obtain the displacement field of the slurry, based on which the formation mechanism of the soil column has been revealed.
As a non-intrusive testing method, the PIV technique fundamentally relies on the tracer particles to accomplish the image correlation analysis, i.e., the actual displacement/velocity field of the soil is represented by that of the tracer particles. However, the commonly-used and commercially available tracers, e.g., the carbon powder, could be of different diameters of mass density when compared to the measured objects, i.e., slurry particles in the present paper. Questions may arise over the representativeness of the tracers on the kinematic information of the slurry particles during the vacuum consolidation process, which is monitored by using the PIV technique.
To this aim, a microscopic model on vacuum consolidation of the slurry has been built using the CFD-DEM method. The slurry particles and the pore water are, respectively, described by the DEM and the CFD methods. Moreover, the PVD membrane is included in the model through fixed-in-space particles that are modeled by the DEM. The tracer particles that are also modeled by the DEM are distributed evenly over the slurry surface, which is the same as the tracer configuration in the practical PIV technique. By using the established model, the representativeness of the tracers on displacements of the slurry particles has been investigated for different combinations of the tracer diameter, the trace density, and the initial void ratio of the slurry soil.

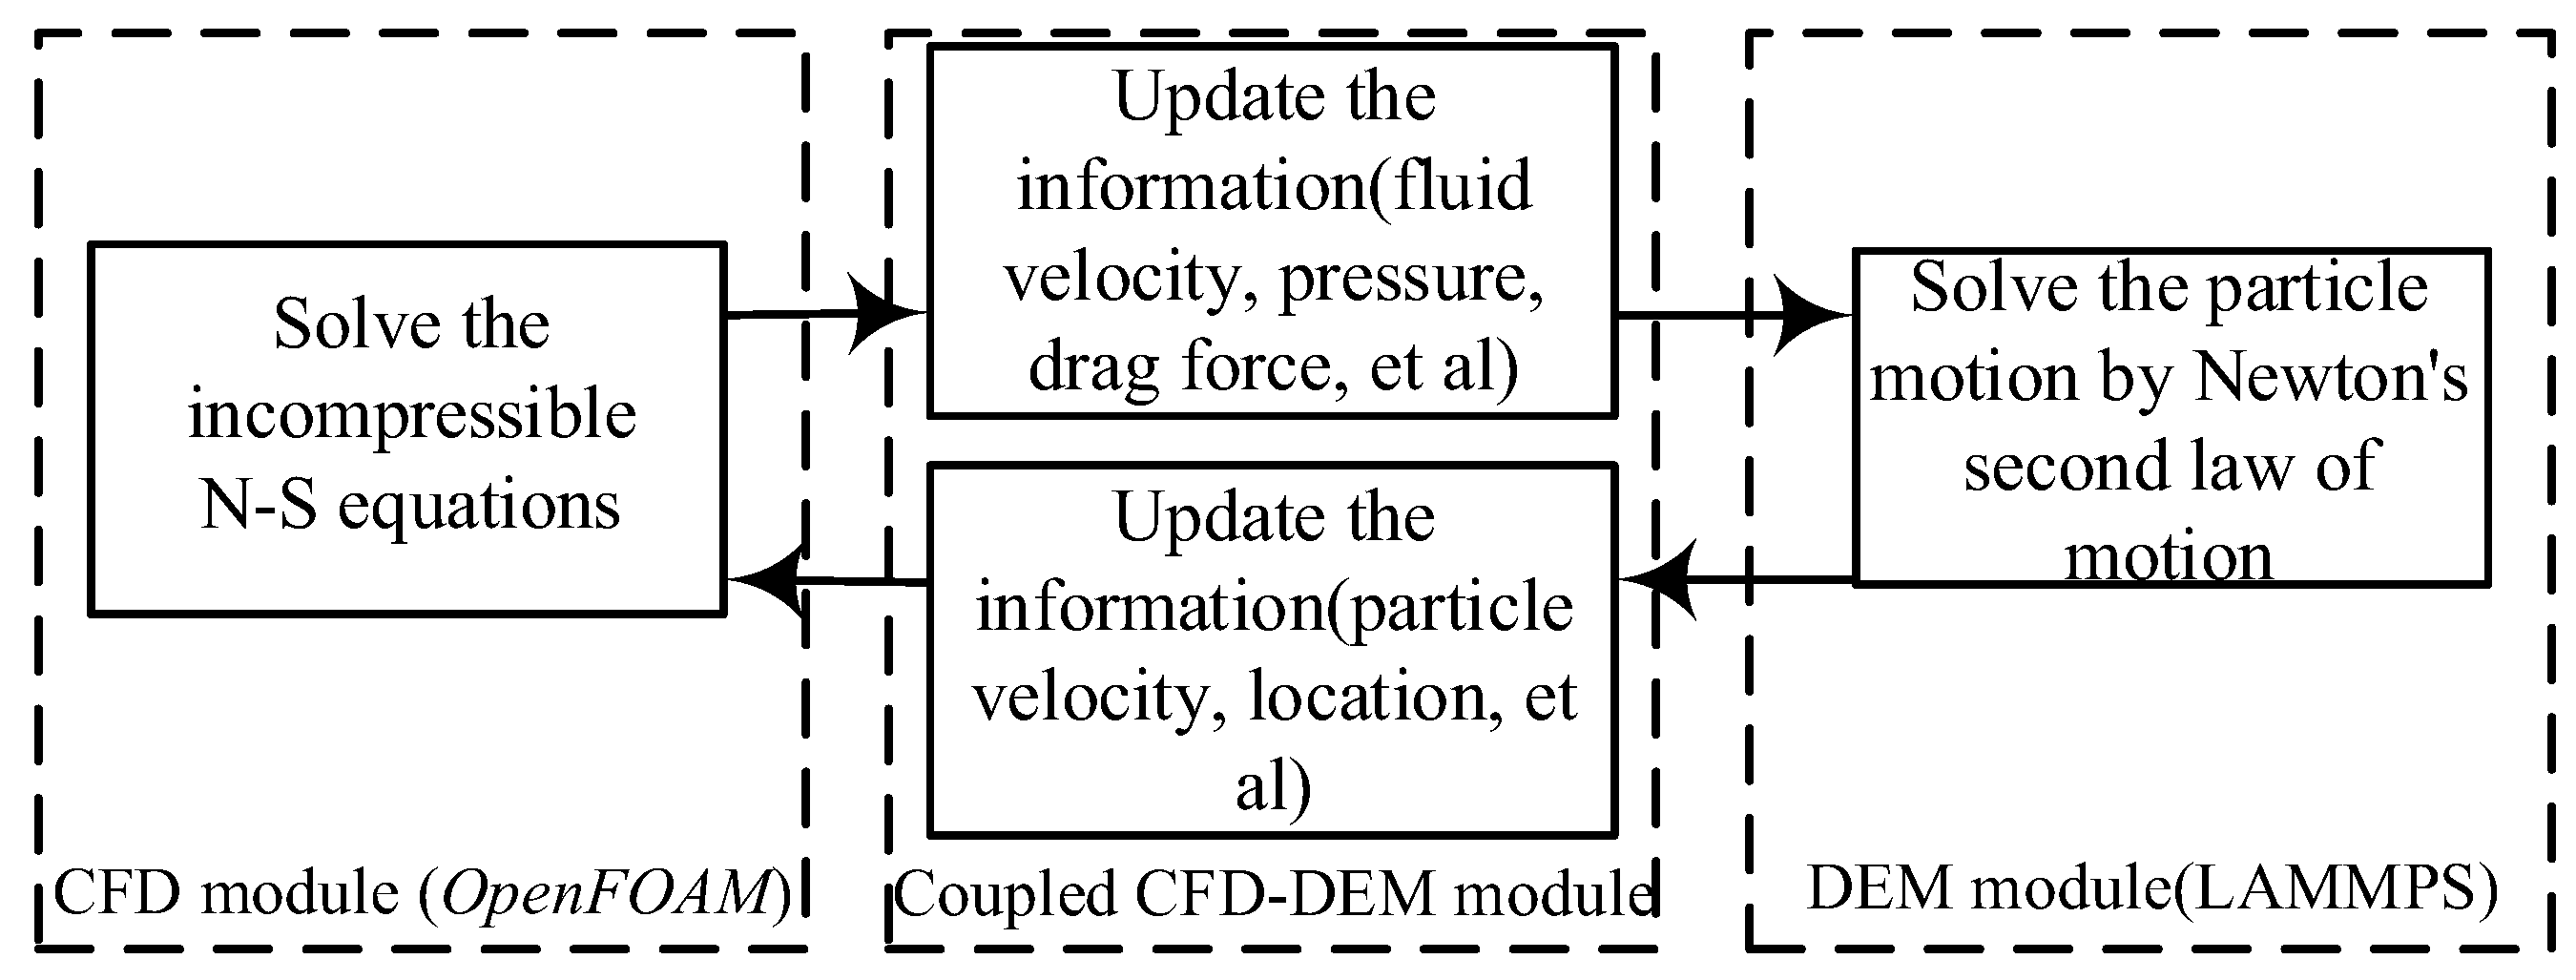
2. Brief Introduction to CFD-DEM Solver

The analysis involves a coupled CFD-DEM solver known as SediFoam (the source code is available at https://github.com/xiaoh/sediFoam access date: 5 June 2017), which consists of three modules, i.e., the CFD module, the DEM module, and the coupled CFD-DEM module. As shown in Figure 1, motions of the fluid and the particle are processed, respectively, in the CFD module and the DEM module. Their interactions are realized through the coupling module.

2.1. The Governing Equation of CFD

In the CFD module, the fluid motion is solved by the locally-averaged incompressible Navier–Stokes equations (N-S)
· ( Φ s U s + Φ s U s ) = 0
( Φ f U f ) t + · ( Φ f U f U f ) = 1 ρ f ( p + Φ f · τ + Φ f ρ f g + f f p )
where Φs and Φf are the solid and fluid volume fractions, respectively; Us is the velocity of the particle; Uf is the fluid velocity; ∇p is the pressure gradient; ∇ is the divergence operator; τ is the viscous stress tensor; ρf is the density of fluid; ffp is the volumetric interaction force acting on the fluid by the particles within each cell; t denotes time; g is the acceleration of gravity.

2.2. The Governing Equation of DEM

In the DEM module, based on Newton’s second law, the particle motion is determined by solving the following equations
m d U s d t = f c o l + f f p + m g
I d φ d t = T c o l + T f p
where m is the mass of particle; fcol is the contact force between the particles or between the particle and the fixed boundary; ffp is the fluid-particle interaction force (including the drag force, the lift force and the buoyancy force, etc.); I represents the angular moment of inertia of particles; φ represents the angular velocity of particle; Tcol and Tfp represent the torque due to the collision between particles and the particle-fluid interactions, respectively.

3. Verification of the CFD-DEM Solver

In this section, the coupled CFD-DEM solver Sedifoam presented in the above is used to simulate the settlement of spherical particles, providing the computational results to which the empirical solutions are compared and thus account for the validity of the coupled solver.

3.1. Richardson’ Empirical Formula

Based on a large number of experimental data analyses, a widely accepted empirical equation on particle sedimentation rate of uniformly sized spherical particles was proposed by Richardson et al. [23] as
log V ( s , c ) = n log c f + log V ( s , 0 ) = n log 1 c s + log V ( s , 0 )
where cf is the volume fraction of the fluid; cs is the volume fraction of the solid; V(s,c) is the settling rate when the concentration of suspended particles is c; V(s,0) is the settlement rate of a single suspended particle; n is the empirical parameter in different fluid states and expressed as below
n = 4.65 + 19.5 d D           ( R e < 0.2 )
n = ( 4.35 + 17.5 d D ) R e 0.03 ( 0.2 < R e < 1 )
where d is the diameter of spherical particles and D is the diameter of the model vessel; Re is known as Reynolds number, and v presents the dynamic viscosity of the fluid. Since the settling problem of soil particles in water is considered herein, only the equations corresponding to Re < 1 need to be included, i.e., Equations (6) and (7).

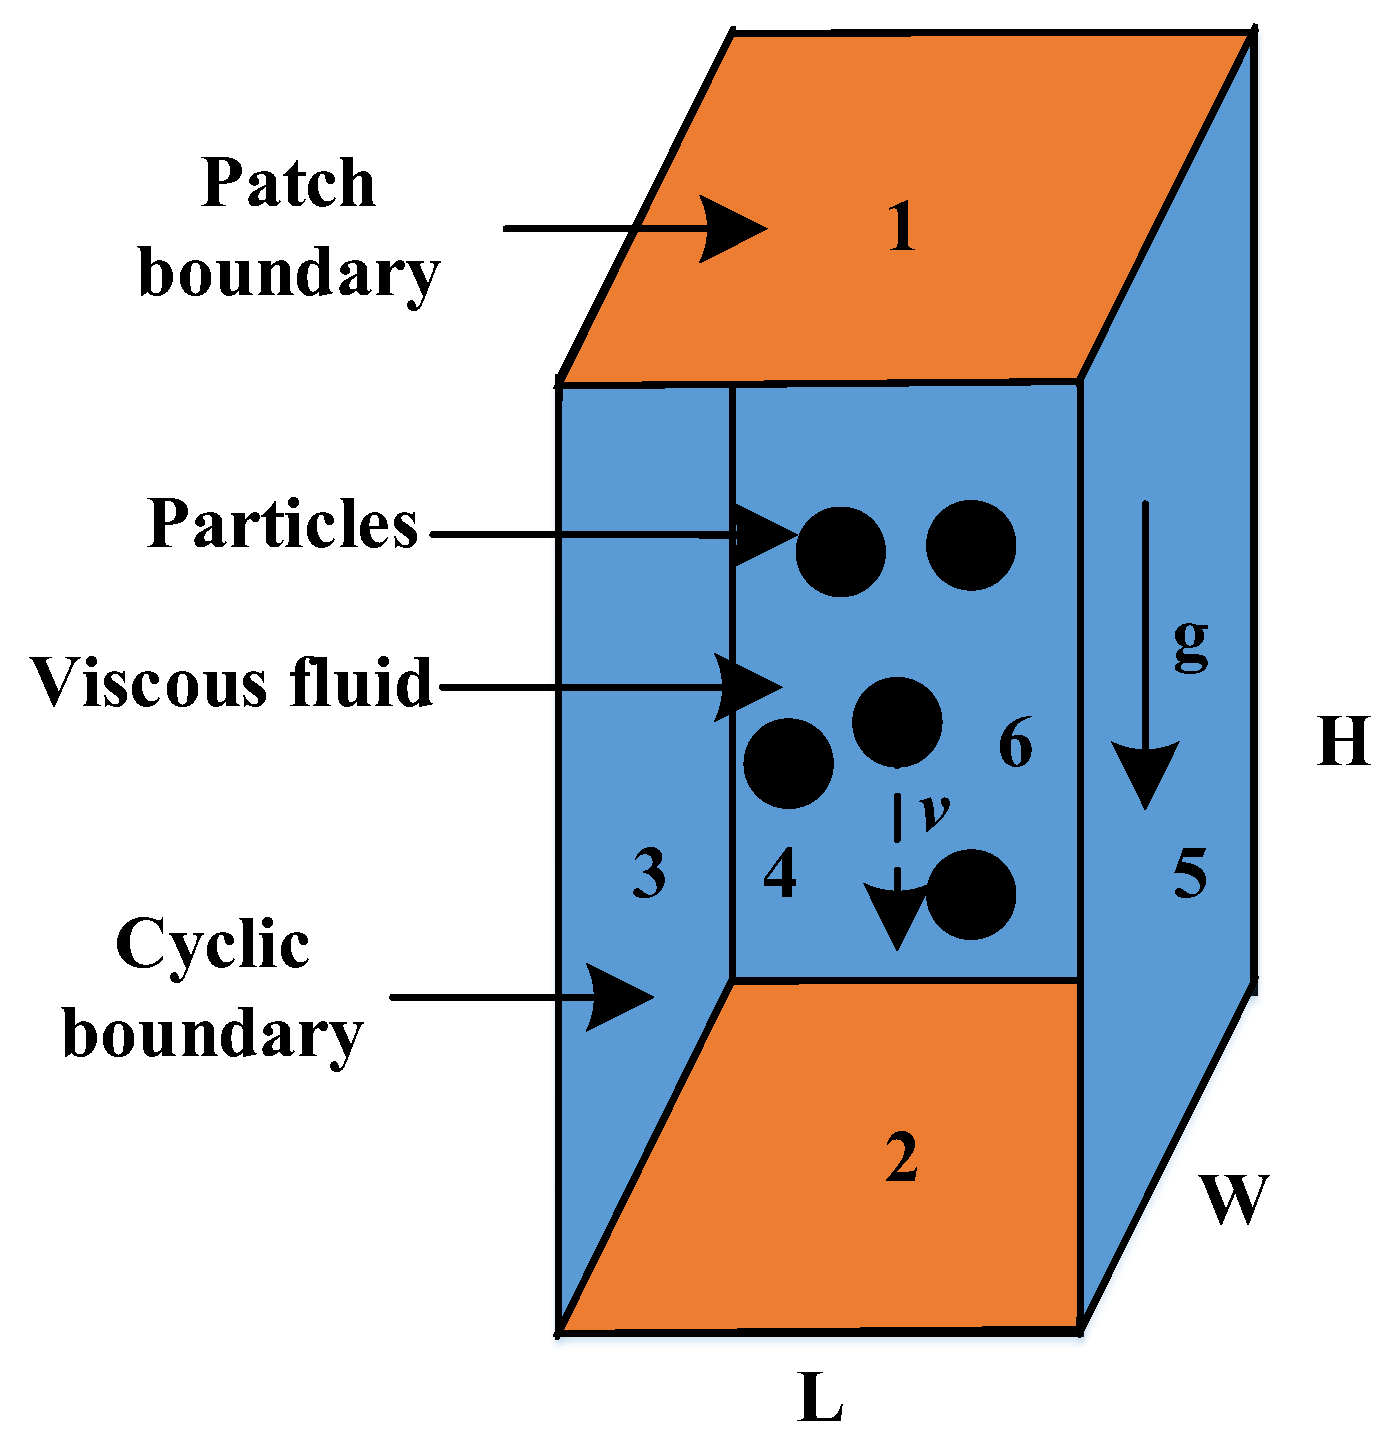
3.2. Numerical Model on Particle Sedimentation

As illustrated in Figure 2, a three-dimensional numerical model incorporating the multiple spherical particles and the viscous fluid was established in the CFD-DEM solver SediFoam. The fluid and the particle were simulated by the CFD and the DEM, respectively. For the DEM discretization domain, the wall boundary conditions were adopted. While for the CFD discretization domain, the fluid velocity and pressure were set as zero and zero-gradient on the top surface of the model, respectively, i.e., the patch boundary condition. Moreover, on the remaining boundary surfaces, the slip-wall and zero-gradient conditions were assigned to the fluid velocity and the pressure, respectively, i.e., the wall boundary condition. The length, width, and height of the numerical model were 0.01, 0.01, and 0.2 m, respectively. The even-sized particles were of diameter 0.001 m. Based on the initial concentration c of particles, four cases were set up, which were Case 1 (c = 0), Case 2 (c = 0.05), Case 3 (c = 0.1), and Case 4 (c = 0.25). Parameters of the numerical model are summarized in Table 1.
By substituting the settlement rate of a single suspended particle V(s,0) = 0.141 m/s and the diameter of the model vessel D = 0.02 m into Equation (1), the predictions of the Richardson empirical formula on various particle concentrations are presented in Table 2.
Figure 3 illustrates that the velocity of uniformly sized spherical particles varies the particle concentration during the settlement process. The simulated values agree well with the predictions of the empirical formula, which verifies the correctness of the CFD-DEM solver Sedifoam.

4. Numerical Model

The PIV model test on vacuum consolidation of dredged slurry involves interactions between the PIV tracers, the slurry particles, the pore water, and the PVD membrane. Successful modeling requires proper considerations on numerical representations of the involving parts.

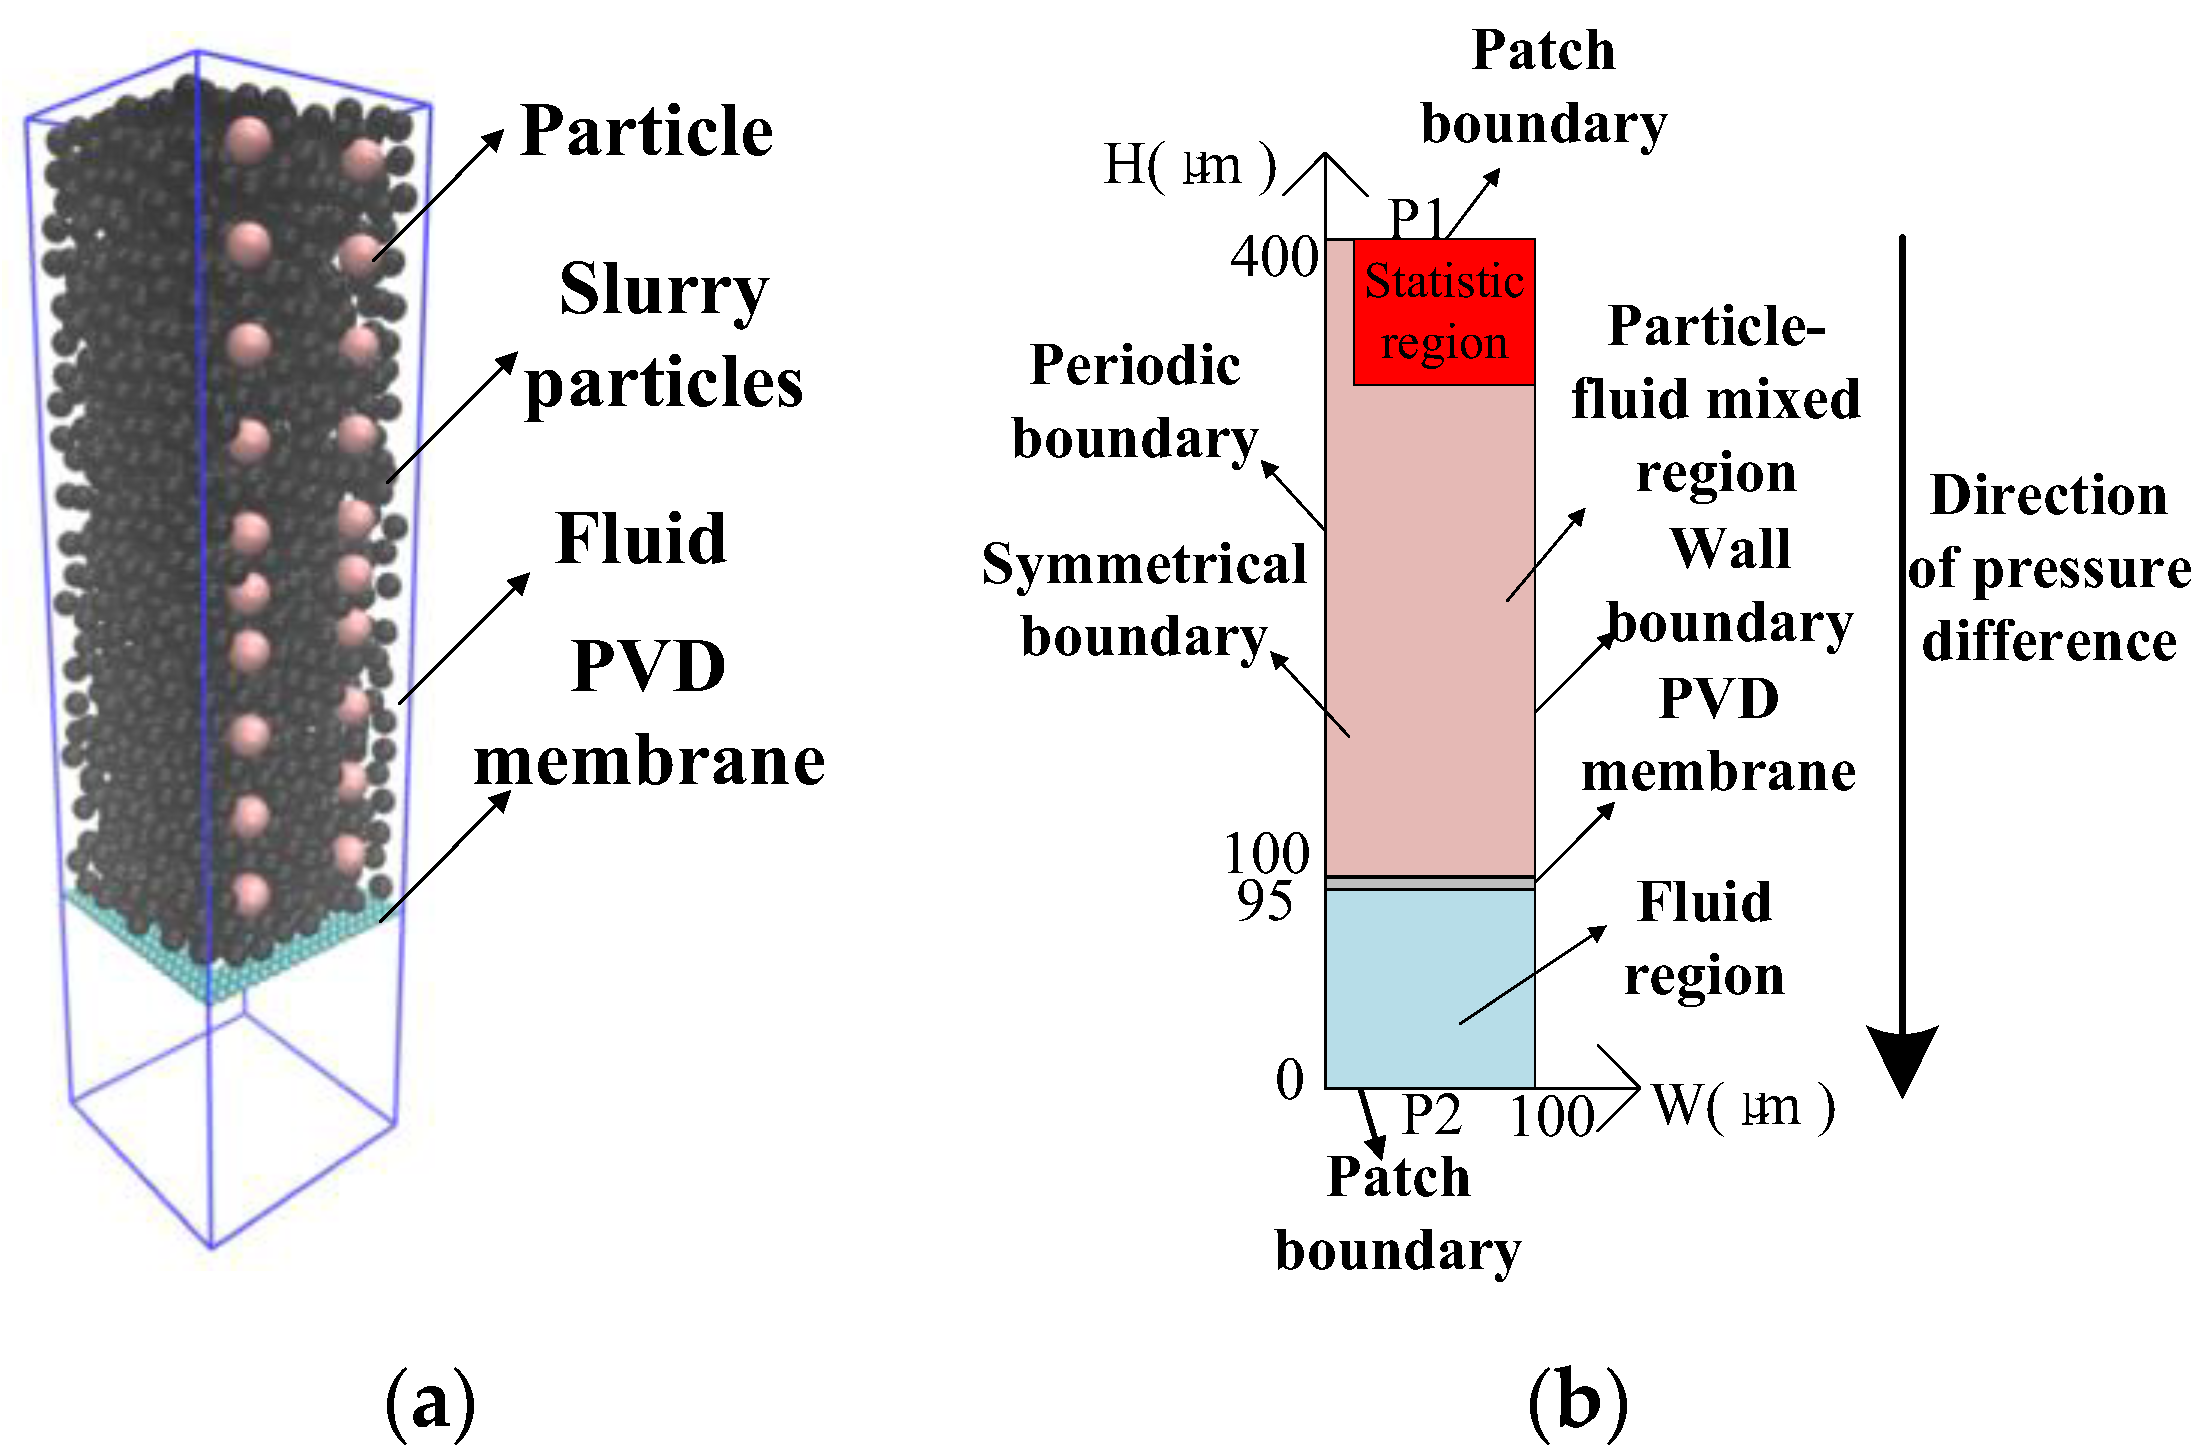
4.1. Modeling on PVD Membrane

The vital function of PVD is the drainage capacity, which is controlled by membrane apertures [24,25]. The membraned aperture involved in the industry is quantitatively described by the pore-opening size O95, which corresponds to 5% sieving rate of particles. Index properties of industrial PVD are summarized in Table 3.
According to the manufacturing process [26], the PVD membrane can presently be divided into the non-woven fabric and woven fabric. The former is obtained by the fusion of fiber molecules in random directions; while, the latter turns the fiber into yarn and interweaves in the orthogonal direction. In order to alleviate the complexity of modeling, only the woven fabric structure was taken into account, as shown in Figure 4. The PVD membrane was established numerically by rectangular arrangements of spherical particles that were uniform in size, as shown in Figure 5. There were 336 spherical particles of diameter 5 μm being used in establishing the membrane model, of which the dimensions were 100 μm (length) × 100 μm (width) × 5 μm (thickness). The particle packs represent the membrane fibers that were evenly spaced along both directions of the membrane plane. As compared in Figure 4, the present numerical model of membrane properly represents the actual fabric structure of the woven PVD membrane. The resulting openings bounded by the fibers were of a rectangular size, of which the equivalent diameter D was set to O95 of the PVD membrane prototype, i.e., D = O95 = 20 μm. Thus, the pore-opening size of the membrane model satisfies the corresponding industrial requirement in Table 3, i.e., O95 = 20 μm < 75 μm. It is noteworthy that this structure not only controls the equivalent pore-opening size, but also contributes to the permeability coefficient of the membrane. Moreover, the permeability coefficient, calculated by the coupled CFD-DEM solver, is k = 4.35 × 10⁻⁴ m/s, which meets the industrial manufacturing requirements of PVD membrane in Table 3, i.e., k ≥ 5 × 10⁻⁵ m/s.

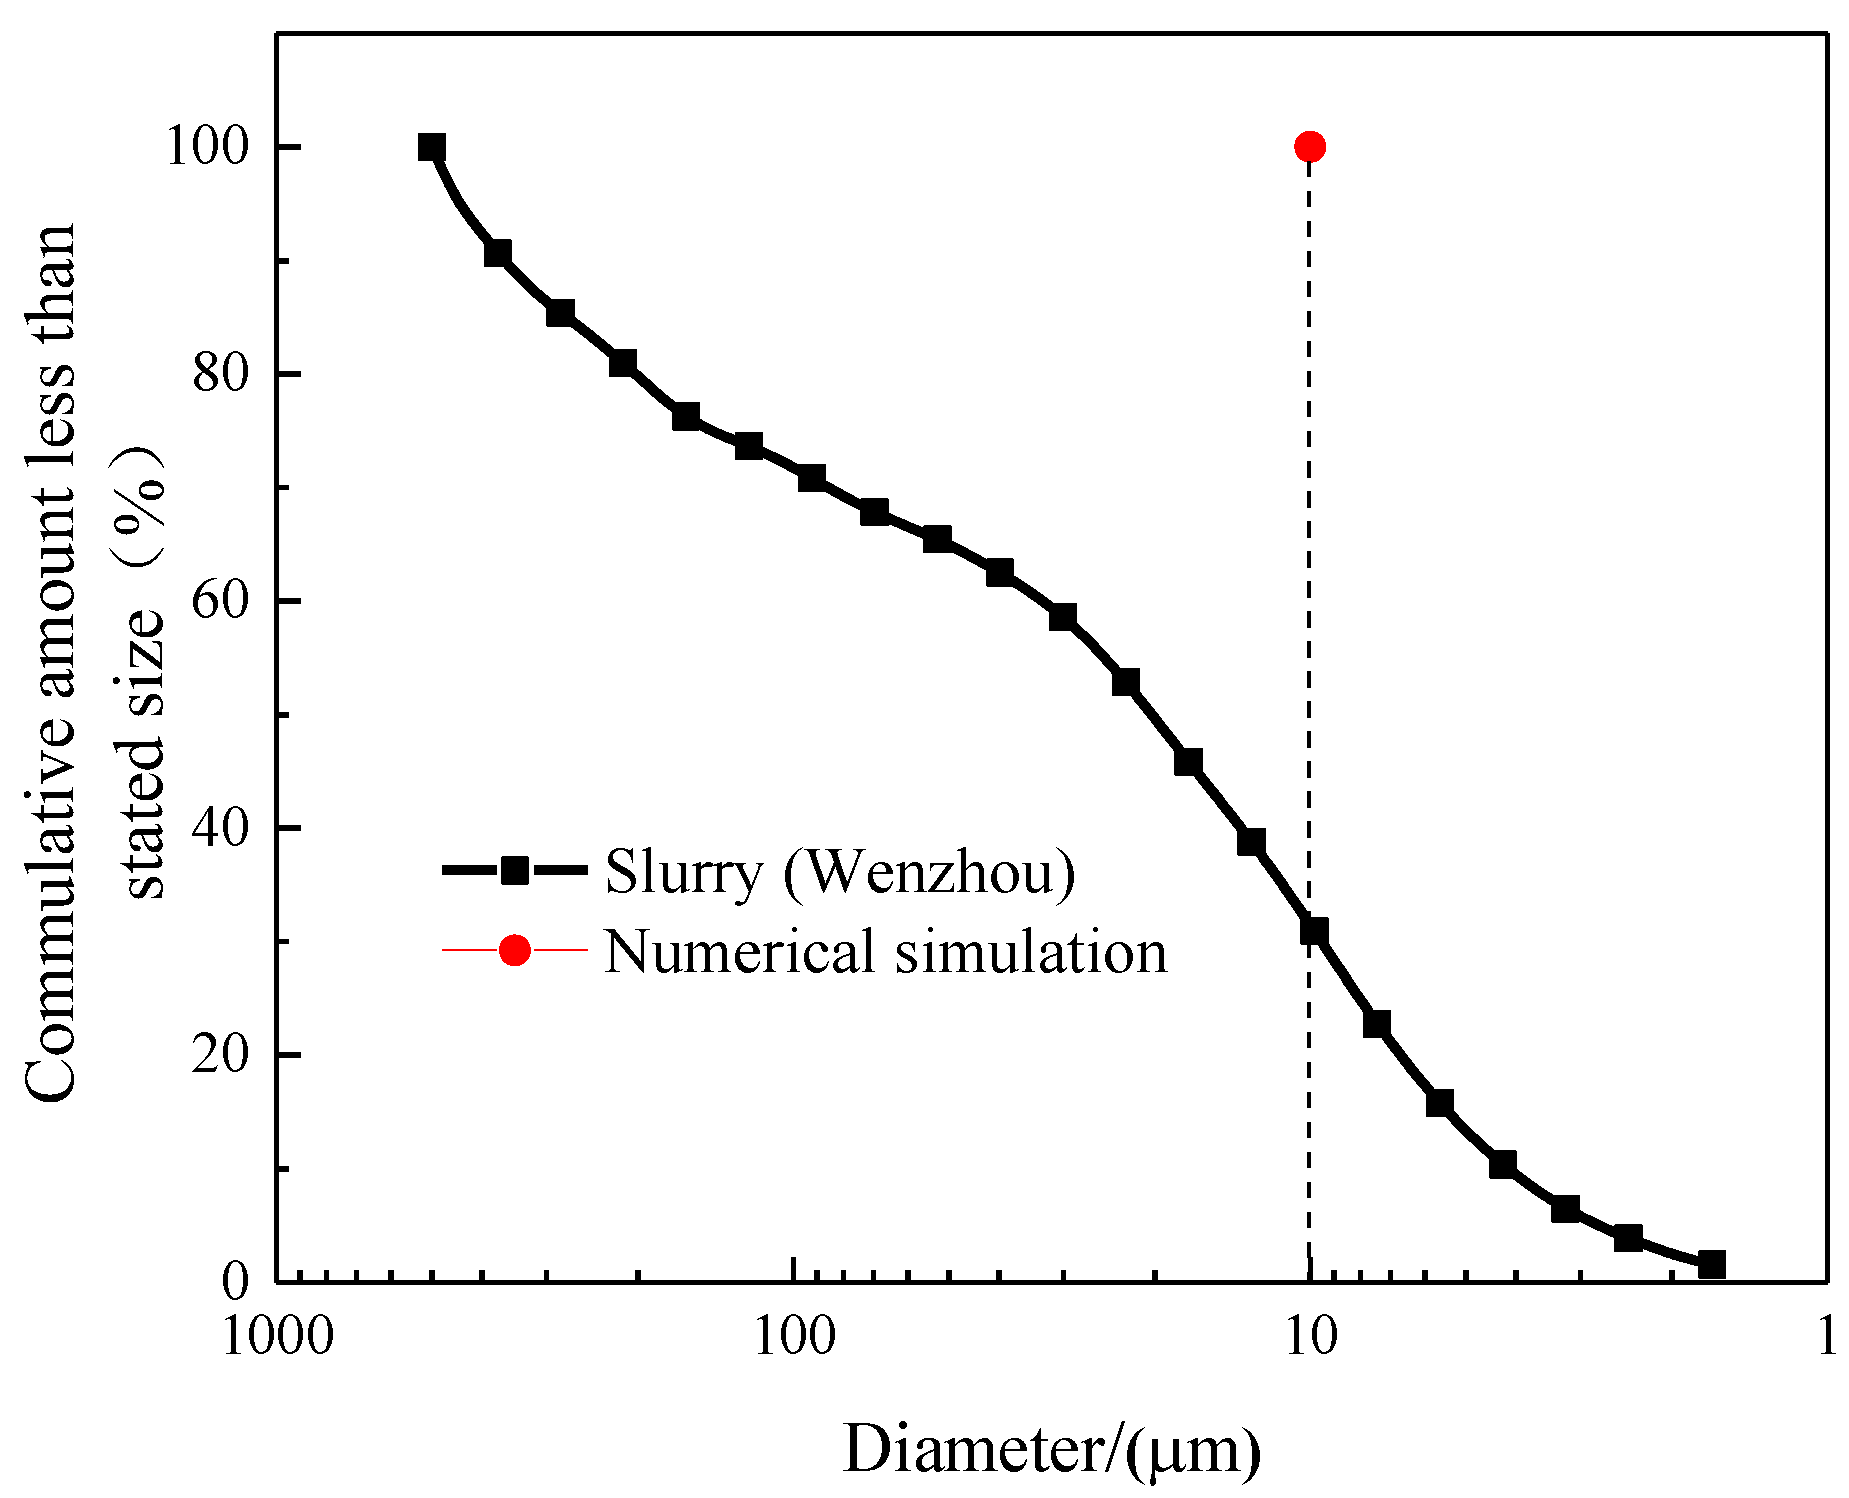
4.2. Modeling on Slurry and PIV Tracers

By using the CFD-DEM solver SediFoam, the particles of the slurry and the tracers used in the PIV test were described by DEM, while the pore water was governed by the CFD method. The three-dimensional model incorporating the slurry, the tracers, and the PVD membrane is shown in Figure 6a tighter with illustrations on the model structure given in Figure 6b. The model was of cuboid shape with a height of 400 μm and square bottom of side length of 100 μm. As shown in Figure 6b, along the model height, the computational domain can be functionally divided into three regions, i.e., the particle-fluid mixed region ranging from 100 to 400 μm, the membrane region ranging from 95 to 100 μm and the pure water region ranging from 0 to 95 μm.
In order to save computational cost as well as to simplify the calculation of particle interaction forces, the slurry particles were idealized into spheres, which were randomly scattered in the mixed region and not allowed to overlap with each other, as shown in Figure 6a. The number of the spheres was determined according to the initial void ratio of the slurry. The tracers were also modeled as spheres. However, they were evenly scattered only to the right boundary region of the model, as shown in Figure 6a, which was different from the slurry particles that were randomly distributed within the entire computational domain. Those tracer particles were tangential to the right boundary of the model, which mimics the situation that the tracer particles were scattered onto the inside surface of the observation window in the actual PIV test. As for the membrane, the constituting particles were fixed in space throughout the simulation. The pure water region merely serves to provide extra space for the continuous movement of particles that have passed through the membrane.
The particle size distribution of the actual slurry that was sampled from Wenzhou of eastern China is shown in Figure 7. It was observed that the particle size generally confines to the range of 2~50 μm with the median size d50 ≈ 20 μm. To make a reasonable representation of the actual slurry and also to reasonably simplify the modeling work, uniformly-sized spherical particles of diameter d = 10 μm were adopted here to model the slurry. It was noted that d = 10 μm was less than D = 20 μm, which means the slurry particles were able to pass the membrane. Two concentrations of slurry particles that can be equivalently expressed as the initial void ratio e0 = 2 and 3 were considered for the slurry.
One of the commonly used tracers is dark carbon powder that has a minimum diameter of about 16 μm. Correspondingly, tracers of three diameters were considered in the model, i.e., dt = 16, 18, and 25 μm. Additionally, two mass densities ρt = 2000 and 2650 kg/m3 were specified for the tracer to consider the tracers of different material origin, e.g., carbon powders and sand grains. Under the different combinations of the initial void ratio e0 of the slurry, the diameter dt and the mass density ρt of the tracer, 8 modeling cases were considered in the present paper, which is summarized in Table 4, together with the geometry and material parameters of the solid and fluid phases. The different cases can cover a wide spectrum of the PIV model tests on the dredged slurry.

4.3. Boundary Conditions

The wall boundary conditions were adopted for the DEM domain. As for the CFD domain, on the top and the bottom surfaces of the model, the zero-gradient and the fixed-value boundary conditions, i.e., the patch boundary condition, were assigned to the fluid velocity and the pressure, respectively; on the front and back surfaces, the symmetrical boundary conditions were prescribed; for the right side surface that was tangential to the tracers, the wall boundary condition was applied; and for the left side surface, the periodic boundary condition was specified. The above boundary conditions have been indicated in Figure 6b.
In the engineering practice, the designed value of vacuum pressure P was generally 80 kPa, and the spacing s between PVDs was about 1.4 m. Then the maximum pressure gradient across the slurry can be estimated as i = P/(s/2) = 114 kPa/m. However, the actual pressure gradient is usually smaller than 114 kPa/m since the vacuum pressure at soil increases along with the consolidation process. In the numerical model, the thickness of the slurry and the pressure difference was set to 0.3 mm and 30 Pa, respectively. Then, the corresponding pressure gradient was 100 kPa/m, which was close to i = 114 kPa/m in practice. The pressure gradient was achieved by setting zero (Pa = 0 Pa) and negative pressures (Pb = −30 Pa) to the top and bottom surfaces of the CFD domain, respectively.

5. Numerical Results

The slurry particles and the tracers move together toward the drainage board filter membrane under the vacuum gradient. However, their displacements should not be the same due to the differences in physical properties such as particle size and density. As shown in Table 4, eight cases considering different combinations of the tracer density (ρt), tracer size (dt), and initial void ratio (e0) of the dredged slurry. As shown in Figure 6b, a statistical region of 25 × 100 × 85 μm in length × width × height was defined within the particle-fluid mixed region. The particles in the statistical region were sufficiently away from the PVD membrane and thus had large space for movement, which was beneficial to obtaining more particle movement information.
Figure 8 compares the time variation of the ratio (Dt/Ds) between the statistical displacements of the tracers Dt and the slurry particles Ds for three cases of dt/ds = 1.6, 1.8, and 2.5, i.e., Cases 1~3 in Table 4. The mass density of the tracer and the initial void ratio of the slurry were taken as ρt = 2650 kg/m3 and e0 = 3, respectively. Obviously, better representativeness of the tracer for the slurry particles can be achieved when Dt/Ds is closer to 1. It can be seen from the figure that Dt/Ds tends to be stable after the previous fluctuations. The stable values of Dt/Ds in Cases 1~3 were 1.042, 1.089, and 1.137, respectively. The observations indicate that the representativeness of the tracer decreases when the diameter ratio between the tracer and the slurry particle (dt/ds) increases.
By reducing the mass density ρt of the tracer from 2650 kg/m3 to 2000 kg/m3 and keeping e0 = 3, Figure 9 compares the variation of Dt/Ds with t for the same diameter ratios dt/ds = 1.6, 1.8, and 2.5 (i.e., Cases 5~7 in Table 4). By comparing Figure 9 to Figure 8, it can be seen that the mass density of the tracer had little effect on the variation of Dt/Ds with time. However, the stable values of Dt/Ds were reduced, i.e., the reductions were about 1.4%, 3.5%, and 10%, respectively, for dt/ds = 1.6, 1.8, and 2.5.
Figure 10 summarizes the variations of the stable values of Dt/Ds with dt/ds for the two mass densities of the tracer, i.e., ρt = 2650 kg/m3 and 2000 kg/m3. It can be seen from the figure that the stable value of Dt/Ds increased with the mass density ratio ρt/ρs, which means the representativeness of the tracer decreased. Among the Cases 1~3 and 5~7 considered in Figure 10, the tracer of diameter 18 μm and of mass density 2000 kg/m3, i.e., Case 6, provided the best representativeness on the displacement response of the slurry particles.
For slurries of different particle concentrations, the variations of Dt/Ds with t were compared in Figure 11a for two initial void ratios, i.e., e0 = 2 and 3. In producing Figure 11a, the diameter and mass density of the tracer were, respectively, taken as dt = 18μm and ρt = 2650 kg/m3, i.e., Cases 2 and 4. By changing ρt = 2650 kg/m3 to 2000 kg/m3, the Cases 2 and 4 become Cases 6 and 8, for which the corresponding results are presented in Figure 11b. For both considerations on the mass densities, it was seen that the stable values of Dt/Ds increased with e0, which means the representativeness of the tracer became worse for slurries of higher initial void ratio. Comparing Figure 11a,b, it can also be found that the representativeness of the tracer increased when the density of the tracer decreased. For all of the eight cases considered in Table 4, Case 8 gives the best representativeness on the displacements of the slurry particles that were driven by the vacuum gradient.

6. Discussions

From the eight cases in Table 4 that cover the common ranges of material parameters governing the PIV model tests on the dredged slurry, the stable displacement ratio (Dt/Ds) between the tracer and the slurry particle varies between 0.935 and 1.137. The representativeness of the tracer is acceptable if compared to the ideal value Dt/Ds = 1, i.e., the largest difference is about 14%. Particularly for the commonly used tracers, the carbon powder of mass density 2000 kg/m3, it is observed from Cases 5~8 that Dt/Ds varies in the range of 0.935~1.05 if the carbon powder is of diameter ratio dt/ds within 1.8. The largest difference is only about 6.5%, which means the motions of the slurry particles can be reliably represented by the carbon powders. It is suggested that for the slurry of high-water content, the carbon powder of diameter close to the median size of the slurry particles should be used. Moreover, for a slurry of higher particle concentration, i.e., lower water content, the size of the carbon powder can be slightly increased to facilitate the observations of the PIV camera.

7. Conclusions

In this paper, a mesoscopic model has been established by using coupled CFD-DEM solver SediFoam to reproduce the vacuum consolidation process of the slurry, in which the PVD (Prefabricated Vertical Drain) membrane, the slurry particles, and the tracers are described by the DEM, and the pore water is governed by the CFD method. Eight computational cases that cover a broad range of material parameters governing the PIV model tests on vacuum consolidation of the dredged slurry have been designed and investigated by the established CFD-DEM model. The representativeness of the PIV tracer is evaluated by comparing the statistic displacement of the tracer to that of the slurry particles. The following conclusions can be drawn:
(1)
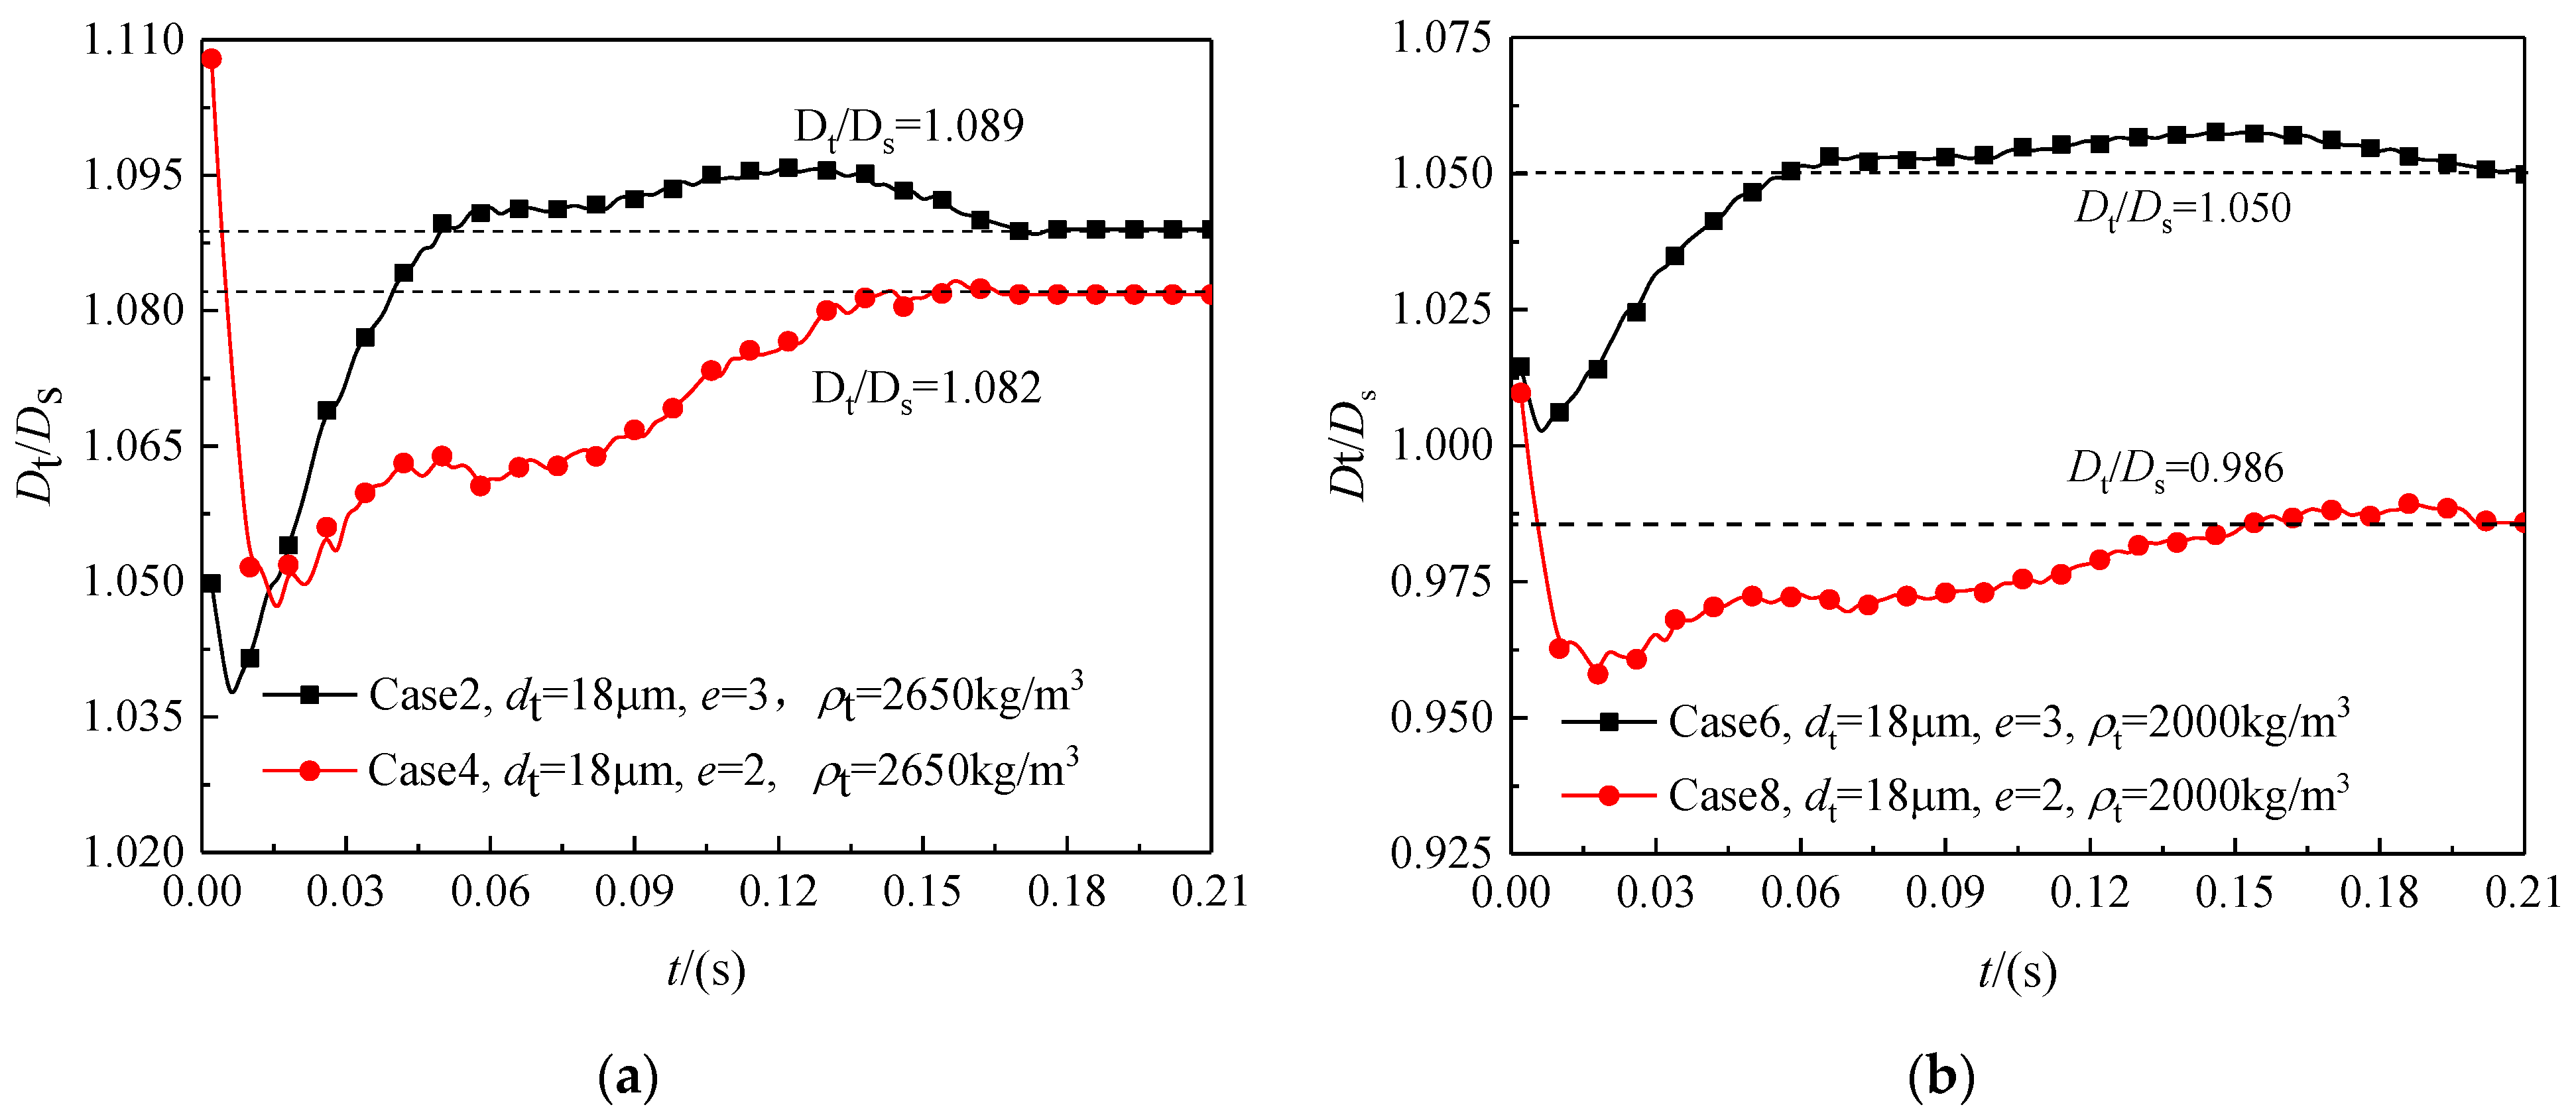
For tracers that are made by carbon powders of mass density 2000 kg/m3 or by sand grains of mass density 2650 kg/m3, the stable displacement ratio (Dt/Ds) between the tracer and the slurry particle varies between 0.935 and 1.137 if the tracer/slurry particle diameter ratio dt/ds and the initial void ratio e0 of the slurry varies in the ranges of 1.6~2.5 and 2~3, respectively. Thus, the representativeness of the tracer is acceptable if compared to the ideal value Dt/Ds = 1, since the largest difference is about 14%.
(2)
For tracers made by the carbon powders of diameter within 1.8 times the median size of the slurry particles, the representativeness of the PIV tracers can be significantly improved since the displacement ratio Dt/Ds varies in the small range of 0.935~1.05, i.e., the largest difference is only about 6.5%.
(3)
Generally speaking, the representatives of the PIV tracers on the displacements of the slurry particles can be improved for tracers of dt/ds closer to 1 and for slurries of lower initial water content, i.e., lower initial void ratio e0.

Author Contributions

Conceptualization, L.S. and Z.F.; methodology Y.Y., J.W. and L.S.; software, G.W.; validation, Z.F., Y.Y. and G.W.; formal analysis L.S.; writing—original draft preparation, Z.F.; writing—review and editing, L.S., Z.Y., K.Y. and J.H. All authors have read and agreed to the published version of the manuscript.

Funding

This research was funded by the Natural and Science Foundation of China, grant number 51879234.

Conflicts of Interest

The authors declare no conflict of interest.

Abbreviations

Φsthe solid volume fraction
Φffluid volume fraction
Usthe velocity of the particle
Ufthe fluid velocity
p the pressure gradient
τthe viscous stress tensor
ρfthe density of the fluid
ffpthe volumetric interaction force acting on the fluid by the particles within each cell
g the acceleration of gravity
fcolthe contact force between the particles or between the particle and the fixed boundary
ffpthe fluid-particle interaction force
Ithe angular moment of inertia of particles
φthe angular velocity of the particle
Tcolthe torque due to the collision between particles
Tfpthe torque due to the particle-fluid interactions
cfthe volume fraction of the fluid
csthe volume fraction of the solid
V(s,c)the settling rate when the concentration of suspended particles is c
V(s,0)the settlement rate of a single suspended particle
nthe empirical parameter in different fluid states
dthe diameter of spherical particles
Dthe diameter of the model vessel
Reknown as Reynolds number
vthe dynamic viscosity of the fluid

References

  1. Chu, J.; Yan, S.; Yang, H. Soil improvement by the vacuum preloading method for an oil storage station. Géotechnique 2000, 50, 625–632. [Google Scholar] [CrossRef]
  2. Indraratna, B.; Bamunawita, C.; Khabbaz, H. Numerical modeling of vacuum preloading and field applications. Can. Geotech. J. 2004, 41, 1098–1110. [Google Scholar] [CrossRef]
  3. Cai, Y.; Xie, Z.; Wang, J.; Wang, P.; Geng, X. New approach of vacuum preloading with booster prefabricated vertical drains (PVDs) to improve deep marine clay strata. Can. Geotech. J. 2018, 55, 1359–1371. [Google Scholar] [CrossRef]
  4. Wang, J.; Ni, J.; Cai, Y. Combination of vacuum preloading and lime treatment for improvement of dredged fill. Eng. Geol. 2017, 227, 149–158. [Google Scholar] [CrossRef]
  5. Lei, H.; Hu, Y.; Zheng, G.; Liu, J.; Wang, L.; Liu, Y. Improved air-booster vacuum preloading method for newly dredged fills: Laboratory model study. Mar. Georesour. Geotechnol. 2020, 38, 493–510. [Google Scholar] [CrossRef]
  6. Cai, Y.; Qiao, H.; Wang, J.; Geng, X.; Wang, P. Experimental tests on effect of deformed prefabricated vertical drains in dredged soil on consolidation via vacuum preloading. Eng. Geol. 2017, 222, 10–19. [Google Scholar] [CrossRef]
  7. He, N.; Cui, Y.; Liu, L.; Chen, X.; Feng, Q.; Deng, Y. Colloid effect on clogging mechanism of hydraulic reclamation mud improved by vacuum preloading. Can. Geotech. J. 2019, 56, 611–620. [Google Scholar]
  8. Shi, L.; Wang, Q.; Xu, S.; Pan, X.; Sun, H.; Cai, Y. Numerical study on clogging of prefabricated vertical drain in slurry under vacuum loading. Granul. Matter 2018, 10, 20–74. [Google Scholar] [CrossRef]
  9. Cai, Y.; Zhou, Y.; Wang, P.; Shi, L.; Wang, J. Calculation on settlement of dredged slurry treated by vacuum preloading method with consideration. Rock Soil Mech. 2020, 11, 1–10. [Google Scholar]
  10. Sun, R.; Xiao, H. SediFoam: A general-purpose, open-source CFD–DEM solver for particle-laden flow with emphasis on sediment transport. Comput. Geosci. 2016, 89, 207–219. [Google Scholar] [CrossRef] [Green Version]
  11. Chen, F.; Drumm, E.C.; Guiochon, G. Coupled discrete element and finite volume solution of two classical soil mechanics problems. Comput. Geotech. 2011, 38, 638–647. [Google Scholar] [CrossRef]
  12. Zhao, J.; Shan, T. Coupled CFD–DEM simulation of fluid–particle interaction in geomechanics. Powder Technol. 2013, 239, 248–258. [Google Scholar] [CrossRef]
  13. Xu, S.; Sun, R.; Cai, Y.; Sun, H. Study of sedimentation of non-cohesive particles via cfd–dem simulations. Granul. Matter 2018, 20, 4. [Google Scholar] [CrossRef] [Green Version]
  14. Tao, H.; Tao, J. Quantitative analysis of piping erosion micro-mechanisms with coupled CFD and DEM method. Acta Geotech. 2017, 12, 1–20. [Google Scholar] [CrossRef]
  15. Sun, H.; Xu, S.; Pan, X.; Shi, L.; Cai, Y. Investigating the jamming of particles in a three-dimensional fluid-driven flow via coupled CFD-DEM simulations. Int. J. Multiph. Flow 2019, 114, 140–153. [Google Scholar] [CrossRef] [Green Version]
  16. Xu, S.; Sun, H.; Cai, Y.; Geng, X. Studying the orifice jamming of a polydispersed particle system via coupled cfd–dem simulations. Powder Technol. 2020, 368, 308–322. [Google Scholar] [CrossRef]
  17. Adrian, R.J. Particle-imaging techniques for experimental fluid-mechanics. Annu. Rev. Fluid Mech. 1991, 23, 261–304. [Google Scholar] [CrossRef]
  18. Yuan, B.; Sun, M.; Wang, Y.; Zhai, L.; Luo, Q. Full 3D displacement measuring system for 3D displacement field of soil around a laterally loaded pile in transparent soil. Int. J. Geomech. 2019, 19, 04019028. [Google Scholar] [CrossRef]
  19. Ahmed, M.; Iskander, M. Evaluation of tunnel face stability by transparent soil models. Tunn. Undergr. Space Technol. 2012, 27, 101–110. [Google Scholar] [CrossRef]
  20. Zhang, Z.; Tao, F.; Han, J.; Ye, G.; Cheng, B.; Xu, C. Arching development in transparent soil during multiple trapdoor movement and surface footing loading. Int. J. Geomech. 2021, 21, 04020262. [Google Scholar] [CrossRef]
  21. Pan, X.; Zhou, L.; Sun, H.; Cai, Y.; Shi, L.; Yuan, Z. Vacuum loading test for high moisture content slurry using particle image velocimetry. J. Zhejiang Univ. Eng. Sci. 2020, 54, 1078–1085. [Google Scholar]
  22. Cai, Y. Consolidation mechanism of vacuum preloading for dredged slurry and anti-clogging method for drains. Chin. J. Geotech. Eng. 2021, 43, 201–225. [Google Scholar]
  23. Richardson, J.F.; Zaki, W.N. Sedimentation and Fluidization: Part, I. Chem. Eng. Res. Des. 1997, 75, S82–S100. [Google Scholar] [CrossRef]
  24. Narejo, D.B. Opening size recommendations for separation geotextiles used in pavements. Geotext. Geomembr. 2003, 21, 257–264. [Google Scholar] [CrossRef]
  25. Liu, L.; Chu, C. Modeling the slurry filtration performance of nonwoven geotextiles. Geotext. Geomembr. 2006, 24, 325–330. [Google Scholar] [CrossRef]
  26. Tang, L. Pore Size Characteristics and Filtration Properties of Geotextiles Subjected to Tensile Strains; Zhejiang University: Hangzhou, China, 2014. [Google Scholar]
Figure 1. Flow path of SediFoam.
Applsci 11 09715 g001
Figure 2. Numerical model on settlement of multiple particles.
Applsci 11 09715 g002
Figure 3. Variation of settling velocity of a uniformly sized spherical particle with the particle concentration.
Applsci 11 09715 g003
Figure 4. Structure of a PVD membrane of woven fabric.
Applsci 11 09715 g004
Figure 5. Numerical modeling on PVD membrane: (a) DEM modeling on PVD membrane, (b) schematic plan view on the membrane.
Applsci 11 09715 g005
Figure 6. Diagram of the numerical model: (a) three-dimensional model, (b) model structure.
Applsci 11 09715 g006
Figure 7. Particle size distribution of dredged slurry sampled from Wenzhou.
Applsci 11 09715 g007
Figure 8. Variations of displacement ratio Dt/Ds between tracer and slurry particle with respect to time t under conditions of ρt = 2650 kg/m3, e0 = 3 and dt/ds = 1.6, 1.8 and 2.5.
Applsci 11 09715 g008
Figure 9. Variations of displacement ratio Dt/Ds between tracer and slurry particle with respect to time t under conditions of ρt = 2000 kg/m3, e0 = 3, dt/ds = 1.6, 1.8, and 2.5.
Applsci 11 09715 g009
Figure 10. Variations of stable values of the displacement ratio Dt/Ds with respect to the tracer diameter dt for two mass densities of the tracer, ρt = 2000 kg/m3 and 2650 kg/m3.
Applsci 11 09715 g010
Figure 11. Variations of displacement ratio Dt/Ds between tracer and slurry particle with respect to time t under conditions of e0 = 2, 3 and dt = 18 μm: (a) ρt = 2650 kg/m3; (b) ρt = 2000 kg/m3.
Applsci 11 09715 g011
Table 1. Parameters of sedimentation model of multiple particles.
ParameterSymbolValue
Case1Case2Case3Case4
Particle-DEM
NumberN195519104775
Concentrationc00.050.10.25
Diameter/(m)ds0.0010.0010.0010.001
Mass density/(kg/m3)ρs2650265026502650
Stiffness/(N/m)kn/kt500/143500/143500/143500/143
Damping/(N/ms)γnt20,000/10,00020,000/10,00020,000/10,00020,000/10,000
Friction coefficientμ0.40.40.40.4
Fluid-CFD
Mass density/(kg/m3)ρf1000
Viscosity/(m2/s)v10−6
Gravity (m/s2)g9.8
Domain dimensions
Length/(m)L0.01
Wide/(m)W0.01
Height/(m)H0.2
Mesh size/(m) 0.002 × 0.002 × 0.002
Table 2. Predictions of the Richardson empirical formula.
ParameterSymbolValue
Diameter/(m)D0.02
Particle size/(m)d0.001
Reynolds numberRe141
Empirical coefficientn3.8103
Particle concentrationc00.050.100.250.500.750.900.951.00
Velocity/(m/s)V(s,c)0.1410.1160.09440.04710.01010.0007170.00002180.000001560
Table 3. Index properties of PVD.
TypeType AType BType CType DTest Condition
Parameter
Installation depth/(m)≤15≤25≤35≤50
Drainage capacity/(1000 mm3/s)≥15≥25≥40≥55Lateral pressure 350 kPa
Permeability coefficient of membrane/(10 mm/s) ≥5 × 10⁻⁴Immersed in water for 24 h
Equivalent aperture diameter of membrane/(mm)<0.075O95
Tensile strength of PVD/(kN/100 mm)≥1.0≥1.3≥1.5≥1.8Elongation reached 10%
Tensile strength of membrane/(N/10 mm)Dry state≥15≥25≥30Elongation reached 10%
Wet state≥10≥20≥25Immersed in water for 24 h when elongation reached 10%
Table 4. Modeling cases and parameters of dredged slurry and PIV tracers.
ParameterSymbolValue
Particle—PVD membrane
Number 336
Diameter/(m)d5 × 10−6
Density
/(kg/m3)
ρ500
Particle—Slurry particle
Case1Case2Case3Case4Case5Case6Case7Case8
Number 17511340140017761751134014001776
Diameter/(m)ds1.0 × 10−5
Density
/(kg/m3)
ρs2650
Void ratioe033323332
Slurry Thickness/(m)h3 × 10−43 × 10−43 × 10−43 × 10−43 × 10−43 × 10−43 × 10−43 × 10−4
Particle—Tracer particle
Number 20125122012512
Diameter/(m)ds1618251816182518
Density
/(kg/m3)
ρs26502650265026502000200020002000
Particle—DEM
Stiffness
/(N/m)
kn/kt500/143
Damping/(N/ms)γnt20,000/10,000
Friction coefficientμ0.4
Fluid—CFD
Density/(kg/m3)ρf1000
Viscosity/(m2/s)v1.0 × 10−6
Gravity/(m/s2)g9.8
Domain dimensions
Height/(m)H4 × 10−4
Width/(m)W1 × 10−4
Length/(m)L1 × 10−4
Publisher’s Note: MDPI stays neutral with regard to jurisdictional claims in published maps and institutional affiliations.

