Article

A Computational Study on the Aeroacoustics of a Multi-Rotor Unmanned Aerial System

1
Department of Mechanical Engineering, University of North Texas, Denton, TX 76207, USA
2
US Army Research Laboratory, Aberdeen Proving Ground, MD 21005, USA
*
Author to whom correspondence should be addressed.
Appl. Sci. 2021, 11(20), 9732; https://doi.org/10.3390/app11209732
Submission received: 13 September 2021 / Revised: 5 October 2021 / Accepted: 7 October 2021 / Published: 18 October 2021

Abstract

:
The noise generated by a quadrotor biplane unmanned aerial system (UAS) is studied computationally for various conditions in terms of the UAS pitch angle, propellers rotating velocity (RPM), and the UAS speed to understand the physics involved in its aeroacoustics and structure-borne noise. The k-ω SST turbulence model and Ffowcs Williams-Hawkings equations are used to solve the flow and acoustics fields, respectively. The sound pressure level is measured using a circular array of microphones positioned around the UAS, as well as at specific locations on its structure. The local flow is studied to detect the noise sources and evaluate the pressure fluctuation on the UAS surface. This study found that the UAS noise increases with pitch angle and the propellers’ rotating velocity, but it shows an irregular trend with the vehicle speed. The major source of the UAS noise is from its propellers and their interactions with each other at small pitch angle. The propeller and CRC-3 structure interaction contributes to the noise at large pitch angle. The results also showed that the propellers and structure of the UAS impose unsteadiness on each other through a two-way mechanism, resulting in structure-born noises which depend on the propeller RPM, velocity and pitch angle.

1. Introduction

The remarkable progress in manufacturing electric batteries in recent decades has facilitated the development of vertical take-off and landing (VTOL) multi-rotor unmanned aerial systems (UAS), which may be utilized for a wide range of tasks such as reconnaissance, package delivery, aerial resupply, and surveillance, among others [1,2,3]. While such systems have a great range of movement and maneuverability [1], their major issues including efficiency and noise emission have recently grabbed the scientific community’s attention. Among these challenges, resolving the noise emission is relatively more demanding, due to recently raised concerns regarding negative effect on military applications, civil usage, and the environment. Some examples are cardiovascular and metabolic disease [4], sleep disturbance [5], depression and anxiety [6], and chronic stress [7], which are considered side effects of long-term exposure to the UAS noise [8].
Most studies on the noise signatures in the literature are on an isolated propeller, focusing on several aspects including geometry effect [9,10,11], number of blades and spacing effects [12,13,14], and coaxial rotors [15,16,17]. Studies have also investigated the effect of operational conditions on noise level [18,19,20]. For instance, it is known that an increase in inflow velocity causes growth in sound pressure level (SPL), which is ascribed to the asymmetry between advancing and retreating blades at high velocity [18]. The same effect is observed for increasing RPM, which results in rise of SPL in tonal and broadband noises [19].
Broadband noise is often due to the interaction of rotor blades with turbulence, resulting in random blade loading variations [21]. It is also reported that the vortex shedding noise and flow separation on the blades manifest as a second hump in the broadband noise of an isolated propeller [22]. Furthermore, increase in the pitch angle decreases SPL at first and second blade pass frequencies (BPF) [18,20].
While the major source of noise in the UAS is propellers, the propeller interaction with UAS structures has a significant contribution to the UAS noise signature, particularly for some of the novel multi-rotor UAS designs with hybrid configurations (e.g., quadrotor biplane tail-sitter VTOL [1]), in which propellers’ wake and tip vortices might even interact with fixed wings used to enhance the UAS efficiency in forward flight mode. Such an interaction imposes unsteady loads on the UAS structure (wing and fuselage) and propeller blades, which are the source of the structure-born noises and alter the noise level [23,24,25,26,27,28,29,30,31,32]. In an experimental study, Sinnige [29] found that for a tractor configuration of a propeller–wing–nacelle system, the noise due to the propeller–wing interaction may be reduced by decreasing the propeller loading, because the blade tip vortices are the main source of structure-born noise. Sinnige [29] also showed that the noise level increases with decreasing propeller advance ratio ( J = U 0 / n D p , with U 0 , n and D p denoting the inflow velocity ( m / s ), rotating speed (rev/s) and propeller diameter ( m )) by increasing the propeller’s rotating speed. Similar finding was also reported in [32]. However, such a relationship between noise and propeller advance ratio is not always the case, because the unsteady loading is not monotonically dependent on J [29]. The noise level was also shown to be correlated with the spacing between the propeller and the wing/fuselage such that increasing the spacing would reduce the load fluctuation and consequently the corresponding interference noise [29]. Akkermans et al. [32] investigated the effect of pitch angle on the noise generated by the propeller–wing system and have shown that this effect is negligible, although it should be noted that the tested range was limited to 5 ° < θ < 10 ° . A similar study was conducted by Boots [33] for three angles of attack, including θ = 0 ° , 3 ° , and   6 ° , where results suggested that the noise level at the first BPF remains unchanged with increase in θ , while it increases at higher harmonics. This discrepancy between the results of the two studies may be due to having different configurations or using different coordinate systems. Boots [33] has also found that for a configuration of a single propeller, a wing and a fuselage, the sound emitted from the fuselage surface is smaller than that of the wing, since it experiences a smaller amount of load and interaction with the propeller’s wake.
Apart from the noise generated due to interaction of the propeller with wing-nacelle-fuselage, some recent studies have focused on the sound generated by multirotor configurations, which is a common configuration for recent UAS [3]. It is observed that the SPL generated by two counter-rotating propellers is higher than that of a single propeller, and the increase is dominant at BPF, suggesting mainly increase in tonal noise [34,35]. Additionally, tilting the propellers shifts the location of maximum SPL downstream. Increasing the number of propellers to four, leads to a significant growth in noises at high-frequency or broadband noise [22], in addition to manifestation of a low-frequency disturbance, which is not present in the isolated propeller noise spectra [36]. When the spacing between the tip of the adjacent propellers in a quadrotor is small, the level of fluctuations they impose on each other’s loads becomes significant [35]. Studies have also shown the rotation direction of multiple rotors affects the noise generation when lifting surfaces such as wings are immersed in the propeller wakes. For instance, the CFD analysis of two counter-rotating propellers interacting with a wing, conducted by Chirico et al. [37] showed that the top-in layout results in lower noise generation while the top-out layout provides a better aerodynamic efficiency due to the swirl effect.
Although, the UAS noise signature has been investigated in several studies as mentioned earlier, these studies are often not for a fully appended UAS and limited to a narrow range of operational conditions. The aim of the present work is to provide a comprehensive acoustics analysis around a biplane tailsitter quadrotor that initially takes off vertically, in hover mode, and then changes its pitch angle and flies horizontally to use wings for the forward mode flight to enhance its performance. To understand the acoustic signature of such a quadrotor, a wide range of pitch angles covering hover and transition modes, as well as different vehicle velocity and propeller RPM are considered. The physics involved in the acoustics performance of the vehicle is discussed by comparing SPL at various locations and their correlations with local flow characteristics. In addition, the role of different interaction mechanisms on the CRC-3 noise level as well as the structure-born noise due to unsteady loadings are discussed.

2. Materials and Methods

2.1. CFD Method

Our in-house code CFDFOAM is used for the simulations [38,39]. The CFDFOAM solver has been developed around OpenFOAM for hydrodynamic and aerodynamic applications using either absolute or relative inertial coordinate systems with non-deforming and deforming control volumes. It utilizes conventional body-fitted methods as well as immersed boundary methods for moving/morphing boundaries based on the cell-centered finite volume method. In the present work, absolute inertial earth-fixed coordinates are employed with k-ω SST turbulence model, where the coupled pressure and velocity are solved using PISO. Second order linear upwind and central-differencing schemes are employed for discretization of convective and diffusion terms of the governing equations, respectively, and the Euler scheme is used for time discretization.

2.2. Acoustics Method
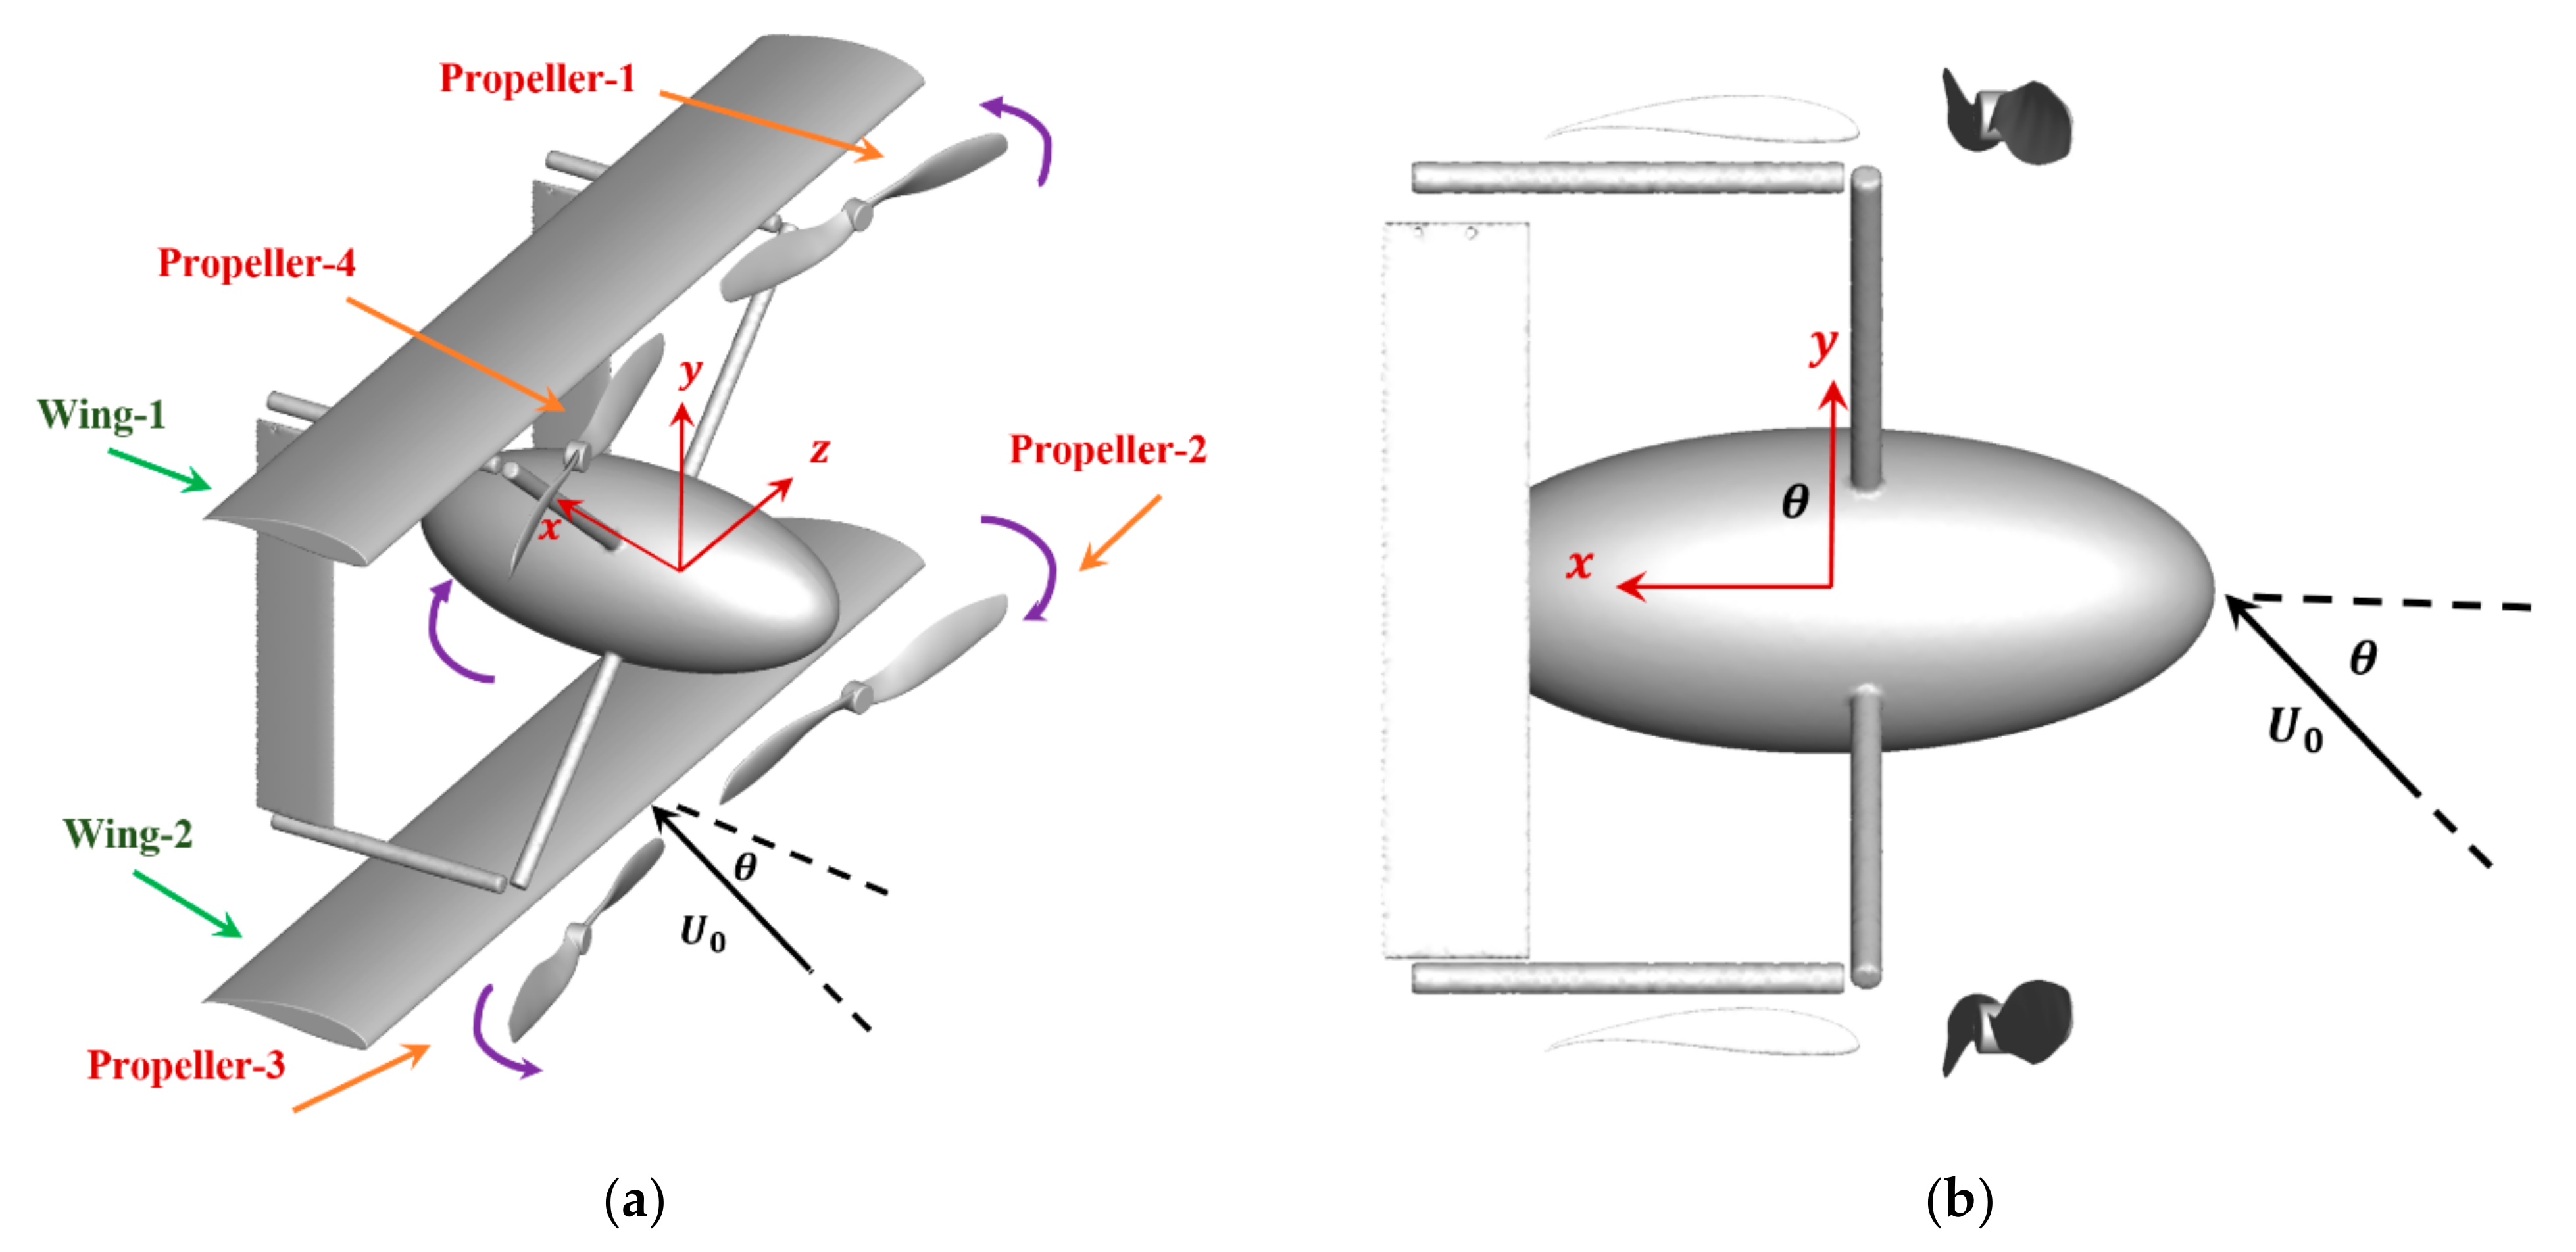
The libacoustics solver, implemented for OpenFOAM [40], is used for acoustics simulations in which the Ffowcs Williams-Hawkings (FW-H) formulation developed by Ffowcs Williams and Hawkings [41] is employed to predict the sound pressure level. The FW–H method is a generalized form of Lighthill’s acoustic analogy [42] to include general motion types and surfaces effects. It is an inhomogeneous wave equation form of the Navier–Stokes equations, with three source terms, including thickness and loading on the body surface and quadrupole in the volume surrounding the body, and may be written as [43]:
2   p   x , t = ¯ t   ρ 0   v n   δ f ¯ x i   l i   δ f + ¯ 2 x i x j   T i j   H f
where 2 is the D’Alembertian operator in the three-dimensional space, v n is the local velocity of the body normal to the surface defined by f = 0 ,   δ f and H f are the Dirac delta function and the Heaviside step functions, l i is components of the local force on the surface and T i j is the Lighthill’s stress tensor. The first, second and third term on the right-hand side of Equation (1) represent thickness, loading and quadrupole source terms, respectively.

2.3. CRC-3 Geometry

The geometry considered in the present study belongs to the common research configuration (CRC) group, which refers to a set of tail-sitter hybrid quadrotors designed by the Army Research Lab (ARL). The CRC geometries are comprised of four identical propellers, two identical wings, and fuselage, as shown in Figure 1. The rotors are mounted in a tractor configuration with a canting angle of 10° and their rotation directions are shown in Figure 1. CRC is designed at different sizes and the one with the smallest size is employed for this study, which has a weight of 3 lbs (1.36 kg) and a design speed of 40 mph (17.88 m/s), named CRC-3 [3]. The propellers for CRC-3 are RAYCorp 8045 propellers with a diameter ( D p ) of 0.205   m . The wing type is Wortmann FX 63-137A4 with an aspect ratio of 2.8.
The elliptical fuselage has principle diameters of 0.214   m , 0.09   m , and 0.09   m in x , y , and z directions, respectively. The main geometrical parameters of CRC-3 are listed in Table 1.

2.4. Simulation Conditions

Fully appended CRC-3 simulations were carried out to investigate the effects of RPMs, velocities, and pitch angles on noise signature. Table 2 summarizes the CFD test matrix for simulations on CRC-3 with the label of each case to be used throughout the manuscript. Simulations were also conducted for other configurations including isolated propeller, only four propellers and only one propeller-one wing configuration for comparison. Moreover, several simulations are conducted for validation purposes using an isolated propeller, for which experimental data is available.
To evaluate the acoustic signature, a set of eight microphones positioned on a circle with a radius of 1.5 × D p from the CRC-3′s center of mass, on a plane passing through the rotation center of propellers 3 and 4 (see Figure 1), as shown in Figure 2a. The two limits of the pitch angle applied by changing the inflow velocity directions are also shown in this figure. In addition to the circular array of microphones, for each wing, two microphones are placed on the location of their interaction with the propeller’s tip vortices, and two microphones are also positioned on the fuselage, as demonstrated in Figure 2b.

2.5. Computational Domain, Grids, and Boundary Conditions

For all of the simulations discussed in Section 2.4, the computational domain is a sphere with a diameter of 18 D p , with the geometry located at center of the domain, as depicted in Figure 3. The grid of fully appended CRC-3 consists of five blocks, four circular blocks for four propellers, and one block for the rest of the computational domain. The sliding mesh technique is employed for rotating the propeller block in the computational domain. The CRC-3 grid has 16 million tetrahedral volume elements, of which around 80% of grid elements are packed near CRC-3 within a small sphere of radius 2 D p . To capture the acoustic waves, the grid is designed to resolve the first three harmonics of the acoustic wave. Since the 1st BPF is 200 Hz in simulations, the maximum frequency required to be resolved was assigned as 600 Hz with a wavelength of λ = c / f = 0.57   m , with c = 343   m / s for the standard speed of sound in air. Therefore, the maximum grid size was assigned 0.055   m in the region surrounding the geometry and microphones, which gives at least 10 grid points in acoustic wavelength, as recommended by Junger [44]. It should be noted that although the grid is not designed to spatially resolve higher than third harmonics, those harmonics may still be compared between cases to discuss trends.
Regarding the temporal discretization, the designed time step resulted in no more than 0.54 degree of rotation per time step for propellers for all RPM values, corresponding to time steps of 1.5 × 10 5   s and 0.75 × 10 5   s for cases with RPM = 6000 and RPM = 12,000 , respectively. Since the shortest period should be discretized with 10 to 20 steps through time [44], the aforementioned time-step values are small enough to temporally resolve noises up to 16th harmonic.
Figure 4 shows grid distribution on the surface of CRC-3 and on a slice in the computational domain and Table 3 lists more details of the grid distribution. On propeller and wing surfaces, the grid was designed with an average y + < 2.6 to resolve the turbulent boundary layer, while on other solid surfaces (fuselage and rest of appendages) larger grid spacing along with wall-functions were used to minimize the computational cost for modeling the turbulent boundary layer. The average values of y + for propeller and wing surfaces for all CRC-3 cases are provided in Table 4. Each side of the propeller’s blade consists of 80 grid elements on the chord and 220 on the span, resulting in a total of 64 K cells on the propeller surface. The wing’s surface poses 300 K grid elements with 600 on its chord and 1100 on its span. Finally, there are 44 K cells on the fuselage, with 94 in the vertical direction and 86 in the horizontal direction.
The boundary conditions consist of uniform velocity with zero pressure gradient on the far-field boundary and no-slip walls on the solid surfaces. Details of boundary conditions are provided in Table 5.

2.6. Grid Verification Study
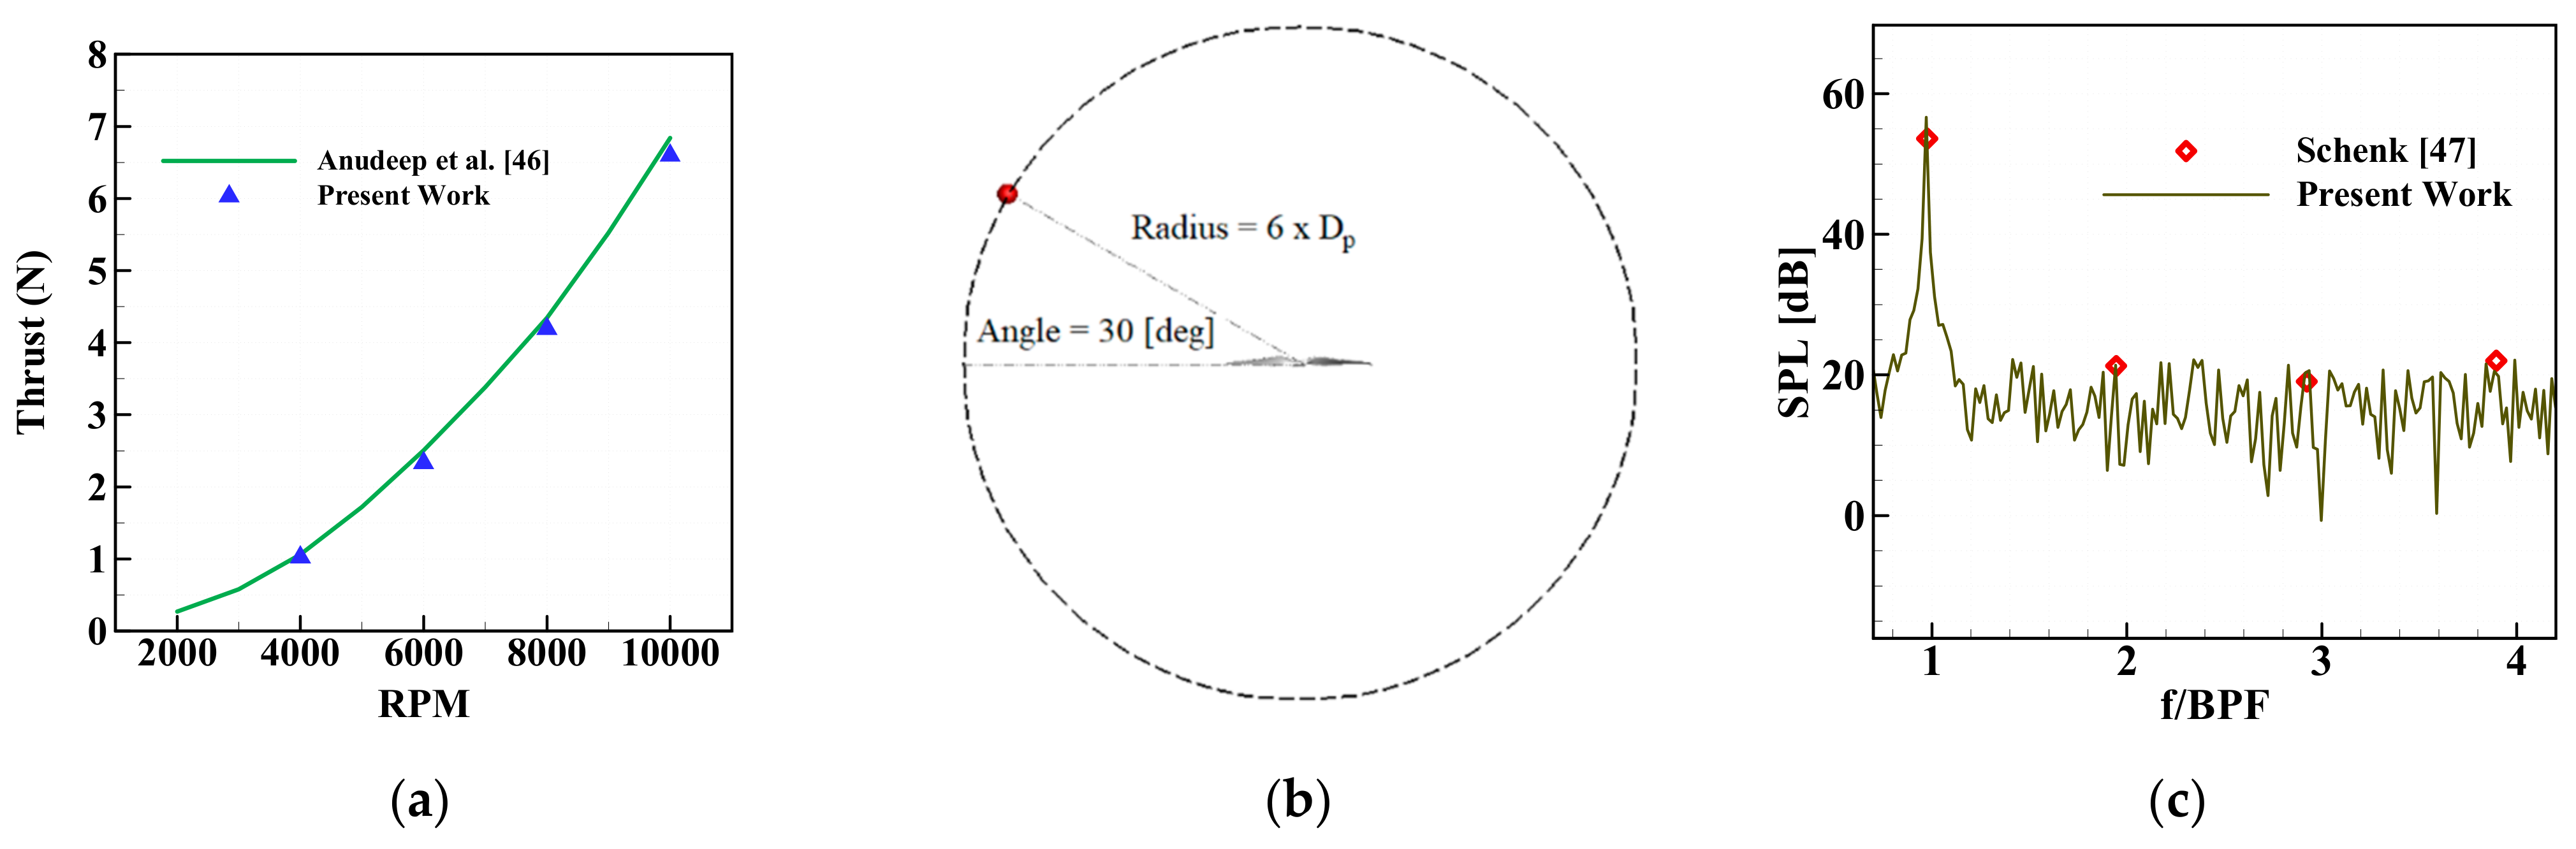
Grid verification study is conducted for the fully appended CRC-3 advancing at U 0 = 16   m / s with a pitch angle of θ = 0 ° and propellers rotating at RPM = 12,000 . For this purpose, coarse and fine grid systems are generated, where the average cell size of the aforementioned grid, which can be considered as a medium grid, is increased/reduced by a factor of r G = 2 in any direction to generate the coarse/fine grid system. The coarse and fine grids consist of about 3 million and 22 million elements, respectively.
Grid uncertainty is estimated using the factor of safety method [45] by identifying the convergence type of the simulation using the coarse (S3), medium (S2), and fine grid solutions (S1):
R G = ϵ 21 ϵ 32 = S 2 S 1 S 3 S 2   = 0 < R G < 1 : Monotonic   Convergence 1 < R G < 0 : Oscillatory   Convergence R G > 1 : Monotonic   Divergence R G < 1 : Oscillatory   Divergence
When monotonic convergence is achieved, the grid uncertainty is computed as:
U G = 9.6 1 C F 2 + 1.1   δ                                           1 C F < 0.125         2 1 C F + 1 δ                                                   1 C F 0.125                      
where
C F = r p G 1 r p t h 1
where p t h is the theoretical order of accuracy ( p t h = 2 ) and p G is the numerical order of accuracy, defined as:
p G = ln R G / ln r G
In addition, the error estimation, δ is computed as:
δ = ϵ 21 r G 2 1
When oscillatory convergence is achieved, the range of variation in the solutions is computed as the level of uncertainty. The obtained uncertainty values are normalized by the solution for the fine grid S 1 .
Figure 5 shows the predicted time histories of thrust coefficient C T for propeller and lift coefficient C l on the wing as well as directivity of the overall sound pressure level (OASPL) for all of the grids. OASPL is calculated for the first 3 harmonics using Equation (7):
OASPL = 10 l o g 10 1 3 10 S P L i 10
It should be noted that grid study is conducted for a half-domain case with a symmetric boundary condition passing through the center of the geometry and normal to the z direction, to decrease computational cost, as the full CRC-3 case is symmetric with respect to the described plane. Mean parameters are computed and listed in Table 6, which indicate monotonic convergence for C T , C l and average OASPL with R G = 0.47 , R G = 0.68 and R G = 0.48 , respectively. The average of the numerical accuracy is about 2.24 , close to the theoretical accuracy of the second order discretization scheme used for the spatial terms in governing equations. More importantly, the estimated grid uncertainty U G % S 1 for mean C T , mean C l and OASPLave is 1.75 %   S 1 , 4.4 % S 1 , and 4.4 %   S 1 , respectively, which confirms that grid uncertainty is reasonably small for the designed grids.

2.7. Validation

Simulations for an isolated propeller of CRC-3 at static condition at various rotating velocities are conducted to validate the results against experimental data of Anudeep et al. [46]. The predicted thrust values show a close agreement with experimental data with an average error of 4.5 % , as shown in Figure 6a. Since there is not any acoustic data available for CRC-3, the solver is validated for another isolated propeller, the APC 10 × 7E propeller for which acoustic data is reported by Schenk [47]. The SPL spectrum for the APC propeller is calculated on a microphone located on a plane passing through the propeller center and normal to its disk plane, at a radial distance of 6 D p and an angle of 30° with respect to the horizontal direction, as shown in Figure 6b. Dimensions in the figure are adjusted to make the propeller visible. A comparison between the present work and that of Schenk [47] demonstrated in Figure 6c shows a good agreement at BPF and its harmonics.

3. Results and Discussion

3.1. Sound Pressure Level

3.1.1. Interaction Effects

The noise sources of CRC-3 include propeller-tip vortices and the interaction of the four propellers with each other as well as with the wings and the fuselage. In order to clarify how each of these sources contribute to the noise, simulations at U 0 = 7   m / s and RPM = 6000 were carried out for four different configurations as follows: (i) isolated propeller, (ii) a single propeller–wing system, (iii) only four propellers and (iv) CRC-3, for two pitch angles of θ = 0 ° and θ = 75 ° . A comparison is made between the four configurations on their SPL spectra at a microphone located in the downstream Φ = 180 ° (defined in Figure 2), SPL directivity at the first harmonic and the OASPL directivity, as shown in Figure 7. The isolated propeller spectrum shows peaks at BPF harmonics as expected, with some humps in the broadband noise part of the spectra, which is ascribed to the vortex shedding noise and flow separation on the blades [22]. It should be noted that, in the present work, the relative position of the microphones and the configurations studied were kept fixed with the changing pitch angle ( θ ), as shown in Figure 2. The isolated propeller spectrum in Figure 7 is independent from the pitch angle in BPF and experiences a slight growth in broadband noise as θ increases. For the propeller–wing configuration, increase in θ results in 3 dB increase in noise level at BPF, which is in contrast with the finding of Boots [33], in whose work the noise at BPF was not affected by the interaction between the propeller tip vortex and the wings. This is probably because the microphones were located at a distance of about 4 D p in that study comparing to 1.5 D p in this study. With increase in the pitch angle, case (ii) also experiences a larger increase in some other tonal harmonics, but broadband noise decreases. In addition, a new peak at BPF/2 appears. The appearance of this peak agrees with the findings Bernardnini [36] reported to the literature. The case with four-propellers also experiences 4–5 dB noise increase at BPF and a smaller level of increase in other tonal harmonics, except BPF/2, in which a 6–7 dB growth may be observed. The case with four-propellers also shows a negligible increase in broadband harmonics. Nevertheless, the noise level is significantly higher in the case of four propellers than that of the isolated propeller. It was previously reported that when the spacing between the tip of the adjacent propellers in a quadrotor is small, the degree of fluctuation they impose on each other’s loads becomes significant [35]. Unlike the first three configurations, CRC-3 experiences a large growth in noise by increasing pitch angle, i.e., a 21 dB increase in noise at BPF and BPF/2 and almost the same at other harmonics. The major cause of growth in CRC-3 noise from θ = 0 ° to θ = 75 ° is due to the interaction of the propellers with the wings and the fuselage.

3.1.2. Effect of Pitch

Figure 8 compares the SPL spectra on the microphone located downstream ( Φ = 180 ° ) for the isolated propeller case and CRC-3 at several pitch angles. The results for some of these pitch angles were not presented in Figure 7 for the sake of brevity. As previously shown in Figure 2, while the inflow velocity angle changes to evaluate the pitch effect, the relative position of microphones and propeller-3 (see Figure 1) remains unchanged. The isolated propeller experiences little to no change at BPF, while it experiences a slight increase in broadband noise. The rate of increase decreases at large θ . In contrast, for CRC-3, the fluctuation on propeller loads increases substantially with θ , which results in gradual increase in the noise level from θ = 0 ° to θ = 75 ° . The additional peak at f = BPF / 2 in the spectrum of CRC-3 exists in all pitch angles, and the rate of change in its magnitude follows the same trend as the one occurring at BPF. In fact, at both harmonics, the noise level increases with θ , while its growth rate decreases. Such a similar growth rate at the two aforementioned harmonics confirms that the change in the CRC-3 noise level with θ does not originate solely from the propeller-tip vortices.
Figure 9 demonstrates change in the directivity of SPL at 1st harmonic and the overall SPL with change in pitch angle for the two cases. The trend of directivity at BPF is almost the same as the one shown in Figure 8. For the isolated propeller, the difference between trends of SPL and OASPL is minimum. For CRC-3, the difference between the OASPL and SPL at small pitch angle is much larger than that of the larger pitch angle, indicating that the ratio of the noise at higher harmonics to the one at BPF decreases with θ , which may also be seen in the spectra depicted in Figure 7. This confirms that the contribution of propeller–propeller interaction to the overall noise decreases with increase in pitch, since it is the main source of noise at harmonics larger than BPF.

3.1.3. Effect of Velocity and RPM

Directivity plots of SPL and OASPL are provided in this section to evaluate the inflow velocity and RPM effects on the CRC-3 emitted noise. The left side of Figure 10 compares three cases at fixed RPM = 6000 and θ = 15 ° , but variable velocities of U 0 = 4 ,   7 ,   13   m / s and the right side compares two cases with θ = 15 ° and U 0 = 7   m / s , but variable propeller rotating velocities of RPM = 6000 ,   12,000 . The results show that the OASPL does not change regularly with increase in U 0 or the advance ratio. It should also be mentioned that the trend at BPF is dependent on the microphone location on the circular array ( Φ ), similar to that reported by Akkermans et al. [32]. To understand the predicted trend, one should notice that one of the major sources of CRC-3 noise is the loading noise, while the thickness noise becomes important only if the blade-tip speed’s Mach number ( M a ) exceeds 0.7. In all cases studied in the present work, M a < 0.37 , which means the thickness noise is negligible for CRC-3. In addition, the quadrupole noise source is also important for transonic speed range, where 0.8 < M a < 1.2 [48], which is not the case here. Splitting the loading noise (second term in Equation (1)) into steady and unsteady components [21], the steady loading contribution to the noise is larger at low J or low U 0 . As J increases, the unsteady loading contributes to the noise, but its contribution does not necessarily increase by increasing J [29], which results in the irregular pattern of velocity impact on the noise level. Later, in the local flow section it will be shown that among the three cases with different velocity, the level of unsteadiness on the propellers is highest at 13   m / s and lowest at 7   m / s , which agrees with the OASPL trend shown at the bottom left of Figure 10. Comparing SPL and OASPL dependence on velocity, it can be realized that the noise level at higher harmonics is considerably affected by velocity.
Regarding the RPM effect on the right side of the figure, as expected, doubling the tip speed of the propeller results in significant increase in the generated noise, which agrees with the similar studies reported before [29]. Increase in RPM in fact results in growth of both steady and unsteady loading noise sources at all frequencies, but SPL at BPF experiences a smaller increase comparing to OASPL ( 14 % versus 18 % ), which indicates that having a larger RPM results in slightly further growth in broadband noise compared to tonal noise.

3.1.4. Noise on the Wings and Fuselage

In this section, the noise level on the wings and the fuselage is evaluated, using the microphones shown in Figure 2b. The propeller phases γ are shown in Figure 11 to be linked to the discussion. The acoustic pressure fluctuation over one propeller rotation and SPL for the probes on the wings are shown in Figure 12.
The acoustic pressure fluctuation is obviously dependent on the propeller phase, as the unsteadiness imposed on the wing’s load is due to the propeller’s rotation. t = 0.03   s corresponds to the propeller phase angle of γ = 45 ° .
It can be seen that, for all conditions, at γ = 90 ° ( t = 0.0325   s ), the level of acoustic pressure fluctuation tends to become equal for the three pitch angles and the difference becomes maximum at γ = 45 ° ,   135 ° . Both microphones on wing-2 show very similar pressure fluctuations, since they are positioned at the location of propeller tip-vortex interaction with the wing. On wing-1, however, the pressure fluctuation is different for the two points, due to interference with the fuselage. In addition, wing-1 experiences a slightly smaller level of pressure fluctuation compared with wing-2. Therefore, the SPL spectra shows that wing-1 benefits acoustically over wing-2, while it also benefits aerodynamically by experiencing a larger lift for most of the conditions [49]. This is different from the trend observed by Chirico et al. [37], probably due to the different configuration in that study. While low and mid θ represent relatively similar trends and levels of fluctuation, high θ shows a significantly different pattern, with larger fluctuations, leading to a higher level of SPL. This confirms the conclusion made before based on Figure 7.
The pressure fluctuation and SPL on the microphones on the fuselage are shown in Figure 13. In contrast to Boots’ [33] conclusion on smaller contribution to noise by the fuselage compared to the wing, seen here is a larger level of acoustic pressure fluctuations on the fuselage and consequently sound pressure level compared to the wings. This is firstly due to the fact that the fuselage directly interacts with four propellers and, secondly, due to its larger surface compared to the wing.

3.2. Local Flow

3.2.1. Noise Sources

In order to identify the noise sources, contours, and iso-surfaces of time, the derivative of pressure ( d p / d t ) equivalent to the dilatation field is demonstrated in Figure 14 and Figure 15, respectively. The results for CRC-3 are provided at phase angles of γ = 45 ° , 135 ° along with the iso-surface for the isolated propeller at an arbitrary phase angle. The results correspond to the case with θ = 0 ° , RPM = 6000 and U 0 = 7   m / s . The contours show that the noise mainly propagates from the propeller tips through the field, the location of which will be altered as the propellers rotate.
The iso-surfaces for CRC-3 in Figure 15 at γ = 45 ° and γ = 135 ° indicate that when the blades are close to each other, the noise is maximum at the proximity location and close to the fuselage, while when the blades are far from each other, the maximum noise occurs close to the wings. Therefore, the manifestation of noise sources for CRC-3 is dependent on phase angle, which explains why there exist more peaks in the spectrum of CRC-3 compared to the isolated propeller in Figure 7. For the isolated propeller, the iso-surface shows blade and tip vortices to be noise sources, and the iso-surface is independent from the phase angle.

3.2.2. Level of Unsteadiness

As mentioned before, for aerial systems relying on propulsion, the periodic motion of the propellers transmits noise through the system by exciting the skin panels of the structure [33], which eventually results in structure-born noise. To evaluate the level of unsteadiness on various conditions, the distribution of root–mean–square (RMS) of the static pressure ( p R M S ) on propeller-3, wings and the fuselage of CRC-3 are represented in this section. The labels assigned to the eight cases in Table 2 are used in the pressure RMS figures. Figure 16 demonstrates p R M S on propeller-3 for various conditions and as expected, the blade tips experience the maximum unsteadiness. From C1 to C5, the level of unsteadiness increases on the propeller as θ grows. Interestingly, the percentage of increase at high θ range is smaller than that of the low θ range ( ~ 28 % versus ~ 50 % ), which is consistent with the trend depicted in Figure 7.
The same agreement may be found on the inflow velocity effect on noise by comparing the level of unsteadiness between cases C2 ( U 0 = 7   m / s ), C6 ( U 0 = 4   m / s ) and C7 ( U 0 = 13   m / s ) with Figure 10. Based on the OASPL trend shown in Figure 10, O A S P L C 7 > O A S P L C 6 > O A S P L C 2 , and the maximum level of unsteadiness shows R M S C 7 > R M S C 6 > R M S C 2 . This confirms the importance of unsteady loading noise over steady loading noise in the CRC-3′s noise generation mechanism, as mentioned in the discussion of Figure 10. In fact, the unsteadiness on propellers is significantly influenced by their interaction with the structure, which confirms that the wings and fuselage are the major cause of increase in noise due to increasing pitch angle. The RPM effect on unsteadiness of the propeller may be evaluated by comparing cases C2 and C8 which have similar condition except different RPM values of 6000 and 12,000, respectively. Although RPM results in doubling the maximum pressure fluctuation level, it can be seen that the cases with θ = 55 ° , 75 ° at RPM = 6000 (C4 and C5) experience a higher unsteadiness level than case C8 with RPM = 12,000 and θ = 15 ° . It may be inferred that the pitch angle can increase the unsteadiness of the propellers significantly, and the amount it adds to the CRC-3 noise level may even become more important than noise originated solely from the propellers’ tips.
Figure 17 depicts dimensionless P R M S contours on the fuselage and wings for various cases.
Unlike the RMS contours on propellers, in which the case with maximum pitch (C5) demonstrates the maximum unsteadiness on the propeller, here the case with RPM = 12,000 (C8) experiences the maximum unsteadiness on the rest of the structure. This is in agreement with the fact that structure-born noise is mainly due to the propeller loading [29], which is maximal for the case C8. In addition, this indicates existence of a two-way unsteady mechanism between the propellers and the structure of CRC-3. The body imposes maximum unsteadiness on the propellers at large pitch, while the propellers cause maximum fluctuation on the body at large RPM. Focusing on the case C2, the upper wing (wing-2) undergoes larger pressure fluctuations than wing-1 and therefore experiences a higher level of noise, which is consistent with the local acoustics pressure fluctuation reported in Figure 12. In addition, on the fuselage, the maximum pressure fluctuation occurs close to its nose rather than the side, similar to that shown in Figure 13.
The level of unsteadiness on the body of CRC-3 grows as θ increases, similar to that observed for its propeller in Figure 16. In all cases, the footprint of the propeller tip and blade-passage vortices may be seen at the location of maximum unsteadiness, which is either on the wings, fuselage, or other appendages of CRC-3, being altered by the motion parameters, which shows that the tip and blade-passage vortices of the propellers are always a determinant source of structure-borne noise. The pattern of change in p R M S distribution from C1 to C5 reveals that the location of maximum unsteadiness tends to alter from being concentrated at the region between the propellers at low θ and spread to other locations at high θ . For this reason, in the OASPL directivity shown in Figure 9, at θ = 0 ° , the observer located at Φ = 0 experiences significant noise level, while the directivity tends to become uniform at high θ . Another interesting observation is that the rate of increase in unsteadiness becomes larger as θ increases, similar to noise level on the wings (Figure 12), but opposite to the noise around CRC-3 (Figure 7). Regarding the velocity effect on pressure fluctuation on the wings and fuselage, comparing cases C2, C6, and C7 to each other, an irregular effect on RMS can be observed. It is known that the value of propeller thrust decreases with increasing velocity, which is an indicator of steady loading. However, unsteady loading does not show a monotonic change with U 0 or J , as reported in the literature and also observed in the p R M S distribution on the propeller in Figure 16. Therefore, it can be inferred that the irregular effect of velocity on structure-borne noise is due to the changing balance between the steady and unsteady loading of the propeller with its advance ratio.

4. Conclusions

The aeroacoustics of a quadrotor biplane tailsitter (CRC-3) were studied numerically for various conditions with different pitch angles, propeller rotating velocities and vehicle speeds. Comparison of the sound pressure level around CRC-3 with an isolated propeller case showed significantly larger noise for CRC-3, which was found to be altered by pitch angle, unlike the isolated propeller case. This results in a 20% increase in noise from pitch angle θ = 0 ° to θ = 75 ° at both BPF and OASPL. The studies showed that the major source of CRC-3 noise at θ = 0 ° is the noise generated by the four propellers and their interactions. The increase of pitch adds noise due to the interaction of the propellers and the CRC-3 structure. The rate of increase in SPL with θ decreases as θ grows. Doubling the RPM of CRC-3 results in about a 14 % increase in the noise at BPF and 18 % increase in overall noise, which is smaller than the increase due to changing the pitch angle from θ = 0 ° to θ = 75 ° . Additionally, the noise around CRC-3 was found to alter irregularly with increase in inflow velocity, due to changes in balance between steady and unsteady loading effects with propellers’ advance ratio.
Studying unsteadiness on CRC-3 by calculating the pressure fluctuation on the propeller and the structure indicated a two-way mechanism through which the propellers and the structure impose unsteadiness on each other. The unsteadiness on the propellers was found to have a more dependence on the pitch angle rather than RPM. In contrast, the trend of pressure fluctuation on the structure showed that it is more affected by RPM.

Author Contributions

Conceptualization, R.S. and H.S.; methodology, H.S.; software, M.H. and H.S.; validation, H.S. and M.H.; formal analysis, H.S. and M.H.; investigation, R.S., H.S. and M.H; resources, H.S.; data curation, H.S. and M.H.; writing—original draft preparation, M.H. and H.S.; writing—review and editing, H.S., R.S. and M.H.; visualization, M.H.; supervision, H.S.; project administration, H.S. All authors have read and agreed to the published version of the manuscript.

Funding

This research received no external funding.

Institutional Review Board Statement

Not applicable.

Informed Consent Statement

Not applicable.

Data Availability Statement

Not applicable.

Acknowledgments

The authors acknowledge the Texas Advanced Computing Center (TACC) at The University of Texas at Austin and University of North Texas High-Performance Computing Services for providing HPC resources that have contributed to the research results reported within this paper.

Conflicts of Interest

The authors declare no conflict of interest.

References

  1. Phillips, B.; Hrishikeshavan, V.; Rand, O.; Chopra, I. Design and development of a scaled quadrotor biplane with variable pitch proprotors for rapid payload delivery. Annu. Forum Proc. AHS Int. 2016, 1, 302–315. [Google Scholar]
  2. Reddinger, J.-P.; McIntosh, K.; Zhao, D.; Mishra, S. Modeling and Trajectory Control of a Transitioning Quadrotor Biplane Tailsitter. In Proceedings of the Vertical Flight Society 75th Annual Forum, Philadelphia, PA, USA, 13–16 May 2019. [Google Scholar]
  3. Avera, M.; Singh, R. Scalability of Hybrid-Electric Propulsion for VTOL UAS. In Proceedings of the NATO Research Symposium on Hybrid/Electric Aero-Propulsion Systems for Military Applications, Trondheim, Norway, 7–9 October 2019. AVT-RSY-323. [Google Scholar]
  4. Nyadanu, S.D.; Tessema, G.A.; Mullins, B.; Kumi-Boateng, B.; Bell, M.L.; Pereira, G. Ambient Air Pollution, Extreme Temperatures and Birth Outcomes: A Protocol for an Umbrella Review, Systematic Review and Meta-Analysis. Int. J. Environ. Res. Public Health 2020, 17, 8658. [Google Scholar] [CrossRef] [PubMed]
  5. Van Kempen, E.; Casas, M.; Pershagen, G.; Foraster, M. WHO environmental noise guidelines for the European region: A systematic review on environmental noise and cardiovascular and metabolic effects: A summary. Int. J. Environ. Res. Public Health 2018, 15, 379. [Google Scholar] [CrossRef] [PubMed] [Green Version]
  6. Clark, C.; Crumpler, C.; Notley, H. Evidence for environmental noise effects on health for the United Kingdom policy context: A systematic review of the effects of environmental noise on mental health, wellbeing, quality of life, cancer, dementia, birth, reproductive outcomes, and cognition. Int. J. Environ. Res. Public Health 2020, 17, 393. [Google Scholar] [CrossRef] [PubMed] [Green Version]
  7. Ditmer, M.A.; Vincent, J.B.; Werden, L.K.; Tanner, J.C.; Laske, T.G.; Iaizzo, P.A.; Garshelis, D.L.; Fieberg, J.R. Bears show a physiological but limited behavioral response to unmanned aerial vehicles. Curr. Biol. 2015, 25, 2278–2283. [Google Scholar] [CrossRef] [PubMed] [Green Version]
  8. Torija, A.J.; Clark, C. A psychoacoustic approach to building knowledge about human response to noise of Unmanned Aerial Vehicles. Int. J. Environ. Res. Public Health 2021, 18, 682. [Google Scholar] [CrossRef] [PubMed]
  9. Brocklehurst, A.; Barakos, G.N. A review of helicopter rotor blade tip shapes. Prog. Aerosp. Sci. 2013, 56, 35–74. [Google Scholar] [CrossRef]
  10. Wang, Z.; Pandey, A.; Sutkowy, M.; Harter, B.; McCrink, M.; Gregory, J.W.; Zhuang, M.A. A comprehensive approach to study aerodynamic and aeroacoustic performances of small multicopter unmanned aerial systems. In Community and UAV Noise, Proceedings of 2018 AIAA Aerospace Sciences Meeting, Kissimmee, FL, USA, 8–12 January 2018; American Institute for Aeronautics and Astronautics: Reston, VA, USA, 2018; Volume 1, p. 1. [Google Scholar]
  11. Henricks, Q.M. Computational Aerodynamic and Aeroacoustic Study of Small-Scale Rotor Geometries; The Ohio State University: Columbus, OH, USA, 2019. [Google Scholar]
  12. Boltezar, M.; Mesaric, M.; Kuhelj, A. The influence of uneven blade spacing on the SPL and noise spectra radiated from radial fans. J. Sound Vib. 1998, 216, 697–711. [Google Scholar] [CrossRef]
  13. Cattanei, A.; Ghio, R.; Bongiovı, A. Reduction of the tonal noise annoyance of axial flow fans by means of optimal blade spacing. Appl. Acoust. 2007, 68, 1323–1345. [Google Scholar] [CrossRef]
  14. Floros, M.W. Performance and Acoustics of Small Rotors with Non-Uniform Blade Spacing. In Proceedings of the Vertical Flight Society’s 75th Annual Forum & Technology Display, Philadelphia, PA, USA, 13–16 May 2019. [Google Scholar]
  15. Uehara, D.; Sirohi, J. Quantification of Swirl Recovery in a Coaxial Rotor System. In Proceedings of the American Helicopter Society 73rd Annual Forum, Fort Worth, TX, USA, 9–11 May 2017. [Google Scholar]
  16. Bhagwat, M. Co-rotating and Counter-rotating Coaxial Rotor Performance. In Proceedings of the AHS Aeromechanics Design for Transformative Vertical Flight, San Francisco, CA, USA, 16–18 January 2018. [Google Scholar]
  17. Misiorowski, M.; Gandhi, F.; Anusonti-Inthra, P. Comparison of Acoustic Predictions Using Distributed and Compact Airloads. In Proceedings of the Vertical Flight Society’s 75th Annual Forum & Technology Display, Philadelphia, PA, USA, 13–16 May 2019. [Google Scholar]
  18. Yang, Y.; Liu, Y.; Li, Y.; Arcondoulis, E.; Wang, Y. Aerodynamic and aeroacoustic performance of an isolated multicopter rotor during forward flight. AIAA J. 2020, 58, 1171–1181. [Google Scholar] [CrossRef]
  19. Kloet, N.; Watkins, S.; Wang, X. Aeroacoustic investigation of multirotor unmanned aircraft system (UAS) propellers and the effect of support structure. In Proceedings of the INTER-NOISE and NOISE-CON Congress and Conference, Madrid, Spain, 16–19 June 2019; pp. 3329–3340. [Google Scholar]
  20. Pandey, A.P. Investigation of Propeller Characteristics at Low Reynolds Number with an Angle of Attack: A Computational Aeroacoustic Study; Delft University of Technology: Delft, The Netherlands, 2021. [Google Scholar]
  21. Glegg, S.; Devenport, W. Aeroacoustics of Low Mach Number Flows: Fundamentals, Analysis, and Measurement; Elsevier Academic Press: London, UK, 2017. [Google Scholar]
  22. Intaratep, N.; Alexander, W.N.; Deveport, W.J.; Grace, S.M.; Dropkin, A. Experimental study of quadcopter acoustics and performance at static thrust conditions. In Propeller and Rotor Noise I, Proceedings of the 22nd AIAA/CEAS Aeroacoustics Conference, Lyon, France, 30 May–1 June 2016; American Institute for Aeronautics and Astronautics: Reston, VA, USA, 2016. [Google Scholar] [CrossRef] [Green Version]
  23. Unruh, J.F. Installation effects on propeller wake/vortex-induced structure-borne noise transmissions. J. Aircr. 1990, 27, 444–448. [Google Scholar] [CrossRef]
  24. Martinez, R. Predictions of Unsteady Wing and Pylon Forces Caused by Propeller Installation; NASA Contractor Report 178288; NASA: Cambridge, MA, USA, 1987.
  25. Zawodny, N.S.; Boyd, D.D. Investigation of Rotor–airframe Interaction Noise Associated with Small-Scale Rotary-Wing Unmanned Aircraft Systems. J. Am. Helicopter Soc. 2020, 65, 1–17. [Google Scholar] [CrossRef] [Green Version]
  26. Johnston, R.T.; Sullivan, J.P. Unsteady wing surface pressures in the wake of a propeller. J. Aircr. 1993, 30, 644–651. [Google Scholar] [CrossRef]
  27. Moroianu, D.; Fuchs, L. LES of the flow and acoustics generated by a wing installed aircraft propeller running in the vicinity of the ground. In Rotorcraft and Prop/Fan Noise, Proceedings of the 11th AIAA/CEAS Aeroacoustics Conference, Monterey, California, USA, 23–25 May 2005; American Institute for Aeronautics and Astronautics: Reston, VA, USA, 2005. [Google Scholar] [CrossRef]
  28. Durbin, P.A.; Groeneweg, J.F. Rough analysis of installation effects on turboprop noise. J. Acoust. Soc. Am. 1982, 72, S71. [Google Scholar] [CrossRef]
  29. Sinnige, T. Aerodynamic and Aeroacoustic Interaction Effects for Tip-Mounted Propellers: An Experimental Study; Delft University of Technology: Delft, The Netherlands, 2018. [Google Scholar]
  30. Tanna, H.K.; Burrin, R.H.; Plumblee, H.E., Jr. Installation effects on propeller noise. J. Aircr. 1981, 18, 303–309. [Google Scholar] [CrossRef]
  31. Heidelberg, L.; Woodward, R. Advanced turboprop wing installation effects measured by unsteady blade pressure and noise. In Proceedings of the 11th Aeroacoustics Conference, Palo Alto, CA, USA, 19–21 October 1987. [Google Scholar] [CrossRef] [Green Version]
  32. Akkermans, R.A.; Pott-Pollenske, M.; Buchholz, H.; Delfs, J.; Almoneit, D. Installation effects of a propeller mounted on a high-lift wing with a Coanda flap. Part I: Aeroacoustic experiments. In Low Noise Systems Integration, Proceedings of the 20th AIAA/CEAS Aeroacoustics Conference, Atlanta, GA, USA, 16–20 June 2014; American Institute for Aeronautics and Astronautics: Reston, VA, USA, 2014. [Google Scholar]
  33. Boots, D.A. Numerical Predictions of Propeller-Wing Interaction Induced Noise in Cruise and Off-Design Conditions; Carleton University: Ottawa, IM, Canada, 2016. [Google Scholar]
  34. Zhou, T.; Fattah, R. Tonal Noise Acoustic Interaction Characteristics of Multi-Rotor Vehicles. In Small Propeller-Rotor Noise II, Proceedings of the 23rd AIAA/CEAS Aeroacoustics Conference, Denver, Colorado, 5–9 June 2017; American Institute for Aeronautics and Astronautics: Reston, VA, USA, 2017. [Google Scholar]
  35. Lee, H.; Lee, D.J. Rotor interactional effects on aerodynamic and noise characteristics of a small multirotor unmanned aerial vehicle. Phys. Fluids 2020, 32, 047107. [Google Scholar] [CrossRef] [Green Version]
  36. Bernardini, G.; Centracchio, F.; Gennaretti, M.; Iemma, U.; Pasquali, C.; Poggi, C.; Rossetti, M.; Serafini, J. Numerical characterisation of the aeroacoustic signature of propeller arrays for distributed electric propulsion. Appl. Sci. 2020, 10, 2643. [Google Scholar] [CrossRef] [Green Version]
  37. Chirico, G.; Barakos, G.N.; Bown, N. Propeller installation effects on turboprop aircraft acoustics. J. Sound Vib. 2018, 424, 238–262. [Google Scholar] [CrossRef] [Green Version]
  38. Kingora, K.; Sadat, H. Hybrid immersed boundary method for general purpose CFD simulation. In Proceedings of the 73rd Annual Meeting of the APS Division of Fluid Dynamics, Chicago, IL, USA, 22–24 June 2020. [Google Scholar]
  39. Heydari, M.; Sadat-Hosseini, H. Analysis of propeller wake field and vortical structures using k− ω SST Method. Ocean Eng. 2020, 204, 107247. [Google Scholar] [CrossRef]
  40. Epikhin, A.; Evdokimov, I.; Kraposhin, M.; Kalugin, M.; Strijhak, S. Development of a dynamic library for computational aeroacoustics applications using the OpenFOAM open source package. Procedia Comput. Sci. 2015, 66, 150–157. [Google Scholar] [CrossRef] [Green Version]
  41. Willams, J.E.F.; Hawkings, D.L. Sound Generated by Turbulence and Surfaces in Arbitrary Motion. Philos. Trans. R. Soc. Lond. Ser. A Math. Physical Sci. 1969, 264, 321–342. [Google Scholar]
  42. Lighthill, M.J. On sound generated aerodynamically I. General theory. Proc. R. Soc. London Ser. A Math. Phys. Sci. 1952, 211, 564–587. [Google Scholar]
  43. Brentner, K.S.; Farassat, F. Modeling aerodynamically generated sound of helicopter rotors. Prog. Aerosp. Sci. 2003, 39, 83–120. [Google Scholar] [CrossRef] [Green Version]
  44. Junger, C. Computational Aeroacoustics for the Characterization of Noise Sources in Rotating Systems. Ph.D. Thesis, Technical University of Vienna, TU Wien, Vienna, Austria, 2019. [Google Scholar]
  45. Xing, T.; Stern, F. Factors of safety for Richardson extrapolation. J. Fluids Eng. 2010, 132, 061403. [Google Scholar] [CrossRef] [Green Version]
  46. Anudeep, M.; Diwakar, G.; Katukam, R. Design of a quad copter and fabrication. Int. J. Innov. Eng. Technol. 2014, 4, 59–65. [Google Scholar]
  47. Schenk, A.R. Computational Investigation of the Effects of Rotor-on-Rotor Interactions on Thrust and Noise; Brigham Young University: Provo, UT, USA, 2020. [Google Scholar]
  48. Hanson, D.B.; Fink, M.R. The importance of quadrupole sources in prediction of transonic tip speed propeller noise. J. Sound Vib. 1979, 62, 19–38. [Google Scholar] [CrossRef] [Green Version]
  49. Heydari, M.; Sadat, H.; Singh, R. Propeller-Wing Interaction Effects on Aerodynamics of an Unmanned Aerial System; Department of Mechanical Engineering, University of North Texas: Denton, TX, USA, 2021; to be submitted. [Google Scholar]
Figure 1. Geometry of CRC-3: (a) isometric view; (b) side view.
Applsci 11 09732 g001
Figure 2. Microphone positions: (a) circular array; (b) on the CRC-3 body.
Applsci 11 09732 g002
Figure 3. Computational domain for CRC-3 simulations.
Applsci 11 09732 g003
Figure 4. Grid representation of CRC-3.
Applsci 11 09732 g004
Figure 5. Grid study results: (a) time history of C T ; (b) time history of C l ; (c) directivity of OASPL.
Applsci 11 09732 g005
Figure 6. Validation: (a) Thrust for CRC-3 propeller; (b) position of the microphone in acoustics validation simulation; (c) SPL spectrum for APC 10 × 7E at RPM = 4660 and static condition.
Applsci 11 09732 g006
Figure 7. Variation of SPL spectra and directivity of SPL and OASPL versus pitch for various configurations: (a) θ = 0 ° ; (b) θ = 75 ° .
Applsci 11 09732 g007
Figure 8. SPL spectra at BPF, downstream: (a) isolated propeller; (b) CRC-3.
Applsci 11 09732 g008
Figure 9. Directivity of SPL at BPF (top) and OASPL (bottom) at three different θ : (a) isolated Propeller; (b) CRC-3.
Applsci 11 09732 g009
Figure 10. Directivity of SPL (top) and OASPL (bottom) around CRC-3: (a) varying velocity; (b) varying RPM.
Applsci 11 09732 g010
Figure 11. Propeller phases: (a) γ = 0 ° ; (b) γ = 45 ° ; (c) γ = 90 ° ; (d) γ = 135 ° .
Applsci 11 09732 g011
Figure 12. Acoustic pressure fluctuation and sound pressure level on the wings close to: (a) wing tip; (b) fuselage.
Applsci 11 09732 g012
Figure 13. Acoustic pressure fluctuation and sound pressure level on the fuselage: (a) on the nose; (b) on the side.
Applsci 11 09732 g013
Figure 14. Snapshot of dilatation field on a slice passing through the propeller hub: (a) γ = 45 ; (b) γ = 135 ° .
Applsci 11 09732 g014
Figure 15. Snapshot of iso-surface of pressure time-derivative: (a) CRC-3 at γ = 45 ° ; (b) CRC-3 at γ = 45 ° ; (c) Isolated propeller at an arbitrary phase angle.
Applsci 11 09732 g015
Figure 16. Dimensionless P R M S contour on propeller-3 of CRC-3 for various cases: C1 (RPM = 6000, U 0 = 7   m / s , θ = 0 ), C2 (RPM = 6000, U 0 = 7   m / s , θ = 15 ), C3 (RPM = 6000, U 0 = 7   m / s , θ = 35 ), C4 (RPM = 6000, U 0 = 7   m / s , θ = 55 ), C5 (RPM = 6000, U 0 = 7   m / s , θ = 75 ), C6 (RPM = 6000, U 0 = 4   m / s , θ = 15 ), C7 (RPM = 6000, U 0 = 13   m / s , θ = 15 ), C8 (RPM = 12,000, U 0 = 7   m / s , θ = 15 ).
Applsci 11 09732 g016
Figure 17. Dimensionless P_RMS contour on CRC-3 structure for various cases: C1 (RPM = 6000, U 0 = 7   m / s , θ = 0 ), C2 (RPM = 6000, U 0 = 7   m / s , θ = 15 ), C3 (RPM = 6000, U 0 = 7   m / s , θ = 35 ), C4 (RPM = 6000, U 0 = 7   m / s , θ = 55 ), C5 (RPM = 6000, U 0 = 7   m / s , θ = 75 ), C6 (RPM = 6000, U 0 = 4   m / s , θ = 15 ), C7 (RPM = 6000, U 0 = 13   m / s , θ = 15 ), C8 (RPM = 12,000, U 0 = 7   m / s , θ = 15 ).
Applsci 11 09732 g017
Table 1. The main parameters of CRC3.
Propellers
TypeNo.AxisDirectionCOR (m) 1
RAYCorp 80451(0.99, 0, 0.17)CCW(−0.003, −0.22, 0.128)
2(−0.99, 0, −0.17)CW(−0.003, 0.22, 0.128)
3(0.99, 0, −0.17)CCW(−0.003, 0.22, −0.128)
4(−0.99, 0, 0.17)CW(−0.003, -0.22, −0.128)
Wings
TypeSize
Wortmann FX 63-13787.28 × 490 mm (Chord × Span)
Fuselage/Structure
Size (fuselage, mm)Weight (structure)
R x = 107 , R y = 45 , R z = 44   12 (N)
1 Center of Rotation.
Table 2. Test matrix.
CaseRPM U 0   m / s θ   deg
C1600070
C26000715
C36000735
C46000755
C56000775
C66000415
C760001315
C812,000715
Table 3. Surface grid description.
PartSurface Mesh
Propeller 1, 2, 3, 464 thousand (80 on the chord and 220 on the span)
Wing 1, 2300 thousand (600 on the chord and 1100 on the span)
Other appendages44 thousand (94 in vertical direction and 86 in horizontal direction on the fuselage)
Table 4. Average y + values on propeller and wing for all cases.
Case LabelPropellerWing
C12.222.62
C21.671.60
C32.082.37
C42.092.23
C52.461.72
C62.001.57
C71.751.30
C80.571.01
Table 5. Boundary conditions.
VariableFar-Field BoundaryPropellerWingOther Surfaces
u UniformNo-slipNo-slipNo-slip
p p n = 0 p n = 0 p n = 0 p n = 0
k 0 0 0 Wall function
O m e g a 0.02 6.0 v β y 2 6.0 v β y 2 Wall function
Table 6. Grid verification of CRC-3 at θ = 0 ° , RPM = 12,000 , and U 0 = 16   m / s .
C T C l OASPLaveAverage
R G 0.470.680.480.54
P G 2.162.452.122.24
ε 12 , G % S 1 1.754.44.43.5
U G % S 1 1.231.863.342.14
Publisher’s Note: MDPI stays neutral with regard to jurisdictional claims in published maps and institutional affiliations.

