
Nonlinear Vibration Isolation via a NiTiNOL Wire Rope


School of Science, Harbin Institute of Technology, Shenzhen 518055, China
*
Author to whom correspondence should be addressed.
Appl. Sci. 2021, 11(21), 10032; https://doi.org/10.3390/app112110032
Submission received: 16 July 2021
/
Revised: 30 September 2021
/
Accepted: 21 October 2021
/
Published: 26 October 2021
(This article belongs to the Special Issue Ropeway Systems Dynamics and Control: Analytical, Numerical, and Experimental Methods towards New Design Strategies)
Abstract
:Featured Application
The vibration isolations of precision processing equipment, measuring instruments and spacecraft payloads are potential applications of the work.
Abstract
Vibration isolators with both stiffness and damping nonlinearities show promise for exhibiting compound advantages for broadband vibration isolation. A nonlinear isolator with a NiTiNOL wire rope is proposed with cubic stiffness, hysteretic damping, and pinching effects induced by geometric constraints, inner frictions, and phase transitions, respectively. A combined method of a beam constraint model and a Bouc-Wen model is presented to characterize the restoring force of the NiTiNOL wire rope. The frequency responses of the nonlinear isolator were analyzed through a harmonic balance method with an alternating frequency/time domain technique. The generalized equivalent stiffness and the generalized equivalent damping ratio were defined for a comprehensive understanding of the nonlinear characteristics. The isolator exhibited a stiffness-softening-hardening characteristic. The pinching effect, the Bouc-Wen hysteresis, and the cubic stiffness mainly influenced the equivalent stiffness at the initial value, the small displacements, and the large displacements, respectively. The rate-independent damping ratio increased and then decreased with increasing displacement, and the parameters influenced the damping ratio change in different ways. Compared to an isolator with a steel wire rope, the isolator with a NiTiNOL wire rope exhibited less initial stiffness and a stronger damping effect, and thus, better vibration isolation performance. The relationships of the peak displacement transmissibility and the resonant frequency with the excitation amplitude were both non-monotonic due to the non-monotonic changes of the stiffness and the damping ratio. The minimum peak transmissibility, the lowest resonant frequency, and their corresponding excitation amplitudes depended on the isolator parameters. The isolator demonstrated stiffness–softening and stiffness–hardening types of jump phenomena with different parameters.
1. Introduction
Vibration isolators are widely used in mechanical engineering, civil engineering, and aerospace technology. Nonlinear vibration isolators [1,2,3] are superior to linear vibration isolators, with better broadband isolation performance. The stiffness nonlinearity endows the isolator with a low-frequency vibration isolation ability without weakening the load capacity. Damping nonlinearity is beneficial for suppressing the resonance without degrading the high-frequency isolation efficiency. Isolators with both stiffness and damping nonlinearities show promise for presenting compound advantages.
Nonlinear stiffness can be accomplished with linear springs with different orientations [4,5,6], buckling beams [7,8,9], spring-roller-cam mechanisms [10,11,12], and magnetics [13,14,15]. Nonlinear damping can be induced by geometric constraints [16,17,18,19,20], frictions [21,22], materials with intrinsic nonlinearities [23,24], and eddy current effects [25,26]. Vibration isolators with both stiffness and damping nonlinearities have been proposed in recent years. Lu et al. [16] proposed an isolator with nonlinear stiffness and damping derived from horizontal linear springs and dampers, respectively. Cheng et al. [17] proposed a quasi-zero-stiffness isolator with nonlinear damping, and the stiffness and damping nonlinearities resulted from geometric constraints. Liu et al. [18] investigated a quasi-zero-stiffness isolator with a spring-roller-cam mechanism integrated with nonlinear damping accomplished with two horizontal dampers. Bian et al. [19] studied the nonlinear damping characteristics of the limb-like structured or X-structured isolators. Yan et al. [20] proposed a quasi-zero-stiffness isolator with nonlinear damping using a three-link mechanism. In these isolators, the damping nonlinearity is derived from deliberately designed geometric constraints, and thus, the isolator structures are complicated. In addition, the damping is viscous in most cases, and there is a lack of research regarding the nonlinear stiffness isolator enhanced with non-viscous damping.
Generally, the nonlinear damping force is approximated as an explicit function of the velocity and displacement for dynamic analysis. Huang et al. [27] investigated a vibration isolation system with real-power nonlinearities in restoring and damping forces through a multiple scales method. Ho et al. [28] studied a vibration isolator with high-order stiffness and cubic damping via an output frequency response function approach. Liu et al. [29] investigated the effects of the hardening and softening of the damping on a quasi-zero-stiffness vibration isolator with an averaging method. Donmez et al. [22] performed a harmonic balance analysis on a quasi-zero-stiffness isolation system with dry friction damping, expressed as a piecewise function. However, some hysteretic damping induced by frictions and phase-change materials is history-dependent and characterized by phenomenological models, such as the Bouc-Wen model [30,31]. The Bouc-Wen model expression is both piecewise and implicit. There are two major approaches to dealing with the dynamic system with the Bouc-Wen model. The first approach is to take a piecewise fitting on the Bouc-Wen-type hysteretic force, and thus, the implicit expression can be transformed into a piecewise explicit expression. Okuizumi et al. [30] and Casalotti et al. [31] performed multiple scales analyses on hysteretic systems with piecewise fittings on the Bouc-Wen model, respectively. The second approach is to adopt an alternating frequency/time domain technique [32], and the implicit function is numerically solved in the time domain. This study was focused on a modified Bouc-Wen model. The expression is more complicated than the classic Bouc-Wen model, and it is difficult to perform a piecewise fitting on the hysteretic force. The alternating frequency/time domain technique is more suitable and its effectiveness for the modified Bouc-Wen model remains to be verified.
Wire ropes produce nonlinear damping due to inner frictions, and the damping is rate-independent. The wire ropes have been adopted in nonlinear dampers. Barbieri et al. [33] studied an asymmetric Stockbridge damper and the steel wire ropes are utilized as cantilever beams. Carpineto et al. [34] proposed a tuned mass damper using steel wire ropes with both ends clamped, and the nonlinear damping force was characterized with a Bouc-Wen model. Compared to steel wire ropes, NiTiNOL wire ropes are more efficient in energy dissipation due to the phase transitions of the material. Carboni et al. [35,36] proposed a vibration absorber accomplished with NiTiNOL-steel wire rope assemblies and revealed a pinching effect derived from NiTiNOL. Zhang et al. [37] integrated a NiTiNOL wire rope with a nonlinear energy sink to improve energy dissipation. Zheng et al. [38] adopted a NiTiNOL wire rope for structural vibration suppression. With the wire ropes styled as a ring, the load capacity was enhanced and showed promise for vibration isolation. Leblouba et al. [39] studied the shear cyclic behavior of polycal wire rope isolators. Lu et al. [40] attached a NiTiNOL wire rope to a ring-type isolator and enhanced the isolation performances. Salvatore et al. [41] investigated a compact nonlinear isolator with initially curved wire ropes. The ring-type or semi-ring-type isolator presented an asymmetric restoring force, and it was not conducive to vibration isolation. We [42] have proposed a nonlinear isolator with compliant mechanisms and straight steel wire ropes with a linear spring enhancing the load capacity and verified the superiority of the symmetric restoring force for vibration isolation. An isolator with straight NiTiNOL wire ropes showed promise for exhibiting a symmetric restoring force and stronger damping effects. The pinching effect of NiTiNOL endowed the isolator with more nonlinear behaviors. It is essential to perform a comprehensive comparison of the nonlinear characteristics and the isolation performances between the isolators with steel wire ropes and those with NiTiNOL wire ropes. Furthermore, the stiffness and damping of the isolators with wire ropes are not only nonlinear but also non-monotonically varying. This leads to the unique issue of “the most suitable excitation amplitude” for the isolators. The aim of this research was to reveal the parameter influences on the most suitable excitation amplitude.
In this paper, we propose an isolator with a NiTiNOL wire rope with both ends and the middle part clamped. The isolator exhibited nonlinear stiffness and nonlinear damping due to geometric constraints, frictions, and phase transitions of the material. The isolator was modeled with a modified Bouc-Wen model and analyzed with a harmonic balance method. A comparison was made between isolators with steel and those with NiTiNOL wire rope. The most suitable excitation amplitude and the parameter influences were revealed. The paper is organized as follows. The nonlinear isolator and its dynamic model are introduced in Section 2. The harmonic balance analysis and the stiffness and damping ratio analysis are presented in Section 3. The numerical simulation results are presented in Section 4 with further discussion. Conclusions are drawn in Section 5.
2. Models
Figure 1 shows a vibration isolator with a NiTiNOL wire rope. The wire rope is horizontally suspended in tension. Both ends of the wire rope are fixed on the base with two clamping blocks, and the middle of the wire rope is fixed on a guiding block. A guiding rod is assembled on the base with screw threads, and thus, its height can be adjusted. The guiding block and the guiding rod are assembled with a linear bearing, and thus, the guiding block can move only vertically. A linear spring is assembled between the guiding block and the guiding rod. The moving part of the system includes the guiding block, and the middle clamping block and the payload are fixed to it. At the initial state, the gravity of the moving part is balanced by the linear spring, and the wire rope is horizontal. A vertical displacement excitation Yb is applied to the base, and the vertical responding displacement of the payload is Yp. The relative displacement is Y = Yp − Yb.
The restoring force of the wire rope was modeled with a combined method. The wire rope was cut from the middle and divided into two segments. Firstly, each segment was regarded as a cantilever beam fixed on the base with a constant section, and the inner frictions and the phase transitions of NiTiNOL were ignored. Thus, this part of the restoring force is due to the linear elastic deformation with geometric constraints, and it was modeled with a physical method. The length, the area of the section, the moment of inertia, and Young’s modulus of the beam are denoted as L, A, I, and E, respectively. The free end of the beam is attached to the payload and the external loads applied to the free end are denoted as Fwx, Fwy, and Mwz, respectively. The elastic deformations of the free end are denoted as Xw, Yw, and θw, respectively. The free end is fixed on the payload, and thus, the rotation angle .
At the initial state (Yw = 0), the beam is horizontal with an axial force Fwx0. The restoring force due to the linear elastic deformation was modeled based on a beam constraint model [43]. More details can be found in our previous research [42], and the vertical restoring force is expressed as
Secondly, the inner frictions and the phase transitions of NiTiNOL were modeled with a phenomenological method. The hysteretic effect was characterized by a Bouc-Wen model, and an exponential function was added to describe the pinching effect [35]. This part of the restoring force is denoted as Zw and is expressed as
where Kwd, Gw, Bw, and nb are the parameters of the Bouc-Wen model, and ξ and Yb are the parameters of the pinching effect function. The symbol (‘) denotes the derivative with respect to time. The total restoring force of the wire rope is the summation of the two parts and
where
With the model of the wire rope, the dynamic equation of the isolator shown in Figure 1 can be established. Assume that the excitation on the base is harmonic and
where Ab, ωb, and T are the amplitude, the angular frequency, and the time, respectively. The mass of the payload and the stiffness of the linear spring are denoted as M and Ks, respectively. The dynamic equation of the isolator can be expressed as
where Z is expressed in Equation (4) and Yw = Y. The introduction of the dimensionless parameters leads to
where
and Kc and ωc are the characteristic stiffness and the characteristic frequency, respectively. The dot and double-dot symbols on the parameters denote the derivative and the second-order derivative with respect to the dimensionless time, respectively. The amplitudes of the absolute and relative displacements of the payload are denoted as Ap and A, respectively, and their dimensionless forms are ap = Ap/Ab and a = A/Ab, respectively. Therefore, the displacement transmissibility of the isolator is .
3. Methods
3.1. Harmonic Balance Analysis
A harmonic balance method was adopted to solve Equations (7) and (8). The restoring force of the wire rope, as shown in Equation (3), is an odd function, and thus, there are only odd harmonics in the responses. Only the first- and third-order harmonics were considered for approximate analysis. The amplitudes of higher-order harmonics are less than 1/10 of the first- and third-order harmonics, provided that the responding amplitude is not so high (a < 3). Assume that
where a1, b1, a3, b3, c1, d1, c3, and d3 are the coefficients. The Fourier expansion of y3 can be obtained from a recursive method introduced in our previous research [42], and
where
According to Equation (7), there are
Therefore, when the parameters (a1, b1, a3, b3, η) are determined, z can be calculated. Define a residual r, according to Equation (8), as
and its Fourier expansion is expressed as
An alternating frequency/time domain method [41] was adopted to calculate the parameters u1, v1, u3, and v3. A discrete time sequence from t = 0 to t = 2π was selected, and y(t), z(t), and r(t) can be calculated as discrete sequences based on Equations (10), (11), and (15), respectively. The parameters (u1, v1, u3, v3) were obtained by applying the Fourier transform to r(t). If the determined parameters (a1, b1, a3, b3, η) are the exact solutions of Equations (7) and (8), the parameters (u1, v1, u3, v3) are all 0. Thus, solving the equations is equivalent to the least-mean-square problem of searching (a1, b1, a3, b3, η) to achieve the minimum value of . An arc-length continuation method [44] was adopted to solve the problem. The absolute displacement of the payload was calculated as
Therefore, the frequency responses of ap (TD) could be acquired.
3.2. Stiffness and Damping Ratio Analysis
For a comprehensive understanding of the stiffness and damping nonlinearities of the isolator, the generalized equivalent stiffness and a generalized equivalent damping ratio were defined. According to the characteristics of the Bouc-Wen hysteresis, the area of the hysteretic loop is related to β/γ, and there is no hysteresis with β = 0. Therefore, an anhysteretic form of Equation (8) is defined as
The anhysteretic force zan can be calculated through numerical integration of Equation (18), and it is a single-valued function characterizing the stiffness nonlinearity induced by both the Bouc-Wen hysteresis and the pinching effect. The total anhysteretic restoring force of the isolator is
The generalized equivalent stiffness is
The first two terms on the right-hand side indicate the traditional equivalent stiffness due to elastic deformations of the wire rope and the linear spring. The third term indicates the influences of the inner frictions and the phase transitions of the wire rope on the stiffness. Thus, the stiffness is defined as the generalized equivalent stiffness. The dimensional generalized equivalent stiffness is Ke = keKc.
The generalized equivalent damping ratio is defined by the ratio of the dissipated energy and stored energy. The dimensionless restoring force is expressed as
and the dimensional restoring force is Fr = frKc/Ab. The dissipated energy in one period is
The stored energy is derived from the anhysteretic restoring force, and the maximum stored energy in a period is
The generalized equivalent damping ratio is given as
It should be noted that the generalized equivalent damping ratio is different from the traditional damping ratio in two aspects. Firstly, the stored energy is calculated from the anhysteretic restoring force. Thus, it not only contains the elastic stored energy, but it is also influenced by the inner frictions and the phase transitions. Secondly, the damping effects induced by the inner frictions and the phase transitions are independent of the frequency. Therefore, there is no η in the denominator of Equation (24).
4. Results and Discussion
4.1. Characteristic Indicators
Numerical simulations were performed to study the characteristic indicators of the isolator, including the restoring force, the generalized equivalent stiffness, and the generalized equivalent damping ratio. The parameters of the wire ropes were derived from the identification results in [45], using a NiTiNOL wire rope and a steel wire rope for comparison. Table 1 shows the dimensional parameters of the isolators.
The restoring forces of the isolators with different materials of the wire rope are shown in Figure 2. Compared to the steel wire rope, the NiTiNOL wire rope demonstrated a larger hysteretic loop, indicating a stronger energy dissipation ability. This is because NiTiNOL dissipates more energy due to the phase transition. Furthermore, the NiTiNOL wire rope presented a flatter curve around the balance location (Y = 0). This phenomenon was a result of the pinching effect.
For further comparison, the generalized equivalent stiffness and damping ratios of the isolators with steel and NiTiNOL wire ropes were calculated through Equations (20) and (24). As shown in Figure 3a, the initial equivalent stiffness at Y = 0 of the NiTiNOL wire rope was much lower than that of the steel wire rope due to the pinching effect. As shown in Figure 3b, the equivalent damping ratio of the NiTiNOL wire rope was higher than that of the steel wire rope due to the energy dissipation of the phase transition.
The influences of the parameters on the characteristic indicators of the isolator with a NiTiNOL wire rope were studied. The dimensional generalized equivalent stiffness of the isolator is presented in Figure 4. The black solid lines show the results calculated from the parameters shown in Table 1. The equivalent stiffness was symmetric with the balance location. There was a positive initial stiffness induced by the Bouc-Wen hysteresis. The stiffness decreased dramatically and then increased with increasing displacement. Thus, the isolator exhibited a stiffness-softening-hardening characteristic. As shown in Figure 4a, with higher cubic stiffness, the equivalent stiffness increased more dramatically with large displacements. It should be noted that, with k3 = 0, there was still a weak stiffness–hardening characteristic due to the pinching effect, as shown with the red dashed line. As shown in Figure 4b, the Bouc-Wen model parameter β + γ mainly influenced the stiffness-softening characteristic with small displacements. The stiffness softening was more dramatic with a higher β + γ value. With β + γ = 0, the isolator exhibited a stiffness–hardening characteristic at all displacements. The generalized equivalent stiffness was independent of the individual values of β and γ, provided that β + γ was the same. As shown in Figure 4c, the pinching parameter ξ mainly influenced the initial stiffness. With a lower ξ value, the initial stiffness was higher and the stiffness softening was more dramatic. With ξ = 1, the initial stiffness was equal to k1Kc, and it was independent with the Bouc-Wen model. As shown in Figure 4d, the pinching parameter yb influenced the stiffness hardening induced by the pinching effect. With a lower yb value, this part of the stiffness-hardening effect was stronger.
The generalized equivalent damping ratios of the isolator were calculated with Equation (24) and are shown in Figure 5. The black solid lines show the results calculated with the parameters shown in Table 1. The generalized equivalent damping ratio was independent of the frequency, and it increased and then decreased with an increasing vibration amplitude. As shown in Figure 5a, with a constant β + γ value, a higher β value led to a higher damping ratio, and a lower amplitude occurred at the peak damping ratio. As shown in Figure 5b, with a constant β/γ, a higher β + γ value led to a higher peak damping ratio and a lower corresponding amplitude. As shown in Figure 5c, with a higher ξ value, the damping ratio was smaller. As shown in Figure 5d, with a higher yb value, the damping ratio was smaller.
4.2. Frequency Responses
The frequency responses of the displacement transmissibility (TD) were studied to demonstrate the overall isolation performance of the isolators. The peak transmissibility (dimensionless resonant amplitude) and the resonant frequency were calculated. Generally, lower peak transmissibility indicates a stronger damping effect, and a lower resonant frequency indicates a stronger low-frequency vibration isolation ability.
The frequency responses of the isolators with the NiTiNOL and the steel wire ropes were obtained from the harmonic balance analysis introduced in Section 3.1. Figure 6 shows the frequency responses of the isolators with the parameters shown in Table 1. The responding displacement transmissibility with different excitation amplitudes is shown in Figure 6a. With Ab = 0.7 mm, both isolators demonstrated frequency responses with resonant peaks. The peak transmissibility and the resonant frequency of the isolator with the NiTiNOL wire rope were lower, indicating a better isolation performance. With Ab = 1 mm, the isolator with the NiTiNOL wire rope presented a resonant peak, while the isolator with the steel wire rope exhibited an unbounded response. This is a unique phenomenon for nonlinear isolators, and this is because the damping produced by the steel wire rope was not enough to suppress the resonance.
The responses of the isolator with the NiTiNOL wire rope with different excitation amplitudes were compared. With Ab = 1 mm, the resonant frequency and the peak transmissibility are the lowest. This indicates that the relationships among the peak transmissibility, the resonant frequency, and the excitation amplitude are not monotonic, as shown in Figure 6b. With an increasing excitation amplitude, both the peak transmissibility and the resonant frequency decreased and then increased. With Ab-pmin = 1.08 mm, the peak transmissibility reached the lowest value (Tpmin = 2.65), and thus, Ab-pmin was identified as the most suitable excitation amplitude of the isolator for suppressing the resonance. With Ab-rmin = 1 mm, the resonant frequency reached the lowest value (ηrmin = 0.25), and thus, Ab-rmin was identified as the most suitable excitation amplitude of the isolator for low-frequency vibration. The isolator with the steel wire rope also demonstrated non-monotonic relationships among the peak transmissibility, the resonant frequency, and the excitation amplitude, as shown in Figure 6b. The non-monotonic relationships were due to the non-monotonic equivalent stiffness and damping ratio of the isolators, as shown in Figure 3.
The frequency responses of the isolator with the NiTiNOL wire rope with Ab = 1 mm and different isolator parameters were studied. The frequency responses were also calculated from direct integration of Equations (7) and (8) based on the Runge–Kutta method. The results calculated from the harmonic balance analysis (denoted as “HBM results” in the following figures) coincide well with the Runge–Kutta method, based on the numerical results (denoted as “RK results” in the following figures). This verifies the effectiveness of the alternating frequency/time domain technique in dealing with the modified Bouc-Wen model, and that the third-order assumption of Equation (10) is reasonable.
The frequency responses with different values of β/γ are shown in Figure 7. As discussed in Section 4.1, β/γ influenced the equivalent damping ratio, while it did not affect the equivalent stiffness. Thus, with a higher β/γ value, the peak transmissibility was lower, while the resonant frequency change was not obvious. Table 2 shows the lowest peak transmissibility Tpmin, the lowest resonant frequency ηrmin, and the corre-sponding excitation amplitudes, Ab-pmin and Ab-rmin. Higher β/γ values led to lower Tpmin, higher Ab-pmin, and higher Ab-rmin values, while the ηrmin value stayed approximately the same.
The frequency responses of the isolator with Ab = 1 mm and different values of β + γ are presented in Figure 8. With higher β + γ values, the peak transmissibility was lower due to a higher equivalent damping ratio, as shown in Figure 5b. The resonant frequency was lower due to the lower equivalent stiffness, as shown in Figure 4b. As shown in Table 3, higher β + γ values led to lower Tpmin, lower Ab-pmin, and lower ηrmin values, while the relationship between Ab-rmin and β + γ was not monotonic.
The frequency responses of the isolator with Ab = 1 mm and different values of ξ are shown in Figure 9. With higher ξ values, the peak transmissibility was higher due to a smaller equivalent damping ratio, as shown in Figure 5c. The resonant frequency was lower due to the lower equivalent stiffness, as shown in Figure 4c. As shown in Table 4, higher ξ values led to higher Tpmin, lower Ab-pmin, lower ηrmin, and lower Ab-rmin values.
The influences of the linear spring stiffness (Ks) on the responses were equivalent to the influences of the dimensionless parameter k1. The frequency responses of the isolator with Ab = 1 mm and different values of k1 are presented in Figure 10, including k1 = 0.02 (Ks = 2.26 N/mm), k1 = 0.025 (Ks = 13.33 N/mm), and k1 = 0.03 (Ks = 24.40 N/mm). With higher k1 (Ks) values, both the peak transmissibility and the resonant frequency became higher, while the load capacity of the isolator was enhanced. As shown in Table 5, higher k1 (Ks) values led to higher Tpmin, lower Ab-pmin, higher ηrmin, and lower Ab-rmin values.
The isolator with strong nonlinearity exhibited diverse nonlinear phenomena, such as jump phenomena. Figure 11 presents two types of jump phenomena, with the stable branches shown as black solid lines, and the unstable branches shown as red dashed lines. Generally, the jump phenomenon tends to exist with weak damping, namely a low β/γ value. With low k3, high β + γ, and low ξ values, the equivalent stiffness decreased dramatically at small displacements, and the stiffness-softening type of jump phenomenon could occur. As shown in Figure 11a, with k1 = 0.02, k3 = 0, β = 0.1, γ = 1.9, ξ = 0, and Ab = 1 mm, the resonance peak bends to the left and the jump-down frequency is lower than the resonant frequency. With high k3 and low β + γ values, the equivalent stiffness increased dramatically at large displacements, and the stiffness-hardening type of jump phenomenon could occur. As shown in Figure 11b, with k1 = 0.02, k3 = 0.014, β = 0.1, γ = 0.4, ξ = 0.5, yb = 215.57, and Ab = 1 mm, the resonance peak bends to the right and the jump-down frequency is higher than the resonant frequency.
To verify the analysis method of the frequency responses, the calculation results were compared with the experimental and numerical results of a damper with NiTiNOL wire ropes used in [35]. The wire ropes are horizontal and symmetrically arranged, and the structure is similar to the proposed isolator, as shown in Figure 1, without the linear spring. Therefore, the proposed modeling and analysis methods were applied to the damper. The damper was tested under swept-frequency experiments with a constant acceleration amplitude, and the responding displacement amplitude was measured. Similar to Equation (6), the dynamic model of the damper in the experiment can be expressed as
where Ub and fb are the amplitude and the frequency of the excitation acceleration, respectively, and Z is expressed in Equation (4). The damper was tested in two conditions, and the identified parameters are shown in Table 6 [35].
The frequency responses of the damper with NiTiNOL wire ropes under two excitation acceleration amplitudes are shown in Figure 12. The results calculated from the proposed harmonic balance analysis essentially coincide with the Runge–Kutta-based numerical results and the experimental results demonstrated in [35]. The main differences appeared in two ways. The experimental results with Ub = 7.68 m/s2 exhibited the stiffness-softening phenomenon, while both the proposed method and the numerical integration failed to characterize the phenomenon. The harmonic balance analysis failed to present the super-harmonic resonances at about fb = 2.4 Hz, as demonstrated in the numerical results due to the truncation error of Equations (10) and (11). The numerical results and the experimental results verify the effectiveness of the proposed harmonic balance analysis.
5. Conclusions
In this study, we proposed a nonlinear isolator with a horizontal NiTiNOL wire rope, providing nonlinear stiffness and nonlinear damping, and a vertical linear spring, enhancing the load capacity. The nonlinearities were derived from geometric constraints, inner frictions, and phase transitions of the material. The restoring force model of the wire rope was established by a combined method of a beam constraint model and a Bouc-Wen model. The dynamic model of the nonlinear isolator was constructed and the frequency responses were analyzed through a harmonic balance method with an alternating frequency/time domain technique. The generalized equivalent stiffness and generalized equivalent damping ratio were defined considering the influences of the hysteretic damping and the pinching effect. Numerical simulations allowed us to draw the following conclusions.
The isolator exhibited a stiffness-softening-hardening characteristic. In a dimensionless form, the initial stiffness, the stiffness softening at small displacements, and the stiffness hardening at large displacements mainly depended on the pinching parameter ξ, the Bouc-Wen parameter β + γ, and the cubic stiffness k3, respectively. The generalized equivalent damping ratio increased and then decreased with increasing displacement. The Bouc-Wen parameters and the pinching parameter ξ showed obvious influences on the damping ratio. Both the stiffness and the damping changes were non-monotonic. Compared to the isolator with a steel wire rope, the NiTiNOL wire rope decreased the initial equivalent stiffness and increased the damping. The isolator with the NiTiNOL wire rope enhanced the vibration isolation performance.
The peak displacement transmissibility and the resonant frequency of the isolator were related to the excitation amplitude, and the relationships were non-monotonic. There were excitation amplitudes corresponding to the minimum peak transmissibility and the lowest resonant frequency, respectively, and they are referred to as the most suitable excitation amplitudes of the isolator. The isolator parameters affected these indexes in different ways depending on their influences on the stiffness and damping characteristics. With low cubic stiffness, high Bouc-Wen hysteresis, and a weak pinching effect, the isolator tended to demonstrate a stiffness-softening type of jump phenomenon, and the stiffness-hardening type of jump phenomenon tended to occur with contrary parameters.
Author Contributions
Conceptualization, L.-Q.C. and M.-Q.N.; methodology, M.-Q.N. and L.-Q.C.; software, M.-Q.N.; validation, M.-Q.N.; formal analysis, M.-Q.N.; investigation, M.-Q.N. and L.-Q.C.; resources, M.-Q.N. and L.-Q.C.; data curation, M.-Q.N.; writing—original draft preparation, M.-Q.N.; writing—review and editing, L.-Q.C.; visualization, M.-Q.N.; supervision, L.-Q.C.; project administration, L.-Q.C.; funding acquisition, M.-Q.N. and L.-Q.C. All authors have read and agreed to the published version of the manuscript.
Funding
This research was funded by the National Natural Science Foundation of China, grant numbers 11902097 and 11872159.
Institutional Review Board Statement
Not applicable.
Informed Consent Statement
Not applicable.
Data Availability Statement
The data presented in this study are available on request from the corresponding author.
Conflicts of Interest
The authors declare no conflict of interest.
References
- Ibrahim, R.A. Recent advances in nonlinear passive vibration isolators. J. Sound Vib. 2008, 314, 371–452. [Google Scholar] [CrossRef]
- Yan, G.; Zou, H.X.; Wang, S.; Zhao, L.C.; Wu, Z.Y.; Zhang, W.M. Bio-inspired vibration isolation: Methodology and design. Appl. Mech. Rev. 2021, 73, 020801. [Google Scholar] [CrossRef]
- Balaji, P.S.; SelvaKumar, K.K. Applications of nonlinearity in passive vibration control: A review. J. Vib. Eng. Technol. 2021, 9, 183–213. [Google Scholar] [CrossRef]
- Zhao, F.; Ji, J.; Luo, Q.; Cao, S.; Chen, L.; Du, W. An improved quasi-zero stiffness isolator with two pairs of oblique springs to increase isolation frequency band. Nonlinear Dyn. 2021, 104, 249–365. [Google Scholar] [CrossRef]
- Gatti, G. Statics and dynamics of a nonlinear oscillator with quasi-zero stiffness behaviour for large deflections. Commun. Nonlinear Sci. 2020, 83, 105143. [Google Scholar] [CrossRef]
- Wang, X.; Liu, H.; Chen, Y.; Gao, P. Beneficial stiffness design of a high-static-low-dynamic-stiffness vibration isolator based on static and dynamic analysis. Int. J. Mech. Sci. 2018, 142, 235–244. [Google Scholar] [CrossRef]
- Yan, L.; Xuan, S.; Gong, X. Shock isolation performance of a geometric anti-spring isolator. J. Sound Vib. 2018, 413, 120–143. [Google Scholar] [CrossRef]
- Fulcher, B.A.; Shahan, D.W.; Haberman, M.R.; Seepersad, C.C.; Wilson, P.S. Analytical and experimental investigation of buckled beams as negative stiffness elements for passive vibration and shock isolation systems. J. Vib. Acoust. 2014, 136, 031009. [Google Scholar] [CrossRef]
- Huang, X.; Liu, X.; Sun, J.; Zhang, Z.; Hua, H. Vibration isolation characteristics of a nonlinear isolator using Euler buckled beam as negative stiffness corrector: A theoretical and experimental study. J. Sound Vib. 2014, 333, 1132–1148. [Google Scholar] [CrossRef]
- Yao, Y.; Li, H.; Li, Y.; Wang, X. Analytical and experimental investigation of a high-static-low-dynamic stiffness isolator with cam-roller-spring mechanism. Int. J. Mech. Sci. 2020, 186, 10588. [Google Scholar] [CrossRef]
- Sun, Y.; Zhou, J.; Thompson, D.; Yuan, T.; Gong, D.; You, T. Design, analysis and experimental validation of high static and low dynamic stiffness mounts based on target force curves. Int. J. Non-Linear. Mech. 2020, 126, 103559. [Google Scholar] [CrossRef]
- Zhou, J.; Xiao, Q.; Xu, D.; Ouyang, H.; Li, Y. A novel quasi-zero-stiffness strut and its applications in six-degree-of-freedom vibration isolation platform. J. Sound Vib. 2017, 394, 59–74. [Google Scholar] [CrossRef]
- Oyelade, A.O. Experiment study on nonlinear oscillator containing magnetic spring with negative stiffness. Int. J. Non-Linear Mech. 2020, 120, 103396. [Google Scholar] [CrossRef]
- Wang, S.; Xin, W.; Ning, Y.; Li, B.; Hu, Y. Design, experiment, and improvement of a quasi-zero-stiffness vibration isolation system. Appl. Sci. 2020, 10, 2273. [Google Scholar] [CrossRef] [Green Version]
- Zhou, J.; Wang, K.; Xu, D.; Ouyang, H.; Fu, Y. Vibration isolation in neonatal transport by using a quasi-zero-stiffness isolator. J. Vib. Control. 2018, 24, 3278–3291. [Google Scholar] [CrossRef]
- Lu, Z.Q.; Brennan, M.; Ding, H.; Chen, L.Q. High-static-low-dynamic-stiffness vibration isolation enhanced by damping nonlinearity. Sci. China Technol. Sci. 2019, 62, 1103–1110. [Google Scholar] [CrossRef] [Green Version]
- Cheng, C.; Li, S.; Wang, Y.; Jiang, X. Force and displacement transmissibility of a quasi-zero stiffness vibration isolator with geometric nonlinear damping. Nonlinear Dyn. 2017, 87, 2267–2279. [Google Scholar] [CrossRef]
- Liu, Y.; Xu, L.; Song, C.; Gu, H.; Ji, W. Dynamic characteristics of a quasi-zero stiffness vibration isolator with nonlinear stiffness and damping. Arch. Appl. Mech. 2019, 89, 1743–1759. [Google Scholar] [CrossRef]
- Bian, J.; Jing, X. Superior nonlinear passive damping characteristics of the bio-inspired limb-like or X-shaped structure. Mech. Syst. Signal Pract. 2019, 125, 21–51. [Google Scholar] [CrossRef]
- Yan, G.; Zou, H.X.; Wang, S.; Zhao, L.C.; Gao, Q.H.; Tan, T.; Zhang, W.M. Large stroke quasi-zero stiffness vibration isolator using three-link mechanism. J. Sound Vib. 2020, 478, 115344. [Google Scholar] [CrossRef]
- Marino, L.; Cicirello, A. Experimental investigation of a single-degree-of-freedom system with Coulomb friction. Nonlinear Dyn. 2020, 99, 1781–1799. [Google Scholar] [CrossRef] [Green Version]
- Donmez, A.; Cigeroglu, E.; Ozgen, G.O. An improved quasi-zero stiffness vibration isolation system utilizing dry friction damping. Nonlinear Dyn. 2020, 101, 107–121. [Google Scholar] [CrossRef]
- Kiani, M.; Amiri, J.V. Effects of hysteretic damping on the seismic performance of tuned mass dampers. Struct. Des. Tall Spec. 2019, 28, e1555. [Google Scholar] [CrossRef] [Green Version]
- Maiti, S.; Bandyopadhyay, R.; Chatterjee, A. Vibrations of an Euler-Bernoulli beam with hysteretic damping arising from dispersed frictional microcracks. J. Sound Vib. 2018, 412, 287–308. [Google Scholar] [CrossRef]
- Yan, B.; Wang, Z.; Ma, H.; Bao, H.; Wang, K.; Wu, C. A novel lever-type vibration isolator with eddy current damping. J. Sound Vib. 2021, 494, 115862. [Google Scholar] [CrossRef]
- Amjadian, M.; Agrawal, A.K. Modeling, design, and testing of a proof-of-concept prototype damper with friction and eddy current damping effects. J. Sound Vib. 2018, 413, 225–249. [Google Scholar] [CrossRef]
- Huang, D.; Xu, W.; Xie, W.; Liu, Y. Dynamical properties of a forced vibration isolation system with real-power nonlinearities in restoring and damping forces. Nonlinear Dynam. 2015, 81, 641–658. [Google Scholar] [CrossRef]
- Ho, C.; Lang, Z.Q.; Billings, L.A. Design of vibration isolators by exploiting the beneficial effects of stiffness and damping nonlinearities. J. Sound Vib. 2014, 333, 2489–2504. [Google Scholar] [CrossRef]
- Liu, C.; Yu, K.; Tang, J. New insights into the damping characteristics of a typical quasi-zero-stiffness vibration isolator. Int. J. Non-Linear Mech. 2020, 124, 103511. [Google Scholar] [CrossRef]
- Okuizumi, N.; Kimura, K. Multiple time scale analysis of hysteretic systems subjected to harmonic excitation. J. Sound Vib. 2004, 272, 675–701. [Google Scholar] [CrossRef]
- Casalotti, A.; Lacarbonara, W. Tailoring of pinched hysteresis for nonlinear vibration absorption via asymptotic analysis. Int. J. Non-Linear Mech. 2017, 94, 59–71. [Google Scholar] [CrossRef]
- Yuan, T.C.; Yang, J.; Chen, L.Q. A harmonic balance approach with alternating frequency/time domain progress for piezoelectric mechanical systems. Mech. Syst. Signal Process. 2019, 120, 274–289. [Google Scholar] [CrossRef]
- Barbieri, N.; Barbieri, R.; Silva, R.A.; Mannala, M.J.; Barbieri, L.S.V. Nonlinear dynamic analysis of wire-rope isolator and Stockbridge damper. Nonlinear Dyn. 2016, 86, 501–512. [Google Scholar] [CrossRef]
- Carpineto, N.; Lacarbonara, W.; Vestroni, F. Hysteretic tuned mass dampers for structural vibration mitigation. J. Sound Vib. 2014, 333, 1302–1318. [Google Scholar] [CrossRef]
- Carboni, B.; Lacarbonara, W. Nonlinear vibration absorber with pinched hysteresis: Theory and experiments. J. Eng. Mech. 2016, 142, 04016023. [Google Scholar] [CrossRef]
- Carboni, B.; Lacarbonara, W.; Brewick, P.T.; Masri, S.F. Dynamical response identification of a class of nonlinear hysteretic systems. J. Intell. Mater. Syst. Struct. 2018, 29, 2795–2810. [Google Scholar] [CrossRef]
- Zhang, Y.; Xu, K.; Zang, J.; Ni, Z.; Zhu, Y.; Chen, L. Dynamic design of a nonlinear energy sink with NiTiNOL-steel wire ropes based on nonlinear output frequency response functions. Appl. Math. Mech. Engl. 2019, 40, 1791–1804. [Google Scholar] [CrossRef]
- Zheng, L.H.; Zhang, Y.W.; Ding, H.; Chen, L.Q. Nonlinear vibration suppression of composite laminated beam embedded with NiTiNOL-steel wire ropes. Nonlinear Dyn. 2021, 103, 2391–2407. [Google Scholar] [CrossRef]
- Leblouba, M.; Rahman, M.E.; Barakat, S. Behavior of polycal wire rope isolators subjected to large lateral deformations. Eng. Struct. 2019, 191, 117–128. [Google Scholar] [CrossRef]
- Lu, Z.Q.; Gu, D.H.; Ding, H.; Lacarbonara, W.; Chen, L.Q. A ring vibration isolator enhanced by shape memory pseudoelasticity. Appl. Math. Model. 2021, 100, 1–15. [Google Scholar] [CrossRef]
- Salvatore, A.; Carboni, B.; Chen, L.Q.; Lacarbonara, W. Nonlinear dynamic response of a wire rope isolator: Experiment, identification and validation. Eng. Struct. 2021, 238, 112121. [Google Scholar] [CrossRef]
- Niu, M.Q.; Chen, L.Q. Nonlinear vibration isolation via a compliant mechanism and wire ropes. Nonlinear Dyn. 2021. [Google Scholar] [CrossRef]
- Awtar, S.; Sen, S. A generalized constraint model for two-dimensional beam flexures: Nonlinear load-displacement formulation. J. Mech. Des. 2010, 132, 081008. [Google Scholar] [CrossRef]
- Lacarbonara, W. Nonlinear Structural Mechanics—Theory, Dynamic Phenomena and Modeling; Springer: New York, NY, USA, 2013; pp. 16–20. [Google Scholar]
- Carboni, B.; Lacarbonara, W.; Auricchio, F. Hysteresis of multiconfiguration assemblies of nitinol and steel strands: Experiments and phenomenological identification. J. Eng. Mech. 2015, 141, 04014135. [Google Scholar] [CrossRef]
Figure 1.
Vibration isolator with a NiTiNOL wire rope.
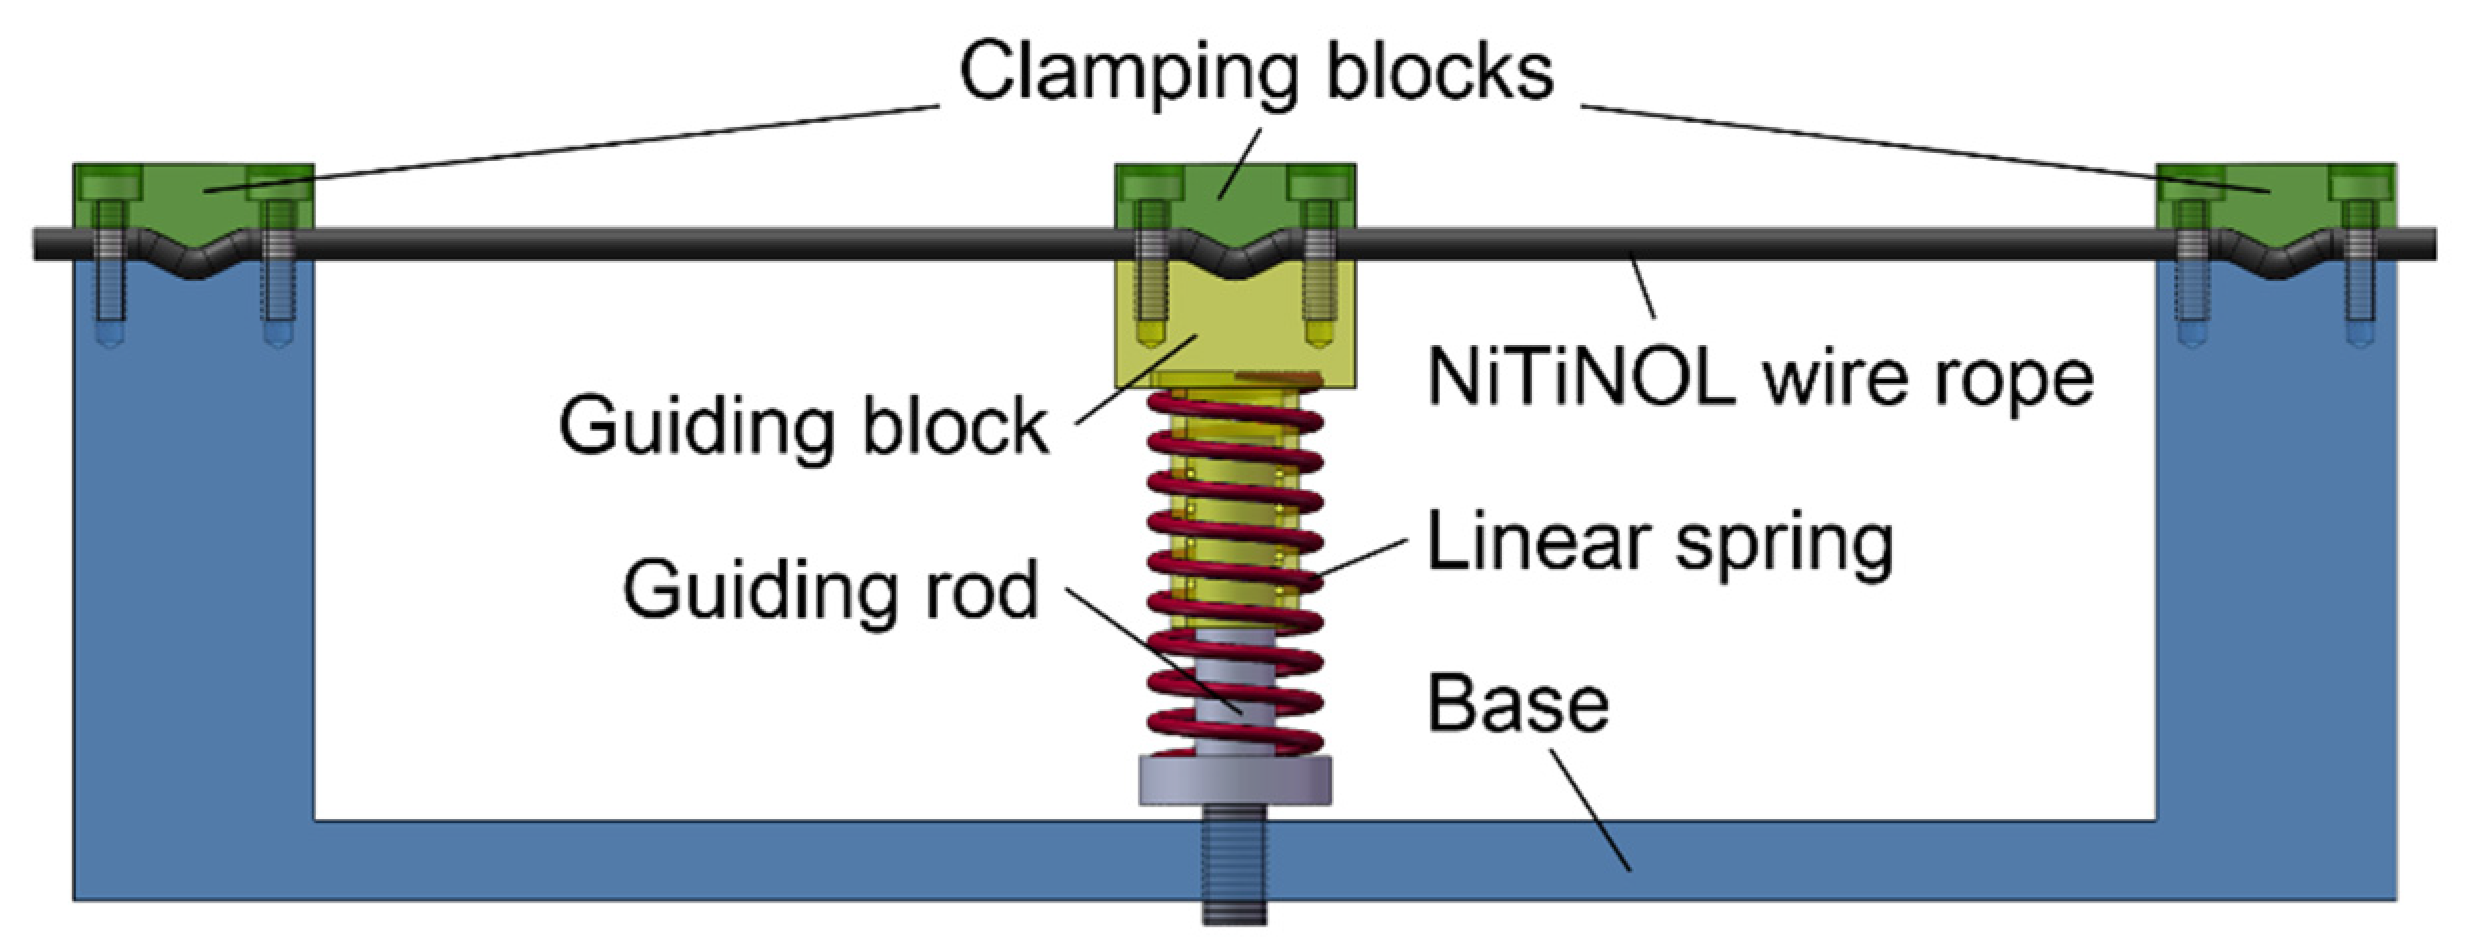
Figure 2.
Restoring forces of the isolators with a steel wire rope and a NiTiNOL wire rope.

Figure 3.
The characteristic indicators of the isolators with a steel wire rope and a NiTiNOL wire rope. (a) The generalized equivalent stiffness and (b) the generalized equivalent damping ratio.
Figure 3.
The characteristic indicators of the isolators with a steel wire rope and a NiTiNOL wire rope. (a) The generalized equivalent stiffness and (b) the generalized equivalent damping ratio.

Figure 4.
The generalized equivalent stiffness of the isolator with different (a) cubic stiffness k3, (b) Bouc-Wen model parameters (β + γ), (c) pinching parameters ξ, and (d) pinching parameters yb.
Figure 4.
The generalized equivalent stiffness of the isolator with different (a) cubic stiffness k3, (b) Bouc-Wen model parameters (β + γ), (c) pinching parameters ξ, and (d) pinching parameters yb.

Figure 5.
The generalized equivalent damping ratio of the isolator with different (a) Bouc-Wen model parameters (β/γ), (b) Bouc-Wen model parameters (β + γ), (c) pinching parameters ξ, and (d) pinching parameters yb.
Figure 5.
The generalized equivalent damping ratio of the isolator with different (a) Bouc-Wen model parameters (β/γ), (b) Bouc-Wen model parameters (β + γ), (c) pinching parameters ξ, and (d) pinching parameters yb.

Figure 6.
The frequency responses of the isolators. (a) The displacement transmissibility with different excitation amplitudes, and (b) the relationships among the peak transmissibility, the resonant frequency, and the excitation amplitude.
Figure 6.
The frequency responses of the isolators. (a) The displacement transmissibility with different excitation amplitudes, and (b) the relationships among the peak transmissibility, the resonant frequency, and the excitation amplitude.

Figure 7.
The frequency responses with Ab = 1 mm and different values of β/γ.

Figure 8.
The frequency responses of the isolator with different values of β + γ.

Figure 9.
The frequency responses of the isolator with different values of ξ.

Figure 10.
The frequency responses of the isolator with different values of k1.

Figure 11.
The frequency responses with jump phenomena. (a) Stiffness softening and (b) stiffness hardening.
Figure 11.
The frequency responses with jump phenomena. (a) Stiffness softening and (b) stiffness hardening.

Figure 12.
The frequency responses of the damper under the excitation acceleration amplitudes of 6.35 m/s2 and 7.68 m/s2 [35]. “HBM”, “RK”, and “Exp” denote the results of the harmonic balance analysis, the Runge–Kutta-based numerical integration, and the experiments, respectively.
Figure 12.
The frequency responses of the damper under the excitation acceleration amplitudes of 6.35 m/s2 and 7.68 m/s2 [35]. “HBM”, “RK”, and “Exp” denote the results of the harmonic balance analysis, the Runge–Kutta-based numerical integration, and the experiments, respectively.


Table 1.
Dimensional parameters of the isolators with a NiTiNOL wire rope and a steel wire rope.
| Material | Ks (N/mm) | Kw1 (N/mm) | Kw3 (N/mm3) | Kd (N/mm) | ξ | Yb (mm2) | G (mm−1) | B (mm−1) | nb |
|---|---|---|---|---|---|---|---|---|---|
| NiTiNOL | 2.26 | 2.17 | 0.53 | 217 | 0.9 | 215.57 | 0.591 | 0.501 | 1 |
| Steel | 2.26 | 5.66 | 0.53 | 21 | 0 | / | 0.500 | 0.544 | 1 |
Table 2.
The lowest peak transmissibility/resonant frequency and the corresponding excitation amplitudes with different values of β/γ.
Table 2.
The lowest peak transmissibility/resonant frequency and the corresponding excitation amplitudes with different values of β/γ.
| Tpmin | Ab-pmin | ηrmin | Ab-rmin | |
|---|---|---|---|---|
| β = 0.25, γ = 0.842 | 3.29 | 1.00 mm | 0.26 | 0.99 mm |
| β = 0.501, γ = 0.591 | 2.65 | 1.08 mm | 0.25 | 1.00 mm |
| β = 0.75, γ = 0.342 | 2.37 | 1.16 mm | 0.25 | 1.16 mm |
Table 3.
The lowest peak transmissibility/resonant frequency and the corresponding excitation amplitudes with different values of β + γ.
Table 3.
The lowest peak transmissibility/resonant frequency and the corresponding excitation amplitudes with different values of β + γ.
| Tpmin | Ab-pmin | ηrmin | Ab-rmin | |
|---|---|---|---|---|
| β = 0.251, γ = 0.296 | 3.48 | 1.22 mm | 0.30 | 0.82 mm |
| β = 0.501, γ = 0.591 | 2.65 | 1.08 mm | 0.25 | 1.00 mm |
| β = 0.752, γ = 0.887 | 2.39 | 0.92 mm | 0.23 | 0.92 mm |
Table 4.
The lowest peak transmissibility/resonant frequency and the corresponding excitation amplitudes with different values of ξ.
Table 4.
The lowest peak transmissibility/resonant frequency and the corresponding excitation amplitudes with different values of ξ.
| Tpmin | Ab-pmin | ηrmin | Ab-rmin | |
|---|---|---|---|---|
| ξ = 0.7 | 1.81 | 2.20 mm | 0.33 | 2.10 mm |
| ξ = 0.8 | 2.04 | 1.74 mm | 0.30 | 1.72 mm |
| ξ = 0.9 | 2.65 | 1.08 mm | 0.25 | 1.00 mm |
Table 5.
The lowest peak transmissibility/resonant frequency and the corresponding excitation amplitudes with different values of k1.
Table 5.
The lowest peak transmissibility/resonant frequency and the corresponding excitation amplitudes with different values of k1.
| Tpmin | Ab-pmin | ηrmin | Ab-rmin | |
|---|---|---|---|---|
| k1 = 0.2 | 2.65 | 1.08 mm | 0.25 | 1.00 mm |
| k1 = 0.25 | 2.84 | 1.00 mm | 0.26 | 0.95 mm |
| k1 = 0.3 | 3.03 | 0.92 mm | 0.27 | 0.92 mm |
Table 6.
The identified parameters of the damper experiments [35].
Table 6.
The identified parameters of the damper experiments [35].
| M | Kw1 | Ub | Kd | ξ | Yb | G | B | nb |
|---|---|---|---|---|---|---|---|---|
| 6.46 kg | 4.18 kN/m | 6.35 m/s2 | 58.5 kN/m | 0.587 | 112 mm2 | 0.544 kN−nb+1/mm | 0.823 kN−nb+1/mm | 1.2 |
| 6.46 kg | 4.47 kN/m | 7.68 m/s2 | 100 kN/m | 0.294 | 950 mm2 | 2 kN−nb+1/mm | 1.831 kN−nb+1/mm | 1.2 |
Publisher’s Note: MDPI stays neutral with regard to jurisdictional claims in published maps and institutional affiliations. |
© 2021 by the authors. Licensee MDPI, Basel, Switzerland. This article is an open access article distributed under the terms and conditions of the Creative Commons Attribution (CC BY) license (https://creativecommons.org/licenses/by/4.0/).
Share and Cite
MDPI and ACS Style
Niu, M.-Q.; Chen, L.-Q. Nonlinear Vibration Isolation via a NiTiNOL Wire Rope. Appl. Sci. 2021, 11, 10032. https://doi.org/10.3390/app112110032
AMA Style
Niu M-Q, Chen L-Q. Nonlinear Vibration Isolation via a NiTiNOL Wire Rope. Applied Sciences. 2021; 11(21):10032. https://doi.org/10.3390/app112110032
Chicago/Turabian StyleNiu, Mu-Qing, and Li-Qun Chen. 2021. "Nonlinear Vibration Isolation via a NiTiNOL Wire Rope" Applied Sciences 11, no. 21: 10032. https://doi.org/10.3390/app112110032
Note that from the first issue of 2016, this journal uses article numbers instead of page numbers. See further details here.