Article

Intermolecular Hydrogen-Bond Interactions in DPPE and DMPC Phospholipid Membranes Revealed by Far-Infrared Spectroscopy

by
Valeria Conti Nibali
*,
Caterina Branca
,
Ulderico Wanderlingh
and
Giovanna D’Angelo
Dipartimento di Scienze Matematiche e Informatiche, Scienze Fisiche e Scienze della Terra, Università di Messina, 98166 Messina, Italy
*
Author to whom correspondence should be addressed.
Appl. Sci. 2021, 11(21), 10038; https://doi.org/10.3390/app112110038
Submission received: 16 September 2021 / Revised: 13 October 2021 / Accepted: 20 October 2021 / Published: 27 October 2021
(This article belongs to the Special Issue Advances of THz Spectroscopy)

Abstract

:
The vibrational signature in the far-infrared region of two different phospholipids, phosphatidylcholine (PC) and phosphatidylethanolamine (PE), was investigated as a function of relative humidity from 0 to 75% in order to evaluate the effect of headgroup composition on the formation of intermolecular interactions. The substructures of the frequency region between 50 and 300 cm−1 were identified, and changes in the frequency and intensity of the related vibrations with hydration were analyzed. Interestingly, in PE, two additional vibrational bands with respect to PC were found at 162 and 236 cm−1 and assigned to intermolecular hydrogen bonds between the hydrogen-bond-donating groups, - NH 3 + , and hydrogen-bond-accepting groups, —P—O− and —COO, of adjacent molecules. The presence of these interactions also affected the penetration of water, severely reducing the hydration capability of PE lipids.

1. Introduction

In recent years, with new sources accessing the so-called “terahertz gap”—i.e., the region of the electromagnetic spectrum from 0.3 to 20 THz (from ~10 to 600 cm−1 ≃ 1 to 80 meV, with 1 THz = 33.33 cm−1 = 4.14 meV) between the dielectric and the infrared regimes—there has been a major effort to characterize the sub-picoseconds dynamics in biological molecules in order to reveal the possible link to their biological significance. In the case of phospholipid membranes, phonon-like acoustic modes (~5–10 meV) have been related to the mechanism of passive transport across the phospholipid bilayer [1,2,3], while higher energy optical modes (<35 meV) have been proposed to be involved in the vibrational energy transfer and hydrogen bonding at the bilayer–water interface [4]. Additionally, the hydrogen bond network of water exhibits vibrational resonances in the THz frequency range, and, consequently, the dynamical coupling between biomolecules and their hydration water is particularly effective in this range [5]. In particular, attention has been focused both on the identification of the intrinsic low-frequency vibrations of the biosystems—e.g., by means of studies on dry systems—and on the effect of hydration on these vibrations. In this regard, studies as a function of hydration, ranging from the dry state to full hydration, have allowed us to investigate both issues. Within phospholipid membranes, intermolecular hydrogen-bonding interactions between water–water, water–lipid, and lipid–lipid molecules, together with torsional modes of the hydrocarbon chains and skeleton vibrations, are found to contribute to the THz region [6]. Thus, studies in this spectral range can provide insights into the intermolecular hydrogen bonding signatures of self-assembled phospholipids [7].
In a previous study using far-infrared spectroscopy, our group probed intermolecular interactions in a phospholipid membrane model—namely, DMPC (1,2-dimyristoyl-sn-glycero-3-phosphocholine, C36H72NO8P) stack bilayers—and showed that this system sustains several low-frequency optical modes, most of which attributable to van der Waals intermolecular lipid–lipid vibrations [6], thus confirming the complex scenario proposed by molecular dynamics simulations [1]. With the aim of identifying the intrinsic vibrations of the membrane and evaluating the effect of the hydration water on the vibrations, we carried out measurements as a function of hydration, including the dry state. The measurements were carried out at different dehydration times, corresponding to different hydration degrees. Our findings showed that the intrinsic THz dynamics of the membrane were only slightly affected by hydration, with the same vibrational modes characterizing both the dry and the wet samples and with the hydration mainly influencing the vibrational width of the modes. Additionally, the results revealed a strong similarity between the THz dynamics of the lipids and those of water, thus, pointing to an effective biosystem-solvent dynamical coupling due to resonance mechanisms.
Here, we aim to investigate the THz dynamics of a phospholipid membrane with a phosphatidylethanolamine (PE) headgroup and compare them with those of a membrane with a phosphatidylcholine (PC) headgroup. As detailed below, these two headgroups mainly differ with respect to their intermolecular interaction principles [8]. We thus point to understand if and how the differences in the intermolecular interactions of these two model membranes may reflect their THz spectral signatures.
PC and PE headgroups are two of four primary headgroups for the phospholipids found in eukaryotic cell membranes. PE lipids largely contribute to the total quantity of lipids in the inner membrane of E. coli (75–80%), in eukaryotic membranes (15–25%), and in mammalian brains (up to 45%) [9]. While the PC headgroup consists of a fully methylated ammonium group CH 3 3 N + , the PE headgroup is characterized by the presence of an ammonium group ( - NH 3 + ) (Figure 1).
One substantial difference between PC and PE headgroups concerns the capability of forming intermolecular (lipid–lipid) hydrogen bonds. In PE, intermolecular hydrogen bonds between adjacent lipids are formed between ammonium nitrogen and phosphate oxygen. This linkage results in a very compact, rigid headgroup lattice at the bilayer surface that shows a reduced capability of hydration and is largely unaffected by both hydration and temperature [8]. Though in aggregated lipids with aligned headgroups the - NH 3 +   group interacts with the - PO 4 - in particular, other combinations are possible—e.g., combinations involving the ester carbonyl groups [9]. In contrast, in PC the methylated ammonium group does not allow the formation of such close PO···N contact and thus PC does not form intermolecular, lipid–lipid hydrogen bonds. In PC, water molecules of hydration replace the ammonium links of PE and are thus incorporated into the headgroup lattice to form hydrogen bonds with the phosphate oxygens linking phosphate groups into ribbons and shielding groups of an equal charge. In other words, water molecules form water bridges, with each molecule being simultaneously bonded to the phosphate oxygen atom of two lipid molecules. Thus, PC bilayers have been described as an extended network of inter-lipid links via water bridges and charge pairs [10]; in contrast with the rigid PE lattice, the PC lattice exhibits considerable flexibility [8].
A second main difference between PC and PE lipids involves hydration interactions. In PE, water can be strongly hydrogen bound to the - NH 3 +   group, as well as to the phosphate group and ester oxygens. On the other hand, in PC water molecules associate with the choline group via polar interactions, which are weaker than the direct hydrogen-bonding interactions that occur with the phosphate oxygens and the ester oxygens [4]. Additionally, it has been found that the solvent structure around PC headgroups is significantly different from that around PE headgroups. In the former case, the formation of clathrates in the water hydrating the PC headgroup is observed, while in the latter the structure is determined by hydrogen-bonding interactions in the environment of the PE headgroup [11].
Other fundamental differences between the PC-based and PE-based lipid bilayers concern (i) the space requirements—e.g., the area per lipid and the interlamellar solvent distance, which are both larger in PC membranes; (ii) the degree of hydration of the headgroup, which is lower for smaller PE headgroups; and (iii) the gel to liquid crystalline temperature, which is higher for PE headgroups [11].
Here, we report the results of an experimental study of the far-infrared region on DMPC and DPPE stack bilayers (1,2-dipalmitoyl-sn-glycero-3-phosphoethanolamine, C37H74NO8P) at various hydrations, with the aim of highlighting the spectral differences in the THz frequency range of lipid membranes that differ with respect to their intermolecular interaction modalities. Measurements carried out at different hydration degrees were aimed at revealing if and how the intrinsic THz dynamics of the two investigated phospholipid membranes, deducible from the dry sample, may be differently affected by, and coupled to, the vibration excitations of their hydration water.

2. Materials and Methods

2.1. Preparation of the Samples

DMPC and DPPE were obtained from Avanti Polar Lipids. Aligned stacks bilayers were obtained by means of a standard procedure [12] that consisted of (i) dissolving the lipids in an excess of (2:1) CHCl3/CH3OH (chloroform/methanol) solution; (ii) drying the solution; (iii) for each milligram of lipid, redissolving it in 15 μL with a (1:1) molar ratio of naphthalene to lipid; (iv) removing the naphthalene and any residual organic solvent; (v) vacuum-drying the samples overnight; (vi) after placing the lipid multilayers on the ATR crystal, regulating the hydration degree of the samples by adsorption via the gas phase corresponding to relative humidities between 11% and 75% by changing the RH of the ambient gas phase at a fixed temperature using saturated salt solutions. The saturated salt solution, consisting of a mixture of distilled water and chemically pure salt, was enclosed in a chamber that was placed in close proximity to the sample, then the working space was sealed by a cup. We selected a series of salts (LiCl, K2CO3, Mg(NO3)2, NH4NO3, NaCl) in order to obtain a specific relative humidity. In Table 1, the saturated salt solutions, together with the corresponding values of equilibrium relative humidity, are listed for the temperature of 25 °C. Additionally, we investigated a fully dehydrated sample (named dry sample in the following) and checked the complete dehydration based on the observation of the disappearance of the water vibrational bands in the spectrum in the OH stretching region (data not shown), as detailed in [6].
In order to estimate the molar water–to–lipid ratio, nw, directly from the spectra, we quantitatively analyzed the shape of infrared bands (data not shown [13]). We evaluated the area under the CH2 stretching bands (the methylene band) at different water contents. Indeed, such an area is proportional to the concentration of the lipid molecules within the multilayer and, consequently, to the fraction of the volume occupied by phospholipid molecules. Therefore, by evaluating the ratio of the total area of the methylene band in hydrated samples, ACH2,wet, normalized to the refractive index of the sample at each hydration to the total area of this band in the dry sample, ACH2,dry, we calculated the fraction of volumes available to water molecules in the hydrated samples, and, therefore, estimated their number by nw = (1 − (ACH2,wet/ACH2,dry)VL/VW).

2.2. FTIR–ATR Measurements

Fourier-transform infrared (FT-IR) spectra were recorded at 25 °C in attenuated total reflectance (ATR) mode by using a single reflection horizontal ATR accessory with a diamond crystal fixed at an incidence angle of 45° (Platinum ATR, Bruker). The crystal was mounted on a Vertex 80V FT-IR spectrometer (Bruker). The investigated spectral range was 30–300 cm−1. A background scan was recorded prior to the measurement and was subtracted from the sample spectra. Each spectrum was averaged over 216 scans with a resolution of 2 cm−1 and corrected ATR. Measurements were carried out in an evacuated optics bench configuration in order to eliminate atmospheric moisture effects. The acquired far-IR spectra was decomposed into Gaussian components by means of standard algorithms with free parameters (95% confidence interval). The optimal number of components was determined through a careful statistical study following the procedure described in [6].

2.3. Data Analysis

The experimental data were quantitatively analyzed by the curve fitting of the far-IR spectrum as a linear combination of individual Gaussian component bands with an iterative adjustment of their width, position, and relative weights (value of peak area), as described in our previous investigations [6]. The process was iterated until an agreement between the fit and experimental data was obtained. The minimum number of component bands was used to obtain the best acceptable fit. To do so, at first, the initial peak positions were determined by a visual inspection of the spectrum in the dry samples. Six components for the DMPC samples and seven components for the DPPE samples were used to initialize the fit. After the convergence of the fit with the minimum number of band components, additional components were added in the frequency regions with the larger residuals with respect to the fitting curve. The evaluation of the number of components that could minimize the residual sum of squares (RSS) allowed us to determine the minimum number of Gaussian functions necessary for the best data analysis. In agreement with our previous work, we found that eight components were needed to accurately fit the DMPC samples independently of their hydration degree [6], while ten components were necessary for all of the DPPE samples. Notably, for all of the samples, a full study of the RSS that involved varying the number of component bands was performed. Additional considerations regarding the data analysis can be found in the results section.

3. Results

The analysis of the far-infrared (THz) absorption spectra of phospholipid membranes allows us to gain insight into both their intermolecular interactions and the torsional modes of the acyl chains and skeleton vibrations. By comparing the two investigated systems, DMPC and DPPE phospholipid membranes, we can expect that differences in their spectral signatures will mainly reflect different intermolecular interaction principles.

3.1. DMPC

In Figure 2, the far-IR spectra of DMPC/H2O samples at five distinct hydration degrees (dry, RH = 11%, 43%, 64%, 75%) are shown with the corresponding fitting curve and the Gaussian components for the dry and mostly hydrated samples.
We clearly observed that absorbance increases as the hydration level increases, as hypothesized (Figure 2a). We performed the curve fitting of the spectra as a linear combination of individual Gaussian component bands following the procedure described in detail in Section 2.3. We found that eight components are needed to reproduce each spectrum independently of the hydration level and the phase state of the lipid multilayers. The frequencies of the vibrations in the DMPC sample with the highest hydration (75%) are: 50, 70, 90, 119, 154, 186, 219, and 259 cm−1 (named in the following A, B, C, D, E, F, G, and H). The frequencies in the dry DMPC sample are reported in Table 1. They coincide with those of the wet sample, except for bands D and E, which are shifted to lower frequencies in the wet sample (110 and 145 cm−1). Thus, the frequencies of the vibrational modes were almost unaffected by the hydration, while significant changes amongst the DMPC samples at different hydration degrees were observed in the width and the area of all of the bands, as will be detailed in the following.
The experimental data and the data analysis reproduced our previous findings [6], with slight differences attributable to the different solvent (H2O was used in this work; D2O was used in the previous one). Additionally, while in the current work we carried out measurements under controlled hydration and in an equilibrated condition, in our previous work data were acquired in an out of equilibrium phase—i.e., as a function of the dehydration time by dehydrating under vacuum. Thus, it was not possible to obtain precise information on the hydration status of the samples. Differences between the two sets of measurements were also attributable to the different experimental modalities used. In Table 1, the number of water molecules per lipid, nW, are reported (see Section 2.1 for details concerning the determination of nW). Therefore, we fully confirm the results of [6] and the assignment previously proposed for the revealed bands. The A, B, C, and E bands were assigned to vibrations of different lipids interacting through their intermolecular van der Waals forces. The D band was assigned to an unspecified motion of the terminal methyl carbons of the phospholipid chains C−CH3 [14]. The F and H bands were attributed to the torsion modes of the hydrocarbon chains and the terminal methyl groups, respectively. The assignments of the observed excitations are reported in Table 2.
Returning to the observed frequency shift to lower values observed for the D and E bands in the wet DMPC sample, this signifies that the corresponding vibrational motions of the lipid molecular groups are influenced, even indirectly, by the presence of the solvent. We interpret the blue shift in the dry sample as a strengthening of the interactions within the compact structure in the absence of a solvent.
For all of the components, we observed a decrease in the full-width half-maximum (fwhm) as the hydration level decreased (data not shown). This can be interpreted as being due to both decreased motional rates and a smaller number of explored conformations going towards the more ordered solid gel phase at extreme or complete dehydration.
Concerning the contribution of each band to the spectrum (Figure 3), the area of all the bands increased with the hydration level, thus reflecting the high absorbance of the hydration water, which could be due to both water–water and water–lipid coupled vibrations.
By calculating the fractional variation of the area of each band in the wet state (75%) with respect to the dry state (Figure 3b), we found that the highest frequency bands (D, E, F, G, H) showed very high variation (3 ÷ 8%), and the H band (259 cm−1), attributed to the torsional modes of the CH3 groups, was the one that shows the most significant percentage variation.
Notably, the frequency range of the bands between 110 and 260 cm−1, i.e., from D to H, almost matches that of the so-called “connectivity band” of bulk liquid water [15]. The connectivity band, a pronounced and broad peak centered at 200 cm−1 as seen in the absorption spectrum of pure water, is described in terms of the collective intermolecular stretching of the hydrogen bond network [5,15]. This shows a composite structure based on four components (88, 130, 195, 251 cm−1) corresponding to different states of connectivity [15], with the component at the highest frequency reflecting water molecules having established a maximum number of hydrogen bonds [15]. Concerning the minimal variation in the lowest energy bands (A, B, C) as a function of increasing relative humidity and thus of the number of water molecules per lipid, it is worth mentioning that in pure water, the hydrogen bond bending vibrations and the umbrella-like motion of two hydrogen bonded tetrahedra along the connecting hydrogen bond axis that both contribute to the 50–70 cm−1 region are clearly visible in the Raman and optical Kerr effect spectra but are not very pronounced in the far-IR absorption spectra [5].
The main features of the vibrational excitations of the DMPC/H2O samples at THz frequencies can be summarized in the following statements: (i) eight vibrational modes have been detected independently from the hydration level; (ii) all models show a sensitivity to water, as seen in the area and in the fwhm; (iii) in particular, the highest frequency bands (from D to H, and to a greater extent the H band) that match the connectivity band of water are the ones that show the largest percentage variation upon hydration; (iv) two vibrations, namely D and E, undergo a shift to higher frequencies upon dehydration. This can be attributed to a strengthening in the corresponding intermolecular lipid–lipid interactions.

3.2. DPPE

In Figure 4, the far-IR spectra of DPPE/H2O samples at four distinct hydration degrees (dry, RH = 11%, 53%, 75%) with the corresponding fitting curve and the Gaussian components for the dry and mostly hydrated samples are reported.
The acquired spectra at the different hydrations (Figure 4a) showed complex profiles, with the absorbance increasing as the hydration increased. Analogously to the procedure followed for the DMPC samples and described above, we performed the curve fitting of the spectra as a linear combination of individual Gaussian component bands. While in the DMPC samples eight components were needed to properly analyze the data, in the case of the DPPE samples we found that ten components must be considered for an appropriate description of the absorbance profiles. However, similarly to the DMPC samples, the same number of band components (ten) were needed for the data analysis of the samples, independent of the relative humidity. Most interestingly, eight out of ten frequencies were almost coincident with those of the DMPC samples. We thus labelled the corresponding eight bands with the same letters used for the DMPC samples, and we used the Greek letters, α and β, for the bands that are characteristic only of the DPPE samples. Furthermore, no drift in frequency was observed, independent of the relative humidity of the samples. Thus, the frequencies of all the DPPE samples are: 46, 61, 89, 118, 144, 162, 189, 218, 236, and 263 cm−1 (named in the following as A, B, C, D, E, α, F, G, β, and H (see Table 2)). The α and β bands have a frequency of 162 and 236 cm−1, respectively. Although the frequency of the vibrational modes was not influenced by the hydration degrees, notable differences among the DPPE samples emerged when comparing the areas and widths of the excitations. In other words, the same vibrational modes characterized the DPPE samples at different hydration degrees, including the dry state, by their vibrational areas, and widths are affected by the level of hydration.
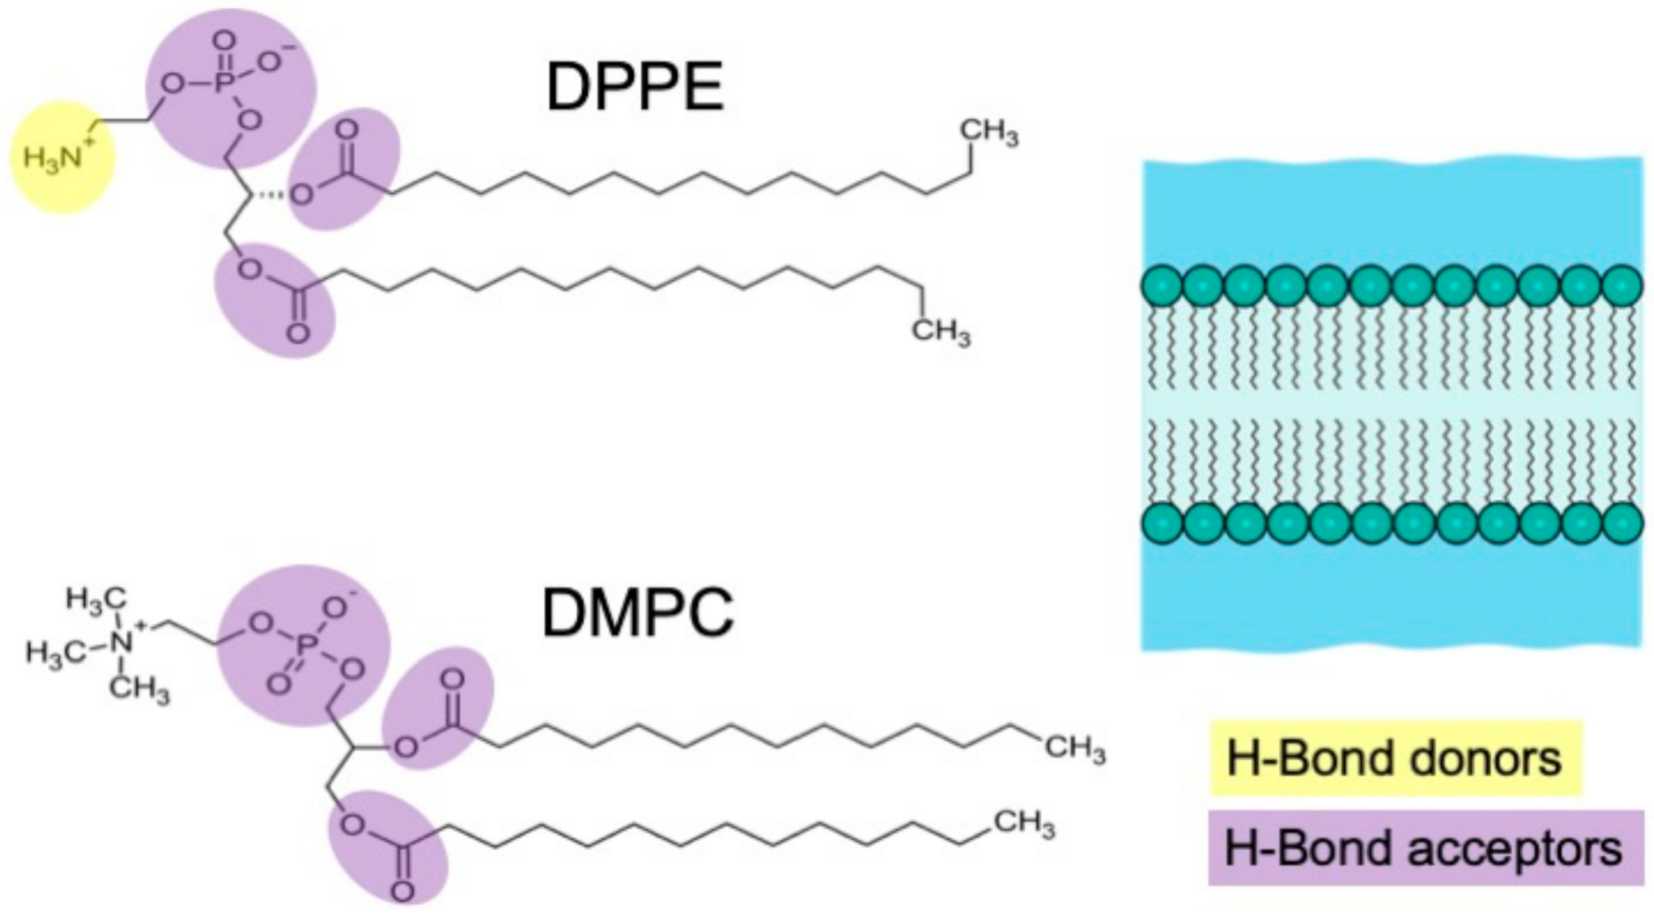
The almost total coincidence of the frequencies of the DMPC bands with those of the DPPE, together with the very similar molecular structures of the two phospholipids (apart from the polar head structure), leads us to assign the vibrations observed in the DPPE as previously conducted for the DMPC.
On the other hand, the α and β bands, observed exclusively in the spectra of the DPPE, require additional considerations for their assignment. The DPPE membrane exhibits an enhanced lipid–lipid hydrogen-bonding capability of the PE group with respect to the PC group, which can differently form hydrogen bonds exclusively with water. When PE phospholipids aggregate, the headgroups align so that the ammonium group interacts directly with the phosphate group of the adjacent lipid via an intermolecular hydrogen bond, though other combinations are possible—e.g., interactions involving the carbonyl oxygen of ester groups [8,9]. Additionally, though DPPE lipids mainly interact via direct intermolecular - NH 3 + PO 4 - or - NH 3 + CO 2   contacts, water molecules may act as bridges in mediating these interactions. It is well known that in DPPE, the ensemble of the hydrogen bond linkages between adjacent phospholipids produces a very compact and rigid structure at the bilayer surface that is largely unaffected by hydration, contrary to the considerably flexible network of DMPC [8]. We thus tentatively assigned the α and β bands to vibrations of the network of DPPE phospholipids linked by intermolecular hydrogen bonds. In particular, the frequency of the α band (162 cm−1) was found to be very close to the frequency (166 cm−1) measured in a protic ionic liquid for the hydrogen bond stretching (N−H···O) occurring between the N−H group from the N-methylpyrrolidinium cation and the oxygen on the acetate anion [16]. Based on that, we tentatively ascribed the α mode to the hydrogen bond stretching N−H···O where the N−H group from the ammonium group acted as a hydrogen bond donor, while the oxygen on the carbonyl esterified group acted as a hydrogen bond acceptor. Furthermore, we tentatively assigned the higher frequency β band to the N−H···O−P hydrogen bond stretching between the ammonium group and the oxygen of the phosphate moiety. This assignment was based on the following considerations: the N−H···O−P hydrogen bond is usually stronger than the N−H···O−C bond [17], so a higher frequency is expected for the corresponding stretching band; it is more favorable for DPPE to form intermolecular hydrogen bonds between amine groups and phosphate groups than between amine groups and carbonyl groups [8,9]; this finding corresponds with the higher intensity of the β band with respect to the α band (Figure 4).
It is worth noting that such a rigid network of lipid–lipid intermolecular contacts dramatically reduces the capability of hydration in DPPE. This is evident when analyzing the number of water molecules per lipid that only achieves the value nW = 1.03 at the highest relative humidity (RH = 75%). On the other hand, the DMPC lipids have a higher number of water molecules per lipid, nW = 4.0, that may act as bridges between lipids, contributing to establish an extended and more flexible network in the bilayer [10]. Thus, in DPPE, differently from DMPC, we observed a reduced capability of hydration together with a lower sensitivity to the water content of the spectral fingerprints at THz frequencies. This situation was reflected in the minor changes observed for the fwhm of all 10 identified far-infrared components (data not shown) when the hydration was changed. The impenetrability to water maintained the bilayer rigidity and kept the acyl chains well-ordered.
However, the influence of the hydration degree on the low-frequency vibrations can be investigated through the inspection of the area of the Gaussian bands as a function of the relative humidity, as shown in Figure 5. This trend can be more easily examined by looking at Figure 5b, which shows the relative variation in the areas in the wet state (RH = 75%) compared to the dry state. It is immediately noticeable how this trend differs considerably from that observed in the DMPC samples. Firstly, the range of the fractional variation for the different components was much smaller in the case of DPPE, and this confirmed the lower sensitivity of these samples to hydration compared to DMPC. Secondly, while for the DMPC samples all of the higher frequency bands (from D to H) were significantly affected by the water content, for DPPE, only two bands, i.e., F and H, that correspond to 189 and 263 cm−1, showed an important variation with respect to the dry sample, albeit very limited when compared to DMPC. The frequencies of these two bands were very close to the two bands at higher frequencies that characterized the connectivity band of pure water (195, 251 cm−1), as detailed above in Section 3.1.
Interestingly, the intensities of the α and β bands showed a negative increase with increasing hydration. This can be interpreted as the result of competition between the water molecules and the PO 4 - or carbonyl groups in forming hydrogen bonding with - NH 3 + moieties. However, this variation does not appear to be relevant, indicating that a strong intermolecular interaction between internal groups in DPPE was also maintained when lipids were hydrated. This may be a main limiting factor for the hydration of the phosphate groups with respect to what is observed in DMPC.

4. Conclusions

This work shows that the detailed analysis of the substructures of the far-infrared bands generated by self-assembled phospholipids as a function of a controlled humidity level allows us to appreciate the signatures of the specific intramolecular and intermolecular interactions occurring in lipid membranes and assess their sensitivity to water. In detail, our results revealed that the two phospholipid membranes investigated, DMPC and DPPE, differ with respect to their intermolecular interaction modalities and give rise to different spectral features in the THz range. It was found that both the phospholipid membranes and the hydrogen bond network of water showed vibrational excitations in the explored THz frequency range. It is now being discussed more often, both for membranes [2,6] and for other biosystems, such as proteins [5,18], that the energy match in the THz region between a biosystem and its hydration water is responsible for a very efficient dynamical coupling that is known to ultimately play a role in biological activity.

Author Contributions

Conceptualization: V.C.N., C.B., U.W., and G.D.; Investigation: C.B. and G.D.; Formal analysis: V.C.N., C.B., U.W., and G.D.; Writing—original draft preparation: V.C.N. and G.D.; Writing—review and editing: V.C.N. and G.D. All authors have read and agreed to the published version of the manuscript.

Funding

This research received no external funding.

Conflicts of Interest

The authors declare no conflict of interest.

References

  1. Conti Nibali, V.; D’Angelo, G.; Tarek, M. Molecular Dynamics Simulation of Short-Wavelength Collective Dynamics of Phospholipid Membranes. Phys. Rev. E 2014, 89, 050301. [Google Scholar] [CrossRef] [PubMed]
  2. D’Angelo, G.; Nibali, V.C.; Wanderlingh, U.; Branca, C.; De Francesco, A.; Sacchetti, F.; Petrillo, C.; Paciaroni, A. Multiple Interacting Collective Modes and Phonon Gap in Phospholipid Membranes. J. Phys. Chem. Lett. 2018, 9, 4367–4372. [Google Scholar] [CrossRef] [PubMed]
  3. Zhernenkov, M.; Bolmatov, D.; Soloviov, D.; Zhernenkov, K.; Toperverg, B.P.; Cunsolo, A.; Bosak, A.; Cai, Y.Q. Revealing the Mechanism of Passive Transport in Lipid Bilayers via Phonon-Mediated Nanometre-Scale Density Fluctuations. Nat. Commun. 2016, 7, 11575. [Google Scholar] [CrossRef] [PubMed]
  4. Ishiyama, T.; Terada, V.; Morita, A. Hydrogen-Bonding Structure at Zwitterionic Lipid/Water Interface. J. Phys. Chem. Lett. 2016, 7, 216–220. [Google Scholar] [CrossRef] [PubMed]
  5. Conti Nibali, V.; Havenith, M. New Insights into the Role of Water in Biological Function: Studying Solvated Biomolecules Using Terahertz Absorption Spectroscopy in Conjunction with Molecular Dynamics Simulations. J. Am. Chem. Soc. 2014, 136, 12800–12807. [Google Scholar] [CrossRef]
  6. D’Angelo, G.; Nibali, V.C.; Crupi, C.; Rifici, S.; Wanderlingh, U.; Paciaroni, A.; Sacchetti, F.; Branca, C. Probing intermolecular interactions in phospholipid bilayers by far-infrared spectroscopy. J. Phys. Chem. B 2017, 121, 1204–1210. [Google Scholar] [CrossRef]
  7. Hielscher, R.; Hellwig, P. The Temperature-Dependent Hydrogen-Bonding Signature of Lipids Monitored in the Far-Infrared Domain. ChemPhysChem 2010, 11, 435. [Google Scholar] [CrossRef]
  8. Hauser, H.; Pascher, I.; Pearson, R.H.; Sundell, S. Preferred Conformation and Molecular Packing of Phosphatidylethanolamine and Phosphatidylcholine. Biochim. Biophys. Acta Rev. Biomembr. 1981, 650, 21–51. [Google Scholar] [CrossRef]
  9. Rhys, N.H.; Duffy, I.B.; Sowden, C.L.; Lorenz, C.D.; McLain, S.E. On the hydration of DOPE solution. J. Chem. Phys. 2019, 150, 115104. [Google Scholar] [CrossRef] [PubMed] [Green Version]
  10. Murzyn, K.; Róg, T.; Jezierski, G.; Takaoka, Y.; Pasenkiewicz-Gierula, M. Effects of Phospholipid Unsaturation on the Membrane/Water Interface: A Molecular Simulation Study. Biophys. J. 2001, 81, 170–183. [Google Scholar] [CrossRef] [Green Version]
  11. Damodaran, K.V.; Merz, K.M. A comparison of DMPC- and DLPE-based lipid bilayers. Biophys. J. 1994, 66, 1076–1087. [Google Scholar] [CrossRef] [Green Version]
  12. Wanderlingh, U.; D’Angelo, G.; Conti Nibali, V.; Gonzalez, M.; Crupi, C.; Mondelli, C. Influence of Gramicidin on the Dynamics of DMPC Studied by Incoherent Elastic Neutron Scattering. J. Phys. Condens. Matter 2008, 20, 104214. [Google Scholar] [CrossRef]
  13. D’Angelo, G.; Conti Nibali, V.; Wanderlingh, U.; Branca, C. Insights into Water/Phospholipids Membrane Interactions. (in preparation).
  14. Tarek, M.; Tobias, D.J.; Chen, S.H.; Klein, M.L. Short Wavelength Collective Dynamics in Phospholipid Bilayers: A Molecular Dynamics Study. Phys. Rev. Lett. 2001, 87, 238101. [Google Scholar] [CrossRef] [PubMed]
  15. Brubach, J.B.; Mermet, A.; Filabozzi, A.; Gerschel, A.; Roy, P. Signatures of the Hydrogen Bonding in the Infrared Bands of Water. J. Chem. Phys. 2005, 122, 184509. [Google Scholar] [CrossRef] [PubMed]
  16. Patil, A.B.; Bhanage, B.M. Assessing ionicity of protic ionic liquids by far IR spectroscopy. J. Mol. Liq. 2018, 252, 180–183. [Google Scholar] [CrossRef]
  17. Pourayoubi, M.; Izadyar, M.; Elahi, B.; Parvez, M. Combination of X-ray crystallography and theoretical study to evaluate the effect of NH⋯ O=P versus NH⋯O=C hydrogen bonds on the NH stretching frequencies. J. Mol. Struct. 2013, 1034, 354–362. [Google Scholar] [CrossRef]
  18. Paciaroni, A.; Orecchini, A.; Haertlein, M.; Moulin, M.; Nibali, V.C.; De Francesco, A.; Petrillo, C.; Sacchetti, F. Vibrational Collective Dynamics of Dry Proteins in the Terahertz Region. J. Phys. Chem. B 2012, 116, 3861–3865. [Google Scholar] [CrossRef] [PubMed]
Figure 1. Chemical structures of DPPE and DMPC lipids are reported together with a schematic illustration of a fully hydrated bilayer structure. Functional groups that are H-bond donors (acceptors) are colored in yellow (violet).
Applsci 11 10038 g001
Figure 2. Far-infrared spectra of the DMPC/H2O samples. (a) Spectra of pure water (dashed black line) and of the samples at five distinct hydration degrees: dry (black full line), RH = 11% (red), RH = 43% (green), RH = 64% (magenta), and RH = 75% (blue); (b) The spectra of the dry sample and of a wet sample (RH = 75%) are shown separately with the corresponding fitting curve (solid black line) obtained as the sum of the individual Gaussian peaks (dashed black lines).
Applsci 11 10038 g002
Figure 3. DMPC/H2O samples. (a) Dependence of the areas of the eight Gaussian band components on the relative humidity. Each panel corresponds to a different band, as named in Table 2. (b) Fractional variation of the area of each band evaluated as (I75% − Idry)/Idry.
Applsci 11 10038 g003
Figure 4. Far-infrared spectra of the DPPE/H2O samples. (a) Spectra of pure water (dashed line) and of the samples at four distinct hydration degrees: dry (black full line), RH = 11% (red), RH = 53% (green), and RH = 75% (blue); (b) The spectra of the dry sample and of the wet samples are shown separately with the corresponding fitting curve (solid black line) obtained as the sum of the individual Gaussian peaks (dashed black lines).
Applsci 11 10038 g004
Figure 5. DMPC/H2O samples. (a) Dependence of the areas of the eight Gaussian band components on the relative humidity. Each panel corresponds to a different band, as named in Table 2. (b) Percentage variation of the area of each band in the dry state with respect to the wet state (RH = 75%).
Applsci 11 10038 g005
Table 1. Saturated salt solutions and corresponding relative humidity at 25 °C exploited for the sample preparation, along with the respective number of water molecules per lipid.
SaltRH (%)nw DMPCnw DPPE
LiCl111.250.28
K2CO3432.40-
Mg(NO3)253-0.78
NH4NO3643.33-
NaCl754.001.03
Table 2. Frequencies and tentative assignments of the bands identified in this work for both DPPE and DMPC samples.
Bands
DMPC
Dry DMPC
Frequency (cm−1)
Bands
DPPE
DPPE
Frequency (cm−1)
Assignment
A50A46van der Waals
B70B61van der Waals
C90C89van der Waals
D110D118C–CH3 motion
E145E144van der Waals
α162
F186F189τ(C–CH2)
G219G218
β236
H259H263τ(C–CH3)
Publisher’s Note: MDPI stays neutral with regard to jurisdictional claims in published maps and institutional affiliations.

