Article

Assessment of the Robustness of a Color Monitoring Chart Calibration Method for Crowdsourcing-Based Preventive Conservation

by
Miguel Antonio Barbero-Álvarez
1,*,
José Manuel Menéndez
1,
Juan Antonio Rodrigo
1,
Blanca Ramírez-Barat
2 and
Emilio Cano
2
1
GATV-SSR, Escuela Técnica Superior de Ingenieros de Telecomunicación, Universidad Politécnica de Madrid, 28040 Madrid, Spain
2
CENIM-CSIC, Centro Nacional de Investigaciones Metalúrgicas, Consejo Superior de Investigaciones Científicas, 28040 Madrid, Spain
*
Author to whom correspondence should be addressed.
Appl. Sci. 2021, 11(21), 10067; https://doi.org/10.3390/app112110067
Submission received: 7 October 2021 / Revised: 22 October 2021 / Accepted: 25 October 2021 / Published: 27 October 2021

Abstract

:
Monitoring environmental factors such as pollutants, relative humidity, light, etc. is needed to ensure a proper preventive conservation of cultural heritage. Since existing systems are expensive and difficult to maintain, we propose as a sustainable alternative the use crowdsourced photographs taken by visitors using their cell phones. These images of a tailor made panel, including sensitive materials and a calibration color chart, are calibrated and colorimetric information extracted from them. The aim of this paper is assessing the robustness of the color chart and the calibration method used, and evaluating how the ageing of the materials of the chart can affect the accuracy of the calibration process. A choice is made between four candidate materials and a set of industrial inks. Several tests have been performed and mathematical metrics extracted, so the most suitable material is adequately selected. It has been checked how the image calibration process, employed for homogenizing information from the crowdsourced pictures, performs with real-life materials and colors to assess the possible degradation that may happen. This work is a part of a bigger project with the aim of building a crowdsourcing-based monitoring system for preventive conservation of cultural heritage.

1. Introduction

All over the world, objects of historic and cultural values are exhibited and preserved in museum collections. To protect objects in collections from degradation they are held and exhibited in controlled environments, where ideally all ambient conditions are adjusted to minimize future damage to the heritage materials. This strategy, focused in preventing future deterioration acting on the potential causes of deterioration, is known as preventive conservation.
However, the perfect environment is impossible to achieve, and sometimes humidity, pollutants or lighting problems can reach a point where the material an exhibited cultural heritage item is made of starts suffering a quick degradation [1,2,3]. Sometimes harmful emissions come from inside. Building materials from furniture, showcases or panels, such as paints, woods or adhesives or cleaners, and even some objects from collections can emit gaseous pollutants. This problem is even more serious if the exhibited artifacts are stored in non-ventilated display [4,5].
Thus, even in the best conservation-suited environment, additional needs for surveillance of cultural heritage are likely to be required. In order to lighten human efforts on the task of surveillance, automatic monitoring resources are encouraged and proposed. These may take any mean for quantifying the possible decay, like sensing humidity or light or checking the change in color of some material present when it is undergoing a degradation process [6].
One of the most evident signs of deterioration of heritage materials are color alterations. Color is probably the most significant property of cultural heritage objects. Not only in painting, but in sculpture and decorative arts color is carefully chosen, selecting materials, finishes and surface treatments. Aging of materials frequently produces color changes that can be related to degradation in different aspects and degrees of intensity. In some cases as in irreversible alterations of pigments and dyes it represents a major concern for conservators. Therefore, the availability of tools to monitor color change is of interest in cultural heritage conservation. At the same time, color change of certain reference materials can been used for indoor environment evaluation as a preventive conservation tool.
Colorimetric measurements are in fact frequently used for detecting degradation in different materials, using colorimeters or spectrophotometers [7,8]. The use of color change as an indicative of environmental changes has also been suggested [9,10]. Color monitoring is clearly relevant in the conservation field; it does not require complex equipment or specialized personnel, as a colorimeter is easy to operate. However, it is a time-consuming method, and has some application limitations on very irregular or delicate surfaces, as it requires contact.
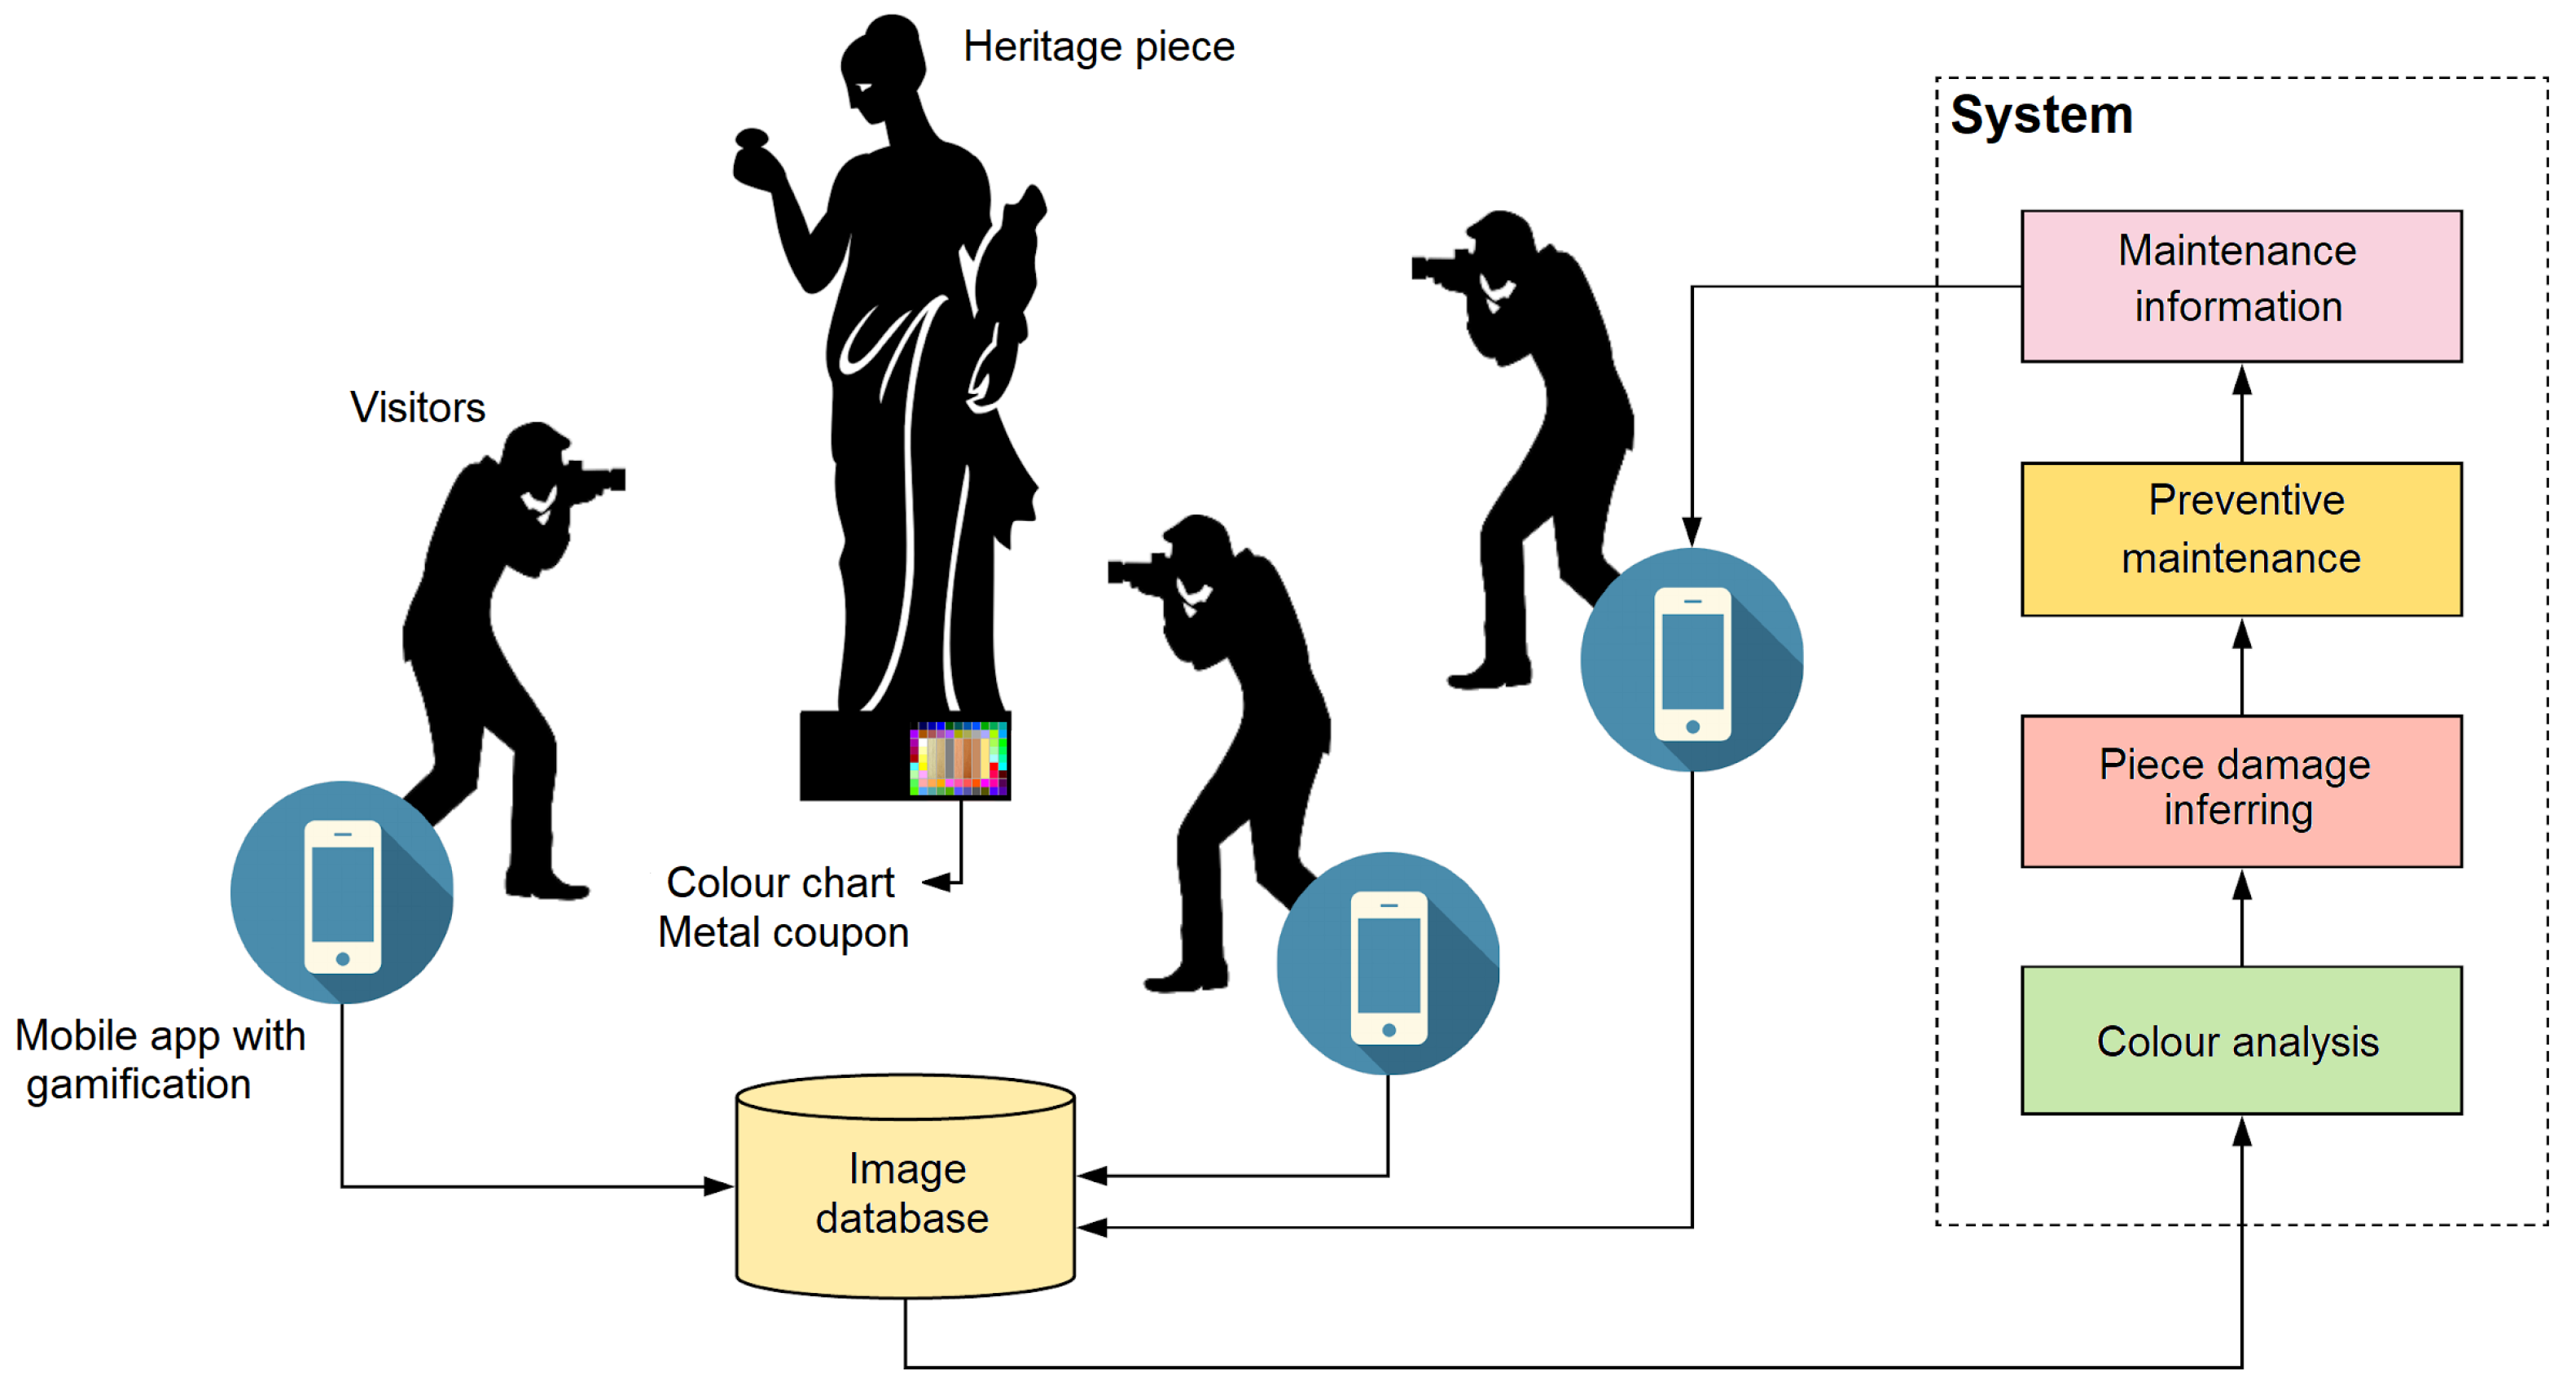
Based on these premises, our research group has proposed a system for monitoring environmental conditions in museums based on the measurement of color changes by image processing. The objective of this system, besides being a low-cost preventive conservation tool, is to increase social awareness in relation to heritage conservation. For this purpose, the system uses crowdsourced pictures taken by visitors with their cell phones [11] (Figure 1). The usage of crowdsourcing techniques is acknowledged as a useful resource, which has been used for long in monitoring of biodiversity, astronomy, and other fields [12]. More recently has been proposed as a monitorization tool for cultural heritage preservation, using smartphone technologies [13,14,15].
Photographic cameras represent the acquired information analogously to the human visual system [16,17]. But, considering fabrication and physical component differences between models, images representing the same scene by disjoint cameras are likely to appear visually different to the same observer [18]. This is the main concern regarding the crowdsourced information, therefore a homogenisation via color calibration is needed to perform an effective monitoring of the pieces. This requires the presence of a color chart when acquiring the content to be calibrated.
The mentioned approaches use mobile images individually adjusted using X-Rite charts as color reference. However, the X-Rite color chart has been designed provide bright colors for outdoor photography, and some of the tiles have too saturated colors [13], and its materials have not been tested to be compatible with heritage objects. Our monitoring system pretends a further step on these first approaches, designing and testing an optimized color chart, an accurate calibration method and developing an efficient color change detection system.
The previous stages of this project, the conception of the color chart, the verification of the suitability of the materials for the monitoring system, and an adaptive calibration algorithm for image processing have already been presented [11,19]. The color chart is mounted on an inert substrate together with several metal coupons used as sensitive materials.
This reference color chart has been specifically designed to cover all the range of the sRGB color space, which is shared by most phone cameras in usage. It is placed in the display case or exhibition space to be monitored in this project. Alongside the chart, metal coupons are placed. Possible inadequate environmental conditions that may affect the heritage artifacts will induce corrosion in the coupons. This corrosion process might take the form of a tarnishing, more or less uniform colored corrosion layers, or colored spots on the surface of the metal. These colorimetric cues are the relevant information to be extracted from the crowdsourced pictures, as warnings of unsuitable environmental conditions for the conservation of heritage assets.
The calibration process is one of the most critical parts of the monitoring system. Assuming most crowdsourced pictures are taken with different cameras, a quality calibration for every image is needed for homogenizing color information. According to this, the color chart needs to be consistent and stable enough to be used as a reliable reference for the color calibration algorithm.
So, the materials employed to build the display and chart and the coupons need to be carefully selected so they do not undergo possible strong chromatic deviations from the initial state; and they should not produce alterations in the metal coupons and, more important, in the heritage artifacts [11]. It is utmost important that the reference color chart remains unaffected so the quality of the picture calibration does not lower when deployed for a prolonged time. In addition, if by any reason the color references change, it is imperative to check how this change can affect the outcomes of the calibration process.
Thus, the aim of this paper is to evaluate robustness of the crowdsourced color evaluation system against environmental degradation of the reference display. The criterion adopted is mathematical robustness to discoloration. Since the main agent causing color modification in organic materials (including boards, papers and inks) is light, variations in the color chart on different materials due to exposure to UV radiation have been evaluated. For this purpose, periodic measurements of the exposed references have been carried out.
These measures are processed in different mathematical ways to evaluate the robustness of environmentally-induced color degradation in them. From this information, it is evaluated how possible light induced color variations may affect the accuracy of the calibration method.
Finally, conclusions are drawn and the selection of the most suitable material to build the crowdsourcing-based monitoring display are proposed.

2. Materials and Methods

2.1. Color Chart Design

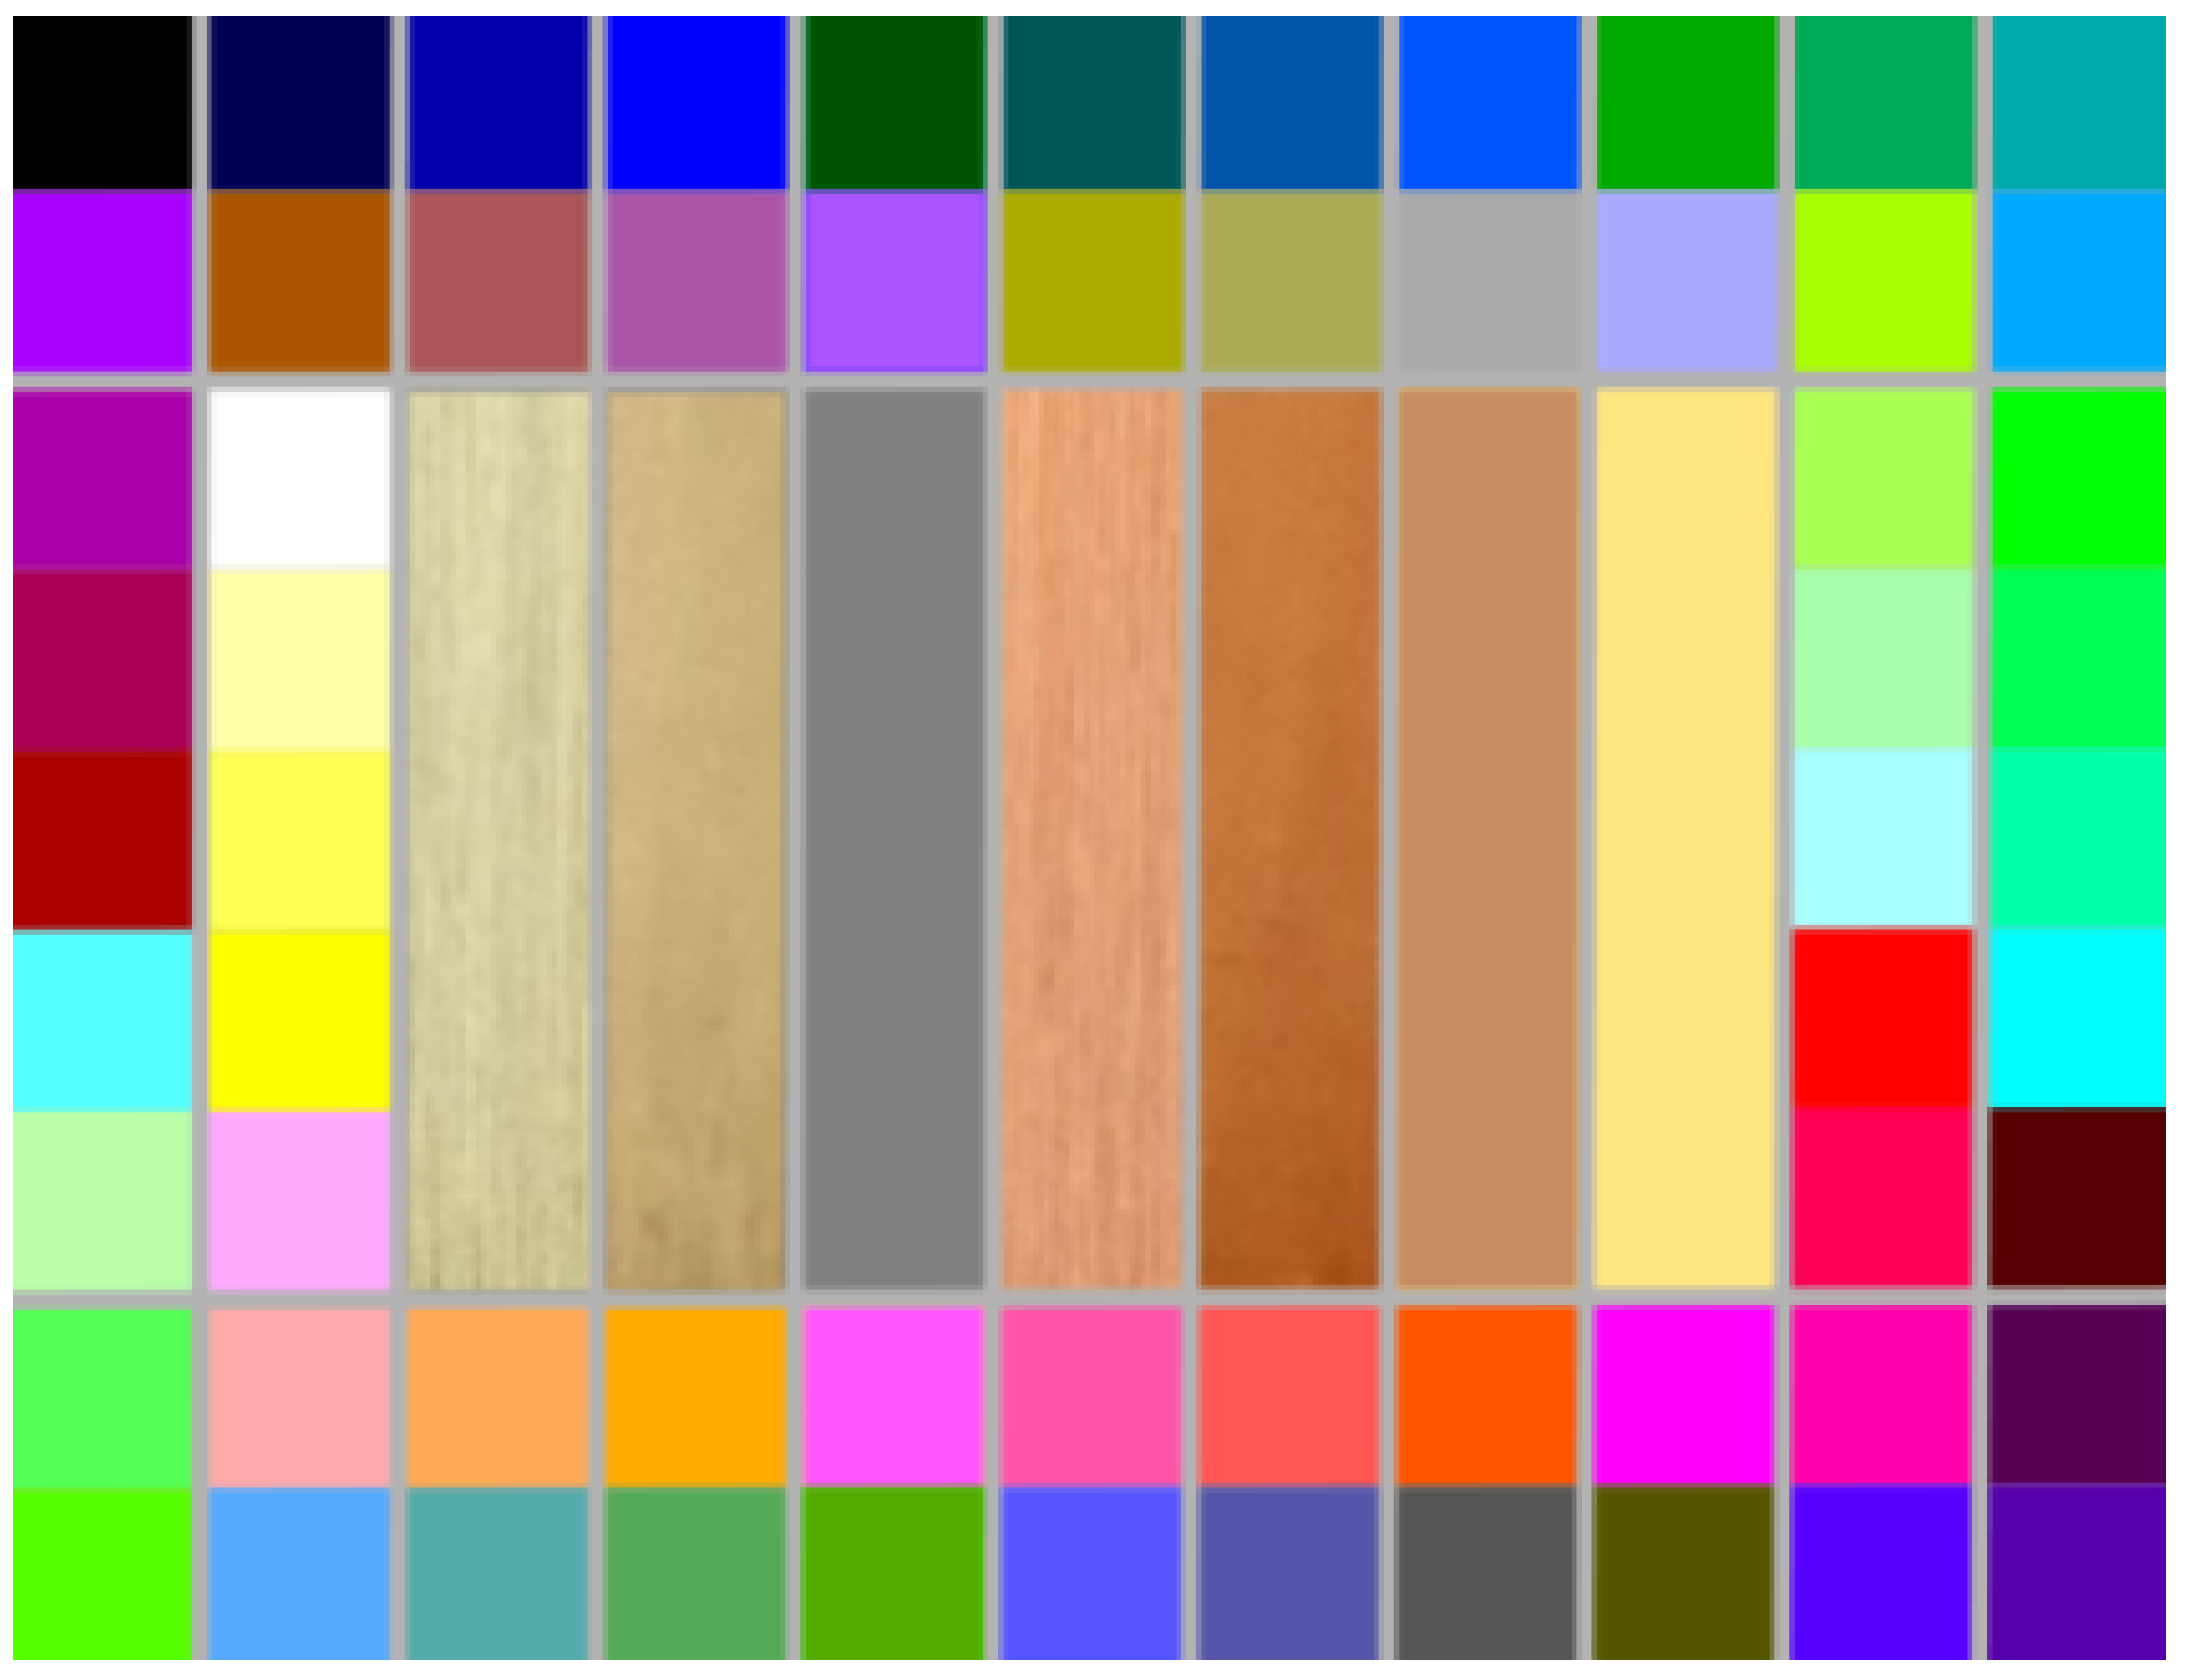
The color chart has been conceived so the calibration to perform does not incur in unacceptable errors. It consists in 64 color patches of dimensions 1 cm × 1 cm arranged on 11 columns and 9 rows. There is a free space of 7 columns × 5 rows in the centre, where the metal coupons (or other references) can be placed (Figure 2).
The calibration process is performed by calculating a transfer function that projects the R, G and B information of each channel of the taken pictures into a reference space, where their corresponding coordinates take values that must be present in the calibrated image. Thus, all pictures after this operation should depict consistent color information [19], regardless of their camera of origin.
With this conception in mind, the depicted colors present regularly sparse grey tones range in sRGB acting as valid as luminance values too, including maximum black and white, and the primaries red, green, blue, cyan, magenta and yellow. The remaining colors are combinations of equal shares of each RGB axis, and are furthermore designed to exist in the perceptual spaces as sRGB and inside CIELAB’s boundary [19]. This avoids transformation errors when colors exist regardless of the color space to consider in further application. It is also assured that the possible range of values is covered equally, and inferring the projection of colors not present within the set of anchor colors not much accuracy is lost.
It is imperative that the manufactured color charts to be used in museum showcases are stable for a prolonged usage whilst maintaining the color characteristics mentioned above. This way they are expected to withstand the adverse ambient conditions that this project, in its global scope, is intended to monitor.

2.2. Color Chart Materials

Color charts have been printed by a graphic arts printer using selected materials for the support and UV resistant inks. Four candidate materials for the support have been evaluated: acid-free laminated paper, acid-free non-laminated paper, Forex Smart and Glasspack. The choice of these papers, within the options available on the market, has been based on the British Museum’s Oddy Test database, to ensure their safety [20]. In addition, their light weight, firmness, low cost and ease of cutting and handling making it easy to build an exhibition structure with any of them, are suitable for the intended purpose.
The ink set tested for the color chart was LED-UV Xtreme Pro, by Deutsche Druckfarben. These inks are used for printing advertising posters intended for outdoor display, and they are known to resist solar radiation. Their lightfastness is rated 5 (yellow and magenta) and 8 (cyan and black) to blue wool standard according to the manufacturer [11].
The thickness of the ink has been measured using a Helios Digitrix II micrometer, with 1 µm resolution, by difference of the thickness of the blank paper and the printed patches. The thickness strongly depends on the color, ranging from 2–3 µm in the ligthest patches, up to 20–25 µm in the more saturated colors and 40 µm in the black patch.

2.3. Color Chart Evaluation

Therefore, a display structure is made from each one of the four support materials and the set of inks. Each test display has been exposed to a constant irradiation of UV light at 50 C, using fluorescent UVA-340 lamps, following the ISO4892-3 standard in a Q-Lab QUV chamber [21].
Since the color charts are intended to be exposed in museum cases for a long time, the UV exposure time has been calculated to be equivalent to several museum years. Q-Lab QUV chamber lamps reproduce daylight conditions, which are equivalent to a 30,000 lux illuminance. As museum illuminance for non-sensitive materials is set at 300 lux, the illuminance in the chamber is (maximum) 100 times that in the museum. Thus, we can estimate that in the worst scenario (a non UV-filtered illumination), 144 h chamber exposure (six 24 h periods) can be approximated to 4 years of museum (144 h × 100 = 14,400 h of exposure /10 h per day = 1440 days = 3.9 years.
Measures of the color coordinates have been taken for hours 0 (without degradation before exposure), 2,4, 6, 24, 48, 72, 96, 120 and 144 using a Konica Minolta spectrophotometer CM-700-d, with 6 mm diameter mask, D65 as illuminant and at 10 degrees to the observer, in color space CIELAB. Every measure taken consists in an automatic average of three measurements on areas of 1 cm 2 . Its accuracy specifications reveal a repeatability tolerance of a standard deviation between 0 and 0.1 % of the spectral reflectance, and within 0.04 Δ E a b of the detected colorimetric value. As a representative set of colors of the printed charts to be evaluated, the patches corresponding to white, black, red, green, blue, cyan, magenta and yellow are taken. It is to be noted that the color patch corresponding to the white tone does not have any ink printed upon it, so it consists in the naked material. Therefore, the effect of the test on the substrate material can be tested when analysing the white patch. Consequently, the other color tones are considered indicators of the effect of the degrading ambiance on a combination of substrate and inks. Thus, the effect of the degrading ambiance on the naked substrate and on different mixtures of different amounts of inks can be observed, and its possible effects on the calibration process inferred.
The results are a list of progressive CIELAB coordinates along time for given color patches in every material combination. The CIE1976 L*a*b* color space, or CIELAB, is usually employed in heritage science matters as accurate color specification [22], while being uniform, device-independent and suitable for calculations such as calibrations [19].
Several means to describe the degradation have been considered. A graphical evolution along time of the CIELAB coordinates for the selected color patches has been observed (Figure 3). In addition, a good descriptor of degradation is a difference metric. The Δ E 00 CIEDE2000 difference formula has been selected for this purpose, since it is designed to reflect CIELAB color differences according to human perception [23]. Equation (1) reflects its nature [24]. It defines a metric similar to a mathematical distance in the CIELAB color space, employing differences related to the physical lightness, chroma and hue ( L , C and H). The S functions and parametric factors k define weights to the former quantities, and in order to improve its effectiveness for the blue range it employs an interactive term between C and H ( R T ).
Δ E 00 = Δ L k L S L 2 + Δ C k C S C 2 + Δ H k H S H 2 + R T Δ C k C S C Δ H k H S H
The difference formula has been employed to show a progressive degradation. Each CIELAB measure from each one of the time checkpoints is compared to the original zero-hour measurement, its difference calculated and its progress shown.
The analysis for the white, ink-free patch is particularly interesting for what it may reveal about the nature of degradation on the bare support material, without the ink acting as a cover. Special consideration has been given to measurements of CIELAB values and differences concerning these patches. Their effect is measured by performing calibration processes using these degraded white values as reference, and the calibration error as CIEDE2000 difference is then evaluated for all materials.
The next section will address the results, explaining the material to be chosen and which ones could be discarded or used as a temporary substitute. The choice ensures that the display will guarantee a stable calibration with consistent results, so the monitoring via crowdsourced images can be enabled for an extended period in a museum.
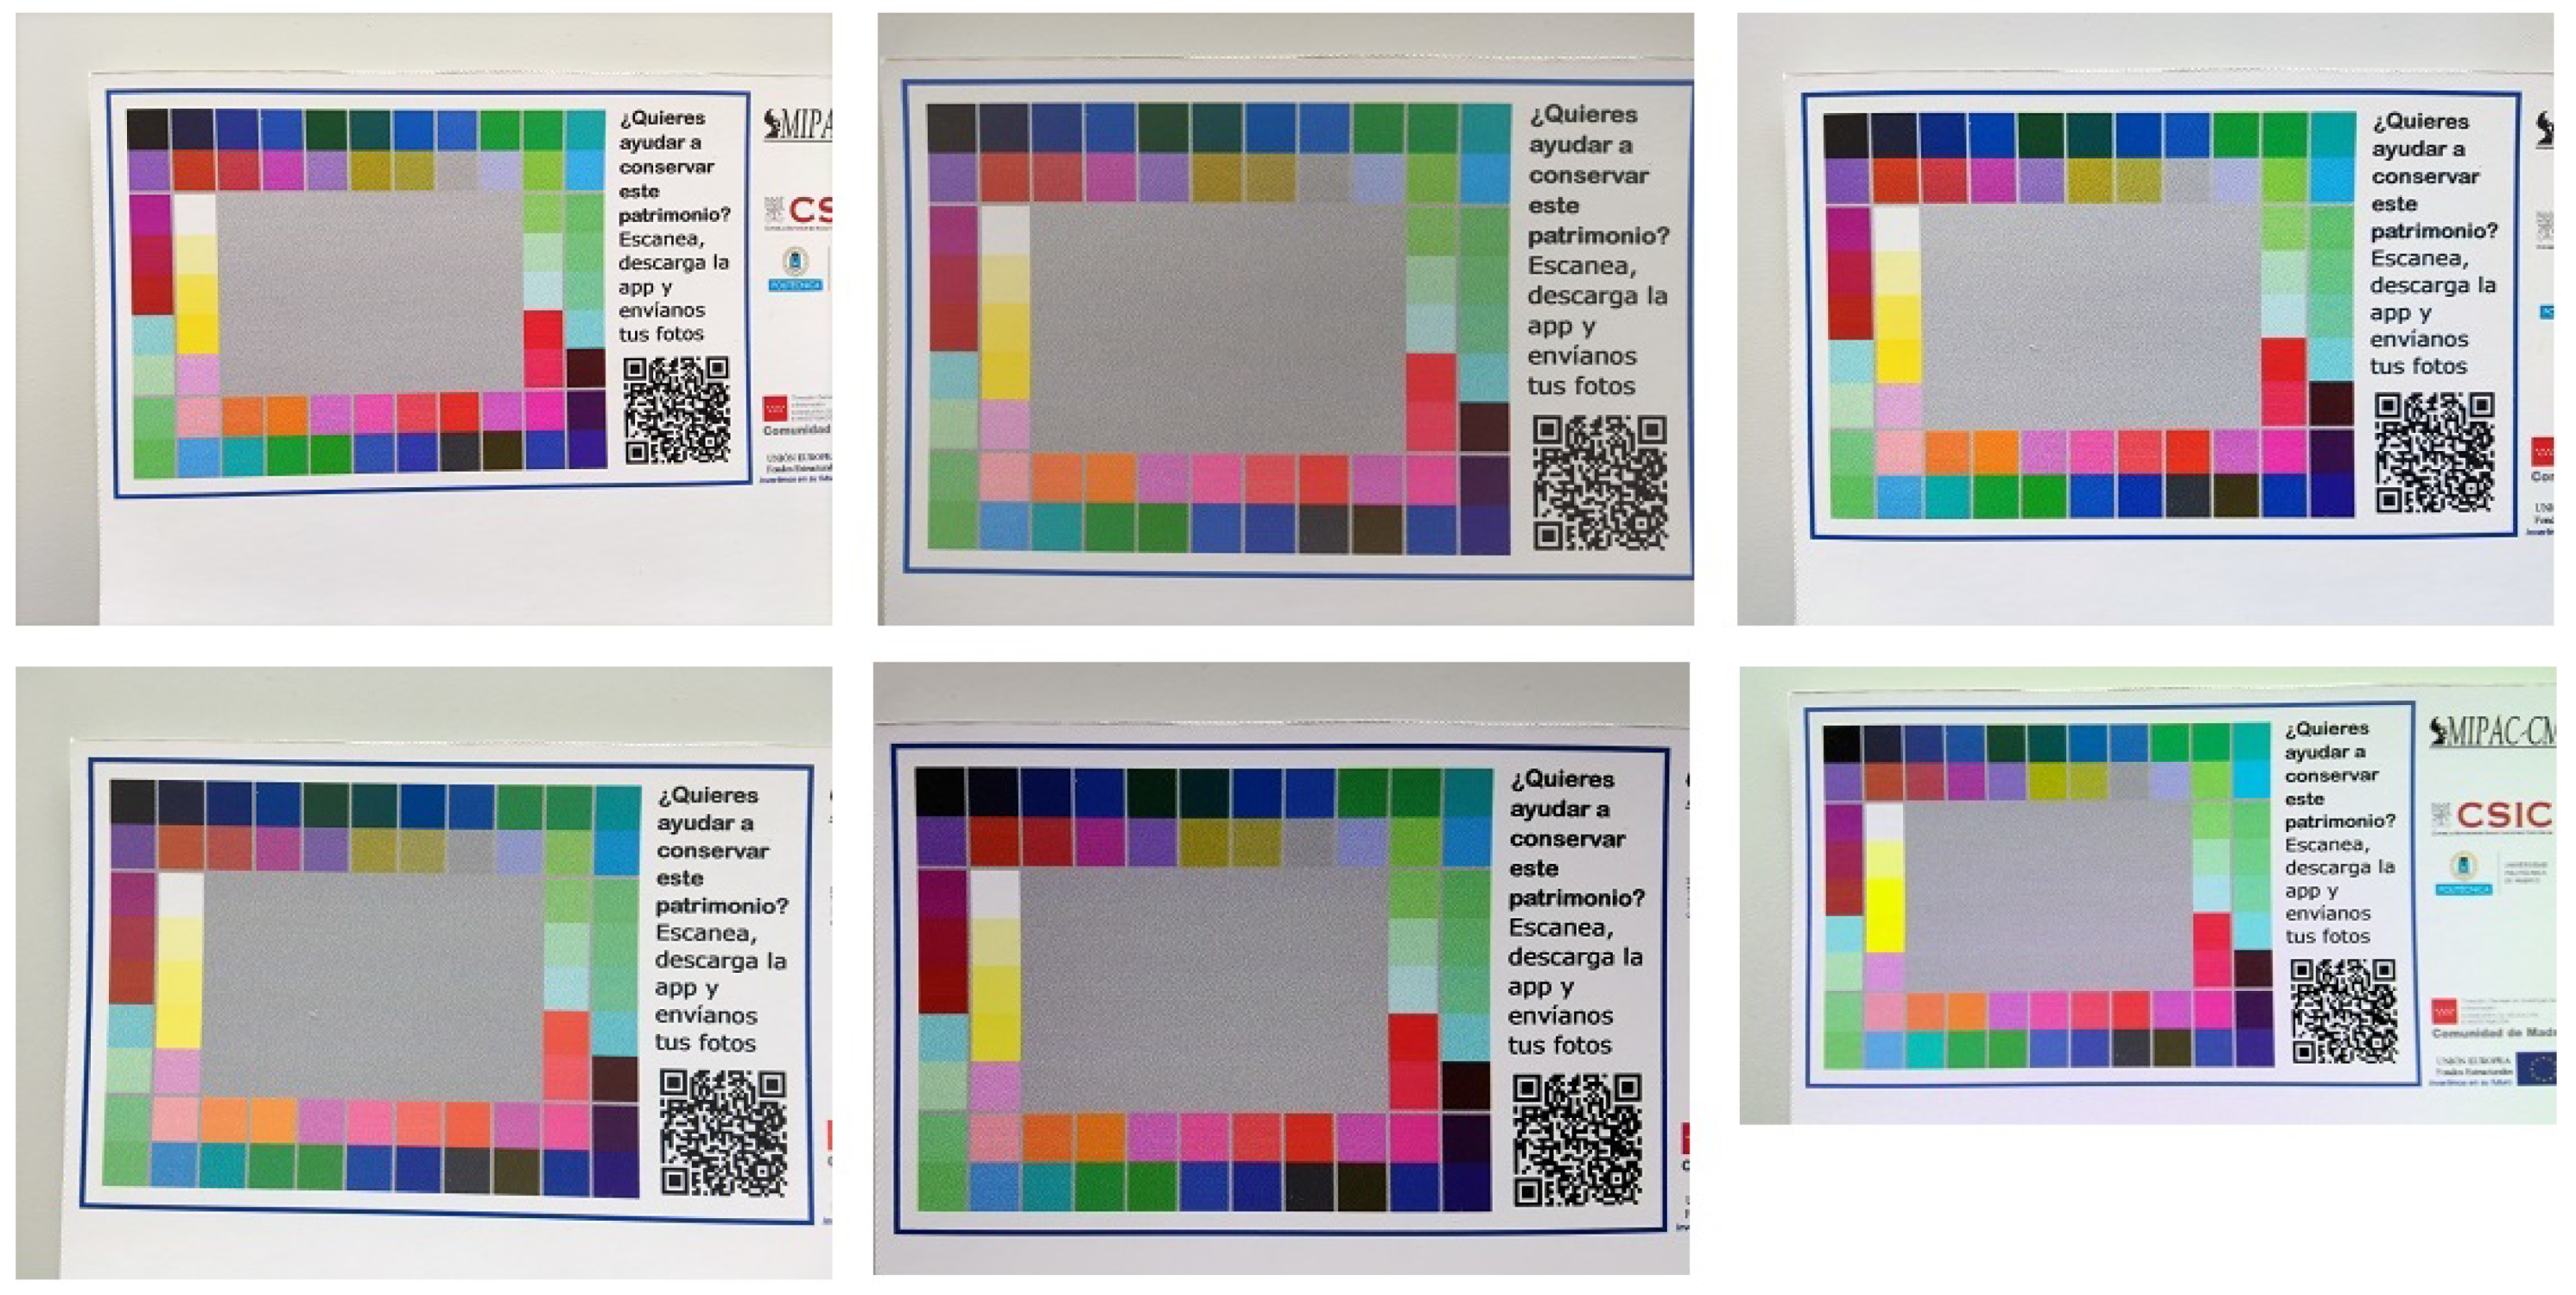
Aside, in order to demonstrate the capabilities of the conceived charts, an experiment that involves the calibration scheme outlined in [11,13] over pictures taken with commercial brands of phones has been performed. With the material chosen with the best results (explained in the following sections), a chart has been printed and photographed. Pictures have been taken with the following models: Xiaomi Mi10 lite 5G, Poco X3 NFC, Poco F3, Huawei P30, iPhone SE and Microsoft Surface Pro (Figure 4). This way, the crowdsourcing disparity is achieved. After having collected the pictures, the calibration process has been ran over them and the robustness evaluated. The calibrated color patches of each of the pictures have been compared with the reference color values in sRGB using the CIEDE2000 difference formula.
In addition to this, the mean digital CIELAB coordinates for every patch in each calibrated picture have been compared to the original spectrophotometer measurements so the accuracy of the calibrated values with respect to the original data can be assessed.

3. Results and Discussion

The evolution of CIELAB coordinates of each of the considered color patches are listed in the Table A1, Table A2, Table A3 and Table A4. It should be noted that the white coordinate, corresponding to the ink-free spot of the color chart, undergoes a stronger variation in comparison to the other colors under study in all cases. This degradation, seen as a progressive shift of values, is especially remarkable in the b* coordinate. This implies a process of yellowing, extremely pronounced for the Glasspack (Table A4). The inks act as a “shield” for the substrate material, given their greater stability and less intense degradation. The most stable of the materials considering its low variation is the acid-free laminated paper (Table A1).
Based on those tables, the CIEDE2000 differences for each one of the four materials under study are shown graphically (Figure 3). In general, the color patches with inks printed upon them show a relatively slow degrading, with a barely steep slate, staying in most cases under the Δ E 00 CIEDE2000 < 1.5 threshold, implying a minimal perceivable color difference, only noticeable by trained eyes [25,26,27]. This indicates good stability and robustness in the considered exposition period.
Considering that materials such as papers usually are not as resistant towards chromatic deviation as other, more expensive materials like ceramics, it is promising to observe how small the induced error can be for the considered application.
It is interesting to note that on half of the tested materials, the color patches with only one ink printed (black, yellow, cyan or magenta) show a subtly stronger degradation than the other colors, which need more than one ink to be printed, following the additive YCMK system. This reinforces the idea of the nature of the inks as protective covers of the substrate material.
Therefore, the white ink-free patch shows a stronger degradation compared to the rest in the described graphs. Furthermore, its degradation can exceed a CIEDE2000 difference of value 3 for the acid-free paper and the Glasspack. It can be stated that the degradation of the ink-free spots is especially necessary to consider for the whole experiment (Figure 5), since an excessive difference with the zero-hour original value may lead to an erroneous color calibration process. This fact could compromise the whole monitoring mechanism.
Therefore, a deeper observation of the white spot for all the considered materials has been done. Several “dummy” color charts have been generated. The colored spots have been conserved, but the value corresponding to white patch has been substituted in each one of the materials with the RGB color coordinates corresponding to the CIELAB of every taken measure for the given time checkpoints. This is done for all four substrates. Then, the calibration process as described in [19] has been run on each of them with respect to the corresponding zero-hour color chart as the reference. Thus, the drifting effect of the decoloring towards the yellow of the white spot on the whole calibration process can be measured.
The subjects of calibration have been seven color stripes, in order to assess its effect on a variety of surfaces. Four of them represent silver and copper extracted textures from other photographs, since the indicator material coupons for the monitoring system are will be made of both metals. The three others represent a neutral grey hue (RGB = 128, 128, 128), a uniform copper color (RGB = 199, 140, 98) and a bright yellow (RGB = 255, 230, 128). They are used to see the effects of calibration with an erroneous white reference on different zones of the color space: the center, the region of copper tones, considering silver will mainly engulf luminance-predominant hues, and the yellow stripe represents the yellowing shown by aged whites (Figure 6). After each process, the stripes are extracted and their mean CIELAB coordinates and CIEDE2000 difference calculated. Results are presented in Table 1, Table 2, Table 3 and Table 4.
For the time interval considered the calibrations of the modified color charts present a moderate difference, all values remaining in a close range even between the least and most deteriorated state, in every case smaller than the acceptability threshold of CIEDE2000. The most stable material is the acid-free paper (Table 1), that undergoes practically no deviation, whilst the others still fluctuate, even if slightly. Nevertheless, the acid-free non-laminated paper presents the best balance on lower mean error (lower than the acid-free paper) with acceptable variation (Table 2).
However, it is interesting to note that the differences shown in the Table 1, Table 2, Table 3 and Table 4 are not continuous, but they fluctuate at each time step. A reason for this can be understood when the “white” values for every paper are represented in their 3D color space (Figure A1, Figure A2, Figure A3, Figure A4 and Figure A5) and their evolution along time observed. The white tones, represented by dots in space, do not follow a linear evolution over time, but evidently fluctuate in space when under the chromatic deviation process, following an irregular evolution from the initial white tone in different directions during each time step. This is represented using arrows, as seen in the figures. For every paper, the arrows in the a*L*, b*L* and a*b* planes (Figure A1, Figure A2, Figure A3 and Figure A4), and in the whole L*a*b* space (Figure A5) are represented. Depending on the position in space of any affected color during the calibration process, its distance from its projected reference value will be of different magnitude and orientation depending on its initial position, closer or farther away from the state of the white value in the chart in the moment the calibration is performed. This is extensible to any other reference color in the chart. This irregular variability of the reference color depending on degradation and time explains the fluctuating results when calibrating.
Aside of that, it is also remarkable to see how, even when performing a calibration with deteriorated color charts, the results presented here are of a higher quality than other similarly oriented cultural heritage conservation works with ideal charts [14]. Whilst state-of art accepted CIEDE2000 differences exceed the minimal perceivable difference threshold with an ideal chart, our physically printed charts on every material among the tested ones under a chromatic deviation equivalent to 4 years still depict values inferior to the threshold in all the cases, and most of them with a CIEDE2000 value between 0 and 1 after application of the calibration process.
Overall, concluding from the color difference values, it can be observed that the four materials under consideration (laminated acid-free paper, acid-free paper, Forex Smart and Glasspack) are robust enough to resist the effects of chromatic degradation over a long period without incurring in errors noticeable to the human eye in the calibration process, in spite of the material degradation that still occurs, even if slight, when observing the metrics. If the selection of the material would only depend on the mathematical chromatic stability criterion, the most suitable and balanced one would be the acid-free laminated paper. Even if the differences are subtle from a numerical perspective, Glasspack would be discarded, and acid-free paper and Forex Smart would be seen as the second and third choices, respectively.
Out of the performed tests, when it comes to deploying the structures. the selected materials should fulfil some basic requirements in order to be used in a museum environment. The most important one is that the material should be innocuous to the heritage assets in its environment. Many materials are known to release different pollutants that can cause degradation of sensitive materials [5,28]. Additionally, since the chart is to be used in combination with metallic coupons (acting as sensitive materials for the environment), the materials of the chart should also be interred to the metal coupons. In order to check these aspects, the four candidate materials have been subject to the Oddy Test. Based on these results, which can be found in detail in a related work by the authors [11], acid-free laminated paper has been chosen, considering the balance between color stability and emission of harmful pollutants.
Thus, considering the facts above, the most suitable material for building the calibration display has been the acid-free laminated paper. Its chromatic stability is the best ones among all the tests, whilst fulfilling the real-life safety requirement. The calibration process for the crowdsourced images can be therefore considered as safe to perform for a prolonged time.
Having decided the definitive materials for building the charts, one has been printed to evaluate its suitability to endure the disparity effects on crowdsourced imaging. Six pictures with different phones, as outlined in the previous section, have been taken in the lab and the CIEDE2000 differences for each color patch extracted. Also, the standard deviation for all the metrics corresponding to the same patch has been calculated (Table A5).
As seen there, not only the quality metrics are excellent, but also the standard deviation is close to 0, meaning the color calibration is adequately performed on every picture and there is and extremely low variability between the processed images, regardless of their camera of source.
In Table A6 and Table A7 the accuracy of the calibration scheme thanks to the robustness of the chart is demonstrated. The average digital L*, a* and b* coordinates for the color patches of each calibrated picture have been extracted and compared with measurements from the printed chart made with the spectrophotometer. Their extreme similarity in all cases reveal the good performance of the calibration scheme, which is allowed with the robust printing on the chart.

4. Conclusions

The work described above has made it possible to evaluate the performance of the developed calibration system in a non-ideal context and to assess how well it works. The application of the calibration method on four different materials has allowed to evaluate the influence of the ageing of different materials in the outcomes of the calibration of the images. Mathematical criteria have been taken in order to select the most adequate support material to build the structure. Under an analysis of color mathematics over the test results, very mild differences have been found between the four of them. Robustness to externally-induced chromatic deviation is practically analogue in every studied case, with a revealed decay that is non-noticeable by human eye.
Thus, the calibration process allows to extract valid information from any taken images, guaranteeing that no errors originating from the color change of the reference charts may hinder the proper operation of the entire system.
Finally, the results support the possibility of manufacturing customized reference color charts using low-cost commercial materials, as the developed calibration process can easily overcome the small color drift introduced by aging. These reference color charts can be used to design low-cost conservation tools, affordable for small museums with limited budget.

5. Future Steps

Considering that the work presented in this paper is engulfed in a the framework of a bigger project, further steps to consider from this point on are the natural continuations of the premises exposed in the previous sections.
The calibration of crowdsourced images, to obtain reliable color coordinates from RGB images obtained with different cameras is a challenging question. Although the same accuracy of a dedicated instrument (spectrophotometer) can not be expected, results shown in this and previous papers by the authors [11,12,13,14,15,19] and other colleagues [13,14,15] show promising results of this approach for our intended application (detection of degradation of heritage artifacts).
After these initial tests, deployment of the color charts in real locations is currently under way. Charts have been industrially printed, and with the corresponding metal coupons, they have been installed in museums, where they are being tested during an one-year period. Their performance and robustness will be evaluated, and possible improvements of the calibration and the crowdsourcing system will be made during that time.
Calibration of crowdsourced images, from different cameras and acquired under non-ideal illumination conditions and angles, is a challenging question that will be addressed in this step. While the accuracy of a dedicated instrument (spectrophotometer or calibrated professional camera) can no be expected, preliminary results suggest that can be enough to detect color changes in the sensitive materials, thus serving as alert system of environmental conditions dangerous for the conservation of heritage artifacts.
When a good performance can be assessed, the whole system can be officially launched and installed.

Author Contributions

Conceptualization, E.C. and J.M.M.; methodology, E.C., B.R.-B., M.A.B.-Á., J.A.R. and J.M.M.; software, M.A.B.-Á. and J.A.R.; validation, B.R.-B. and M.A.B.-Á.; formal analysis, E.C., B.R.-B., M.A.B.-Á. and J.A.R.; investigation, E.C., B.R.-B., M.A.B.-Á., J.A.R. and J.M.M.; resources, E.C., B.R.-B., M.A.B.-Á., J.A.R. and J.M.M.; data curation, E.C., B.R.-B. and M.A.B.-Á.; writing—original draft preparation, M.A.B.-Á.; writing—review and editing, E.C., B.R.-B., M.A.B.-Á., J.A.R. and J.M.M.; visualization, E.C., B.R.-B., M.A.B.-Á. and J.A.R.; supervision, E.C. and J.M.M.; project administration, E.C. and J.M.M.; funding acquisition, E.C. All authors have read and agreed to the published version of the manuscript.

Funding

Work funded by Comunidad de Madrid under project MIPAC-CM (Monitorización por procesado de imagen y ciencia ciudadana para la conservación de materiales del patrimonio cultural—Monitoring by image processing and citizen science for conservation of cultural heritage materials), project code Y2018/NMT-4913.

Institutional Review Board Statement

Not applicable.

Informed Consent Statement

Not applicable.

Acknowledgments

Thanks are due Ignacio García, from Once34, for his generous collaboration for the printing of the charts. EC and BRB wish to acknowledge the support of CSIC Interdisciplinary Thematic Platform “Open Heritage: Research and Society” (PTI-PAIS).

Conflicts of Interest

The authors declare no conflict of interest. The funders had no role in the design of the study; in the collection, analyses, or interpretation of data; in the writing of the manuscript, or in the decision to publish the results.

Appendix A

Table A1. L*a*b* coordinate value evolution for the acid-free laminated paper.
L*a*b* (10°/D65) for BlackL*a*b* (10°/D65) for RedL*a*b* (10°/D65) for GreenL*a*b* (10°/D65) for Cyan
HourL*a*b*L*a*b*L*a*b*L*a*b*
0 h30.34−0.15−1.2955.8047.9237.9862.11−41.2633.6769.35−33.79−13.69
2 h28.25−0.47−1.1655.8548.4139.3662.04−41.2533.9569.00−34.12−14.09
4 h28.48−0.48−1.0155.8048.2538.8761.98−40.7834.1368.98−34.16−13.59
6 h28.32−0.48−1.1255.7748.2439.0661.92−40.9033.8069.06−34.10−13.86
24 h28.20−0.53−1.1655.7948.1138.9961.87−40.8733.7669.03−34.10−12.94
48 h28.29−0.45−1.1555.7448.0738.8061.80−40.9233.4569.09−34.00−13.25
72 h28.27−0.48−1.2055.8047.9238.9861.85−40.5233.2969.10−33.89−13.26
96 h28.32−0.42−1.2255.7847.8238.6661.87−40.4233.2669.08−33.89−13.3
120 h28.54−0.48−1.1855.8447.5738.4261.8−40.0132.8169.1−33.76−13.46
144 h28.58−0.41−1.2555.8747.3638.1461.84−39.8432.7169.27−33.51−13.36
L*a*b* (10°/D65) for WhiteL*a*b* (10°/D65) for BlueL*a*b* (10°/D65) for YellowL*a*b* (10°/D65) for Magenta
HourL*a*b*L*a*b*L*a*b*L*a*b*
0 h92.30−0.36−1.1949.00−17.13−30.5584.55−6.9477.0856.4754.510.50
2 h92.09−0.36−0.6648.98−18.15−29.8784.38−6.5177.1756.5855.141.34
4 h92.00−0.41−0.1948.96−18.03−29.7184.38−6.2476.8056.5554.951.04
6 h92.09−0.500.0548.93−17.96−30.0584.30−6.2776.7956.5854.861.15
24 h92.04−0.781.3448.86−18.06−29.9284.33−6.0476.7456.6354.861.23
48 h92.03−0.861.6249.00−18.17−29.7784.27−6.1576.4256.6154.751.08
72 h92.09−0.871.6648.82−17.96−29.8184.22−6.0676.1056.6454.791.10
96 h92.22−0.91.7749−18.3−29.6884.16−5.9875.9356.5854.751.19
120 h92.1−0.92.1649.08−18.17−29.2484.04−5.847556.6454.321.13
144 h92.21−0.92.149.07−18.21−29.0884.07−5.8974.6356.654.271.12
Table A2. L*a*b* coordinate value evolution for the acid-free paper.
L*a*b* (10°/D65) for blackL*a*b* (10°/D65) for RedL*a*b* (10°/D65) for GreenL*a*b* (10°/D65) for Cyan
HourL*a*b*L*a*b*L*a*b*L*a*b*
0 h29.841.31−1.3757.4647.8939.8664.07−40.3235.1071.59−31.00−16.15
2 h30.111.37−1.1257.6548.2739.9164.15−39.2134.7271.29-31.08−15.63
4 h30.141.28−1.1157.3948.1139.6663.83−39.1434.8171.20−31.17−14.99
6 h29.991.42−1.1257.5048.0339.8063.79−39.2134.4371.11−31.20−14.86
24 h30.591.43−0.9357.4947.7239.5663.60−38.6134.6071.03−31.23−13.83
48 h30.311.56−0.8757.4547.5939.1463.63−38.3733.8471.05−31.08−13.30
72 h30.071.65−0.8457.4247.5739.2763.62−38.0833.8370.92−31.02−13.04
96 h30.421.61−0.757.447.3239.0163.56−37.8133.5571.06−30.72−12.6
120 h30.531.67−0.6957.5146.7938.7263.66−37.4133.2971.1−30.6−12.17
144 h30.571.73−0.6657.4146.9638.6463.6−37.2733.0271.2−30.28−12.32
L*a*b* (10°/D65) for WhiteL*a*b* (10°/D65) for BlueL*a*b* (10°/D65) for YellowL*a*b* (10°/D65) for Magenta
HourL*a*b*L*a*b*L*a*b*L*a*b*
0 h95.570.07−0.9350.98−17.55−33.0587.11−6.2679.8058.1955.42−0.71
2 h95.34−0.180.6450.69−17.58−32.2486.84−5.7978.9058.4455.280.35
4 h95.21−0.211.2450.52−17.50−31.8286.59−5.3279.0658.2555.260.39
6 h95.13−0.301.6950.55−17.58−31.7386.53−5.3378.6858.3355.010.74
24 h94.89−0.543.2750.56−17.49−30.8886.38−4.8278.3058.3454.601.16
48 h94.66−0.553.8050.48−17.53−30.3585.89−4.7377.3258.2754.241.63
72 h94.83−0.483.6150.56−17.83−29.9286.01−4.6776.6358.4354.011.90
96 h94.91−0.43.4850.46−17.47−29.4785.9−4.3476.3358.3953.82.03
120 h94.95−0.373.3350.55−17.45−29.1785.77−4.2775.0558.4753.382.11
144 h94.99−0.33.0250.66−17.62−28.8685.77−4.174.6658.453.341.87
Table A3. L*a*b* coordinate value evolution for the Forex Smart.
L*a*b* (10°/D65) for BlackL*a*b* (10°/D65) for RedL*a*b* (10°/D65) for GreenL*a*b* (10°/D65) for Cyan
HourL*a*b*L*a*b*L*a*b*L*a*b*
0 h28.341.10−1.7955.1547.0938.8062.03−41.5735.4669.08−32.53−11.65
2 h28.361.07−1.7255.5547.2939.1461.76−41.0135.0769.10−32.22−11.28
4 h28.421.11−1.7455.3747.2738.9361.79−40.7535.0769.07−32.01−11.51
6 h28.501.26−1.6655.3947.0838.8361.66−40.5434.9268.79−31.96−10.72
24 h28.651.31−1.4555.2946.8538.6061.69−39.9734.7568.95−31.69−11.11
48 h28.851.63−1.3655.3146.5838.2161.56−39.7134.0869.03−31.26−10.88
72 h28.881.72−1.3655.3646.4037.9661.54−39.4133.8269.01−30.91−10.63
96 h29.041.83−1.2755.346.2537.7961.57−38.9333.3268.99−30.85−10.87
120 h28.941.85−1.1855.444637.5961.51−38.8833.0669.04−30.8−10.55
144 h29.051.99−1.1255.445.8437.3661.62−38.5733.1469.12−30.59−10.73
L*a*b* (10°/D65) for WhiteL*a*b* (10°/D65) for BlueL*a*b* (10°/D65) for YellowL*a*b* (10°/D65) for Magenta
HourL*a*b*L*a*b*L*a*b*L*a*b*
0 h91.21−0.912.1348.76−18.95−30.3483.86−7.1877.3056.0053.65−0.05
2 h91.41−0.812.4148.40−18.67−29.4983.87−6.5676.8856.4153.830.87
4 h91.38−0.772.3148.59−18.93−29.1783.70−6.3376.5256.2953.671.24
6 h91.39−0.762.2548.58−18.89−29.1183.67−6.0576.1656.2753.571.04
24 h91.42−0.692.1948.37−18.34−28.5283.47−5.7475.2956.3552.991.07
48 h91.20−0.722.1848.69−18.47−28.4783.16−5.6574.5156.4052.820.85
72 h91.20−0.652.6448.79−18.00−28.2683.03−5.4973.8156.5552.550.99
96 h91.02−0.643.248.67−18.01−27.5882.91−5.1373.4356.5252.271.16
120 h91.1−0.68348.8−17.73−27.3382.52−4.8572.4356.5151.981.42
144 h90.85−0.663.8148.99−17.84−27.1982.63−4.7572.1556.4951.891.14
Table A4. L*a*b* coordinate value evolution for the Glasspack.
L*a*b* (10°/D65) for BlackL*a*b* (10°/D65) for RedL*a*b* (10°/D65) for GreenL*a*b* (10°/D65) for Cyan
HourL*a*b*L*a*b*L*a*b*L*a*b*
0 h29.221.13−1.3955.8646.3138.8262.48−41.2834.0871.01−27.50−16.45
2 h29.641.14−1.2256.0046.1638.1162.37−40.4533.6670.95−27.15−16.35
4 h29.561.19−1.2055.9245.9738.1062.28−40.1633.5970.98−26.92−15.94
6 h29.621.20−1.1455.8446.1838.0462.30−39.9833.5870.99−27.09−15.99
24 h29.751.31−0.9955.9145.6337.6962.19−39.2933.0370.59−27.77−15.62
48 h29.741.34−0.9555.8045.5237.4362.16−38.9232.6970.75−27.25−14.30
72 h29.901.45−0.8255.8845.2937.1462.09−38.8232.4970.37−27.33−13.54
96 h29.791.52−0.7655.945.1537.162.08−38.7732.6270.19−27.57−12.84
120 h30.011.56−0.7155.8445.0336.9662.06−38.532.2170.35−27.14−12.07
144 h30.071.64−0.6655.7844.8736.6261.97−38.0432.1769.83−27.5−11.14
L*a*b* (10°/D65) for WhiteL*a*b* (10°/D65) for BlueL*a*b* (10°/D65) for YellowL*a*b* (10°/D65) for Magenta
HourL*a*b*L*a*b*L*a*b*L*a*b*
0 h92.83−0.13−3.3249.20−16.42−33.9285.05−7.6577.8556.3954.23−1.82
2 h92.70−0.04−3.3049.27−16.38−33.2984.81−7.0477.5356.5354.67−1.28
4 h92.69−0.05−3.2149.29−16.45−32.9484.59−6.7676.9856.7254.05−1.14
6 h92.69−0.07−3.1949.23−16.36−32.8884.61−6.5577.1156.5954.27−1.01
24 h92.51−0.28−2.1449.27−16.68−31.7584.21−6.1476.2556.6553.79−0.88
48 h91.85−0.750.4549.14−16.54−31.3183.99−6.0875.3956.6853.39−0.72
72 h91.01−1.004.4849.25−16.57−30.8783.81−5.7174.9156.7253.03−0.38
96 h90.5−1.086.7349.32−16.69−30.783.58−5.5274.4456.752.83−0.33
120 h90.32−1.097.7949.45−16.53−30.483.56−5.2774.1656.7152.430.09
144 h89.54−0.929.9949.42−16.64−29.883.32−4.873.8656.6852.260.32
Table A5. Accuracy CIEDE2000 Δ E metrics of the 64 color patches for the six calibrated pictures of different phone camera. The last column describes the standard deviation of all measures for the same patch.
PatchPhone 1Phone 2Phone 3Phone 4Phone 5Phone 6Std
00.2719294350.2501424830.2217599910.1029241290.3339976520.028893760.113844225
10.2463945160.2765682780.3037338550.2292853310.1848309090.25850820.040876939
20.1286652730.2049574690.3145256050.2319161350.1379994580.3138715590.081434158
30.4831615420.2133420920.6185286780.3920713870.2802354190.277698580.152210414
40.3132481790.2842058840.2451302030.3790215430.241926560.1735082250.070180908
50.1889592230.1718717060.1004813450.3676919110.1954812260.252287670.090232708
60.1105692980.189010370.1886153550.2747883130.2412802890.0704890340.077076837
70.2509870530.1523191780.0932222690.092584940.1429281460.1856313340.05998585
80.2530624220.1596114920.3553508670.2876964620.2623388930.1766924550.072416772
90.2682346290.106246810.2674944980.1646702770.2991915080.2238609720.073285739
100.4944654830.2743530470.4164777880.2521883370.6008993560.4419617640.132571583
110.4944307090.1396502270.485847790.2710463960.3141339580.2369392920.141213687
120.3147482890.2309745660.1849041780.1453490960.1852998130.1026172790.073243983
130.4091525030.751730150.1375262430.0609198730.1997531810.1310349810.259275007
140.2633515380.2111113250.1967027580.2450217070.1641990320.2636345050.040121722
150.3043664550.2070333760.0549022580.2175433580.2764064650.2055271940.086545131
160.2363358270.2222213410.3062174650.1046794790.2685791990.3181213640.077333208
170.2379675420.2650629790.3018603650.0731602950.1921500120.220988150.079062986
180.1103203370.5942093190.2011478950.3941281540.336438950.1249447120.18595185
190.0993999210.2412216180.3503302140.3240055450.0531447670.1868542820.119190645
200.1819893290.2389465610.1693688530.1905027420.2955355890.2574312470.049623555
210.25804840.3826695650.2832280920.1610519040.1810454830.2082212770.081328547
220.2144211290.1104430830.1406065240.2757918620.0916493530.1409834780.069573943
230.4508052860.2093192130.4112247450.1516478830.1686505340.0798545520.150383577
240.1712228720.2262347140.1888791910.1949809340.1991554440.2072798310.018406291
250.1522897680.2568375560.3071903180.3463868740.1271409710.081858590.106615734
260.3566440330.0618384640.2197704630.2707391790.3543496740.2634148790.10869328
270.1875930870.2111994910.2144945410.1691103860.28238890.285117420.048438277
280.3561174520.5053353280.3892708890.3385975790.406677260.3352412220.063807319
290.3258459860.2832561290.2322539680.1801189520.3738043230.1713279380.081036101
300.2577216840.0735320580.2994606140.2672667730.1207042560.3050784350.09850842
310.2048838820.2490433470.1507909740.2994621360.266900040.1271821870.067693635
320.3547444520.1185319670.2113441190.1172609010.1650096220.1717548390.088263312
330.1384758970.2606545690.2108275970.2206423810.2239742720.1890156260.040954298
340.1404173670.2574505430.1347160960.173603910.1693679030.2082108550.045963991
350.2321652050.5215100480.3517643240.2356583470.3783682520.3349910020.106829021
360.2186536550.2148661920.239130920.1850659960.2478754570.1184728560.047255538
370.3059744160.1792469240.3397302260.2007453720.1605046420.2338181310.071863476
380.0607387090.0550848750.1957141810.2209316350.1288911280.192330170.072079879
390.3795475860.4152478390.3911575710.1285746330.2371437540.1707741690.124059676
400.3342111350.1232292650.4841579060.1601564940.298907120.354688090.133077681
410.3701341320.1374570020.3924799820.2340402470.446104530.2816222430.114270914
420.4920722620.2474978770.3639517020.5253245050.4031152610.255980560.116102014
430.4218170460.2365022760.3105101720.2394848940.2201929220.159677780.090802861
440.220898950.1576289510.2702591660.208948530.1555981790.2175017170.043284776
450.2900532180.127396330.1767084030.1773550720.1867916320.2121061740.05405787
460.2367550820.3699186540.206436060.2781816820.1857169630.1061993960.08920253
470.2751069930.2328080080.0752724260.2098167230.2074413110.1995629650.066972122
480.2243517590.108342360.1578636410.1990645170.1534713240.055781210.061027414
490.162803860.3473273040.1909860440.2373725870.2219822830.3203766860.072656193
500.1474936470.2185786210.1454958640.1199241330.2242509370.1683459850.042231686
510.3661392720.4073103180.1374873690.2892393540.261125670.2027297690.100307067
520.1918063580.2104803080.1325500630.1912740560.2311856920.2441455220.039303019
530.4090091430.2195826430.3534655850.1768589140.1862572380.1074911260.115119371
540.3076354260.1918998470.1809553720.1136461210.206974740.2466315710.065290027
550.3489543110.1246755350.2595668510.1235551330.2075674510.1956130190.085710039
560.2135741690.1783646480.082061610.1989030950.2148463240.186567580.049661196
570.3720694840.1606535780.1482160460.1472581290.1966016520.0117835460.116280205
580.2147380050.2965872760.1561984310.1889515790.3323484540.1253950660.080615932
590.2434850910.1301241370.1375540490.130292950.2578851550.1910184010.058240919
600.0258197750.2059190130.1716274210.1703781960.1557628610.1855521550.064327365
610.3671643460.0873322550.2245716410.3492419760.1780353420.0818992370.123812157
620.203230230.1862930090.3414285770.2735413770.0332486620.1344408970.107316104
630.2755326240.0765312350.2310209930.4208005780.2256145030.5017305410.151873651
Table A6. Average digital L*, a* and b* coordinate values for each one of the 64 color patches in the calibrated images 1, 2 and 3, compared to average spectrophotometer values taken from the original printed chart.
Image 1Image 2Image 3Original
Patch L* a* b* L* a* b* L* a* b* L* a* b*
027.528960761.940085385−2.4643411727.59110441.684838075−2.18770451127.267813241.840957936−2.39376622128.481.76−1.79
130.528447883.425624636−16.6351629430.394322453.77587721−17.1538839330.890451323.388856611−16.7039728831.2753.41−16.695
237.113332365.501754653−36.0306757136.922913485.439984149−36.0488191636.680275315.676916174−36.2970603437.215.7−36.18
344.851442921.055814781−39.630345744.498743781.412425833−39.9582587844.111434121.512465575−40.5319799643.5351.555−40.78
437.55780127−24.034637167.06190609437.82659385−23.895717597.58361123237.35753996−23.84322446.90666717238.09−25.2457.95
539.15102941−23.26824399−7.28221627639.01746451−23.39561091−7.29836275739.69673034−23.63061994−7.20642758139.515−23.895−7.49
644.19535371−3.540097313−39.4169843645.30573656−4.703276544−38.9010306645.00765675−3.661401777−39.222051744.395−7.45−40.77
749.4800024−2.934390976−38.4062579850.38564715−2.778069792−39.1246929350.36246−3.622297424−38.433093649.68−2.065−39.325
857.64789331−45.7578681926.9286862357.11132373−46.4045349627.4518396657.00311629−46.2210847727.2800832557.33−46.326.675
956.64130722−46.5651050723.4881256257.48377773−46.5626075223.355045557.63389076−46.8925311523.8942620257.845−46.92523.425
1063.65420835−36.21338151−9.1096677162.74801063−36.0197361−9.27919752162.61772191−35.91766043-9.32375596462.4−40.11−10.485
1153.4834473222.4298452−32.5920530854.7965318518.65495821−30.3829390353.7804152221.48711747−30.9462791355.8119.38−29.795
1250.0336194936.5078488129.7928401750.4239919136.540776629.6801609150.347007236.7193043330.4713213551.1335.71531.095
1351.3049191736.2413456912.5967524851.4553414135.8016856413.4334086451.2156139737.0708315814.1512552951.7835.813.435
1455.3079074540.37459087−22.5720929856.0255112538.74997706−21.983062955.1505340539.46093151−22.5539688456.33538.375−22.495
1559.9825911814.57412285−26.1799401858.9364518416.6958397−29.2795588959.6934064416.61841689−28.8993506859.7416.81−28.46
1664.21884343−5.28895817246.3888134564.31294409−4.91186656746.8693570166.27703833−6.16610273147.4454805365.625−6.28549.225
1765.7070991−6.44207509536.2091911366.85054033−7.71281362636.9007413166.77709405−7.97742147536.4223632366.85−7.33537.735
1869.60491065−1.037148255−2.77068138870.37226642−1.596375953−2.45595893770.67463762−1.293578523−2.20024434170.68−1.46−1.67
1972.650072733.537145056−22.3284186272.230617922.29386843−22.1153566471.599107333.431581274−22.5410470572.6452.485−21.26
2072.08795983−29.9632375840.1305721572.25397659−30.3910487540.133710371.95075054−30.1034709240.2006277972.835−31.16541.475
2166.48456231−20.21942868−30.8319707866.14133647−21.10753395−30.8345674465.85752001−19.99946753−31.9861733366.97−20.545−31.015
2248.2643043543.46637054−20.1382651148.3984106143.55834291−20.835488648.0635113742.76473015−19.8497555749.4243.245−20.47
2393.071100560.480398054−2.21078179893.117779410.584249954−2.46912310293.110802110.040906703−1.58770616193.920.010.695
2473.81490925−29.4177547633.2763472574.33651838−29.4306992132.8819228774.67380491−28.847406732.0191578175.155−29.2831.625
2571.32022776−33.4040407325.2382469671.01446893−33.6033219625.2150617471.30792479−33.4054190825.4565271571.915−33.61524.76
2646.6883131442.586271623.06239877146.7490143242.910598733.06274990546.3914154942.383761493.2759650847.455423.665
2790.28364574−6.85438900132.383103990.42456269−6.82956419532.5157261490.42190425−6.6396325232.5876650991.015−6.7634.29
2882.50956456−18.9999071710.5135080680.01422063−20.2839359211.3703117980.89092256−20.1658746611.3454752281.745−20.43511.78
2973.33739054−30.9522571619.4068843671.84133788−32.3612291818.4173036972.0072174−32.2781001718.850957673.755−31.53520.955
3046.5078530739.6203640425.1259148146.3426777339.613504824.5336153946.3462984839.8482991325.0491856546.95539.01526.085
3188.45744974−7.90664610857.8499368188.49462709−8.3223043858.2499038188.24843655−7.62293002557.9240016589.235−7.90559.555
3283.88535305−13.30459614−5.56484014684.08026642−13.40205548−5.85961065183.85563609−13.36227692−5.95328744784.925−13.245−3.92
3373.21308917−28.7805964911.0722583373.73154538−29.3941827111.0404394573.18691027−29.6280450112.0657199975.275−29.2812.69
3479.01732041−20.29382547−8.17649052479.41025279−20.52516119−8.68269693878.91898245−20.62018708−8.89803321679.82−20.945−7.245
3587.00249335−7.02022709369.8275181286.75581835−7.17949558669.3374337486.9331797−7.22863316669.659034888.04−7.17568.67
3654.2192121651.3366591329.4691604954.5848430351.2219346428.837020754.4964962750.9830220629.5479747855.12550.8428.665
3777.42188163−22.69954922−10.006058177.6539603−22.63438376−9.28471639677.53926332−22.56759932−9.17121090278.02−23.11−8.98
3882.14247216−18.9448865513.2691316882.47374178−18.5040352813.6776846782.34169714−19.1735440814.3933203882.445−19.1913.545
3974.679546123.0498015−14.4065776674.0576047123.99370221−14.5781844373.7710033424.11986026−14.9709043775.8223.17−12.91
4058.7481491848.894385213.3229986357.9053126549.2374971413.5396065357.8896928149.0354588213.4967433658.4949.66513.86
4134.0071107315.504615854.48210461834.1162723315.567569114.52879961433.7380215415.708928133.8878118234.54515.524.59
4272.51590328−30.4918894221.3530270673.89692325−30.4960389320.6263647574.02141264−29.8870575421.5809368474.58−30.1221.085
4374.4580570824.755716066.4150053374.9501089525.222330785.52969116474.6389814925.60906965.57516031676.09524.726.005
4466.7611334330.1367645642.1766941666.8805982229.7385187641.8914755167.3293027629.6777641442.1572038868.04529.5341.12
4568.2484159828.0026926652.508766267.5552081328.4923646952.5115351967.9535471828.2503581452.8729719668.827.21552.515
4666.4490956432.69122225−18.5011090766.3235020333.37664642−19.2773077266.1949668332.34189712−18.7794867168.26531.125−18
4766.2139886443.99953714−7.02179304666.6661923843.97419765−6.75780038967.6541165942.85463761−5.77939176367.00543.815−5.98
4861.7387984142.8817188318.8331148261.6565207942.6909686219.5675919661.8638813543.519114319.1272587162.80542.2218.4
4956.6752333947.1339793134.1830970957.2600377946.7392254233.8491173557.6148101248.1195072634.5861746658.23546.31532.82
5062.5928121537.61749504−21.1899051863.1129569136.71794436−20.5794778764.2869296935.71225626−19.7838122765.1435.48−19.095
5162.141537751.61772784−10.8883586862.1794937451.23244091−9.89763154862.3402351151.14798066−9.76712009263.0751.21−9.9
5235.4160903319.81918853−18.9716434335.460851219.58797471−18.5002200435.5205796519.31963695−18.5444771136.619.215−18.575
5371.10158073−33.9393933726.7432024771.21066761−33.1974613526.4424543971.28116265−33.298832626.3016081972.15−33.22528.21
5467.65400795−11.69704331−28.753347167.70258186−11.95497529−29.2802313466.75588533−11.99225353−29.5502333967.965−11.78−28.46
5563.43585511−35.45521782−10.2779606464.72563028−36.85011795−9.15030713865.28151471−37.06127014−9.38552461265.98−36.625−9.57
5659.38416043−44.384051426.8763990860.60024603−44.002763627.1492577460.15378776−44.1490901126.8134773160.815−45.0527.745
5759.32569875−41.1614374632.2721787759.47200176−40.9933793932.4497604159.55199903−41.5721320532.5658190159.925−41.84532.88
5851.68926841.924673318−37.1271651851.992191031.448863089−36.6666518751.74176392.19955439−37.0100733352.7052.285−36.88
5946.353775638.006324837−38.8882346346.816286117.634440672−38.710956846.471520567.63538707−38.9166644147.387.92−38.2
6041.28071328−1.03201906−3.5513502941.26454046−0.452501366−4.09155767841.85800808−1.679658484−3.41037706642.445−1.245−2.34
6141.26734932−1.97620997516.1294176741.35594998−2.02551036516.3171231641.21703307−2.07487413515.9427414341.69−2.27516.61
6246.579372466.27645001−38.9583997446.062077195.998004298−38.9597484746.312506526.035975669−38.5698233146.5756.655−38.765
6338.9079877418.54048787−37.1718803339.5082605318.12910522−36.668068339.0295935718.42266151−37.0107972939.8718.085−36.39
Table A7. Average digital L*, a* and b* coordinate values for each one of the 64 color patches in the calibrated images 4, 5 and 6, compared to average spectrophotometer values taken from the original printed chart.
Image 4Image 5Image 6Original
Patch L* a* b* L* a* b* L* a* b* L* a* b*
027.843900451.532977499−2.31230763927.410817921.737681612−2.67093538827.791520961.871001564−2.53185509528.481.76−1.79
130.773265693.216858759−16.4162595630.359100563.115652151−16.379654530.837192264.032367902−17.5592881831.2753.41−16.695
236.927673835.398406632−36.3223327537.390137184.956958697−35.6960837136.99299574.645112842−35.3805960637.215.7−36.18
343.043931631.616783924−40.3949630343.490494811.344461059−40.6079475543.582624941.556095019−40.328870243.5351.555−40.78
437.62633246−23.830913046.69335334537.66889697−24.113272437.10432535337.76057215−23.431766636.32030283238.09−25.2457.95
539.37751796−23.61478952−6.95080362539.54331235−23.7936065−6.97486152639.48432712−23.38383483−6.89503705139.515−23.895−7.49
644.88009847−4.140929296−39.0047138744.09932943−3.664806806−39.3359543344.47252457−3.617463692−39.5026245644.395−7.45−40.77
749.75008095−3.788442272−38.2344509949.60937163−3.218457094−38.7683341449.80080886−3.350698281−38.3602730149.68−2.065−39.325
856.41657275−46.1214450526.4618643356.6990077−46.1509215727.0972873456.75370742−46.3594359427.0893183957.33−46.326.675
956.54594173−46.300701723.2458957456.96122101−46.5037107523.5605431357.20099135−46.882612123.1310966757.845−46.92523.425
1061.95869478−35.33171643−9.66563111161.90884303−35.69720656−9.31675638662.06297994−35.73662427-9.45286876262.4−40.11−10.485
1154.0092022220.29430904−30.1409516954.0245583420.15519017−30.1944566954.0441936220.57563394−30.5946588555.8119.38−29.795
1250.7630699836.2556521429.7001486450.321165636.4504481629.9742635450.5216256536.0051366729.4611827451.1335.71531.095
1351.3777739937.1408293813.2002323951.0436016636.6892042413.3563940351.3269786835.741409712.492866851.7835.813.435
1455.150467540.30350427−22.5600604755.6835617738.30397244−22.6360348455.3823157738.95463951−22.0347166856.33538.375−22.495
1559.2473227216.29567805−29.0691994558.7185882517.33657072−29.7089453559.9086810415.54335443−27.7956101859.7416.81−28.46
1664.99936658−5.36667324847.4162103565.26113083−5.34929752947.0514228764.71565361−5.03400697646.5214756765.625−6.28549.225
1766.36652028−6.77363692536.4707055566.75256872−7.08392578736.3595238865.8622864−6.86468849933.7812068566.85−7.33537.735
1869.67225494−1.218297215−2.8438852169.37335967−0.662208688−3.40647375769.8910629−1.573397502−2.87827265770.68−1.46−1.67
1972.348262473.340522502−22.0471722371.365133712.631122412−22.0388731671.980563992.30122554−21.1139119772.6452.485−21.26
2072.2838467−29.9541307439.496547572.53812741−30.325808340.7985498671.85883893−30.1137185238.6145420872.835−31.16541.475
2166.58398805−20.93859228−30.6655597966.28450473−20.9867504−30.6836200566.48544136−21.47761298−30.47178666.97−20.545−31.015
2248.6434096543.40890309−20.6063863548.6933077442.84511931−20.2172721748.8156053443.00231525−20.1516631349.4243.245−20.47
2392.979165910.446472546−2.48355236793.131642430.422363543−2.03439890593.024929330.391578784−2.25090124993.920.010.695
2474.77668562−29.0053465532.3798555674.57748087−29.4575337933.4174733274.19571566−30.1144284132.3987559575.155−29.2831.625
2570.99344272−33.31841524.5551800870.78850489−33.6512267925.5583873470.99951706−33.5757958125.8358823171.915−33.61524.76
2646.802055442.813912852.9777973446.8630162942.684538482.81192164646.9529899442.27922633.7361487147.455423.665
2790.22558813−6.45379705531.8338621290.63254541−6.59212159432.1454870690.29284704−6.96574658932.3905607491.015−6.7634.29
2881.59970575−20.1037490211.4845336480.6446357−19.668259410.7204179681.31709195−19.6252594310.6654438181.745−20.43511.78
2972.71040797−31.5501243919.556033872.98182861−31.5165005719.5531845572.95892037−30.8434991418.4448310273.755−31.53520.955
3046.414083539.7116221925.0934096946.0158442739.9293352325.0573479946.1099073640.163803124.2705733746.95539.01526.085
3188.19116676−7.04720665357.1079224688.34897451−7.705307858.1117237988.90342919−9.5548692461.8633777789.235−7.90559.555
3283.78760412−13.58129619−5.72675464683.99850325−13.62228723−6.11645657383.81722249−14.22508637−5.89498399184.925−13.245−3.92
3373.92283188−29.2811702211.7593894873.99294482−30.0447924410.8324299874.00723015−28.8211768410.8879676475.275−29.2812.69
3479.05423237−19.87488283−9.22443028278.26841816−20.3675405−8.97205598778.92438851−20.5950793−8.70953681879.82−20.945−7.245
3587.08674965−7.37903220168.9319053887.15988747−7.51782692568.6985380887.21992733−7.48387715670.4469201488.04−7.17568.67
3654.3992664551.3199971828.8867007554.5426125251.0562499229.5264610554.5884715451.5481746728.1639190455.12550.8428.665
3777.36079365−22.83814087−9.82237952278.46512281−22.15566897−8.46895235877.74286813−22.69127103−9.54644607278.02−23.11−8.98
3882.23812975−19.0489580313.2675955481.64180906−19.360021212.8846360481.90436273−19.0169764812.6595295982.445−19.1913.545
3974.4228772423.87039033−14.4821088975.4940533923.6835711−14.5205815774.5178372923.44230011−14.4359717475.8223.17−12.91
4057.6874624749.7504761613.3336988358.1064756649.4558641613.4446080558.1028980748.5469652813.9003598358.4949.66513.86
4133.892602415.116444384.72613325333.9435308915.681112744.51814419734.5586332615.168412525.05580665234.54515.524.59
4273.72016441−30.0546111220.898713473.5743727−30.6001868320.8419496373.96029366−30.1900001920.9646783674.58-30.1221.085
4375.5790508724.333469935.82469166475.6096124323.878190135.63647922275.5908218723.995448796.35585581276.09524.726.005
4467.1011066529.8756771642.0819706768.0001721628.5915320441.8249434867.2535339129.5061135441.5319814968.04529.5341.12
4567.8423402928.4780027852.3877464167.8855528428.28316852.4387757268.104930527.6884790651.9625396168.827.21552.515
4667.2941929732.45270154−18.7294025366.4121045332.19712394−18.2916831467.0799947532.98536437−18.9331184368.26531.125−18
4766.4470193844.04136086−6.67255513765.1343840144.52075821−7.03162667966.4025368443.69801067−6.07174070767.00543.815−5.98
4861.8943387242.5148766219.1767707562.02726643.2735631218.5754213662.0447071941.9200265719.79353962.80542.2218.4
4957.1017398747.0381721232.94923357.5640298846.5711893933.548157.15120447.1237398233.3948608158.23546.31532.82
5063.3477872637.19859549−20.4609966362.7057567237.32964234−20.5969360863.5974736336.73912531−20.1607368165.1435.48−19.095
5161.8084243651.49748147−10.2690005262.4694045851.23127861−9.86521282361.904739551.45669871−10.3784247463.0751.21−9.9
5235.677157719.56469581−18.6755230835.5107733419.41240179−18.792538435.7888091619.28150214−18.8188410536.619.215−18.575
5371.16409447−33.0546036227.0918174171.15463322−33.4237969626.6179432771.35643318−32.8227001725.4221372572.15−33.22528.21
5468.03423829−11.97115757−29.1995146265.67275917−12.15639463−29.8056345467.6427247−12.45192684−29.0965332467.965−11.78−28.46
5565.935735−36.75875331−9.83469582465.48147707−37.43557212−8.69819931365.31934028−36.48557493−9.97360359665.98−36.625−9.57
5660.60535657−44.2297173926.9516805560.7284262−44.0436154826.4303522560.07665432−42.543980726.147920960.815−45.0527.745
5759.70494059−42.0942508632.7121885259.49296786−41.5261055232.1225819859.66316454−41.1441648232.5761708159.925−41.84532.88
5852.212071762.085574612−37.4622187452.579756321.564442766−37.0531963852.098586331.731547076−36.5011847152.7052.285−36.88
5946.710021796.598224464−38.001415947.334005127.09793511−38.3833086646.712491937.436372746−38.5836927247.387.92−38.2
6041.69409211−0.836800752−3.72749769242.15542728−0.539986863−4.02522942641.98625942−0.566872976−3.95253079142.445−1.245−2.34
6141.0614387−2.49910176416.1732627640.80795927−1.00978166515.8343671441.30940593−2.45760314415.9344067741.69−2.27516.61
6246.192835986.090939737−39.3428011945.719677426.483745888−39.4229954646.307730155.790182427−38.6365316546.5756.655−38.765
6339.1842994818.40006815−36.4212627139.1570662218.15166614−36.3762552739.450068818.58314654−36.7523687439.8718.085−36.39
Figure A1. Projections of the a*L*, b*L* and a*b* planes depicting the evolution of the CIELAB coordinates of the white patch in the Acid-Free Laminated Paper along time. Following the arrows, it can be seen that its degradation is not linear nor uniform.
Applsci 11 10067 g0a1
Figure A2. Projections of the a*L*, b*L* and a*b* planes depicting the evolution of the CIELAB coordinates of the white patch in the Acid-Free Paper along time. Following the arrows, it can be seen that its degradation is not linear nor uniform.
Applsci 11 10067 g0a2
Figure A3. Projections of the a*L*, b*L* and a*b* planes depicting the evolution of the CIELAB coordinates of the white patch in the Forex Smart along time. Following the arrows, it can be seen that its degradation is not linear nor uniform.
Applsci 11 10067 g0a3
Figure A4. Projections of the a*L*, b*L* and a*b* planes depicting the evolution of the CIELAB coordinates of the white patch in the Glasspack along time. Following the arrows, it can be seen that its degradation is not linear nor uniform.
Applsci 11 10067 g0a4
Figure A5. Curves in the CIELAB space depicting the evolution of the CIELAB coordinates of the white patch for all four materials along time. Red: Acid-Free Laminated Paper; Blue: Acid-Free Paper; Green: Forex Smart; Black: Glasspack.
Applsci 11 10067 g0a5

References

  1. Angelini, E.; Civita, F.; Corbellini, S.; Fulginiti, D.; Giovagnoli, A.; Grassini, S.; Parvis, M. Innovative monitoring campaign of the environmental conditions of the Stibbert museum in Florence. Appl. Phys. A 2016, 122, 123. [Google Scholar] [CrossRef]
  2. Tetreault, J.; Cano, E.; Bommel, M.R.; Scott, D.; Dennis, M.; Barthés-Labrousse, M.G.; Minel, L.; Robbiola, L. Corrosion of Copper and Lead by Formaldehyde, Formic and Acetic Acid Vapours. Stud. Conserv. 2003, 48, 237–250. [Google Scholar] [CrossRef]
  3. Bastidas, D.; Cano, E.; Gonzalez Hernandez, A.; Fajardo, S.; Lleras-Pérez, R.; Campo-Montero, E.; Belzunce, F.; Bastidas, J. An XPS study of tarnishing of a gold mask from a pre-Columbian culture. Corros. Sci. 2008, 50, 1785–1788. [Google Scholar] [CrossRef] [Green Version]
  4. Camuffo, D. Microclimate for Cultural Heritage: Measurement, Risk Assessment, Conservation, Restoration, and Maintenance of Indoor and Outdoor Monuments; Elsevier: Amsterdam, The Netherlands, 2019. [Google Scholar]
  5. Tetreault, J. Airborne Pollutants in Museums, Galleries and Archives: Risk Assessment, Control Strategies and Preservation Management; Canadian Conservation Institute: Ottawa, ON, Canada, 2003. [Google Scholar]
  6. Han, P.; Dong, D.; Zhao, X.; Jiao, L.; Lang, Y. A smartphone-based soil color sensor: For soil type classification. Comput. Electron. Agric. 2016, 123, 232–241. [Google Scholar] [CrossRef]
  7. Verdingovas, V.; Jellesen, M.S.; Ambat, R. Colorimetric visualization of tin corrosion: A method for early stage corrosion detection on printed circuit boards. Microelectron. Reliab. 2017, 73, 158–166. [Google Scholar] [CrossRef]
  8. Dušan, M.; Fialová, P. Optical evaluation of corrosion products using colorimetric spectroscopy. In Proceedings of the 28th International Conference on Metallurgy and Materials, Brno, Czech Republic, 22–24 May 2019. [Google Scholar]
  9. Hackney, S. Colour measurement of acid-detector strips for the quantification of volatile organic acids in storage conditions. Stud. Conserv. 2016, 61, 55–69. [Google Scholar] [CrossRef] [Green Version]
  10. Perez-Monserrat, E.M.; Varas-Muriel, M.J.; Alvarez De Buergo, M.; Fort, R. Black Layers of Decay and Color Patterns on Heritage Limestone as Markers of Environmental Change. Geosciences 2016, 6, 4. [Google Scholar] [CrossRef] [Green Version]
  11. Ramirez Barat, B.; Cano, E.; Molina, M.; Barbero-Álvarez, M.; Rodrigo, J.; Menéndez, J. Design and validation of tailored colour reference charts for monitoring cultural heritage degradation. Herit. Sci. 2021, 9, 1–9. [Google Scholar] [CrossRef]
  12. Bonney, R.; Cooper, C.B.; Dickinson, J.; Kelling, S.; Phillips, T.; Rosenberg, K.V.; Shirk, J. Citizen Science: A Developing Tool for Expanding Science Knowledge and Scientific Literacy. BioScience 2009, 59, 977–984. [Google Scholar] [CrossRef]
  13. Bearman, G.; Doehne, E.; Voss, J.; Merrill, K.; Ba-Garia, R. Citizen Science and Mobile Phone Cameras as Tools for Monitoring World Heritage. In Proceedings of the Built Heritage Monitoring Conservation Management, Milan, Italy, 18–20 November 2013; pp. 737–744. [Google Scholar]
  14. Brigham, R.; Grau-Bové, J.; Rudnicka, A.; Cassar, M.; Strlic, M. Crowdsourcing as an Analytical Method: Metrology of Smartphone Measurements in Heritage Science. Angew. Chem. Int. Ed. 2018, 57, 7423–7427. [Google Scholar] [CrossRef] [Green Version]
  15. Ma, W.; Doehne, E.; Bearman, G.; Walton, M.; Cossairt, O. Crowd-sourced Mobile Phone Images for Heritage Conservation Monitoring. Digit. Herit. 2015, 1, 111–114. [Google Scholar] [CrossRef]
  16. Goñi, S.; Salvadori, V. Color measurement: Comparison of colorimeter vs. computer vision system. J. Food Meas. Charact. 2017, 11, 538–547. [Google Scholar] [CrossRef]
  17. Fdhal, N.; Kyan, M.; Androutsos, D.; Sharma, A. Color Space Transformation from RGB to CIELAB Using Neural Networks. In Pacific-Rim Conference on Multimedia; Lecture Notes in Computer Science, Muneesawang, P., Wu, F., Kumazawa, I., Roeksabutr, A., Liao, M., Tang, X., Eds.; Springer: Berlin/Heidelberg, Germany, 2009; pp. 1011–1017. [Google Scholar]
  18. Milotta, F.; Furnari, G.; Quattrocchi, C.; Pasquale, S.; Allegra, D.; Gueli, A.; Stanco, F.; Tanasi, D. Challenges in automatic Munsell color profiling for cultural heritage. Pattern Recognit. Lett. 2019, 131, 135–141. [Google Scholar] [CrossRef]
  19. Barbero-Álvarez, M.A.; Menéndez, J.M.; Rodrigo, J.A. An Adaptive Colour Calibration for Crowdsourced Images in Heritage Preservation Science. IEEE Access 2020, 8, 185093–185111. [Google Scholar] [CrossRef]
  20. BM. British Museum—Database of Materials Test Results. Available online: https://www.britishmuseum.org/research/publications/research_publications_series/2004/selection_of_materials.aspx (accessed on 15 January 2021).
  21. Thickett, D.; Lee, L. Selection of Materials for the Storage or Display of Museum Objects; The British Museum Occasional Paper; British Museum, Department of Conservation: London, UK, 2004. [Google Scholar]
  22. Wess, T. Smartphone citizen science: Can a conservation hypothesis be tested using non specialist technology? Herit. Sci. 2017, 5, 1–11. [Google Scholar] [CrossRef] [Green Version]
  23. CIE. Methods for Evaluating Colour Differences in Images; Technical Report CIE 199:2011; CIE: Vienna, Austria, 2011. [Google Scholar]
  24. Luo, M.; Cui, G.; Rigg, B. The development of the CIE 2000 colour-difference formula: CIEDE2000. Color Res. Appl. 2001, 26, 340–350. [Google Scholar] [CrossRef]
  25. Witzel, R.F.; Burnham, R.W.; Onley, J.W. Threshold and suprathreshold perceptual color differences. J. Opt. Soc. Am. 1973, 63, 615–625. [Google Scholar] [CrossRef] [PubMed]
  26. Wyszecki, G.; Fielder, G.H. New Color-Matching Ellipses. J. Opt. Soc. Am. 1971, 61, 1135–1152. [Google Scholar] [CrossRef] [PubMed]
  27. Malešič, J.; Kadivec, M.; Kunaver, M.; Skalar, T.; Cigić, I.K. Nano calcium carbonate versus nano calcium hydroxide in alcohols as a deacidification medium for lignocellulosic paper. Herit. Sci. 2019, 7, 1–14. [Google Scholar] [CrossRef]
  28. Lafuente, D.; Cano, E.; Crespo, A.; Künnes, J.; Schieweck, A. The Effects of Organic Pollutants on Metals in Museums Corrosion Products, Synergistic Effects and the Influence of Climatic Parameters. In Metal 2013, Proceedings of the Triennial Conference of the International Council of Museums Committee for Conservation Metal Working Group (ICOM-CC Metal WG); Ewan Hyslop, V., Gonzalez, L.T., Wilson, L., Eds.; Historic Scotland and International Council of Museums: Edinburgh, UK, 2013; pp. 233–237. [Google Scholar]
Figure 1. Visual outline of the conceived cultural heritage conservation system by color monitoring via crowdsourcing.
Applsci 11 10067 g001
Figure 2. The reference color calibration chart, as it is conceived to be printed upon the materials under test.
Applsci 11 10067 g002
Figure 3. Accumulative evolution of the CIEDE2000 difference for the white, black, cyan, magenta, yellow, red, green and blue patches along every measured point in time (2, 4, 6, 24, 48, 72, 96, 120, 144 h). The colors of the curves indicate the homologous patch, and the grey curve stands for the white one.
Applsci 11 10067 g003
Figure 4. The six pictures from six different models of commercial cellphones that imitate the effects of image disparity by crowdsourcing.
Applsci 11 10067 g004
Figure 5. Accumulative evolution of the CIEDE2000 difference for the white patches along every measured point in time (2, 4, 6, 24, 48, 72, 96, 120, 144 h). Red: Acid-Free Laminated Paper; Blue: Acid-Free Paper; Green: Forex Smart; Black: Glasspack.
Applsci 11 10067 g005
Figure 6. The “dummy” colors and textures conceived for evaluating the color calibration procedure with degraded white patches.
Applsci 11 10067 g006
Table 1. CIEDE2000 differences for the seven tested calibrated color stripes for the acid free paper.
HourStripe 1Stripe 2Stripe 3Stripe 4Stripe 5Stripe 6Stripe 7
2 h1.0170.5940.01.7870.8960.0220.047
4 h1.0170.5940.01.7870.8960.0220.047
6 h1.0170.5940.01.7870.8960.0220.047
24 h1.0170.5940.01.7870.8960.0220.047
48 h1.0170.5940.01.7870.8960.0220.047
72 h1.0170.5940.01.7870.8960.0220.047
96 h1.0720.5950.01.7790.8510.0220.047
120 h1.0720.5950.01.7790.8510.0220.047
144 h1.0720.5950.01.7790.8510.02250.047
Mean1.0350.5940.01.7840.8810.0220.0
Variance0.0010.00.00.00.00.00.0
Table 2. CIEDE2000 differences for the seven tested calibrated color stripes for the acid free laminated paper.
HourStripe 1Stripe 2Stripe 3Stripe 4Stripe 5Stripe 6Stripe 7
2 h1.1080.7120.9491.2410.9500.00.0
4 h0.1550.0770.00.0730.1530.00.0
6 h0.1560.0770.00.0730.150.00.0
24 h0.1170.0900.00.1010.200.00.0
48 h0.3320.0990.01.660.530.00.0
72 h0.3580.0860.01.660.510.00.0
96 h0.3580.0860.01.660.510.00.0
120 h1.0210.5880.01.770.8900.02250.0453
144 h0.3580.0860.01.660.510.00.0
Mean0.440.2110.1051.10.490.0030.005
Variance0.1210.0560.0890.5350.0760.00.0
Table 3. CIEDE2000 differences for the seven tested calibrated color stripes for the Glasspack.
HourStripe 1Stripe 2Stripe 3Stripe 4Stripe 5Stripe 6Stripe 7
2 h0.3560.0860.01.6620.5100.00.0
4 h0.3560.0860.01.6620.5100.00.0
6 h1.0330.5950.01.7770.8810.0230.045
24 h1.0210.5700.9491.7810.8910.0230.045
48 h0.3550.08650.01.6620.5100.00.0
72 h1.0330.5950.01.7770.8810.0220.045
96 h1.0370.5950.01.7770.8810.0230.045
120 h1.1120.8880.2732.1561.9671.2171.438
144 h0.3910.08650.01.6610.5100.00.0
Mean0.7440.3990.1361.7680.8380.1450.18
Variance0.1160.0860.090.0220.190.1440.198
Table 4. CIEDE2000 differences for the seven tested calibrated color stripes for the Forex Smart.
HourStripe 1Stripe 2Stripe 3Stripe 4Stripe 5Stripe 6Stripe 7
2 h0.3560.08640.01.6620.5100.00.0
4 h0.3560.0860.01.6620.5100.00.0
6 h0.1610.0770.00.0740.1530.00.0
24 h1.0320.5940.01.7760.8810.0230.045
48 h1.1220.6330.2472.1411.1560.5871.132
72 h1.1100.8880.2722.1561.9661.2161.438
96 h0.1610.07710.00.0730.1530.00.0
120 h0.1220.09010.00.1010.2030.00.0
144 h1.1230.8900.2722.1501.9591.2161.438
Mean0.6160.3800.0881.3110.8320.3380.450
Variance0.1910.1190.0150.7880.4650.2530.399
Publisher’s Note: MDPI stays neutral with regard to jurisdictional claims in published maps and institutional affiliations.

