
Spatial Analysis for Landscape Changes: A Bibliometric Review


Abstract
:1. Introduction
2. Methodology
2.1. Bibliometric Search Engine, Tools, and Software Used for S.A.L.C. Analysis
2.2. VOSviewver Diagrams
- The keyword co-occurrence map. It is a distance graph showing the connection between the keywords included in the selected bibliography. If the terms co-occur inside the same phrases, a higher relevance score is assigned to them. Consequently, terms that are linked and near each other in the map are more related. With the co-occurrence map, it is then possible to analyze the main keywords that characterize the state of the art in a domain field. With this type of analysis, VOSviewer returns the graph showing links between key terms, which are also divided into clusters; these clusters are in turn built up on the basis of the co-occurrences of terms inside the paper titles. Moreover, the number of occurrences and the total link strength are associated with each term.
- The co-authorship cluster map. In this diagram, the countries where the authors belong are represented as nodes. A bigger node consequently means that more authors come from that country. Lines instead represent the relationship between co-authors coming from different countries.
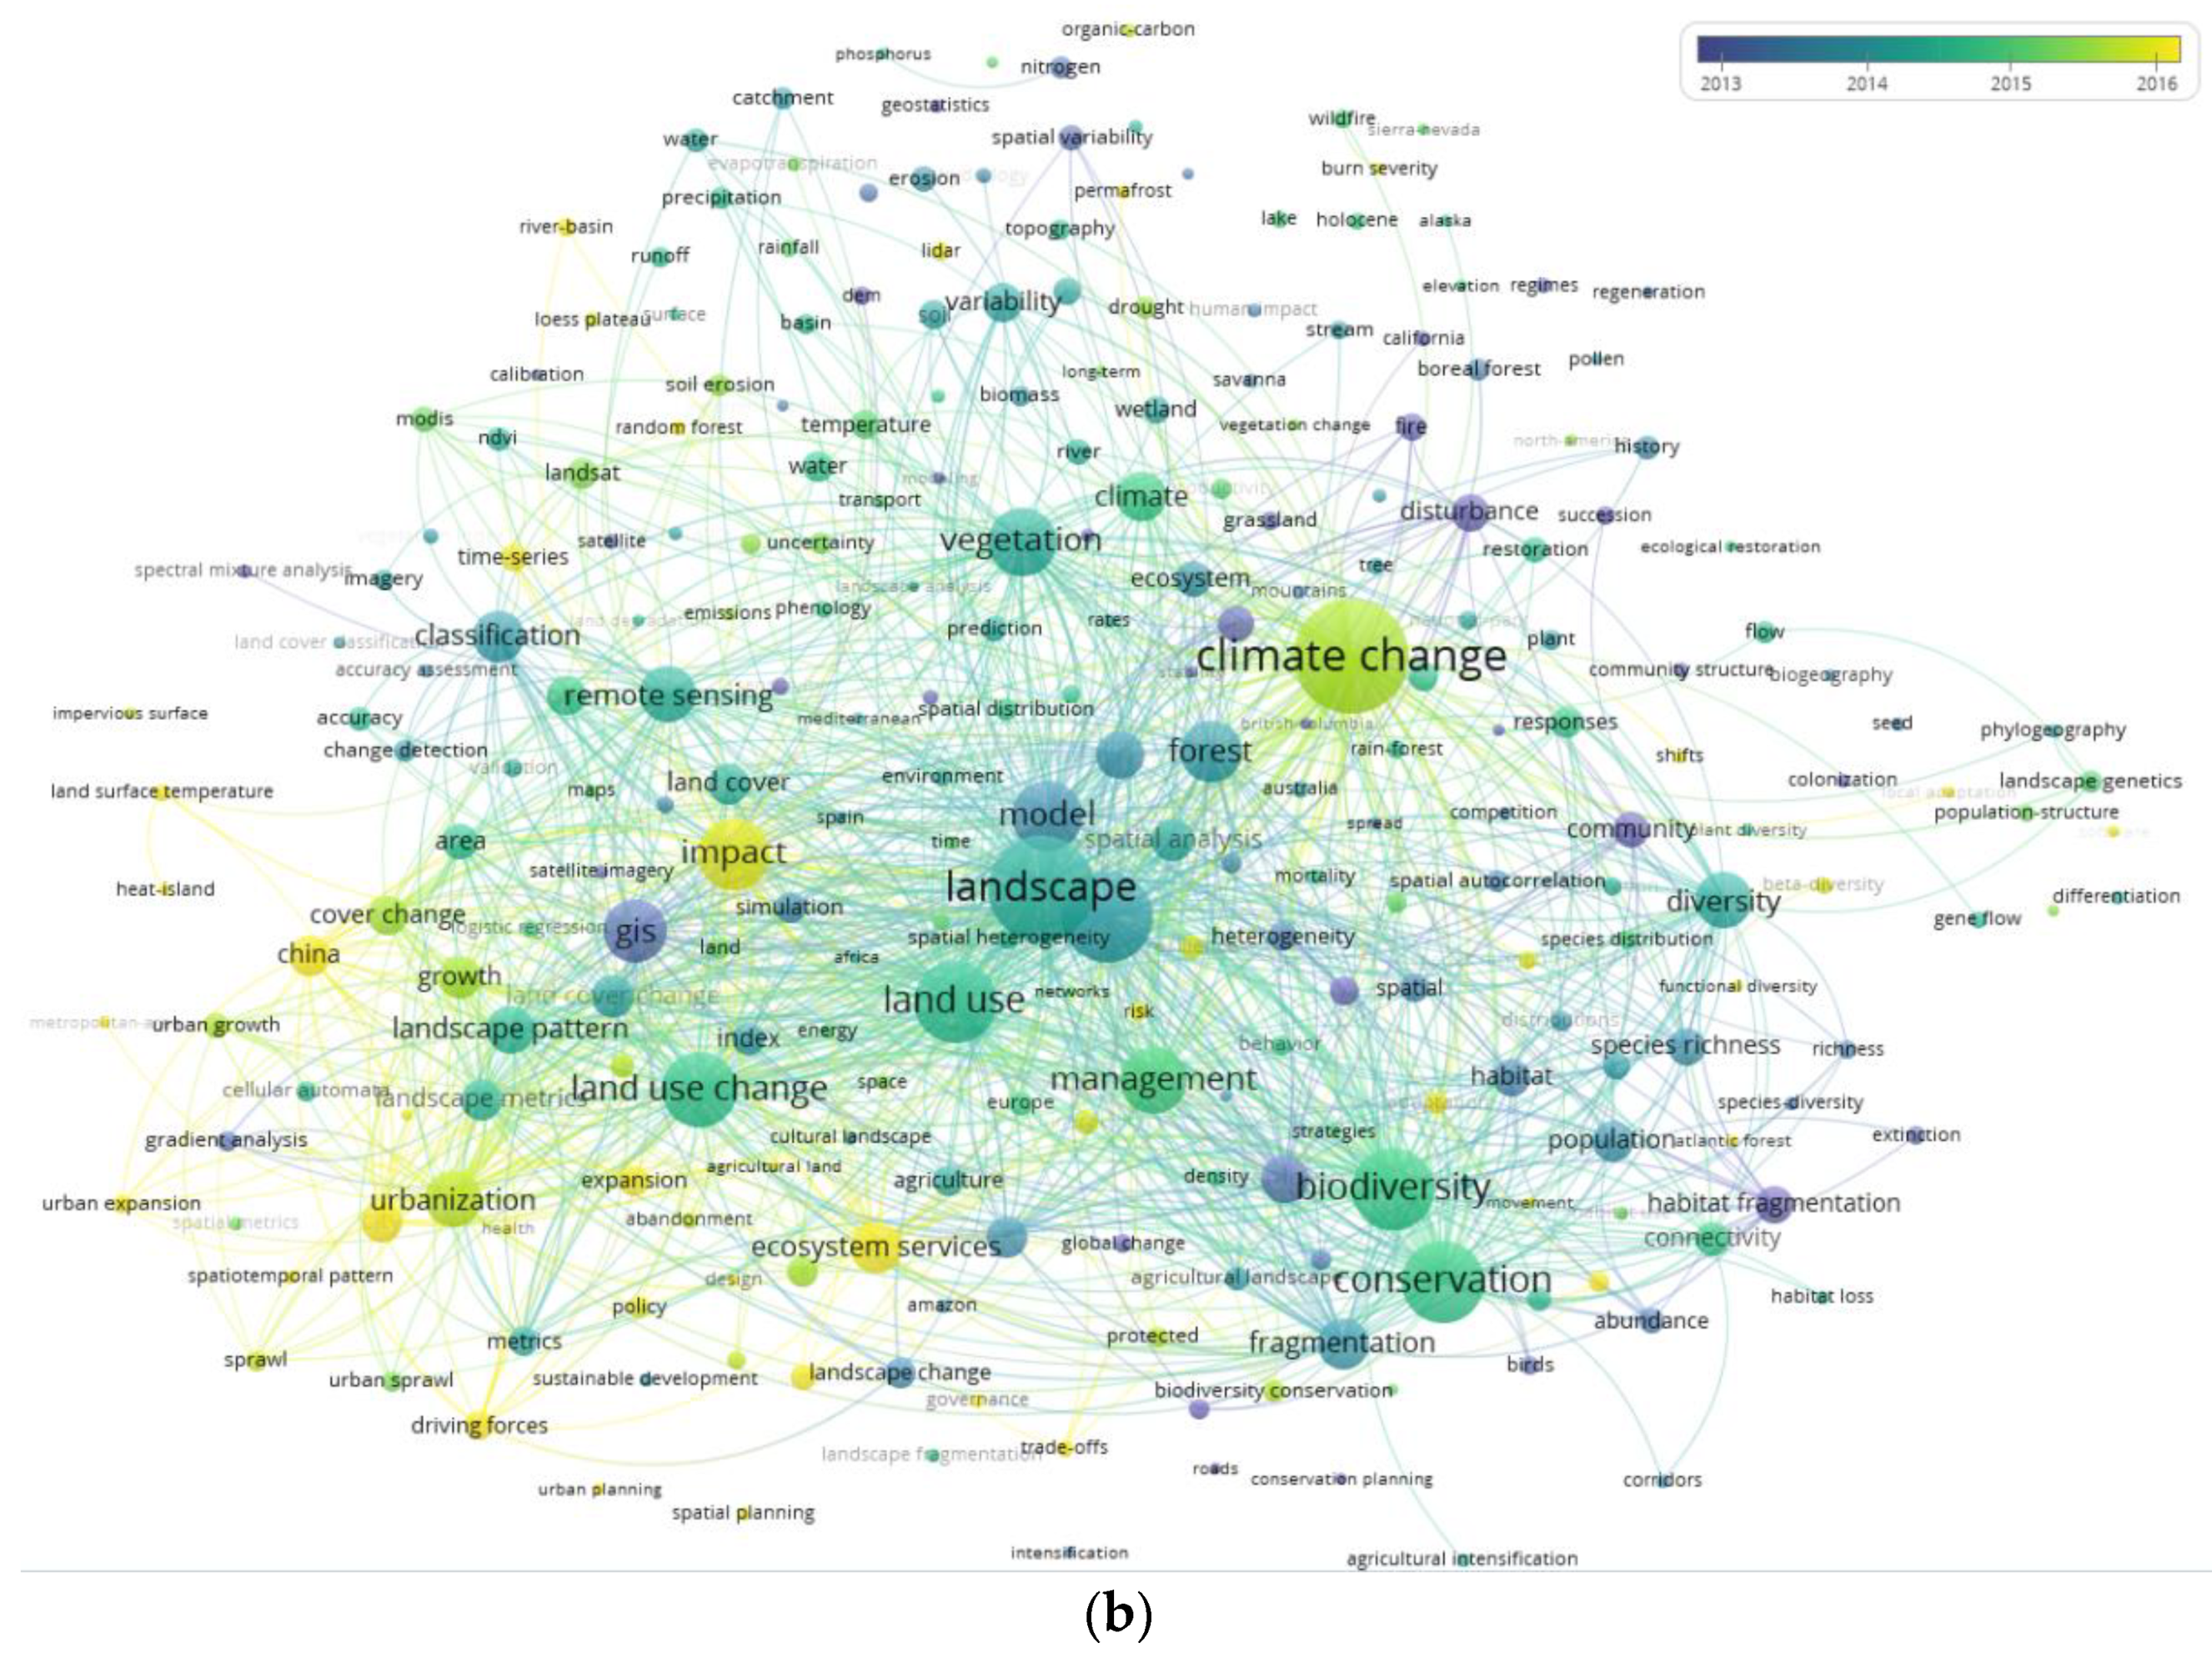
- The overlay map between keyword co-occurrences and the year when the papers of the studied bibliography were mostly cited. As in the previous maps, nodes and their sizes still represent the number of keyword occurrences, and the lines still represent the strength of co-occurrences between terms, but in this case, the colors represent the citation year.
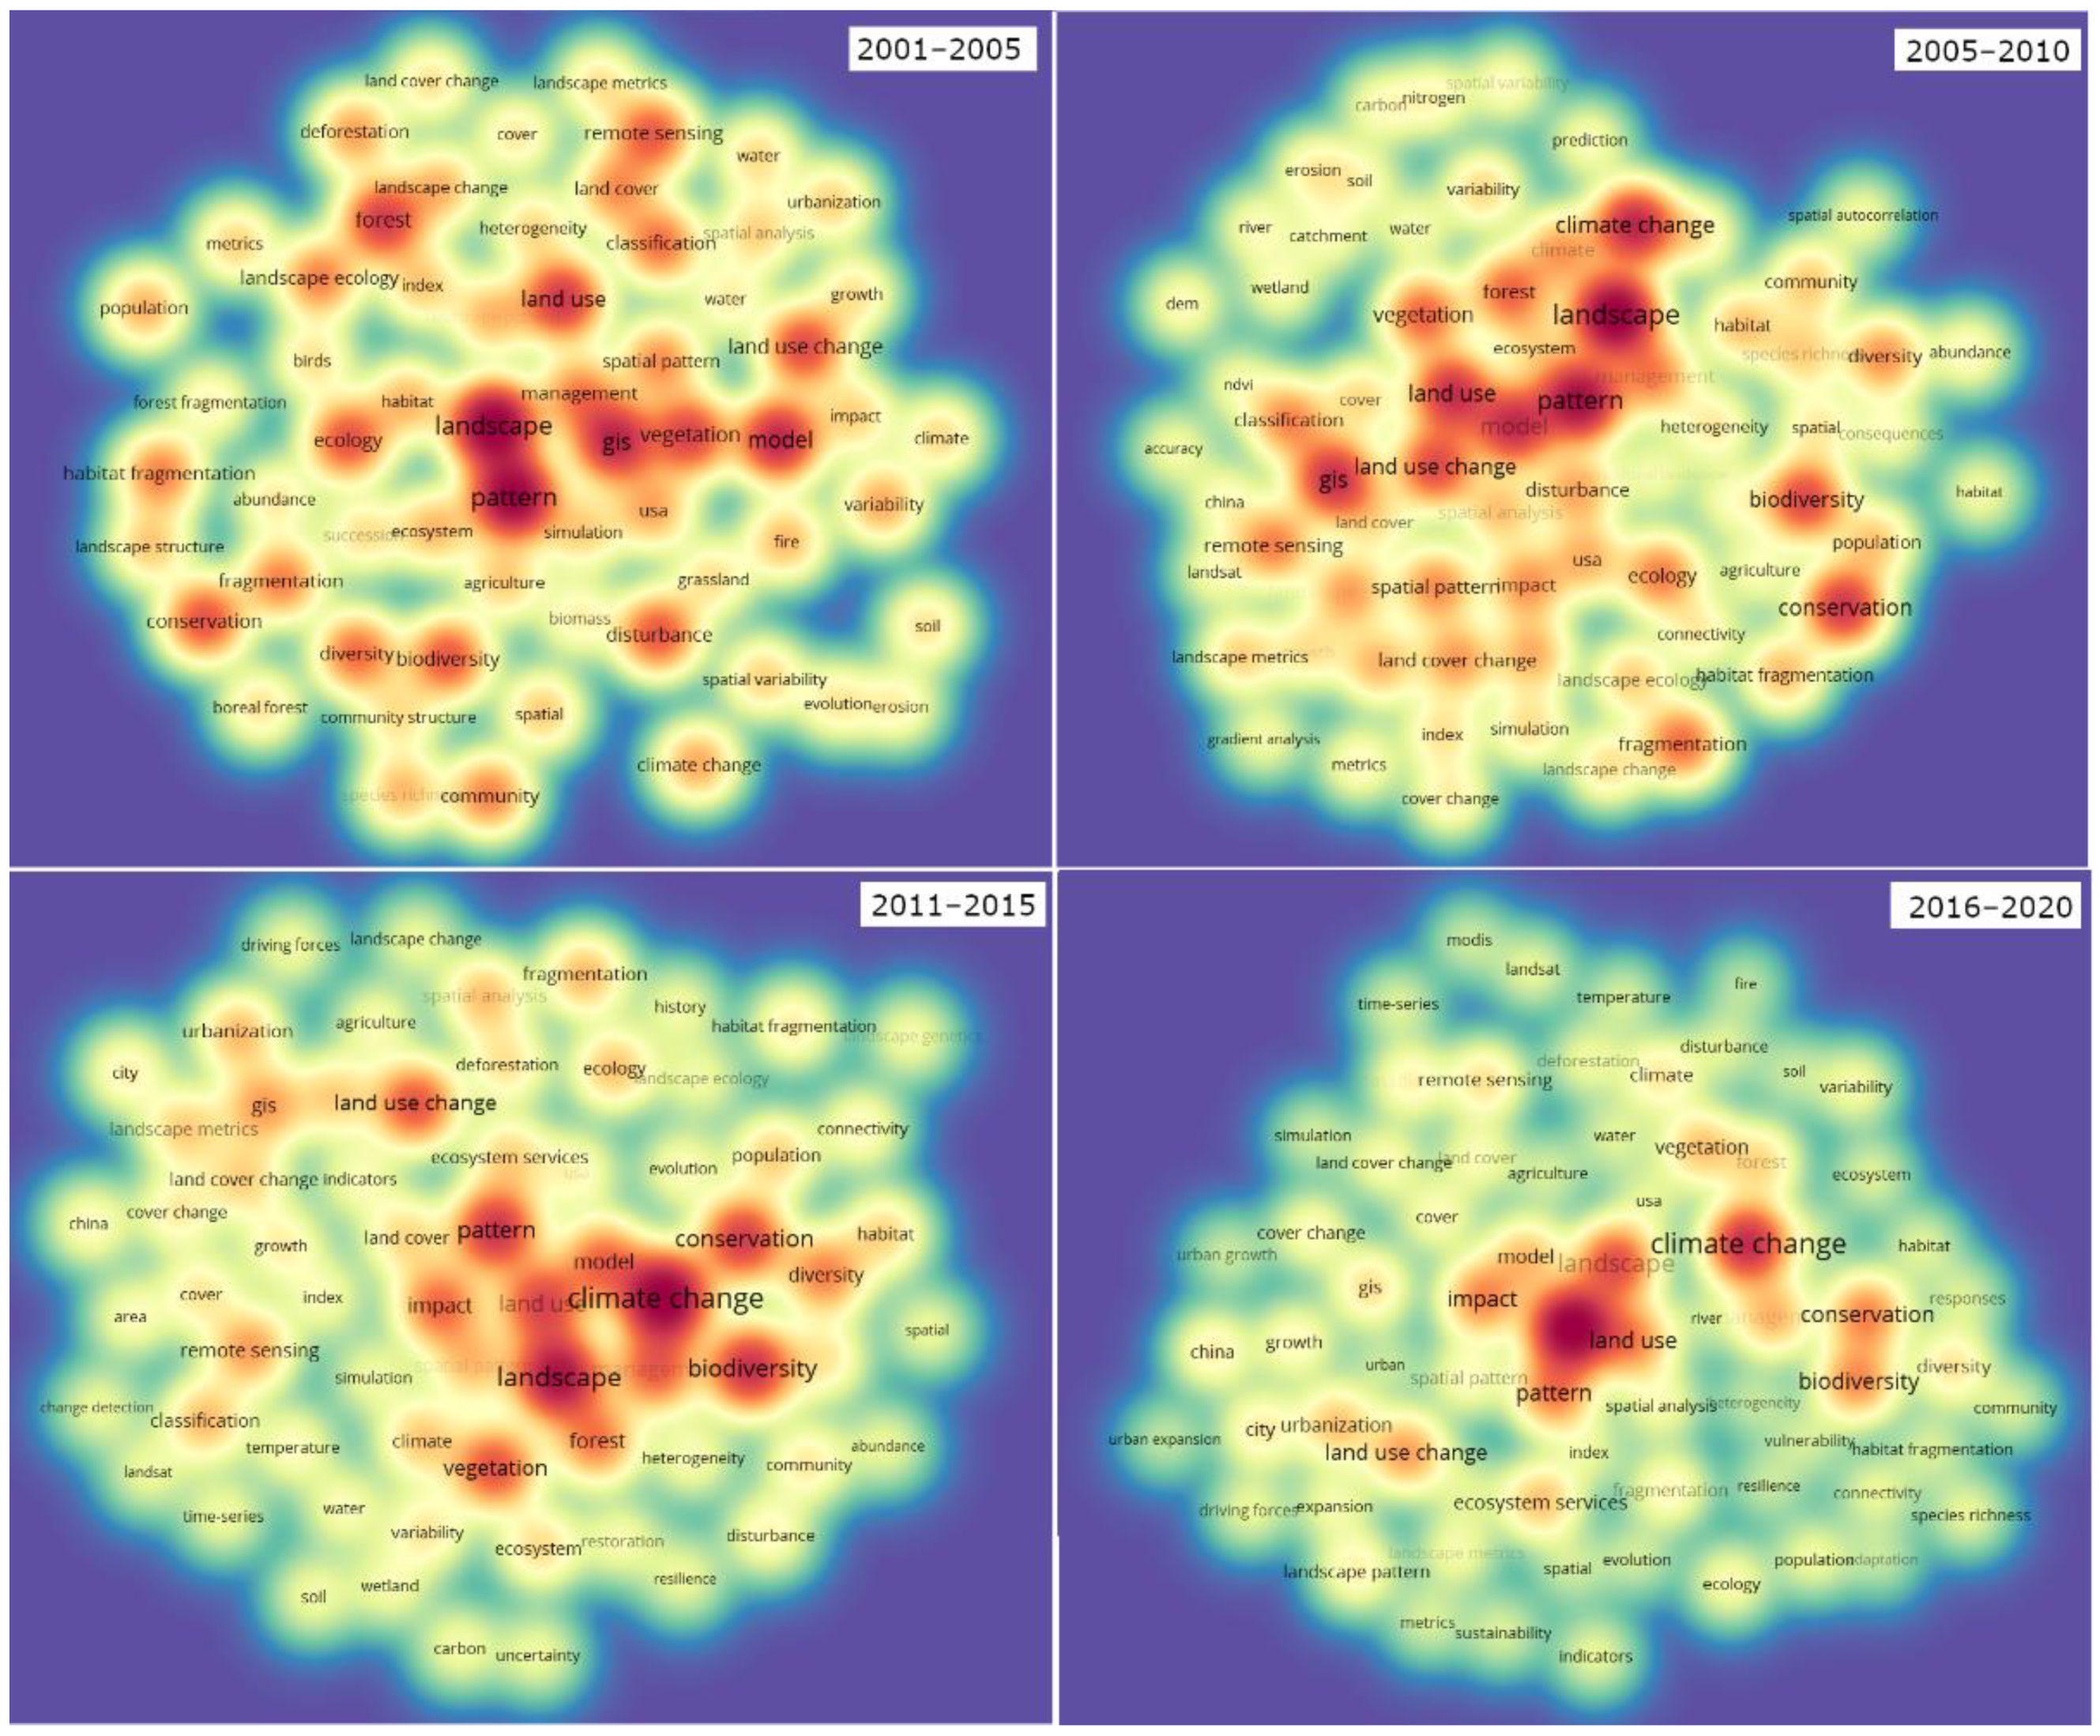
- Density visualization of the co-occurrences map. This type of graphic facilitates the reading of hot-spots and cold-spots of the keyword with a higher or lower density of co-occurrences [44].
3. Results
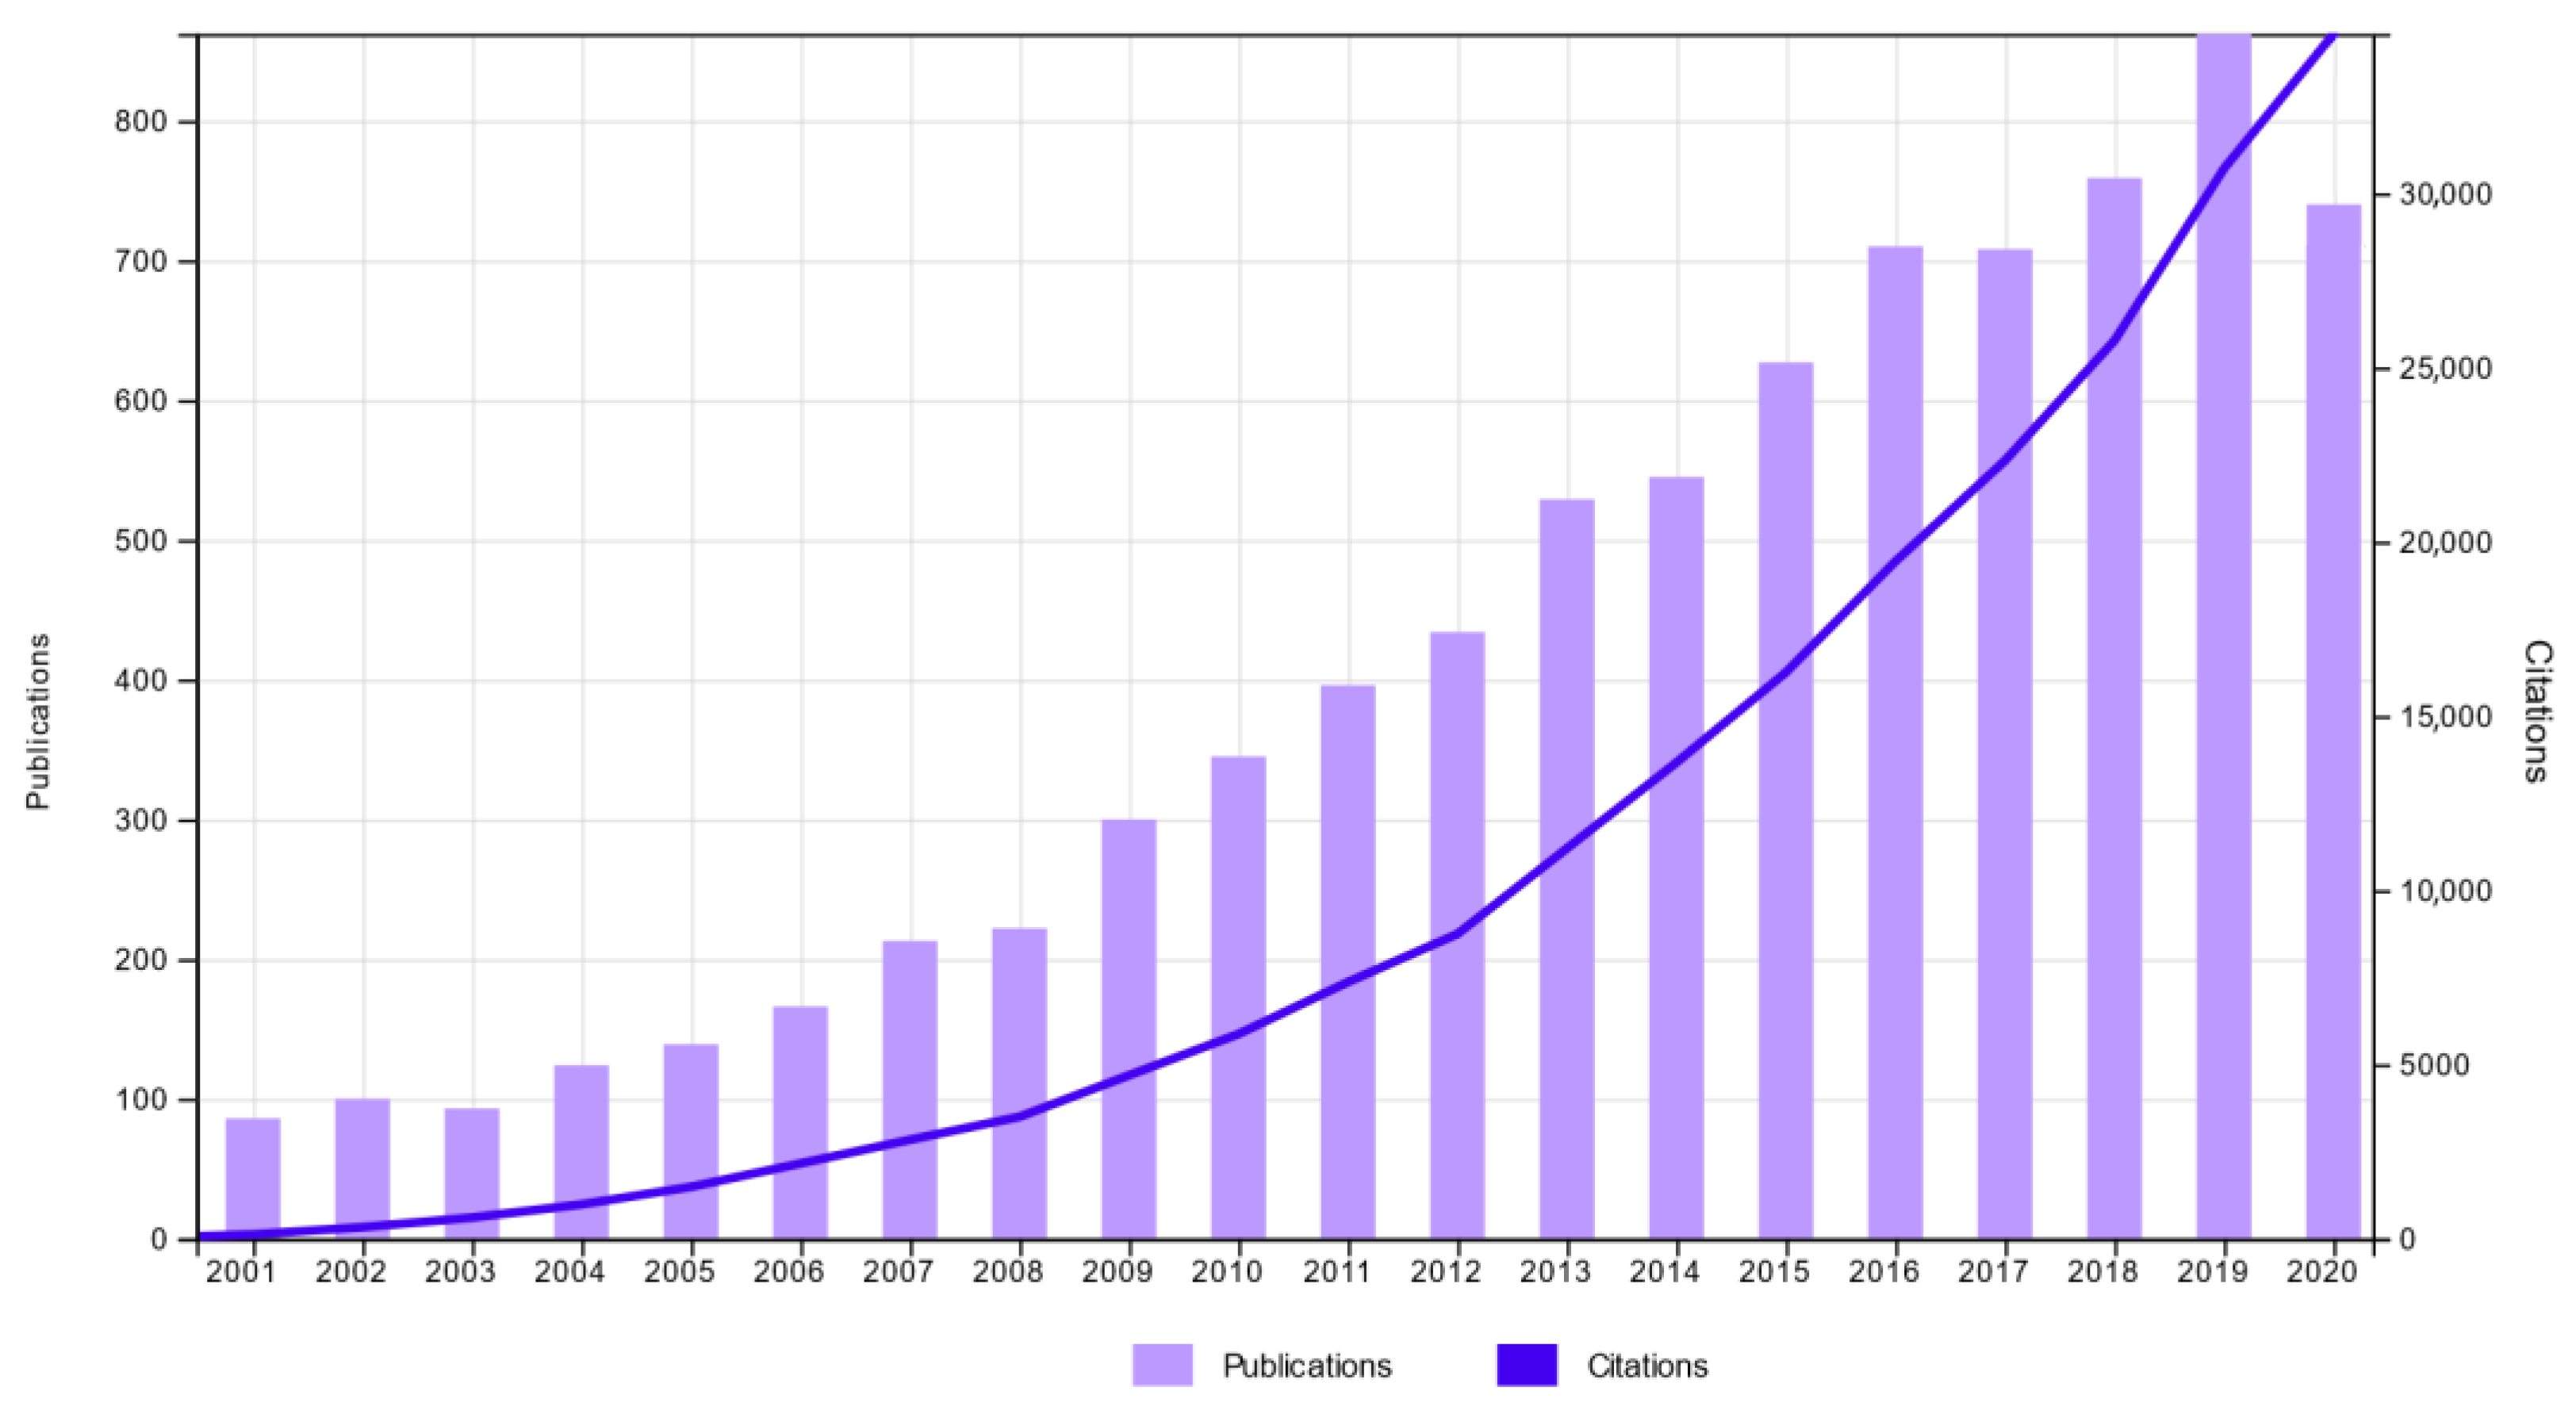
3.1. General Quantitative Results
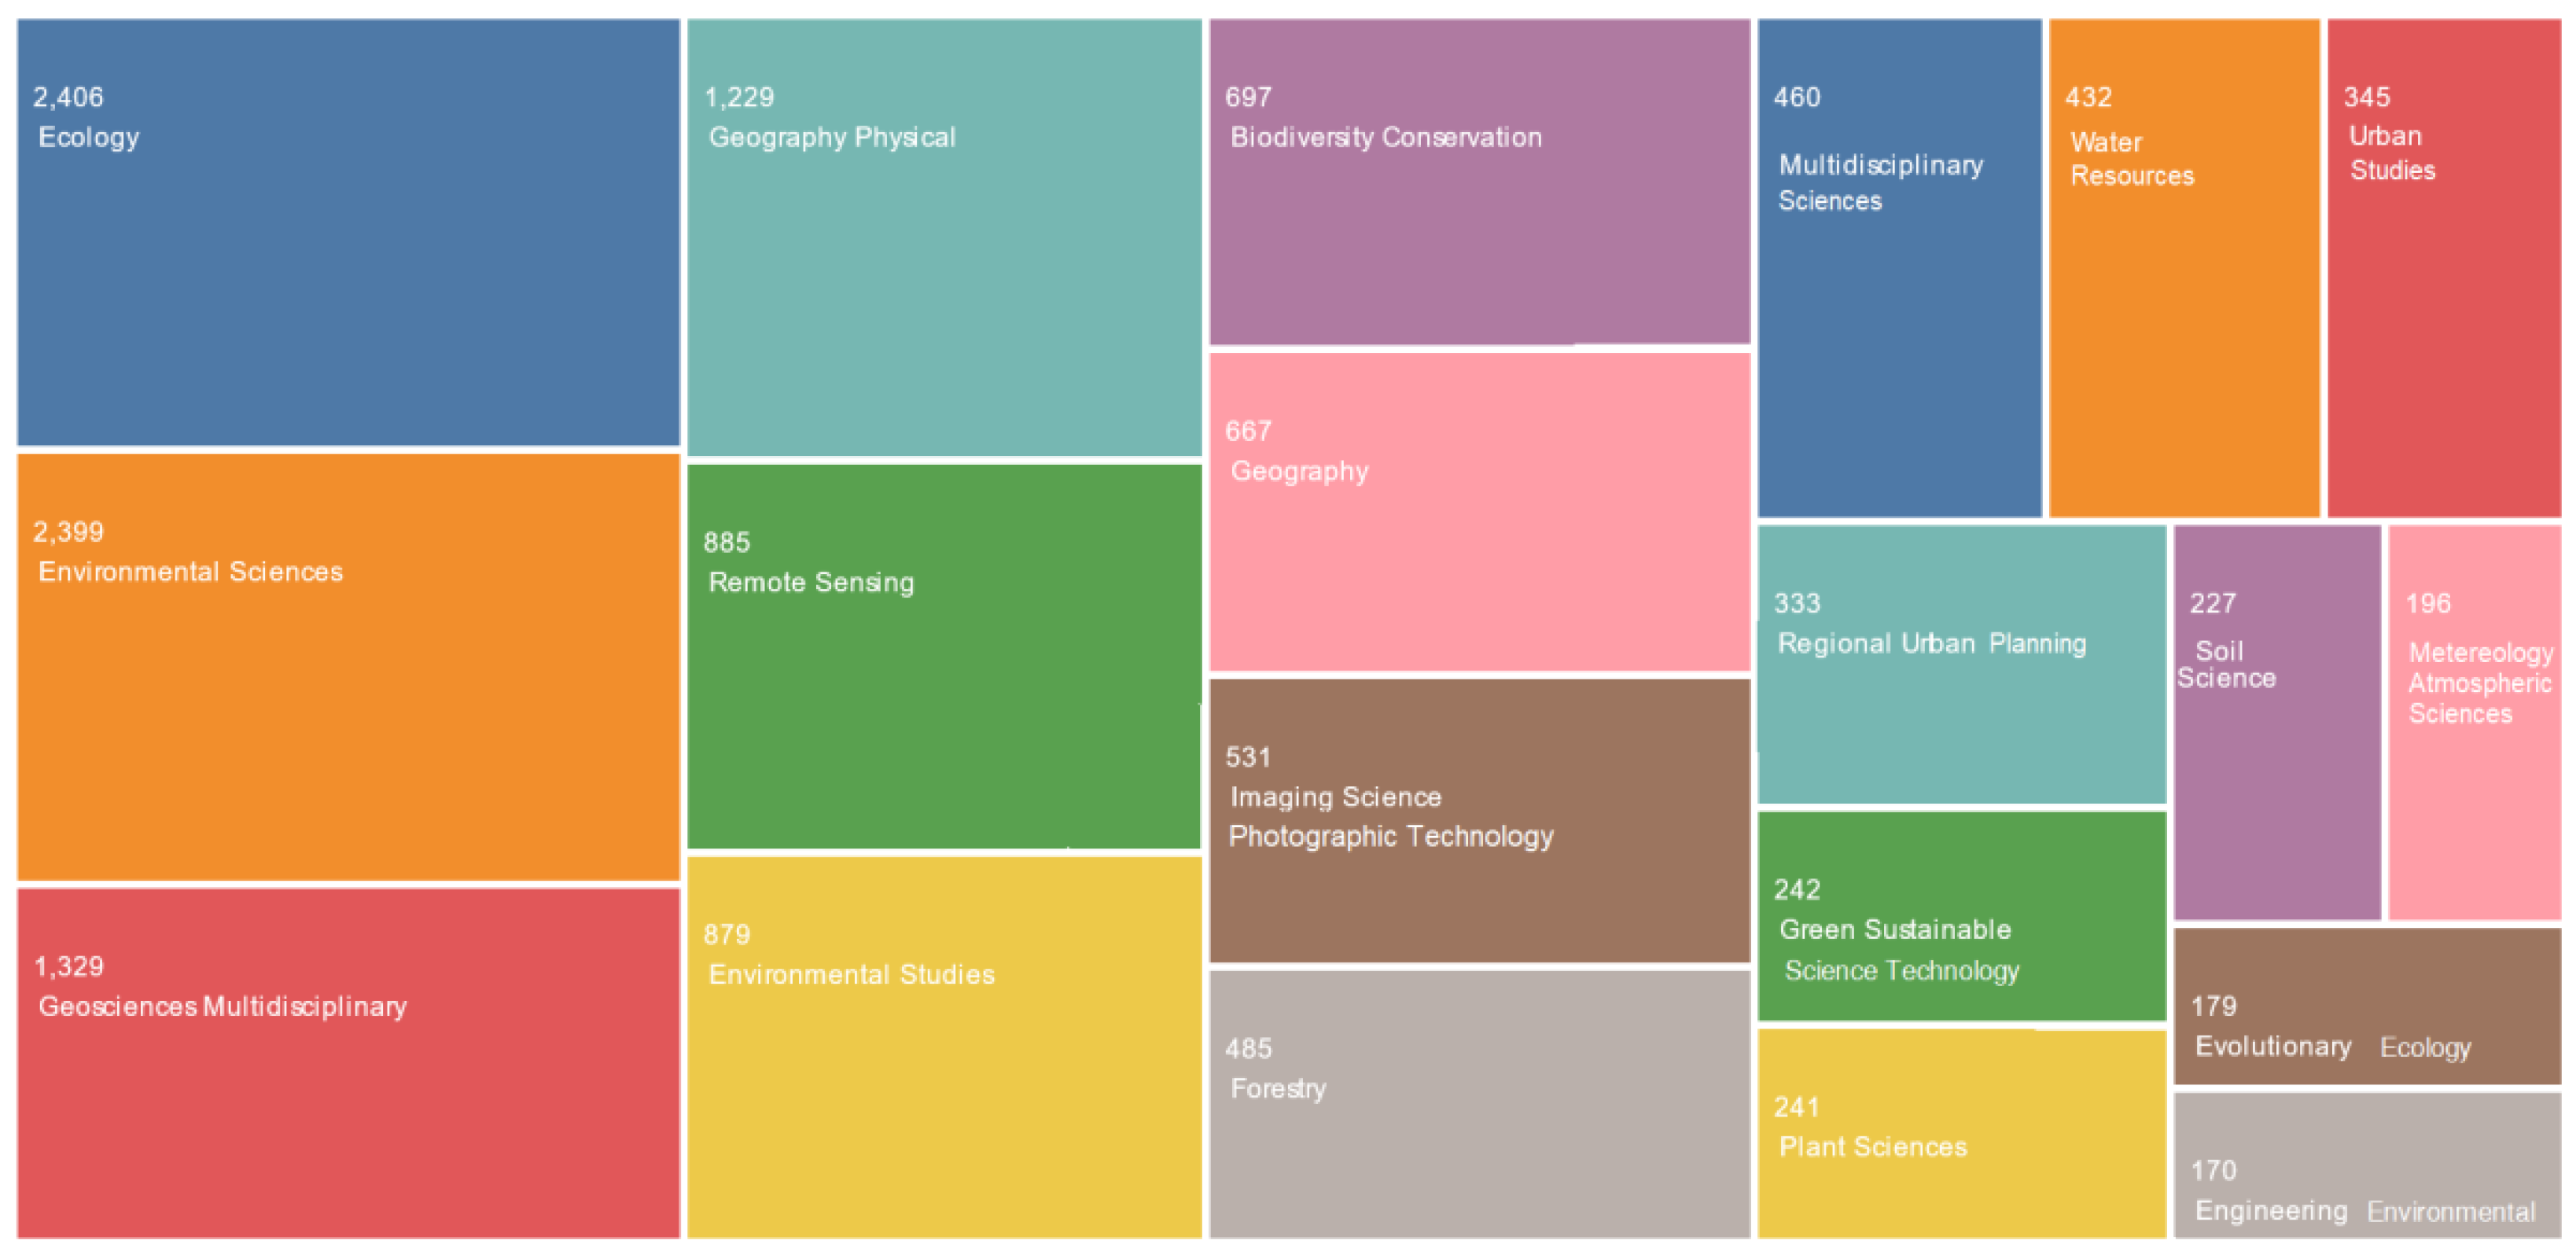
3.2. Result Heterogeneity
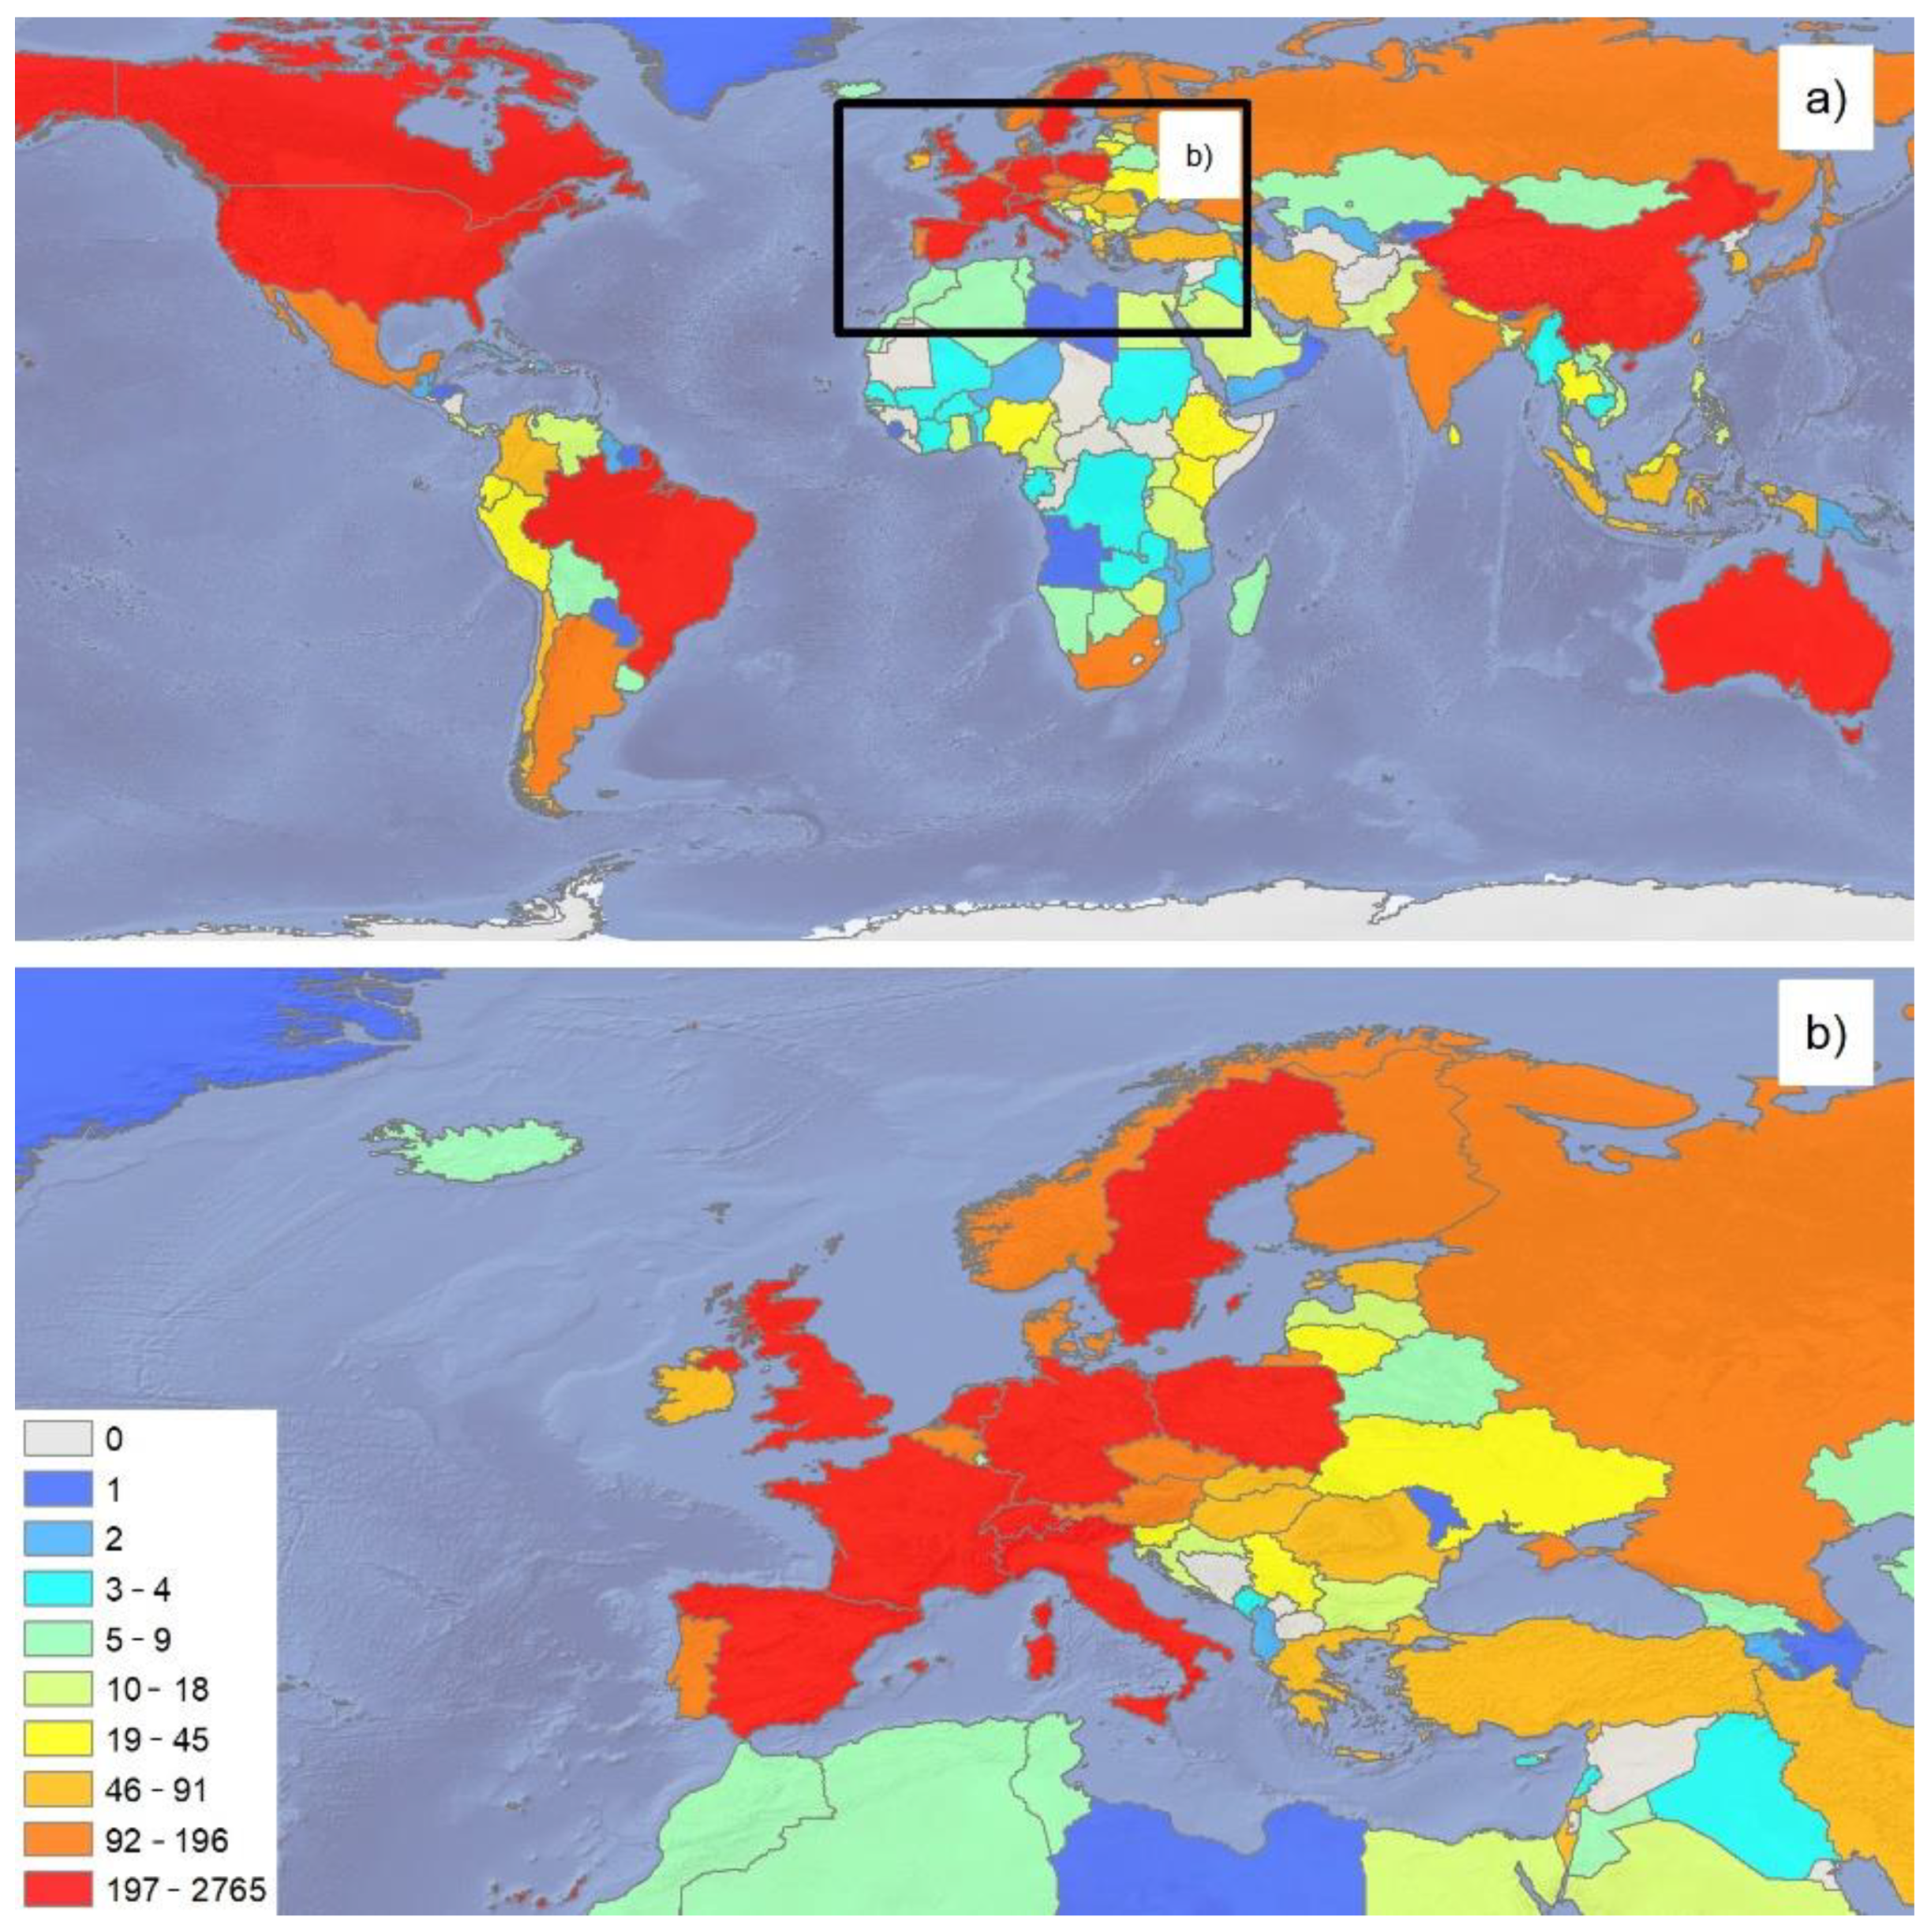
3.3. Spatial Distribution of S.A.L.C.
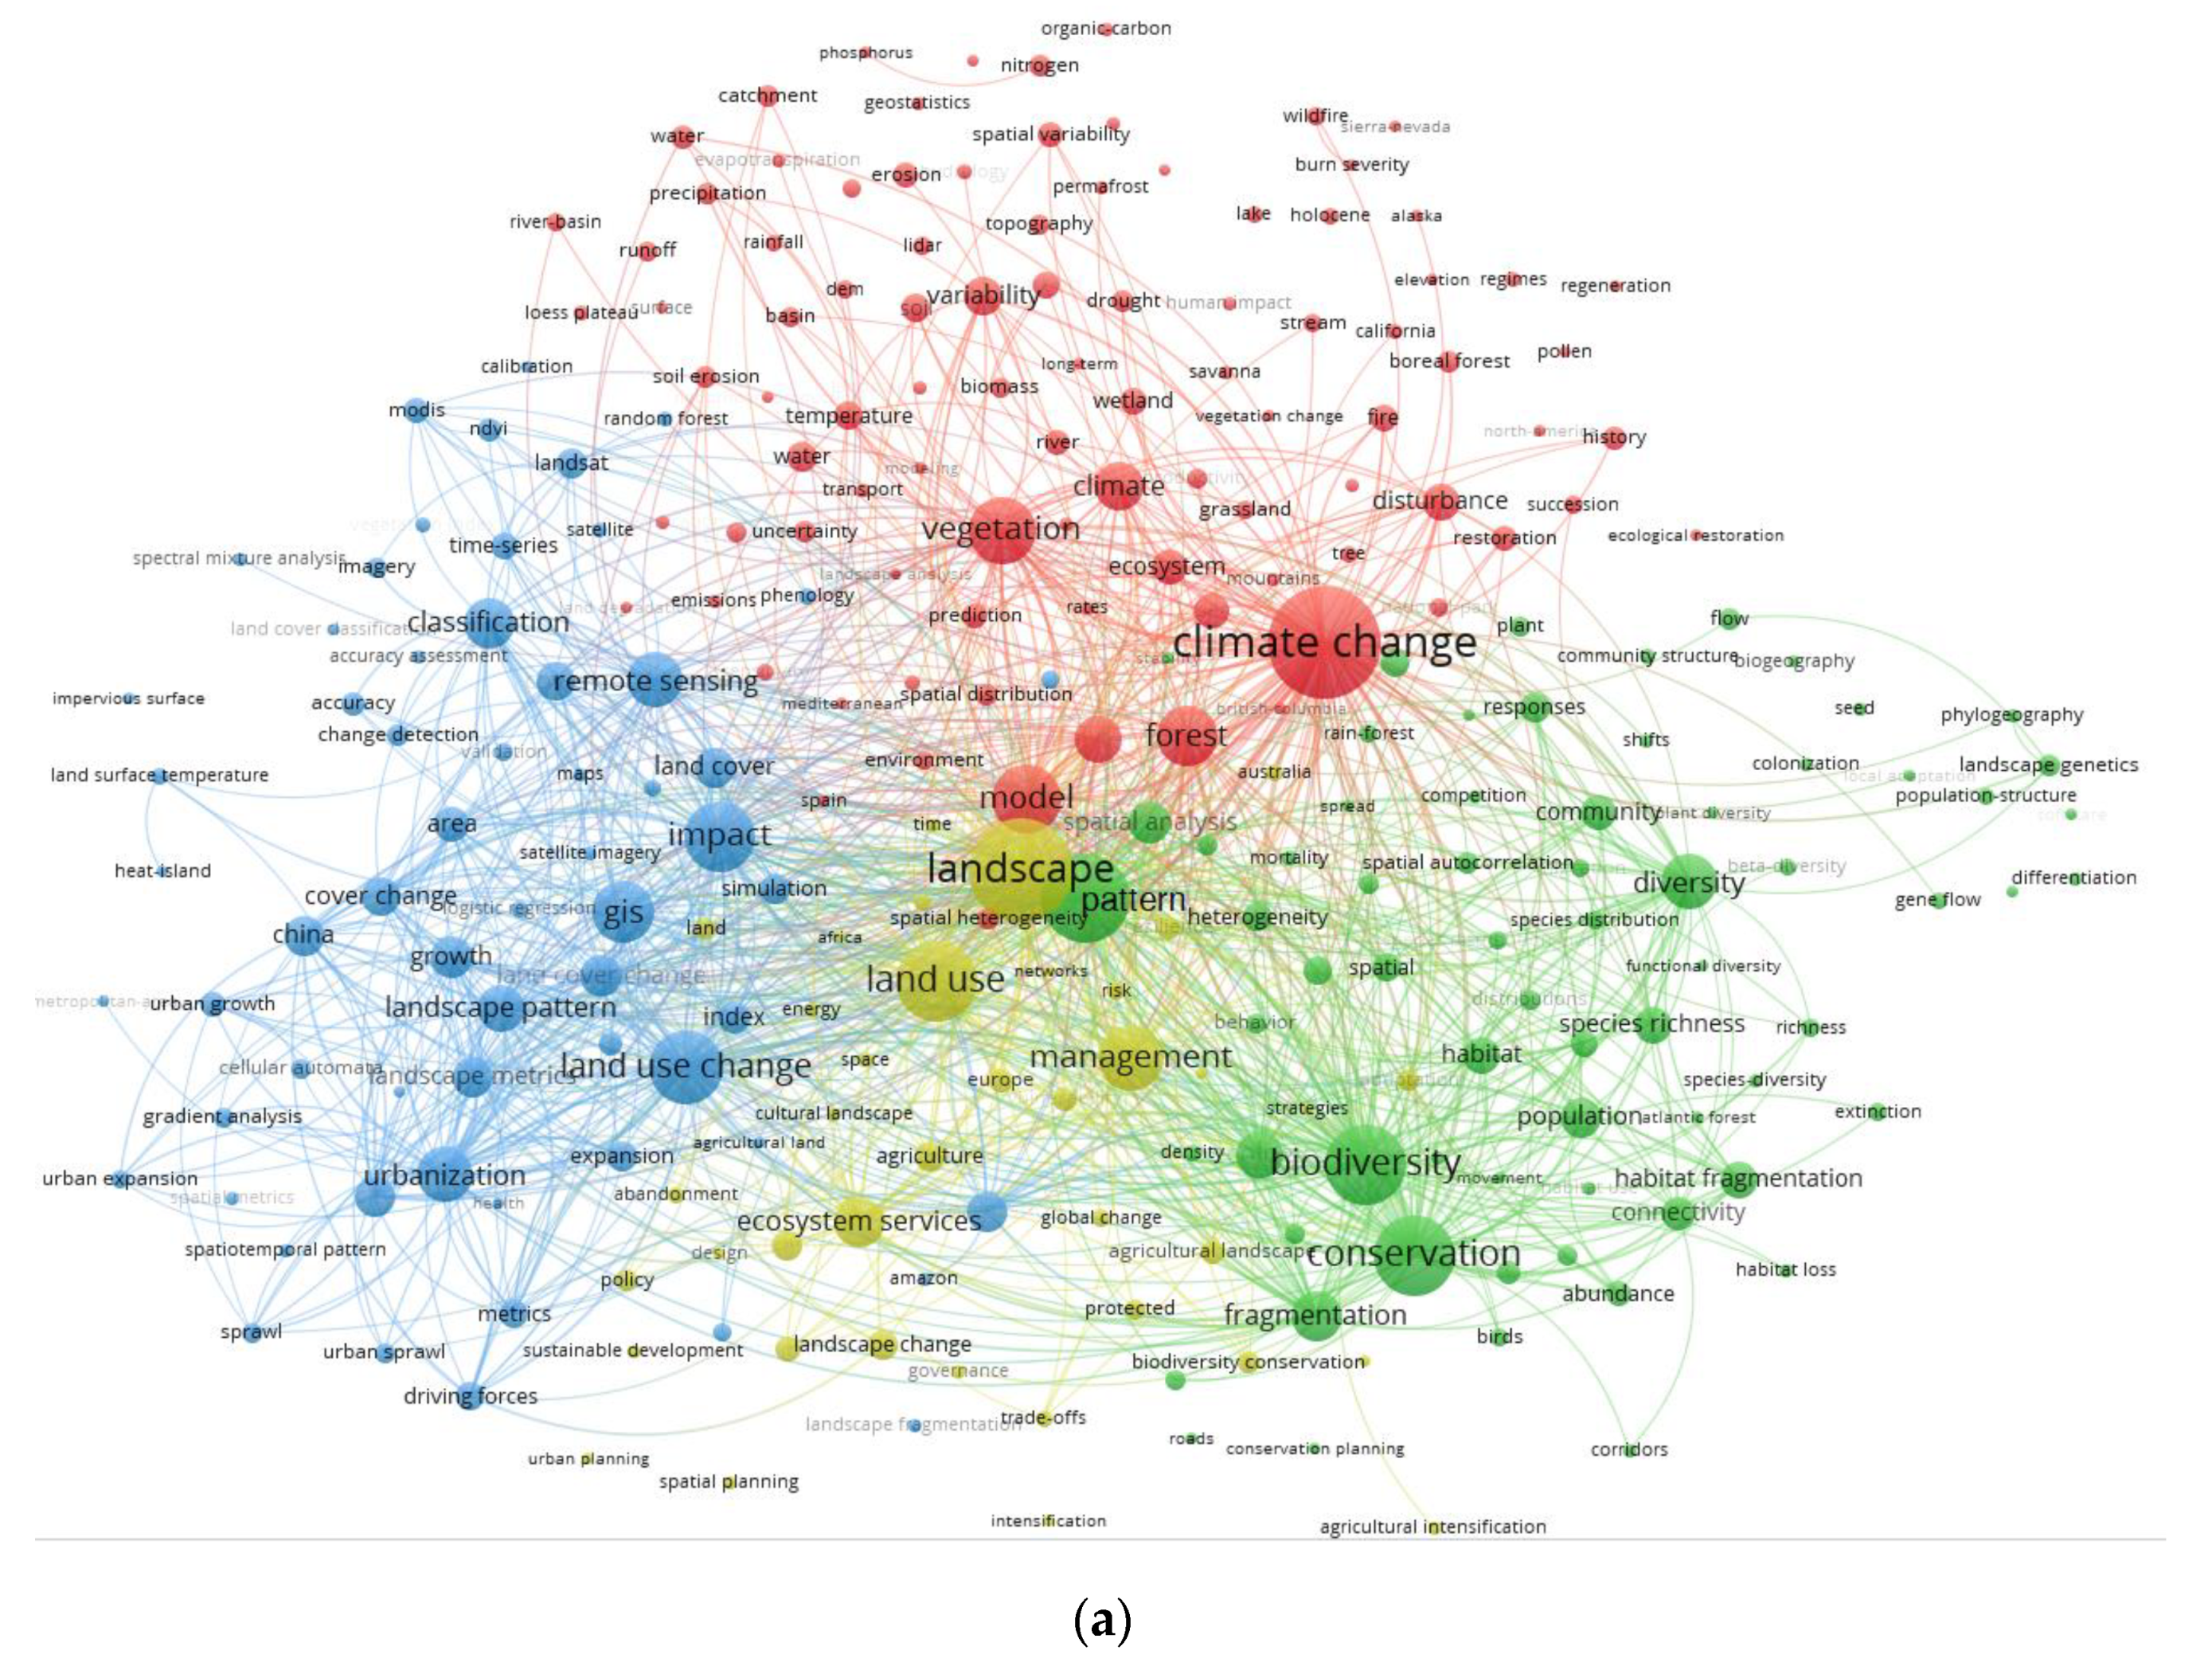
3.4. Co-Occurrence Map of Keywords of the Whole Period
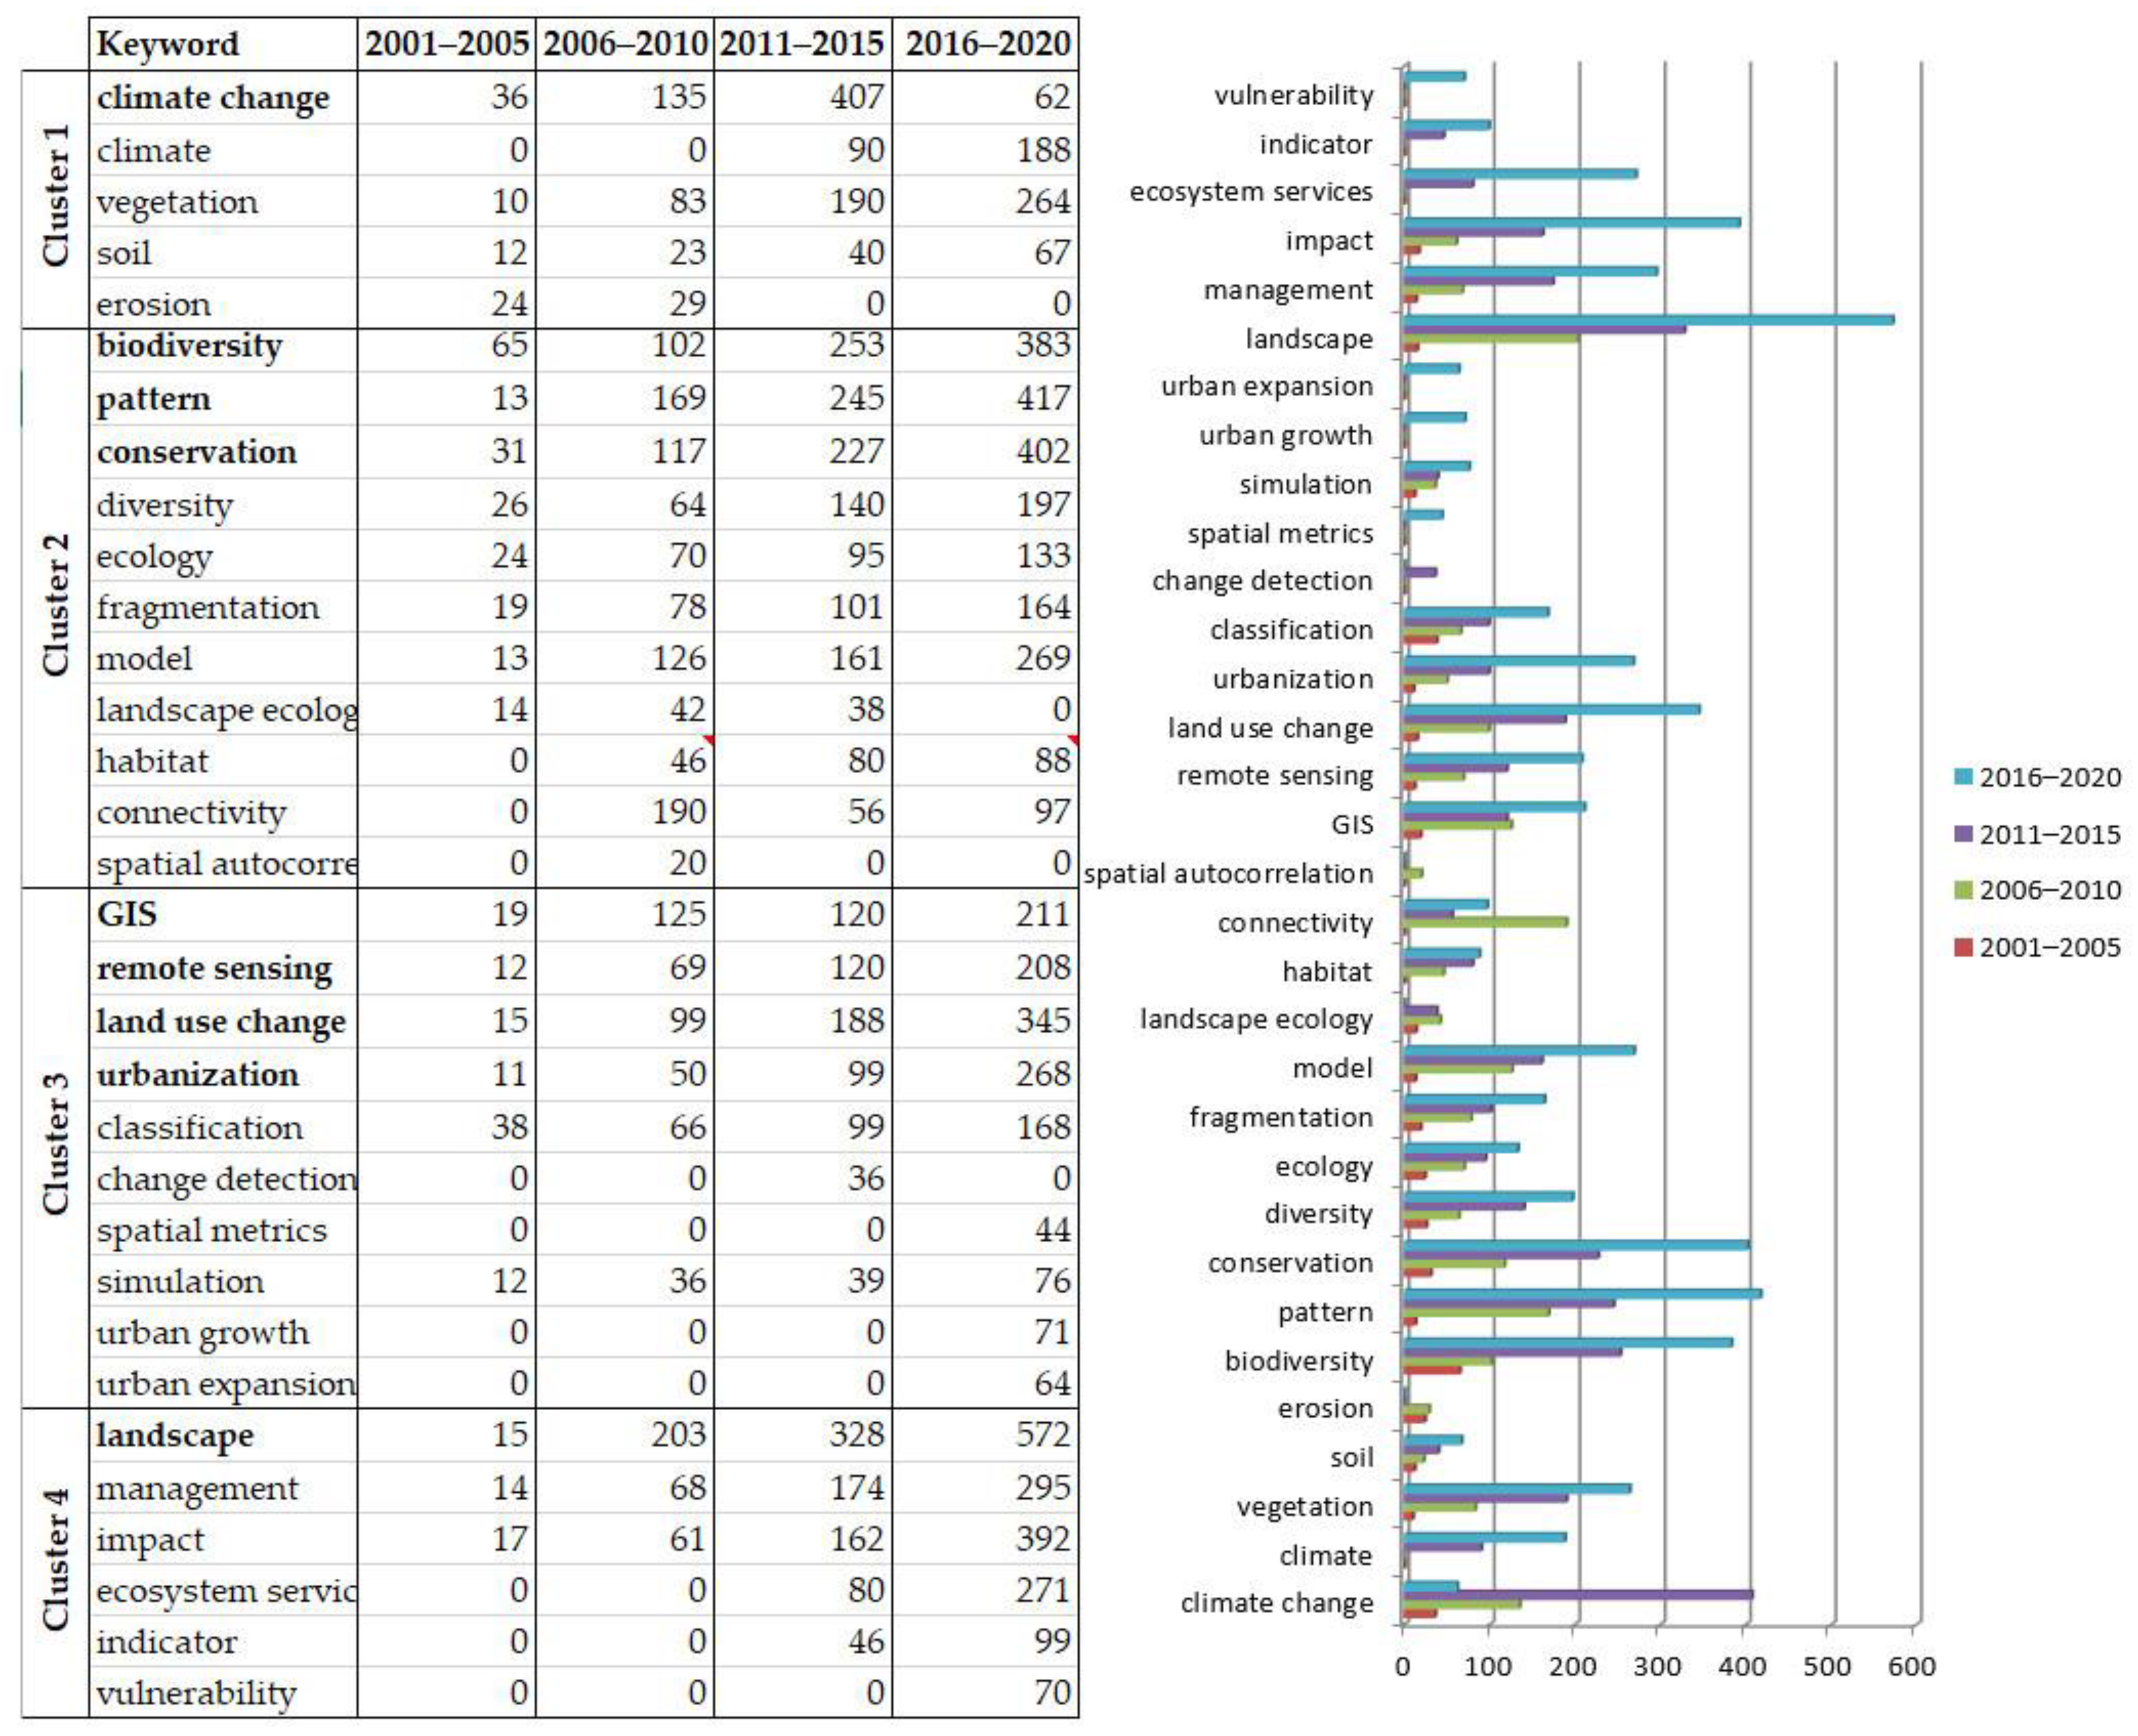
- Cluster 1 (Figure 5a, red cluster, a total of 40 items): the keyword with the most occurrences is climate change (1323). Here, secondary terms, besides the word climate (349), express the different aspects of landscape connected to climate change, from vegetation (573) to soil (146) and its erosion (97).
- Cluster 2 (Figure 5a, green cluster, a total of 69 items): the “head” or main terms are biodiversity (769 occurrences), pattern (896), and conservation (778), while minor terms are diversity (428), ecology (330), fragmentation (367), landscape ecology (152), habitat (231), connectivity (190), and landscape connectivity (86). It is interesting to note that the keyword “spatial autocorrelation” (94) was inserted in this cluster instead of the “method” cluster (the Cluster 3), even if, of course, the link with it remains through keywords GIS, land-use change, remote sensing, and, most of all, urbanization, which is strictly linked with topics such as the protection or conservation of biodiversity.
- Cluster 3 (Figure 5a, blue cluster, a total of 62 items): here it is possible to highlight two sub-clusters. The first one is prevalently a methodological one, with the main terms GIS (502) and remote sensing (427). The second one is more related to the urban and planning application fields, represented by the main words land-use change (666) and urbanization (431). Terms linked to both are representative of the types of analysis conducted and the instrument used, such as classification (359), the different names of remote sensors, change detection (104), spatial metrics (44), and simulation (165). Moreover, other secondary terms explain where these methods are applied: for urban growth studies (117) and urban expansion (79).
- Cluster 4 (Figure 5a, light green cluster, a total of 40 items): the main word is landscape (1172), while secondary terms are management (560), impact (629), ecosystem services (362), indicators (170), and vulnerability (112). As it is also possible to see from the other minor terms, it is a cluster more oriented to the evaluation of landscape resources, sustainability, and resilience.
3.5. Density Map for Interval of 5 Years
3.6. Types of Spatial Analysis
4. Discussion and Concluding Remarks
- The literature concerning climate change and the different aspects connected to it, such as the changes in vegetation and soil, grows in particular in the second decade. In spite of this, in the twenty years considered here, we observe the largest pattern in keywords and the highest number of citations;
- The more representative disciplinary areas are urban and territorial planning and ecology. There are two bigger keyword clusters, respectively, headed by land-use changes and biodiversity, conservation and patterns. Additionally, this area shows an increase in occurrences in all the analyzed periods;
- A third interesting research pattern shows that the two previously cited fields (i.e., urban and territorial planning and ecology) are not considered only as two separated sectors, but there is a correct trial to integrate them with management, impact estimation, and, most of all, with the diffusion of ecosystem services. Such a trend can be mainly observed in recent years;
- Analysis of the frequency distribution of keywords and their temporal trend seems to reveal a modification in the research focus: in particular, the prevalence of keywords such as “Remote Sensing”, GIS, and “Land Use” in the early 20th century suggests a methodological approach mainly based on visual inspection or basic GIS analysis of DEMs and satellite images. The spreading of terms such as “classification” or “simulation” and the appearance of keywords such as “cellular automation”, “artificial neural network”, or “random forest” indicate a clear modification of the research methods, which evolve toward computer-based automation or unsupervised detection of landscape patterns and changes;
- Considering the availability of algorithms and tools useful for fast and accurate analysis of landscape changes in larger areas, we argue that the disciplines/research fields such as geomorphology and the digital reconstruction of historical landscapes could have a relevant growth in the next few years. For example, similar topics can benefit from the growing availability of landscape evolution models [25,55,56] and tools for the visual analysis and reconstruction of historical landscapes [57,58].
Author Contributions
Funding
Institutional Review Board Statement
Informed Consent Statement
Data Availability Statement
Conflicts of Interest
References
- Noyons, E.C.M.; Moed, H.F.; Luwel, M. Combining mapping and citation analysis for evaluative bibliometric purposes: A bibliometric study. J. Am. Soc. Inf. Sci. 1999, 50, 115–131. [Google Scholar] [CrossRef]
- Bezak, N.; Mikoš, M.; Borelli, P.; Alewell, C.; Alvarez, P.; Alexandre, J.; Anache, A.; Baartman, J.; Ballabio, C.; Biddoccu, M.; et al. Soil erosion modelling: A bibliometric analysis. Environ. Res. 2021, 197, 111087. [Google Scholar] [CrossRef]
- Su, X.; Li, X.; Kang, Y. A Bibliometric Analysis of Research on Intangible Cultural Heritage Using CiteSpace. SAGE Open 2019, 9, 2158244019840119. [Google Scholar] [CrossRef] [Green Version]
- Niu, B.; Yuan, J.; Peng, S.; Zhang, X. Global trends in sediment-related research in earth science during 1992–2011: A bibliometric analysis. Scientometrics 2014, 98, 511–529. [Google Scholar] [CrossRef]
- Gariano, S.L.; Guzzetti, F. Landslides in a changing climate. Earth-Sci. Rev. 2016, 162, 227–252. [Google Scholar] [CrossRef] [Green Version]
- Reichenbach, P.; Rossi, M.; Malamud, B.D.; Mihir, M.; Guzetti, F. A review of statistically-based landslide susceptibility models. Earth-Sci. Rev. 2018, 180, 60–91. [Google Scholar] [CrossRef]
- Frey, S.; Fisher, J.T.; Burton, A.C. Investigating animal activity patterns and temporal niche partitioning using camera-trap data: Challenges and opportunities. Remote Sens. Ecol. Conserv. 2017, 3, 123–132. [Google Scholar] [CrossRef]
- Kay, S.L.; Fischer, J.W.; Monaghan, A.J.; Beasley, J.C.; Boughton, R.; Campbell, T.A.; Cooper, S.M.; Ditchkoff, S.S.; Hartley, S.B.; Kilgo, J.C.; et al. Quantifying drivers of wild pig movement across multiple spatial and temporal scales. Mov. Ecol. 2017, 5, 14. [Google Scholar] [CrossRef] [Green Version]
- Lin, L.; Li, M.; Chen, H.; Lai, X.; Zhu, H.; Wang, H. Integrating landscape planning and stream quality management in mountainous watersheds: A targeted ecological planning approach for the characteristic landscapes. Ecol. Indic. 2020, 117, 106557. [Google Scholar] [CrossRef]
- Brock, P.M.; Fornace, K.M.; Grigg, M.J.; Anstey, N.M.; William, T.; Cox, J.; Drakeley, C.J.; Ferguson, H.M.; Kao, R.R. Predictive analysis across spatial scales links zoonotic malaria to deforestation. Proc. R. Soc. B Biol. Sci. 2019, 286, 20182351. [Google Scholar] [CrossRef] [Green Version]
- Lin, Y.; Hu, X.; Zheng, X.; Hou, X.; Zhang, Z.; Zhou, X.; Qiu, R.; Lin, J. Spatial variations in the relationships between road network and landscape ecological risks in the highest forest coverage region of China. Ecol. Indic. 2019, 96, 392–403. [Google Scholar] [CrossRef]
- Zhou, W.Q.; Zhang, S.; Yu, W.J.; Wang, J.; Wang, Q. Effects of Urban Expansion on Forest Loss and Fragmentation in Six Megaregions, China. Remote Sens. 2017, 9, 991. [Google Scholar] [CrossRef] [Green Version]
- Garcia-Nieto, A.P.; Geijzendorffer, I.R.; Baro, F.; Roche, P.K.; Bondeau, A.; Cramer, W. Impacts of urbanization around Mediterranean cities: Changes in ecosystem service supply. Ecol. Indic. 2018, 91, 589–606. [Google Scholar] [CrossRef] [Green Version]
- Wang, J.; Zhou, W.; Pickett, S.T.A.; Yu, W.; Li, W. A multiscale analysis of urbanization effects on ecosystem services supply in an urban megaregion. Sci. Total Environ. 2019, 662, 824–833. [Google Scholar] [CrossRef] [PubMed]
- Gioia, D.; Amodio, A.M.; Maggio, A.; Sabia, C.A. Impact of Land Use Changes on the Erosion Processes of a Degraded Rural Landscape: An Analysis Based on High-Resolution DEMs, Historical Images, and Soil Erosion Models. Land 2021, 10, 673. [Google Scholar] [CrossRef]
- Nampak, H.; Pradhan, B.; Rizeei, H.M.; Park, H.J. Assessment of land cover and land use change impact on soil loss in a tropical catchment by using multitemporal SPOT-5 satellite images and Revised Universal Soil Loss Equation model. Land Degrad. Dev. 2018, 29, 3440–3455. [Google Scholar] [CrossRef]
- Fortugno, D.; Boix-Fayos, C.; Bombino, G.; Denisi, P.; Quinonero Rubio, J.M.; Tamburino, V.; Zema, D.A. Adjustments in channel morphology due to land-use changes and check dam installation in mountain torrents of Calabria (southern Italy). Earth Surf. Process. Landf. 2017, 42, 2469–2483. [Google Scholar] [CrossRef]
- Han, S.H. Thematic map construction of erosion and deposition in rivers using GIS-based DEM comparison technique. J. Korean Soc. Surv. Geod. Photogramm. Cartogr. 2016, 34, 153–159. [Google Scholar] [CrossRef]
- Hugenholtz, C.H.; Whitehead, K.; Brown, O.W.; Barchyn, T.E.; Moornam, B.J.; LeClair, A.; Riddell, K.; Hamilton, T. Geomorphological mapping with a small unmanned aircraft system (sUAS): Feature detection and accuracy assessment of a photogrammetrically-derived digital terrain model. Geomorphology 2013, 194, 16–24. [Google Scholar] [CrossRef] [Green Version]
- Anders, N.S.; Seijmonsbergen, A.C.; Bouten, W. Geomorphological change detection using object-based feature extraction from multioral lidar data. IEEE Geosci. Remote Sens. Lett. 2013, 10, 1587–1591. [Google Scholar] [CrossRef] [Green Version]
- Conforti, M.; Mercuri, M.; Borrelli, L. Morphological changes detection of a large earthflow using archived images, lidar-derived dtm, and uav-based remote sensing. Remote Sens. 2021, 13, 120. [Google Scholar] [CrossRef]
- Coulthard, T.J.; van de Wiel, M.J. Modelling long term basin scale sediment connectivity, driven by spatial land use changes. Geomorphology 2017, 277, 265–281. [Google Scholar] [CrossRef]
- Ramirez, J.A.; Zischg, A.P.; Schürmann, S.; Zimmerman, M.; Weingartner, R.; Coulthard, T.; Keiler, M. Modeling the geomorphic response to early river engineering works using CAESAR-Lisflood. Anthropocene 2020, 32, 100266. [Google Scholar] [CrossRef]
- Gioia, D.; Schiattarella, M. Modeling Short-Term Landscape Modification and Sedimentary Budget Induced by Dam Removal: Insights from LEM Application. Appl. Sci. 2020, 10, 7697. [Google Scholar] [CrossRef]
- Gioia, D.; Lazzari, M. Testing the Prediction Ability of LEM-Derived Sedimentary Budget in an Upland Catchment of the Southern Apennines, Italy: A Source to Sink Approach. Water 2019, 11, 991. [Google Scholar] [CrossRef] [Green Version]
- Broto, V.C. Energy landscapes and urban trajectories towards sustainability. Energy Policy 2017, 108, 755–764. [Google Scholar] [CrossRef]
- Cumming, G.S.; Morrison, T.H.; Hughes, T.P. New Directions for Understanding the Spatial Resilience of Social-Ecological Systems. Ecosystems 2017, 20, 649–664. [Google Scholar] [CrossRef]
- Zhou, W.; Pickett, S.T.A.; Cadenasso, M.L. Shifting concepts of urban spatial heterogeneity and their implications for sustainability. Landsc. Ecol. 2017, 32, 15–30. [Google Scholar] [CrossRef]
- Ackerly, D.D.; Loarie, S.R.; Cornwell, W.K.; Weiss, S.B.; Hamilton, H.; Branciforte, R.; Kraft, N.J.B. The geography of climate change: Implications for conservation biogeography. Divers. Distrib. 2010, 16, 476–487. [Google Scholar] [CrossRef]
- Post, E.; Stenseth, N.C. Climatic variability, plant phenology, and northern ungulates. Ecology 1999, 80, 1322–1339. [Google Scholar] [CrossRef]
- Sork, V.L.; Aitken, S.N.; Dyer, R.J.; Eckert, A.J.; Legendre, P.; Neale, D.B. Putting the landscape into the genomics of trees: Approaches for understanding local adaptation and population responses to changing climate. Tree Genet. Genomes 2013, 9, 901–911. [Google Scholar] [CrossRef]
- Weng, Q.; Yang, S. Urban Air Pollution Patterns, Land Use, and Thermal Landscape: An Examination of the Linkage Using GIS. Environ. Monit. Assess. 2006, 117, 463–489. [Google Scholar] [CrossRef]
- Liu, Y.; Wu, J.; Yu, D. Characterizing spatiotemporal patterns of air pollution in China: A multiscale landscape approach. Ecol. Indic. 2017, 76, 344–356. [Google Scholar] [CrossRef] [Green Version]
- Volk, M.; Hirschfeld, J.; Dehnhardt, A.; Schmidt, G.; Bohn, C.; Liersch, S.; Gassman, P.W. Integrated ecological-economic modelling of water pollution abatement management options in the Upper Ems River Basin. Ecol. Econ. 2008, 66, 66–76. [Google Scholar] [CrossRef]
- Kantner, J. The Archaeology of Regions: From Discrete Analytical Toolkit to Ubiquitous Spatial Perspective. J. Archaeol. Res. 2007, 16, 37–81. [Google Scholar] [CrossRef]
- Banerjee, R.; Srivastava, P.K. Reconstruction of contested landscape: Detecting land cover transformation hosting cultural heritage sites from Central India using remote sensing. Land Use Policy 2013, 34, 193–203. [Google Scholar] [CrossRef]
- Fyfe, R.M. Bronze Age landscape dynamics: Spatially detailed pollen analysis from a ceremonial complex. J. Archaeol. Sci. 2012, 39, 2764–2773. [Google Scholar] [CrossRef]
- Conedera, M.; Tinner, W.; Neff, C.; Meurer, M.; Dickens, A.F.; Krebs, P. Reconstructing past fire regimes: Methods, applications, and relevance to fire management and conservation. Quat. Sci. Rev. 2009, 28, 555–576. [Google Scholar] [CrossRef]
- Keane, R.E.; Cary, G.J.; Davies, I.D.; Flannigan, M.; Gardner, R.H.; Lavorel, S.; Lenihan, J.M.; Li, C.; Rupp, T. A classification of landscape fire succession models: Spatial simulations of fire and vegetation dynamics. Ecol. Model. 2004, 179, 3–27. [Google Scholar] [CrossRef]
- Niklasson, M.; Granstrom, A. Numbers and sizes of fires: Long-term spatially explicit fire history in a Swedish boreal landscape. Ecology 2000, 81, 1484–1499. [Google Scholar] [CrossRef]
- Seto, K.C.; Fragkias, M. Quantifying spatiotemporal patterns of urban land-use change in four cities of China with time series landscape metrics. Landsc. Ecol. 2005, 20, 871–888. [Google Scholar] [CrossRef]
- Parker, D.C.; Manson, S.; Janssen, M.A.; Hoffmann, M.J.; Deadman, P. Multi-Agent Systems for the Simulation of Land-Use and Land-Cover Change: A Review. Ann. Assoc. Am. Geogr. 2003, 93, 314–337. [Google Scholar] [CrossRef] [Green Version]
- Pranckutė, R. Web of Science (WoS) and Scopus: The Titans of Bibliographic Information in Today’s Academic World. Publications 2021, 9, 12. [Google Scholar] [CrossRef]
- van Eck, N.J.; Waltman, L. Software survey: VOSviewer, a computer program for bibliometric mapping. Scientometrics 2010, 84, 523–538. [Google Scholar] [CrossRef] [Green Version]
- Small, H. Visualizing science by citation mapping. J. Am. Soc. Inf. Sci. 1999, 50, 799–813. [Google Scholar] [CrossRef]
- Morris, S.A.; Van Der Veer Martens, B. Mapping research specialties. Annu. Rev. Inf. Sci. Technol. 2008, 42, 213–295. [Google Scholar] [CrossRef]
- Börner, K.; Chen, C.; Boyack, K.W. Visualizing knowledge domains. Annu. Rev. Inf. Sci. Technol. 2003, 37, 179–255. [Google Scholar] [CrossRef]
- Cobo, M.J.; López-Herrera, A.G.; Herrera-Viedma, E.; Herrera, F. SciMAT: A new science mapping analysis software tool. J. Am. Soc. Inf. Sci. Technol. 2012, 63, 1609–1630. [Google Scholar] [CrossRef]
- Chen, C. CiteSpace II: Detecting and visualizing emerging trends and transient patterns in scientific literature. J. Am. Soc. Inf. Sci. Technol. 2006, 57, 359–377. [Google Scholar] [CrossRef] [Green Version]
- Cobo, M.J.; López-Herrera, A.G.; Herrera-Viedma, E.; Herrera, F. Science mapping software tools: Review, analysis, and cooperative study among tools. J. Am. Soc. Inf. Sci. Technol. 2011, 62, 1382–1402. [Google Scholar] [CrossRef]
- Moral-Muñoz, J.A.; López-Herrera, A.G.; Herrera-Viedma, E.; Cobo, M.J. Science mapping analysis software tools: A review. In Springer Handbook of Science and Technology Indicators; Springer: Cham, Switzerland, 2019; pp. 159–185. [Google Scholar]
- Gizzi, F.T.; Proto, M.; Potenza, M.R. The Basilicata region (Southern Italy): A natural and ‘human-built’ open-air laboratory for manifold studies. Research trends over the last 24 years (1994–2017). Geomat. Nat. Hazards Risk 2019, 10, 433–464. [Google Scholar] [CrossRef]
- Odenwald, S.F. A citation study of earth science projects in citizen science. PLoS ONE 2020, 15, e0235265. [Google Scholar] [CrossRef] [PubMed]
- Agapiou, A.; Lysandrou, V. Remote sensing archaeology: Tracking and mapping evolution in European scientific literature from 1999 to 2015. J. Archaeol. Sci. Rep. 2015, 4, 192–200. [Google Scholar] [CrossRef]
- Poeppl, R.; Coulthard, T.; Keesstra, S.; Keiler, M. Modeling the impact of dam removal on channel evolution and sediment delivery in a multiple dam setting. Int. J. Sediment Res. 2019, 34, 537–549. [Google Scholar] [CrossRef]
- Hancock, G.; Coulthard, T.; Martinez, C.; Kalma, J. An evaluation of landscape evolution models to simulate decadal and centennial scale soil erosion in grassland catchments. J. Hydrol. 2011, 398, 171–183. [Google Scholar] [CrossRef]
- Danese, M.; Biscione, M.; Coluzzi, R.; Lasaponara, R.; Murgante, B.; Masini, N. An integrated methodology for medieval landscape reconstruction: The case study of Monte Serico. In Proceedings of the International Conference on Computational Science and Its Applications, Seoul, Korea, 29 June–2 July 2009; Springer: Berlin/Heidelberg, Germany, 2009; pp. 320–340. [Google Scholar]
- Roubis, D.; Sogliani, F.; Gabellone, F.; Danese, M.; Gnesi, D. Archaeological Landscapes through GIS (Cost Surface Analysis) and Virtual Reality, A case study on the monastic site of Jure Vetere (Calabria—Italy). In Proceedings of the 36th CAA Conference—On the Road to Reconstructing the Past. Computer Applications and Quantitative Methods in Archaeology, Budapest, Hungary, 2–6 April 2008. [Google Scholar]


| Keyword | Occ.1 | Keyword | Occ. |
|---|---|---|---|
| 01 classification | 359 | 26 agent-based modeling | 34 |
| 02 simulation | 205 | 27 statistical analysis | 34 |
| 03 indicators | 170 | 28 autocorrelation | 33 |
| 04 metrics | 156 | 29 aerial photography | 32 |
| 05 cellular automata | 113 | 30 pattern analysis | 32 |
| 06 change detection | 104 | 31 tool | 32 |
| 07 spatial autocorrelation | 103 | 32 hot spot analysis | 31 |
| 08 gradient analysis | 84 | 33 leaf index | 31 |
| 09 species distribution model | 82 | 34 geographically weighted regression | 30 |
| 10 regression | 80 | 35 machine learning | 29 |
| 11 DEM | 72 | 36 segmentation | 29 |
| 12 map | 71 | 37 network analysis | 28 |
| 13 density | 70 | 38 inference | 27 |
| 14 logistic regression | 67 | 39 cluster analysis | 26 |
| 15 random forest | 65 | 40 distribution model | 26 |
| 16 sensitivity analysis | 62 | 41 intensity | 25 |
| 17 vegetation index | 60 | 42 fractal | 24 |
| 18 geostatistics | 51 | 43 neural network | 23 |
| 19 image analysis | 45 | 44 r-package | 23 |
| 20 spectral mixture analysis | 44 | 45 spatial statistical analysis | 23 |
| 21 land cover classification | 40 | 46 fragstats | 22 |
| 22 graph theory | 37 | 47 photogrammetry | 22 |
| 23 Markov chain | 36 | 48 spatial prediction | 22 |
| 24 object-based classification | 36 | 49 time series analysis | 22 |
| 25 pca | 35 | 50 swat | 21 |
Publisher’s Note: MDPI stays neutral with regard to jurisdictional claims in published maps and institutional affiliations. |
© 2021 by the authors. Licensee MDPI, Basel, Switzerland. This article is an open access article distributed under the terms and conditions of the Creative Commons Attribution (CC BY) license (https://creativecommons.org/licenses/by/4.0/).
Share and Cite
Danese, M.; Gioia, D. Spatial Analysis for Landscape Changes: A Bibliometric Review. Appl. Sci. 2021, 11, 10078. https://doi.org/10.3390/app112110078
Danese M, Gioia D. Spatial Analysis for Landscape Changes: A Bibliometric Review. Applied Sciences. 2021; 11(21):10078. https://doi.org/10.3390/app112110078
Chicago/Turabian StyleDanese, Maria, and Dario Gioia. 2021. "Spatial Analysis for Landscape Changes: A Bibliometric Review" Applied Sciences 11, no. 21: 10078. https://doi.org/10.3390/app112110078
APA StyleDanese, M., & Gioia, D. (2021). Spatial Analysis for Landscape Changes: A Bibliometric Review. Applied Sciences, 11(21), 10078. https://doi.org/10.3390/app112110078