1. Introduction
The number of patients requiring hospitalization increased considerably as the COVID-19 pandemic spread across the world. This increased medical staff workloads dramatically, leading to increased distress [
1]. Most inpatients are treated with intravenous (IV) infusion. Infusion conditions should be checked once or twice per hour to ensure that they are stable [
2]. This is because abnormal IV infusion can cause severe complications, such as infiltration, hematoma, air embolism, and phlebitis [
3]. Meanwhile, an administration error rate in the range of 19–27% has been reported [
4]. In hospitals, small errors can lead to severe patient outcomes. A report published by The National Confidential Enquiry into Perioperative Deaths highlighted the significance of IV fluid monitoring, noting the deaths of numerous hospitalized patients due to excessive or inadequate infusion of fluid [
5]. Therefore, it is crucial to monitor every patient’s IV infusion rate and residual IV fluid to help both the medical staff and patients. Accordingly, many systems have been developed to monitor IV fluid infusion.
Methods for monitoring IV fluid infusion can be divided into two types. The first type involves counting every drop in the drip chamber using a photosensor, and the second type involves assessing the weight loss of the IV fluid using a load cell. First, an infrared (IR) emitter and receiver are used to detect each drop [
6,
7]. However, some drops may be missed due to reception sensitivity and external interferences. A similar method has been proposed in conjunction with the use of a light-emitting diode (LED) and a photoresistor. However, as normal LEDs emit light in the visible spectrum, external lights can cause interference. Second, ultrasonic sound reflection is used to monitor the drip’s flow rate [
8]. However, additional transducers with low accessibility should be built in for this method. In addition, ultrasound attenuation depends on air temperature, specifically in closed chambers, and could yield unpredictable results. Third, a load cell is used to measure the loss of IV fluid [
9,
10]. In this way, the decreased volume of IV fluid can be calculated based on the volume of the infused fluid. However, this method is vulnerable to a patient’s movement because of the characteristics of the load cell.
Previous studies have established many approaches to determine the appropriate communication method that can be used to connect the proposed technique to the network in order to send information. A monitoring system based on an Internet of Things (IoT) system can prevent unnecessary contact between medical staff and patients and alleviate the former’s workload [
11]. With IoT-based systems, the IV infusion rate can be monitored, the flow rate can be calculated, the remaining infusion time can be determined, monitored data can be sent to mobile devices, and a notification can be sent before the IV fluid is depleted. Several approaches have been reported based on the use of IoT to monitor IV infusion. Radio frequency identification (RFID) technology is used to send acquired data to nursing stations (NSs) [
12]. However, RFID has limitations in terms of the reading range, which is around 3 m [
13]. Bluetooth has also been used to send data to NSs [
14]. Bluetooth has the advantage of low-power consumption, but it is hampered by its short-coverage range (within 10 m at a frequency of 2.4 GHz), which is still too low to allow communication between NSs and devices [
15]. Wi-Fi has advantages of low-power consumption and long coverage (100 m), despite the external interferences (frequency: 2.4 GHz) [
16]. Recently, a Wi-Fi network for an IV infusion monitoring system was suggested based on the use of only one sensor [
17]. This was achieved with Wi-Fi’s advantages of strong security and long transmission distances. Generally, a patient room’s area is <10
, and the distance between the room and the NS is <100 m. Thus, the distance of transmission is adequate to communicate with the server via Wi-Fi, particularly when taking its strong security profile into consideration.
It is important to monitor patients not only when they are lying down in bed but also when they are exercising. The walking ward is the most common way to exercise for a fast recovery. Therefore, we considered a patient who is exercising in order to recover and proposed to apply both photosensors and load cells in a portable form to monitor the patient’s IV fluid and send notifications to the NS using IoT technology. To highlight the significance of our study, we compared our method with a previous study’s reconstructed method. Thus, we presented an improved method to monitor the IV fluid of patients, alleviating the workload of medical staff and improving the accuracy of treatment.
2. Design Method
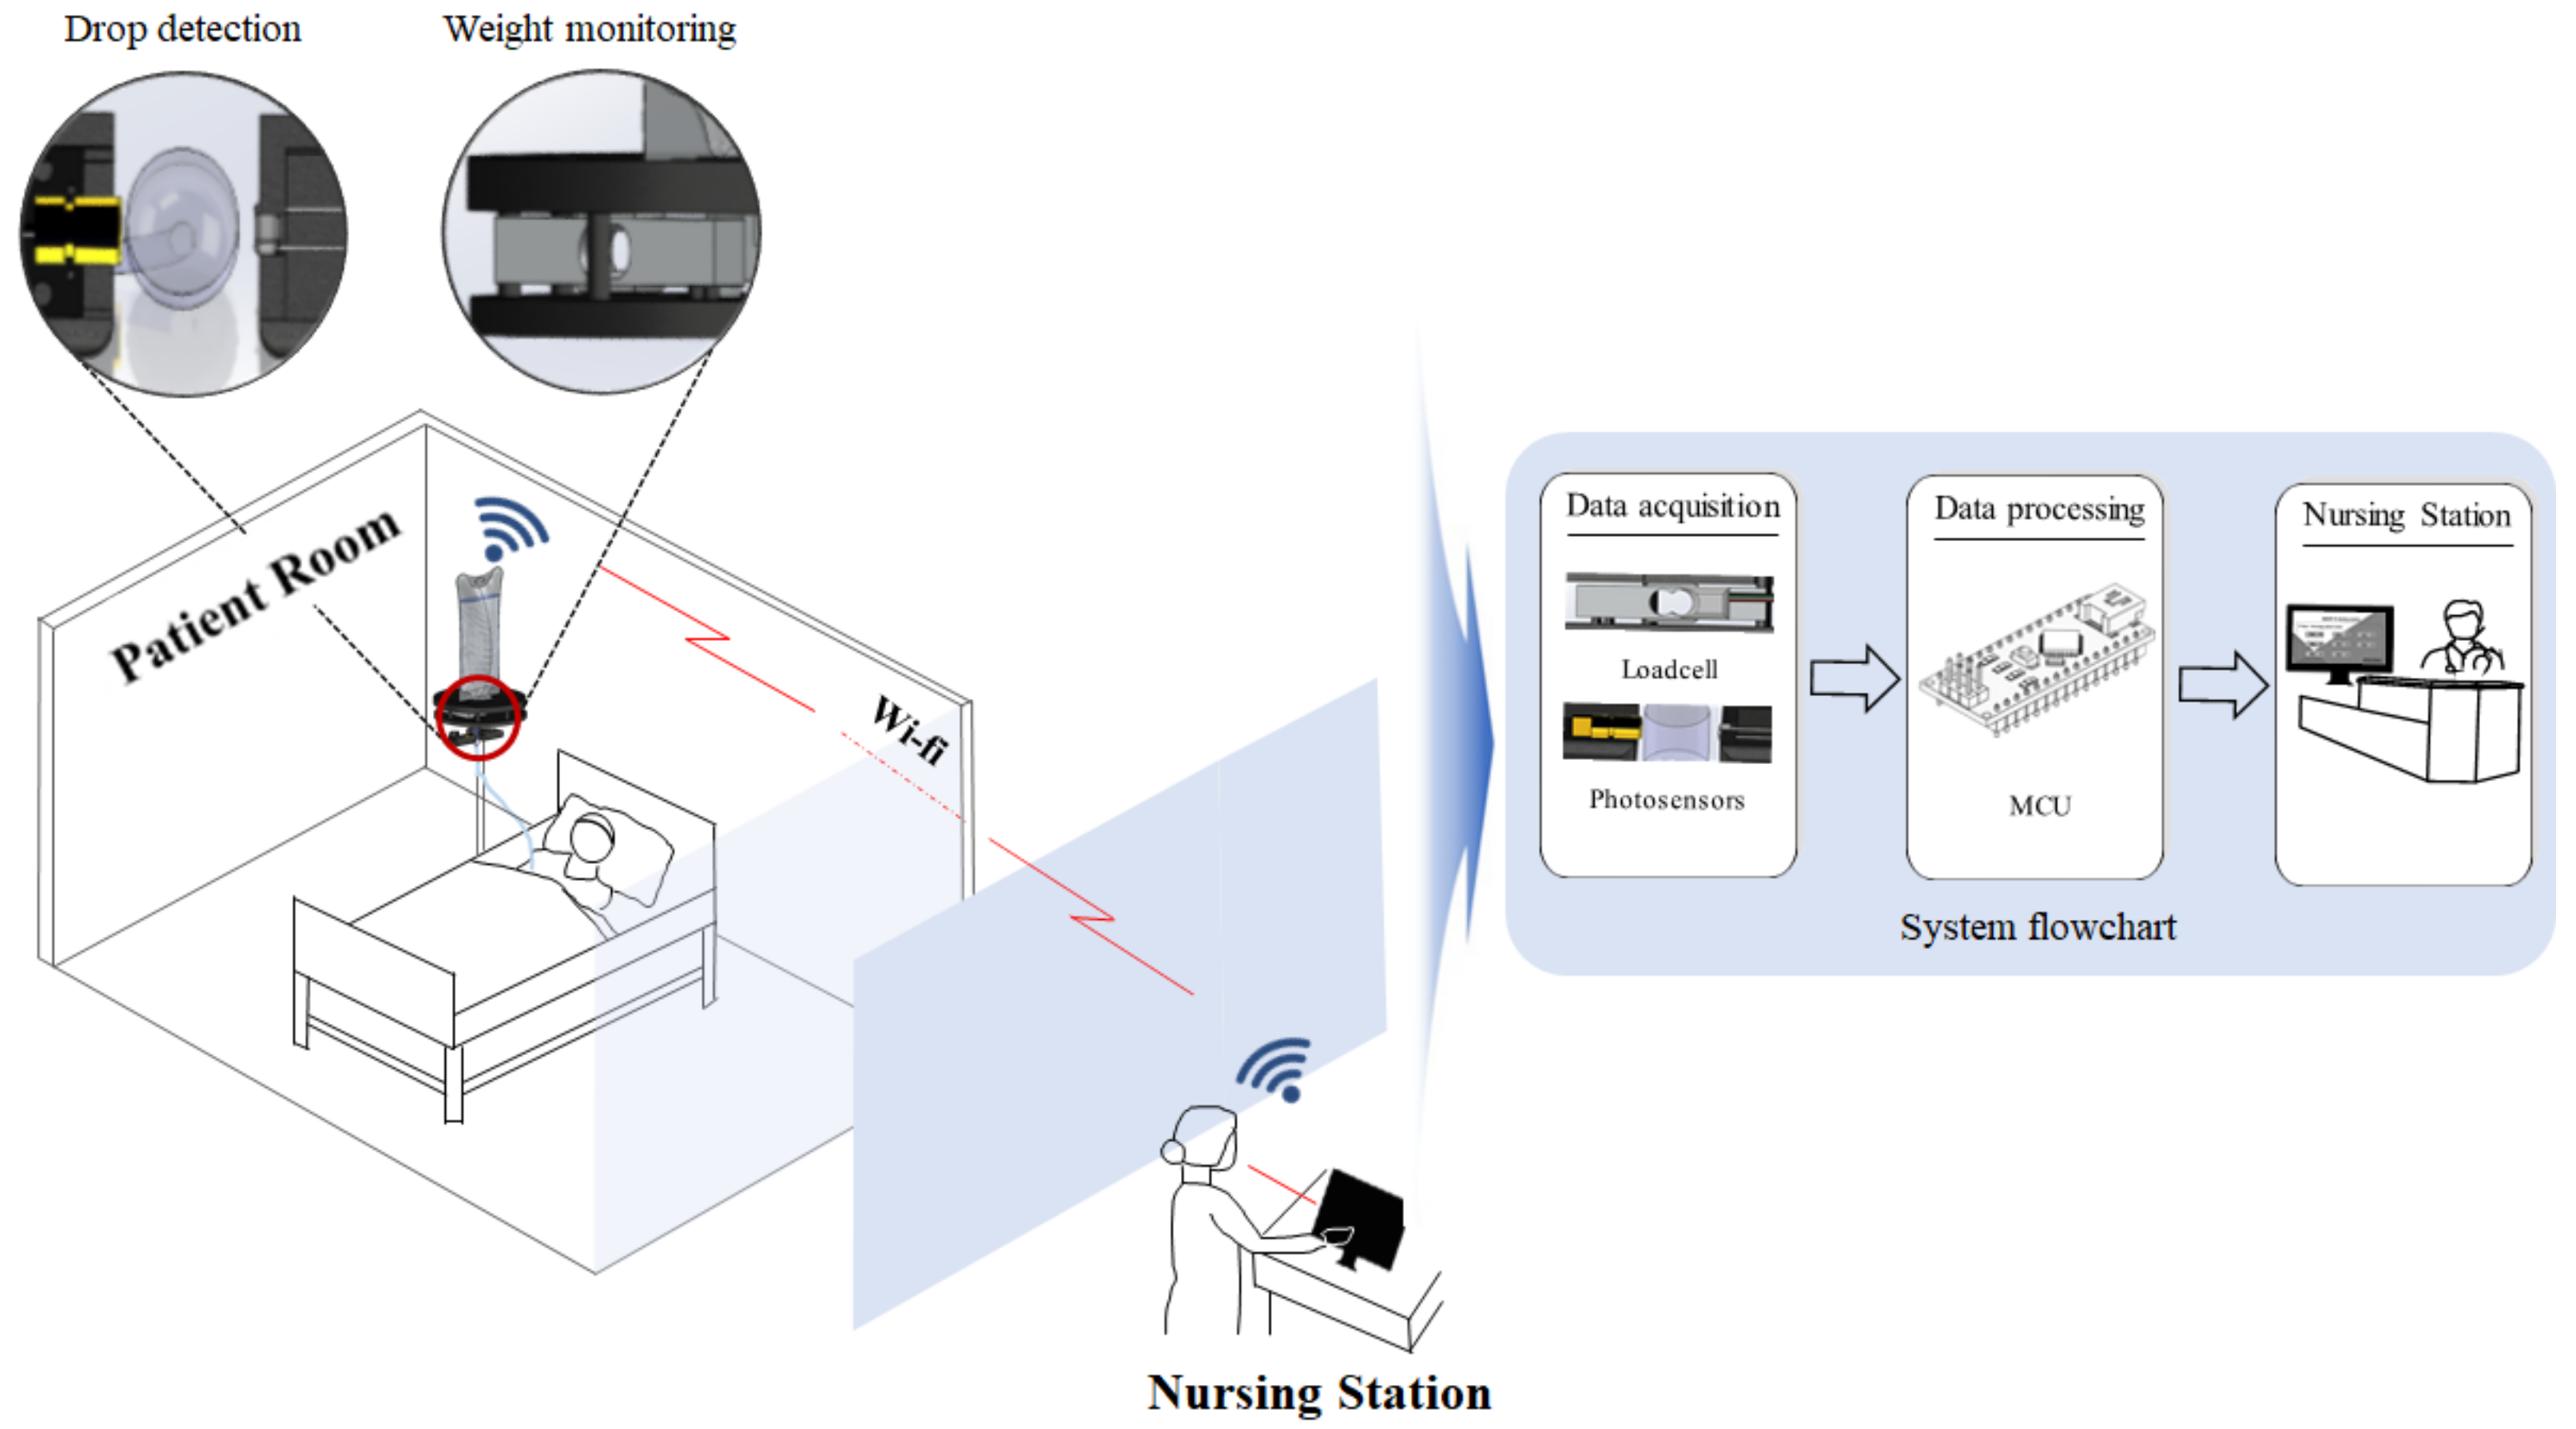
The proposed miniaturized IV detection and monitoring system consists of a load cell and photosensor, as shown in
Figure 1. As shown in the figure, the load cell consistently monitors changes in the IV fluid’s volume. It can display the amount of infused IV fluid, as the laser module and photoresistor count the drops of IV fluid. This can improve the accuracy of monitoring and provide increased resistance against external interferences.
Immediately after the micro controller unit processes the data, all the information on the infused IV fluid is sent via Wi-Fi to the NS’s mobile devices. By using dedicated applications, medical staff can monitor a patient’s IV infusion rate in real time. Each sensor is attached to one body.
The red laser module emits a broad range of wavelengths with the peak power occurring at 650 nm, as shown in
Figure 2 (minimum wavelength: 640 nm and maximum wavelength: 670 nm). This laser module has a narrow beamwidth of 5 mrad, which is able to accurately detect the fluid drops [
18]. The laser has its own beam size, which was 5 mm in this study. The volume of each drop is approximately 1 mL [
19]. This means that the drops fall within the laser module’s coverage range. Additionally, the photoresistor has a high sensitivity in the range of 600–700 nm, in order to detect light at a specific wavelength. An experiment was conducted to prove that these concepts work. The irradiated and received powers were measured from the saline drop captured in the chamber. The irradiation power from the laser module was 5.00 mW, and the received power, passing through the fluid chamber, was 4.04 mW.
To count each drop in the chamber, we divided the time period into segments T
1–T
4, as shown in
Figure 3. The photoresistor voltage outputs change according to the drops. T
1 represents the ideal voltage variation, while T
2 and T
3 denote real voltages. T
2 is the time interval required for the formed drop to fall. Voltage changes begin immediately after the drop is formed. This is because the drop reflects light, which screens the photoresistor. The larger the fluid drop (from the starting point of T
2 to T
21), the smaller the amplitude of the voltage. IV fluid drops continue forming from T
21 to T
22. After T
2, the voltage recovers to its initial value, which follows T
31, and is represented by T
3. T
4 represents the time during which the chamber is empty. Thus, T
1 after T
2 indicates the drop of a single droplet.
Figure 3 demonstrates this entire mechanism. Additionally, the load cell counts every loss in weight, which can be converted to determine the overall infused volume of IV fluid.
When light passes through a block, which comprises a homogeneous medium, it causes a loss of light, denoted by
. In this case, the proportionality constant represents absorption (
), loss of light (
), incident light (
), the thickness of the block (
), and the intensity of the penetrated light (
). We can represent these with the following equations based on the exponential law of absorption.
Thus, the coefficient of light absorption can be described as the equation relating medium and wavelength. The longer the wavelength of the light, the greater the absorption [
20]. Therefore, drops can absorb light from the laser, which can screen the photoresistor, thus causing a decrease in the pulse intensity. It is important to check whether the system is fully working or not. Thus, the spectrum of light should be in the visible range between 400 and 700 nm. For wavelengths > 650 nm, maximum absorption of light is manifested in the form of visible rays [
21].
Data collected from load cells can be converted to determine the volume of infused IV fluid according to Equation (6). The data obtained from the load cells of this system follow the equation listed below, where
denotes the initial weight,
denotes the current weight,
denotes the reduced weight, and
is the total volume.
Additionally, data from the photoresistor follow Equation (7). ECD represents every counted drop in the chamber, and
represents the volume of the fluid infused to the patient.
Equation (8) expresses the volume of the infused fluid per unit time, which is known and used in the medical field as
Gtt [
22]. The IV infusion rate can be expressed as a percentage using Equation (9), where
T,
, and
represent the total infusion time, initial volume of the fluid, and percentage of the residual volume of the fluid, respectively.
An abundant amount of information is provided to the NS and to the patient using the aforementioned equations which are applied to the system. Medical staff receive notifications through mobile devices before the IV fluid runs out. Notification guidelines can even be set before the onset of IV infusion, e.g., an alert can be sent if the remaining fluid volume is at less than 10%.
To apply the proposed system, its entire body was first designed. Thereafter, a three-dimensional printer was used to manufacture the entire body.
Figure 4 presents the entire design of the proposed system. All sensors are wired to a microcontroller. When the user starts the model, it begins to read data from each sensor. The laser continuously emits light at a wavelength of
to the photoresistor and sends the digital output to the serial monitor. If a drop falls, the output voltage reduces to a value under the threshold; accordingly, drops of the IV fluid can be counted. Counting continues until IV infusion ends. The load cell measures the weight of the fluid every 1 min, thus allowing the data to be converted to the infused fluid volume. Every 1 min, the system calculates the average infusion rate obtained by each sensor.
3. Results
Every material has its own refractive index. For temperatures below room temperature, the refractive indices of air, polyethylene terephthalate (PET), and saline (sodium chloride) are 1.000293 [
23], 1.5750 [
24], and 1.544 [
25], respectively. IV chambers are primarily composed of PET according to the International Organization for Standardization. To quantify the loss rate, a comparative experiment was conducted, as shown in
Figure 3. One of the two settings was executed without any saline drops. The procedures conducted are shown in
Figure 5.
Light from the laser passed from the (a) air to the chamber’s PET (
); (b) PET to air in the chamber (
); (c) air in the chamber to the chamber’s PET (
); (d) chamber’s PET to air (
) and to the photoresistor. At each step, light diminishes according to the characteristics of the medium. The loss rate is calculated according to Equation (10), which is based on Fresnel’s equations [
26].
represents the reflectance of light, and
and
are the refractive indices of each material.
The loss rate in the first experiment without saline was 14.68%. The other experiment was conducted with saline drops in the chamber. Light passed from the (a) air to the chamber’s PET (
); (b) PET to air in the chamber (
); (c) air in the chamber to saline (
); (d) saline to air in the chamber (
); (e) air in the chamber to the chamber’s PET (
); (f) the chamber’s PET to air (
) and to the photoresistor. The loss rate in the experiment with saline was 22.30%, indicating a difference of 7.62% compared to the case without saline drops. All the values recorded in each step are listed in
Table 1.
Figure 6a illustrates the experimental system. As shown in the figure, the test between each sensor and the developed system was conducted 10 times for 20 min. In the fluid chamber, the stored time for drop velocity was 2 s, while the time elapsed between the laser and photoresistor was 12 s, as shown in
Figure 6a. To draw a comparison between the proposed method and methods developed in previous studies, we considered a patient walking at a speed of
to aid recovery. We considered three cases for all methods. In the first case, we presumed that the device is located near the patient’s bed without any movement from the patient. In the second case, we presumed the patient to be walking on a slip-resistant pad, which causes horizontal motion. In the third case, we presume a shaking motion from left to right, which frequently occurs when moving about with monitoring devices.
Figure 6b shows comparative outcomes of the first case. The ideal value of
Gtt was
. The photoresistor yielded an average accuracy of 80%. Compared with the ideal
Gtt, the load cell yielded an average accuracy of 85%, and the proposed system yielded an accuracy of 88%. This system does not have any advantages over other sensors in static conditions. However, if movement is applied, i.e., in dynamic conditions, the accuracy of both sensors decreases considerably.
Figure 6c,d depict the comparative experimental results of the second and third cases. If movement is in a horizontal direction, the photodiode cannot accurately detect the dripping fluid due to its physical characteristics. Most drips fall vertically toward the ground irrespective of whether the system is in motion or not. Because of this reason, single photosensors experience difficulties in detecting drips. Moreover, the accuracy decreases to 52%, which is rather poor. Furthermore, if movement is added in a vertical direction, the load cell bounces up and down, thereby yielding unreliable results, which disrupts the weighing process of the IV fluid and its accuracy. While the single-sensor experiments also yielded poor results, the developed system yielded good accuracy. The former yielded an accuracy of 89.9% and the latter an accuracy of 87.9%.
Communication between the hardware and the application is facilitated through Wi-Fi. Medical staff can monitor the application on their own mobile devices, as shown in
Figure 7a. The application shows the currently infused IV fluid volume and the elapsed time. Additionally, it can calculate and show the
Gtt value, which is the term more frequently used in the field. Furthermore, it can send notifications to mobile devices (e.g., it can send an alert if the IV fluid volume is under 10%) while the app is running.
Figure 7b presents an image of a notification and a summary of patient information.
Notifications to the NS or alerts sent to the mobile devices of medical staff can help prevent over- or under-infusion cases and uneven flow [
27]. The developed system can help alleviate the workload of medical staff, prevent unexpected infections, and aid future telemedicine applications. Thus, it is expected that this system will help both patients and medical staff.
4. Discussion and Conclusions
This paper proposed a multisensor system that can compensate for each individual sensor. The entire system included a main body, an IV fluid hanger, hardware, firmware for the hardware, and a mobile device application. Even though the developed system yielded good accuracy, communication via Wi-Fi showed characteristics of latency. In its current form, it cannot be used for practical applications. Thus, additional studies using 4G or 5G networks are required, as these networks have low latencies of approximately 20 ms that allow the entire system to be connected to a cloud server, thus establishing the basis for telemedicine applications. Although a complete set of comparative tests was conducted under the same dynamic conditions, a device that generates consistent movement is required to quantify the entire dataset. It was challenging to quantify the accuracy of the load cell during motion. The value obtained from the load cell during motion was affected by considerable bouncing motions, which could not be adequately accounted for. The cost of the entire system is lower than that of available products in the market; however, the cost of sensors is high. This implies that adopting artificial intelligence (e.g., deep learning or machine learning) in medicine and healthcare [
28] can help achieve another breakthrough.
This study tested single-sensor systems that have been used in previous studies and have exhibited nonoptimal characteristics under dynamic conditions. The proposed system was tested under dynamic conditions and yielded an average accuracy of 88%. Furthermore, a 94% accuracy in alert notifications was obtained when the fluid volume was less than 10%. The entire system can be used under both static and dynamic conditions. Its ability to be connected to the medical staff’s mobile devices in NSs justifies its versatility. All intended purposes were achieved through the precise development of the entire system. This system can send notifications with high accuracy to prevent the backflow of blood. Furthermore, it can help medical staff and prevent unwanted infections, which is particularly important in pandemic situations such as the ongoing COVID-19 pandemic. The use of the proposed system will improve the experiences of patients and medical staff. Furthermore, the use of IoT in the medical field will help expand the range of telemedicine applications.
With the rapidly increasing number of inpatients owing to COVID-19, there is a high possibility of malpractice, errors, and accidents. Most medical staff members are still manually calculating Gtt values to monitor whether the infusion was set as advised or not. However, interobserver drop/min count rate variability can occur. Accordingly, an automated and accurate monitoring system is necessary. This study suggests a system that can prevent possible accidents related to IV infusion therapy, which is the most common treatment in hospitals. This study was conducted based on the demand for remote monitoring systems that can benefit both patients and medical staff. Additionally, in cases where there is a lack of medical staff to treat patients, particularly in rural areas, this remote system can help alleviate the workloads of the available medical staff members. In conclusion, the proposed system can help hospitals avoid severe accidents during IV therapy and can reduce concerns among medical staff and patients, resulting in increased service efficiency.


